 Logan S. Billet
 David K. Skelly
94% of researchers rate our articles as excellent or good
Learn more about the work of our research integrity team to safeguard the quality of each article we publish.
Find out more
ORIGINAL RESEARCH article
Front. Amphib. Reptile Sci., 26 March 2025
Sec. Physiology and Health
Volume 3 - 2025 | https://doi.org/10.3389/famrs.2025.1529060
Amphibians exhibit diverse responses to environmental challenges, but their responses to infection risk remain poorly understood. This study investigates how the presence of ranavirus, a deadly viral pathogen, affects growth, development, and resource allocation in wood frog (Rana sylvatica [Lithobates sylvaticus]) tadpoles. Using three years of pond survey data from a wood frog metapopulation in northeastern Connecticut, USA, we compared tadpole physiological rates across three scenarios: ranavirus-free ponds, ponds with sustained ranavirus infection, and ponds experiencing ranavirus die-offs. In ranavirus-positive ponds, tadpoles exhibited increased growth and resource allocation early in their development. These differences waned following die-off events in some ponds but persisted where widescale infection did not lead to die-off. This study provides evidence that an important disease agent appears to induce growth and developmental responses in its host that may help tadpoles survive severe infection by providing a buffer against the associated energetic demands. Alternative hypotheses, such as size-biased mortality, should be evaluated in experiments aimed at evaluating underlying mechanisms.
Animals display diverse responses to perceived risks and environmental challenges, ranging from simple behavioral shifts to more complex physiological and morphological adjustments (Bourdeau and Johansson, 2012; Weinstein et al., 2018; Gaynor et al., 2019). These responses are often adaptive, reducing net fitness consequences in the face of costly challenges and environmental heterogeneity while also incurring costs and tradeoffs of their own (Werner et al., 1983; Skelly, 1992; DeWitt et al., 1998; Auld et al., 2010). Infection is one of the most pervasive ecological risks – an estimated 50% of species are parasitic, and virtually all animals are infected by at least one parasite species (Dobson et al., 2008; Poulin, 2014). In response to pressure from parasites, organisms have evolved anti-parasite strategies that mitigate the often severe fitness costs of infection. While much work on anti-parasite strategies has focused on the costs and efficacy of immune responses following infection, it is becoming increasingly clear that, like anti-predator responses, the risk of infection can invoke a diversity of responses that allow hosts to avoid, prepare for, and respond to infection (Koprivnikar et al., 2006; Daly and Johnson, 2011; Rakus et al., 2017). Revealing the diversity of anti-parasite strategies and the ecological ramifications of these strategies is critical for a comprehensive understanding of the impacts of parasites and pathogens on hosts in an era of accelerated disease emergence and spread (Jones et al., 2008).
Host responses to infection risk can be broadly categorized into avoidance mechanisms and preparatory responses. While avoidance behaviors, such as evading contaminated areas or infected conspecifics, can be effective (Ezenwa, 2004; Koprivnikar et al., 2006; Behringer et al., 2018), avoidance behaviors may be difficult or relatively ineffective in many situations (e.g., high parasite pressure or immobile host). However, in response to cues released from parasites in the environment or from infected conspecifics, hosts may also induce behavioral, immunological, and physiological responses that help them prepare for or avoid infection. For example, exposure to infection cues can cause snails to initiate terminal investment before infection occurs, and other organisms may respond to infection cues by increasing foraging rates and/or shifting diets to boost energy reserves, accelerating development to escape a risky environment, or upregulating immune genes (Thornhill et al., 1986; Warne et al., 2011; Altizer et al., 2018; Mondet et al., 2021). Responses induced by visual and chemical cues from certain threat classes, such as predators, are well documented; for most disease agents, however, and particularly microparasites (i.e., viruses, bacteria, fungi), we know little about preparatory host responses to infection cues.
Amphibian larvae have long been a model for understanding organismal plasticity and compensatory responses to environmental challenges. Growth and development, in particular, are highly plastic and responsive to environmental conditions, often requiring tradeoffs between increasing size at metamorphosis and mitigating exposure to risks (Wilbur and Collins, 1973; Werner, 1986; Skelly and Werner, 1990; Van Buskirk and Relyea, 1998). In response to environmental challenges such as predation, competition, and desiccation, larvae may shift growth and development rates, among other responses, to enhance their survival probability. However, risk of infection has largely been ignored when considering the plasticity of growth and development of larval amphibians (Figure 1). This is despite the fact that larval amphibians host numerous parasites and pathogens, including ranaviruses, that can cause severe pathology and population declines (Bienentreu and Lesbarrères, 2020).
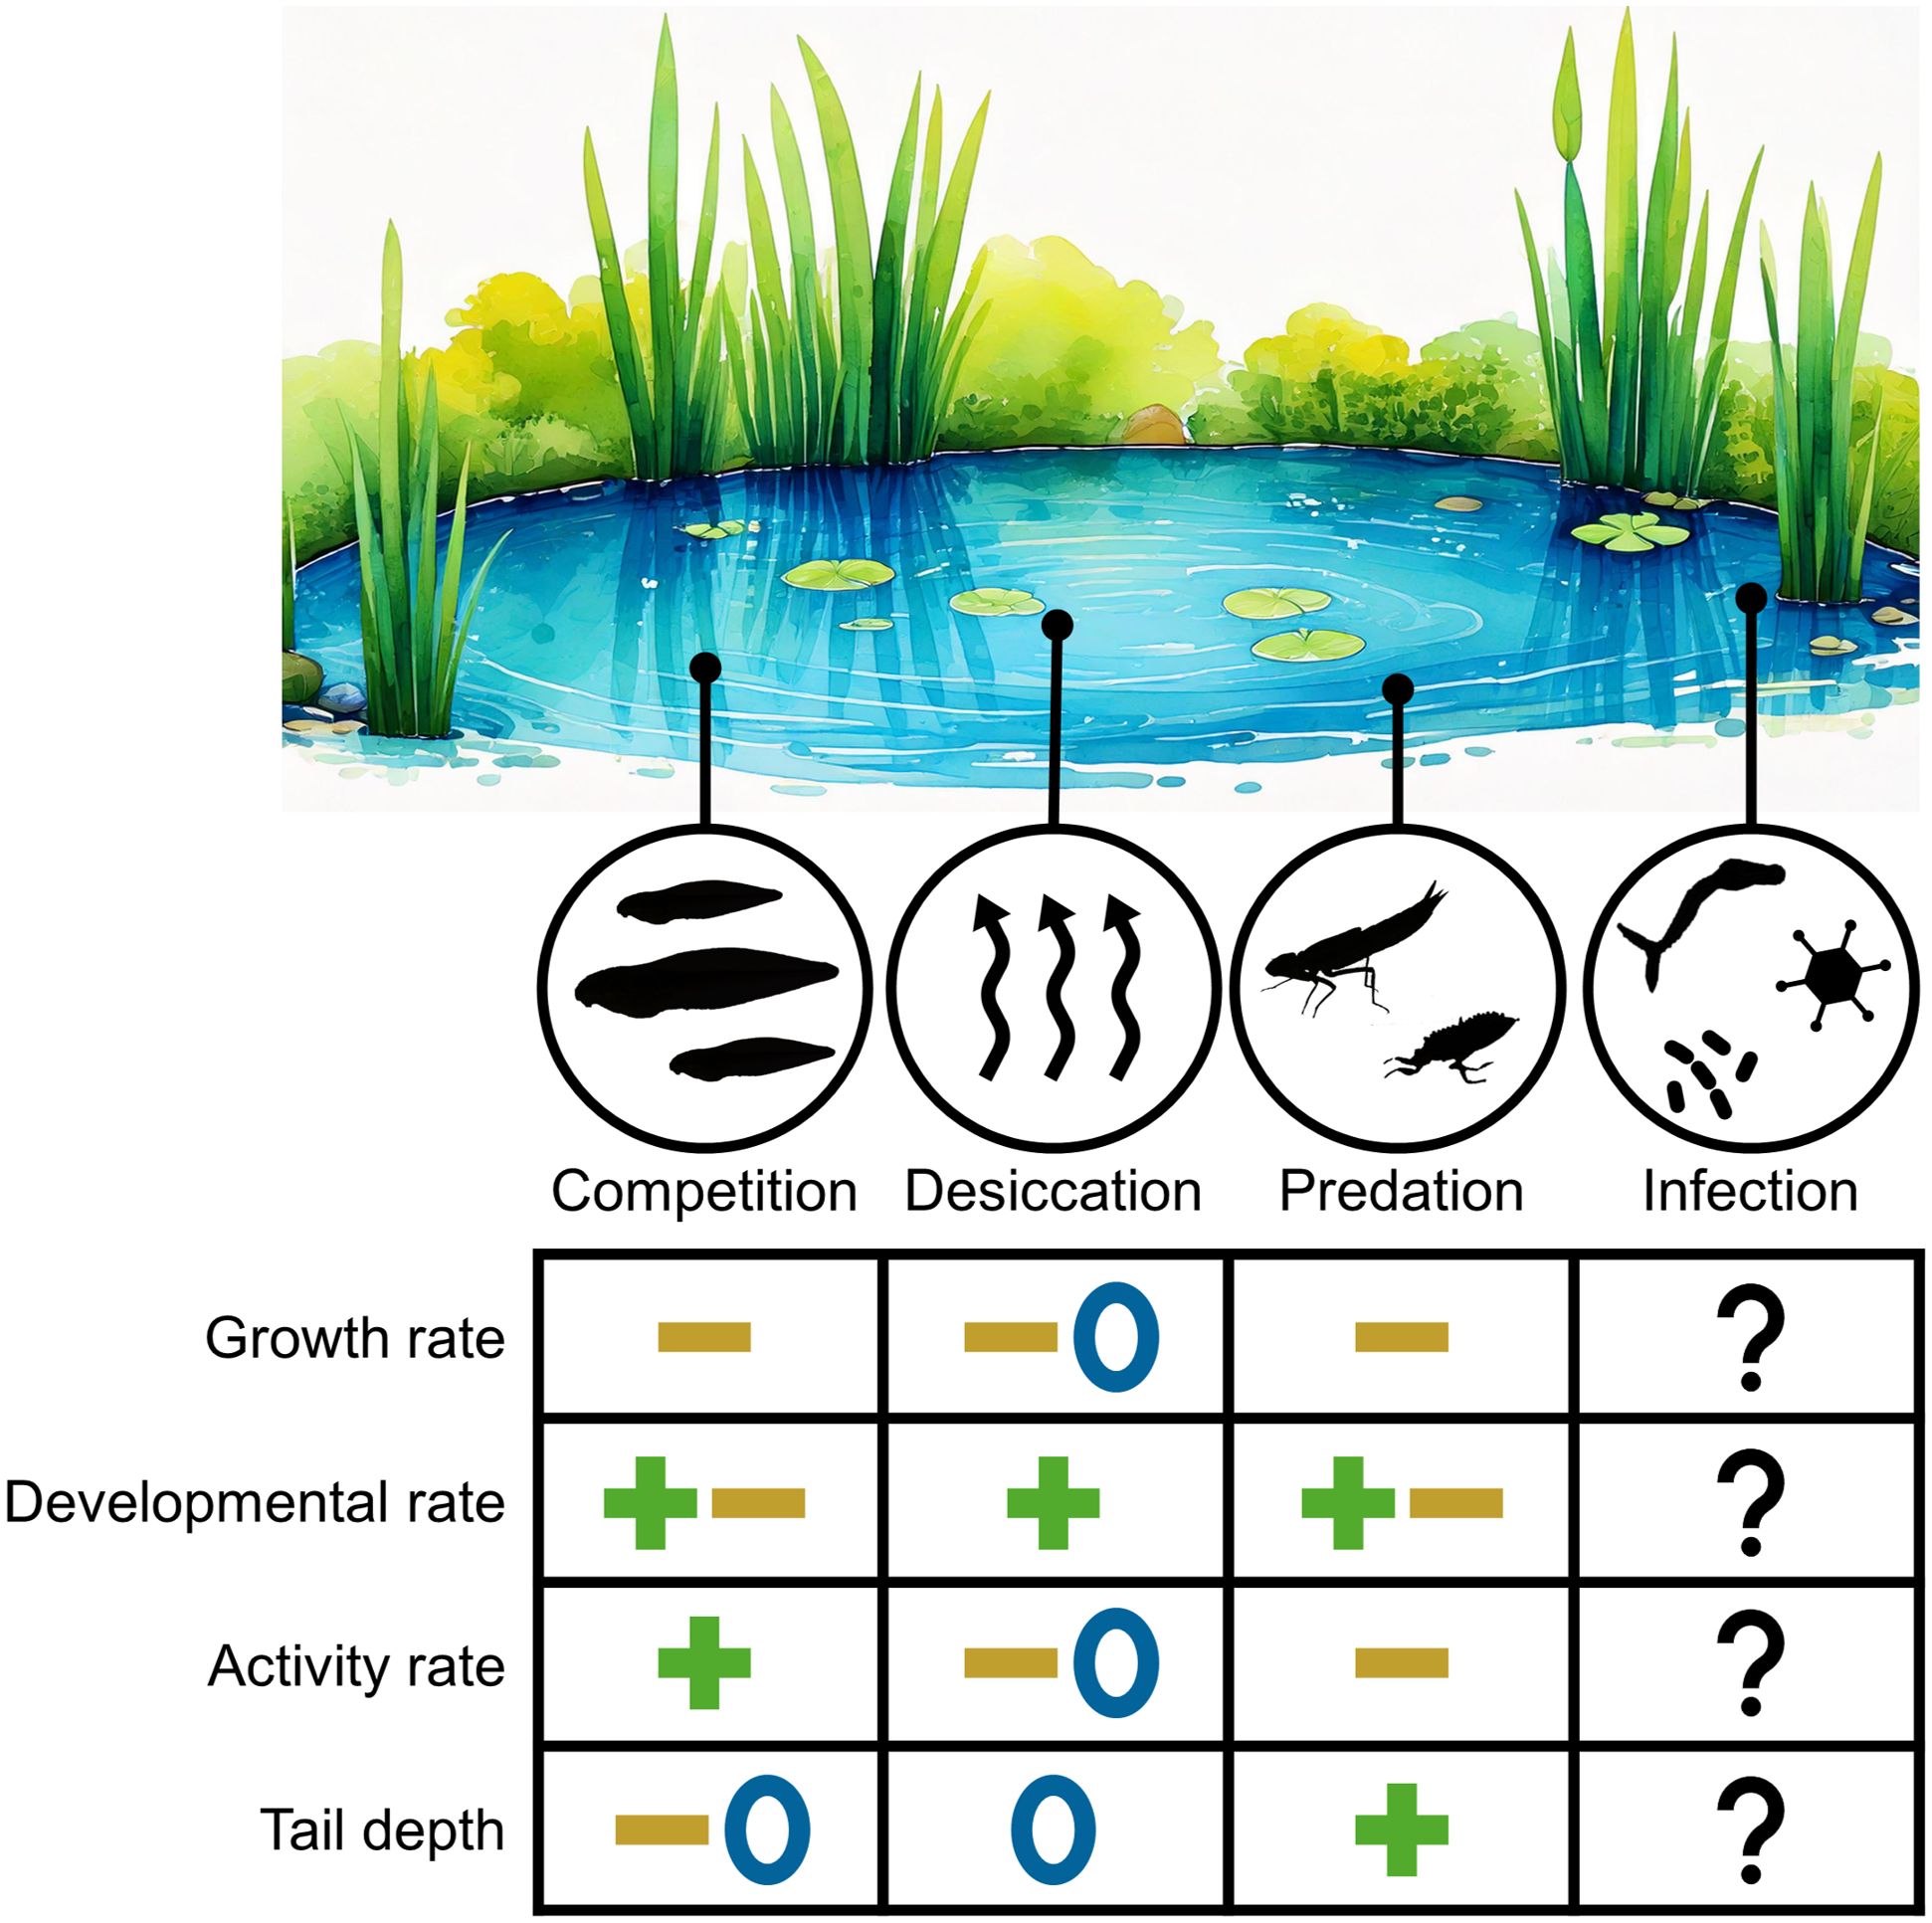
Figure 1. Larval amphibian responses induced by four major threats: competition, desiccation, predation, and infection. The patterns shown represent simplified responses for four key traits, though the strength and direction of these responses are often context-dependent. Responses are generalized as increased (plus symbol), decreased (minus symbol), or unaffected (zero symbol) by the threat. This figure is not intended as an exhaustive review of tadpole responses to these threats but rather emphasizes the significant gap in our understanding of how larval amphibians respond to the risk of infection. Predator response patterns are reviewed by (Wellborn et al., 1996) and (Relyea, 2007). Competition response patterns are synthesized from (Barnett and Richardson, 2002; Relyea, 2002, 2004). Desiccation response patterns are synthesized from (Laurila and Kujasalo, 1999; Lane and Mahony, 2002). Pond artwork generated with the assistance of Adobe Firefly (Adobe, San Jose, CA USA).
Ranaviruses are common pathogens in North American amphibian communities and have been implicated in an estimated 40-60% of amphibian mass mortalities in the United States (Gray et al., 2009). Ranavirus epizootics can dramatically reduce tadpole populations, often leading to nearly 100% cohort mortality within 1-2 weeks (Wheelwright et al., 2014; Hall et al., 2018). However, despite the high susceptibility of many North American amphibians to ranaviruses in experimental settings, many populations persist in the presence of infection (Hoverman et al., 2012; O’Connor et al., 2016; Youker-Smith et al., 2018). We are only beginning to uncover mechanisms by which susceptible amphibian populations avoid, respond to, and persist in the presence of ranavirus infection, but there is growing evidence that amphibians and other taxa may detect and respond to infection in conspecifics and the surrounding environment (Sauer et al., 2019; Le Sage et al., 2022; Côté and Binning, 2025; Herczeg et al., 2024).
Experimental studies show evidence, to varying degrees, of growth and developmental responses associated with sublethal ranavirus infection, including reduced growth, weight decrease, and accelerated development (Echaubard et al., 2010; Warne et al., 2011; Wright et al., 2023). It is unclear, however, whether these sublethal responses to infection play out in a broad, repeatable manner in a field setting. It is also unclear if the presence of ranavirus-infected conspecifics results in observable differences in growth and development in individuals across populations. Life-history theory predicts there should be growth and developmental responses associated with an increased risk of mortality, and cues of infection in conspecifics could induce preparatory responses such as accelerated development (e.g., to escape a risky environment; Warne et al., 2011) or altered resource allocation to better tolerate severe infection. This could also occur through several other mechanisms, including reduced densities from virus-induced mortality, freeing resources and thus leading to greater growth and development rates or suppression of growth and development as a consequence of avoidance of infected conspecifics. Observational field studies are a powerful way to begin to identify what patterns of growth and development, if any, are associated with differing levels of ranavirus infection across larval amphibian populations, providing a foundation for ecologically relevant controlled experimental work necessary to clarify causative mechanisms (Werner, 1998).
In this study, we use three years of ranavirus survey data to begin to investigate how the presence of ranavirus is associated with growth, development, and resource allocation in wood frog (Rana sylvatica [Lithobates sylvaticus]) tadpoles. Wood frog larvae are highly susceptible to ranavirus, and ranavirus is common in wood frog breeding ponds (Hoverman et al., 2011; O’Connor et al., 2016), providing an excellent system to explore how larval amphibians respond to the presence of a deadly pathogen in their environment. We used snout-vent length measurements of wild-captured specimens collected at regular intervals to estimate rates of growth (size per unit time), development (developmental stages per unit time), and allocation (size change per developmental stage). We compare the body size and development of tadpoles collected from three distinct pond-wise ranavirus scenarios: 1) ponds free of ranavirus (“Uninfected”), 2) ponds with some ranavirus infection present (“Infected”), and 3) ponds with widespread ranavirus infection present that also experienced ranavirus die-off events (“Dieoff”). Our goal was to compare how ranavirus presence, as well as the severe infections that manifest across a population during a die-off, affect patterns of growth and development in wild tadpole populations. We predicted that early in epizootics (i.e., prior to die-offs), tadpoles in ponds with ranavirus present (i.e., Infected and Dieoff ponds) would accelerate development at the expense of reduced growth by shifting resource allocation in a response consistent with escaping a risky environment, resulting in smaller snout-vent lengths and higher Gosner stages prior to die-offs relative to tadpoles from Uninfected ponds. We also predicted that the onset of severe infections associated with ranavirus die-offs would reduce both the growth and developmental rates of survivors due to the costs of surviving an infection and the associated physiological damage, resulting in smaller snout-vent lengths and lower Gosner stages in Dieoff ponds after die-off events relative to Uninfected and Infected ponds. Because of the observational nature of these data, however, it is important to note that multiple causative pathways may lead to the same patterns.
Yale-Myers Forest (hereafter YMF) is a 3213 ha mixed hardwood forest in Northeastern CT, USA (Figure 2A). We surveyed between 30 and 40 fishless, ephemeral ponds at YMF for ranavirus epizootics from 2021-2023. Each pond is a breeding site for wood frogs, explosive breeders that arrive at ponds soon after spring snowmelt and reproduce within a few days. Wood frog larvae comprise the bulk of vertebrate biomass in these ponds from April to July. Wood frog larvae are highly susceptible to ranavirus; experimental exposures often cause nearly 100% mortality, and reports of ranavirus-induced die-offs are common (Hoverman et al., 2011; Wheelwright et al., 2014; Hall et al., 2018; Miaud et al., 2019). Symptoms of infection include lethargy, edema, abnormal swimming, internal bleeding, and cessation of feeding (Gray et al., 2009) (Figures 2C, D).
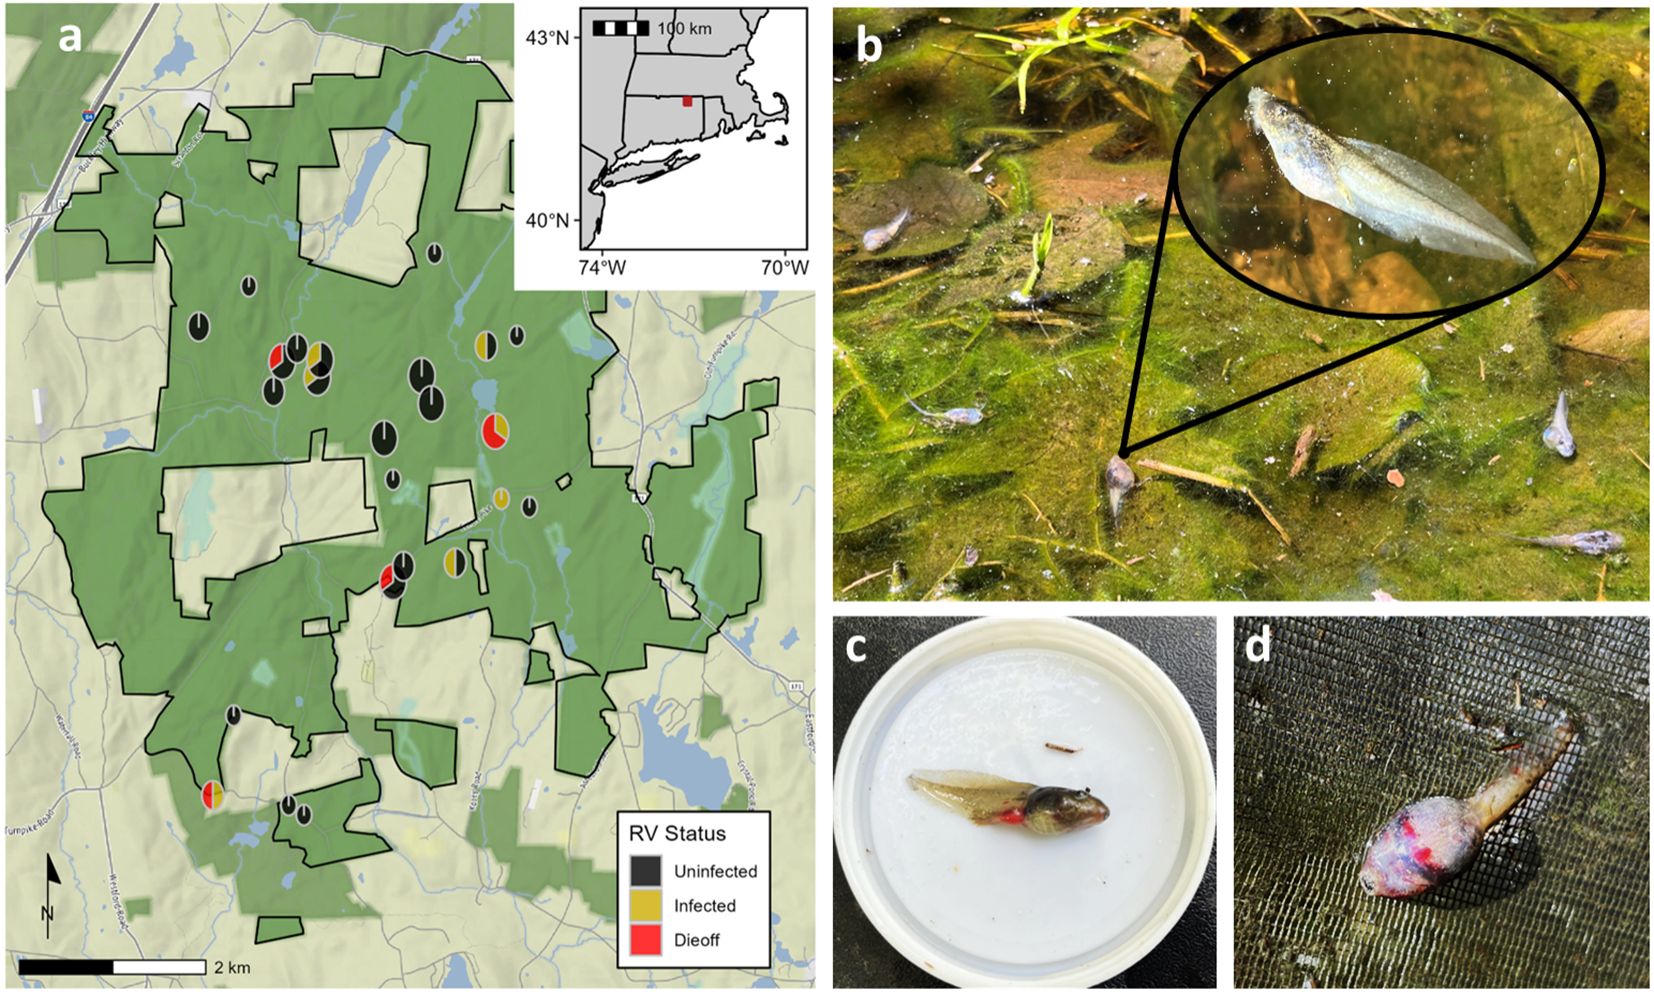
Figure 2. (A) Locations and yearly ranavirus infection statuses of the 24 ponds surveyed for ranavirus epizootics from April through July 2021 - 2023 at the Yale-Myers Forest (3213 ha; outlined, green-shaded area) in northeastern Connecticut, USA (inset map). Pie chart size indicates the number of years a pond was included in this study (Small = 1 yr; Medium = 2 yrs; Large = 3 yrs). Pie chart sections represent the number of years a pond was in each state (Uninfected, Infected, or Dieoff). (B) Dead and dying wood frog tadpoles floating near the surface of a pond during a ranavirus die-off event. Redness in (C) the legs and (D) the body cavity of dead tadpoles caused by hemorrhaging during a ranavirus die-off.
Ranavirus surveys spanned ~mid-April to mid-July each year, during which we sampled each pond at least once every two weeks. At each visit, we collected up to 20 live wood frog tadpoles via timed dip net surveys with durations based on estimated pond area (m2) and estimated tadpole density per unit effort (Werner et al., 2007). We humanely euthanized tadpoles in a 10% ethanol solution and then preserved them in 95% ethanol. We also recorded the presence of other tadpole predators. A HOBO temperature logger (Onset Computer Corporation, Bourne, MA USA) was affixed near the deepest point of each pond and suspended 10 cm below the surface to monitor water temperature at 1-hour intervals. We also visited each pond weekly to perform a visual encounter survey of carcasses to monitor for mortalities (Gray et al., 2015). In most instances, die-offs are conspicuous with abundant carcasses, but carcasses can disappear quickly, making frequent visits necessary to detect all die-offs (Figure 2B). Following Hall et al. (2018), we considered the detection of ≥ 5 amphibian carcasses to be the start of a die-off. We sanitized equipment with a 2% Nolvasan (Zoetis, Parsippany, NJ, USA) solution to prevent disease transmission between sites.
We used measurements of the wild-captured wood frog larvae to estimate growth and development rates. We used individual measurements of unique individuals in a pond cohort rather than repeated measurements of the same tadpoles because ranavirus testing requires destructive sampling, and mark-recapture with wild tadpoles at this scale is impractical. Nonetheless, this method provides a reasonable proxy for individual growth and development - wood frogs are explosive, synchronous breeders, so most larvae in a cohort follow a very similar trajectory of growth and development. We note, however, that although we made efforts to minimize bias during sampling, there is the potential for biases in our sample, for example, if sick individuals were more or less easily captured than healthy individuals or if smaller or larger animals were more likely to be infected by and die from ranavirus infections. Each larva was assigned a developmental stage (Gosner, 1960) and measured (snout-vent length [SVL] and total length [TL]) using digital calipers to the nearest 0.01 mm (Mitutoyo, Aurora, IL, USA).
For pond-years (i.e., samples from a single pond in a single year) with adequate samples, we assessed ranavirus infection in ≥ 10 larvae from each of ≥ three time points. This sample size gives a ~72% probability of detecting at least one infection at ≥ two time points for prevalence ≥ 10% and a ~97% probability for prevalence ≥ 20%. Testing ten individuals across three time points provides a reasonably high likelihood of detecting sustained infection in a given pond-year, as ranavirus infection prevalence tends to remain stable/increase over time in larval wood frog populations (Hall et al., 2018).
We dissected liver tissue from each tadpole using forceps sterilized in a 50% bleach solution and extracted DNA using Qiagen DNeasy Blood & Tissue Kits (Qiagen, Hilden, Germany). We also included extraction negative controls to detect any potential contamination from equipment.
To determine the viral load of samples, we used quantitative polymerase chain reaction (qPCR) primers and a fluorescent probe from Leung et al. (2017), which target a 97-bp region of the ranavirus major capsid protein. Each 20 uL reaction contained 2 μL template DNA, 2.0 μL forward primer (10 μM), 2.0 μL reverse primer (10 μM), 0.05 μL FAM-labeled fluorescent probe (100 μM), 10.0 μL SsoAdvanced™ Universal Probes Supermix (Bio-Rad Laboratories, Hercules, CA, USA) and 5.95 μL nanopure water. Each qPCR plate included a standard dilution series (2.79 × 10⁶ - 2.79 × 101) using a 350 bp synthetic gBlock (IDT, Coralville, IA USA) gene fragment of the major capsid protein gene and a negative control. Each control, standard curve, and unknown sample was run in duplicate on a 96-well qPCR plate on a CFX Connect™ (Bio-Rad Laboratories) with cycling conditions consisting of 98°C for 3 min followed by 40 cycles of 98°C for 15 s and 60°C for 45 s, with a plate read at the end of each cycle.
Viral quantities for positive samples were averaged across the duplicate wells. All duplicate unknown samples that peaked before cycle 40 were considered positive. In cases where there were discrepancies between duplicates, a third reaction was run and if the third reaction amplified, the sample was considered positive. We calculated viral load as viral copies per ng DNA in the sample, measured using a NanoDrop 2000c (Thermo Fisher Scientific, Waltham, MA, USA).
All statistical analyses were performed in R version 4.3.2 (R Core Team, 2023).
We estimated the relationship between ranavirus status at the pond level and tadpole growth and development by categorizing each pond-year as no/low ranavirus (“Uninfected”), sustained ranavirus infection without a die-off (“Infected”), and sustained ranavirus infection with a die-off event (“Dieoff”). All tadpoles collected from pond-years with ranavirus detected in tissue at ≤ 1 sampling session were classified as Uninfected. All tadpoles collected from pond-years with ranavirus detected in tissue at ≥ 2 sampling sessions without a ranavirus die-off event were classified as Infected. All tadpoles collected from pond-years where a ranavirus die-off event occurred were classified as Dieoff. Within the Uninfected category, we filtered out samples from pond-years with low certainty of ranavirus status by excluding pond years where 1) ranavirus infection was assessed at < 3 time points or 2) < 20 total animals were tested for ranavirus infection. Within the Dieoff category, we excluded samples from pond-years where no tadpoles were collected after the die-off event (e.g., complete mortality event, pond drying, occurrence close to metamorphosis, etc.). Based on these criteria, 49 pond-years were excluded from the Uninfected category and seven pond-years were excluded from the Dieoff category. The majority of pond-years excluded from the Uninfected category had few or no tadpoles due to low/no breeding effort, egg predation, or early pond drying.
Tadpole development can be divided into four phases (Gosner, 1960): embryo (Gosner stages ~1-19), hatchling (Gosner stages ~20-24), larva (Gosner stages ~25-42), and metamorph (stages ~43-46). We restricted our analyses to observations from Gosner stages 25-42 (i.e., the larval phase), as we were focused specifically on how ranavirus affects larvae prior to metamorphosis. We also restricted our analyses to observations from day-of-year (DOY) 121-196 (1 May - 15 July), as most ponds did not have free-swimming larvae outside of this window. After filtering, we were left with 3077 samples from 35 pond-years in Uninfected, 534 samples from seven pond-years for Infected, and 688 samples from 5 pond-years for Dieoff (N = 4299; Table 1).

Table 1. Sample summary for each of the three pond-level ranavirus status categories.
The goal of our analyses was to determine whether pond-level ranavirus status influences tadpole growth, development, and allocation rates while accounting for other influential covariates. These analyses were guided by hypotheses regarding the mechanisms by which ranavirus presence may alter these physiological rates. Specifically, we hypothesized that ranavirus presence would accelerate development at the expense of growth, reflecting a trade-off driven by the risk of infection. Further, we hypothesized that the occurrence of the severe infection loads associated with die-offs would severely impact the physiological rates of tadpoles and reduce growth and development. To do this, we used generalized additive models (GAMs; mgcv package; Wood, 2011). We selected GAMs over generalized linear models (GLMs) because tadpole growth and development rates are typically non-linear (Wilbur and Collins, 1973), and GAMs allow for flexible modeling of these non-linear relationships through the use of smooth terms, which better capture the complexity of biological processes.
For the GAM used to assess the effects of pond-level ranavirus status on growth rates, our response variable was tadpole SVL. For the GAM used to assess the effects of pond-level ranavirus status on developmental rates, our response variable was Gosner developmental stage. In both models, our primary predictors were ranavirus status as a parametric effect and DOY as a smoother term. We also modeled the interaction between ranavirus status and DOY by stratifying the smoother for DOY based on ranavirus status, allowing us to assess how the effects of ranavirus status vary across time. The number of knots for DOY was restricted to four based on a priori knowledge of the general shape of tadpole growth and development curves over time and to prevent overfitting.
In the allocation model, our response variable was tadpole SVL, with ranavirus status as a parametric effect, developmental stage modeled as a smoother term (k = 4), and the interaction between ranavirus status and developmental stage by stratifying the smoother for developmental stage based on ranavirus status.
Many environmental factors can affect tadpole growth and development and could bias model estimates. All three models (growth, development, and allocation) included ecologically relevant covariates known to affect tadpole growth and development based on existing literature. We included the presence/absence of Ambystoma opacum (a voracious tadpole predator) as a parametric effect, as the presence of predators such as A. opacum can have density-mediated and trait-mediated effects on tadpole physiological rates (e.g.,Skelly and Werner, 1990; Peacor and Werner, 2001). We included a smoother term for conspecific density, which can affect physiological rates through density stress and resource competition (e.g., Semlitsch and Caldwell, 1982). We also included a smoother term for average pond temperature, as physiological rates of tadpoles are strongly affected by temperature (e.g., Berven et al., 1979). Additionally, we included pond and year as random intercepts. To assess model assumptions, including normality of residuals and overall model fit, we used the gam.check() function (mgcv package).
To visualize the effect of ranavirus status on tadpole growth, development, and allocation rates, we generated predictions using each GAM (predict() function). We calculated 95% confidence intervals for these predictions, extracted the conditional residuals from the original model, and calculated the adjusted values by adding these residuals to the marginal fit values. We plotted the smooths and residuals using ggplot2 (Wickham, 2016) and used the plot_difference() function (tidymv package; Coretta et al., 2023) to estimate and plot where smooths for the levels of ranavirus status significantly differed for each model.
Using temperature logger data for each pond-year, we calculated the average pond temperature as the average daily temperature in a pond from 1 May to 30 June, which captures most of the wood frog larval period. However, water temperature data was not recorded for some pond-years due to logger loss or equipment failure; in total, ~30% of the total daily water temperature data was missing. Therefore, we implemented a random forest model (randomForest; Liaw and Weiner, 2002) to impute the missing data (as in Arietta and Skelly, 2021) using a combination of climate variables and a local variable characterizing pond canopy cover. The random forest model fit well (mean out-of-bag R2 = 0.95) and had high predictive accuracy (RMSE = 1.0). We then used the model fit to all our observations to impute daily water temperature data. See Appendix S1 in Supplementary Material for full details.
Density surveys were not conducted on 34 occasions (14% of sampling events) in our analysis dataset. When surveys were missed due to early season hatchling clustering near the oviposition site (~76% of cases), we used density values from the following survey ~two weeks later. For surveys missed due to other reasons (e.g., rain, equipment failures; ~14% of cases), we estimated tadpole densities as the average from the nearest surveys before and after the missing session. If both neighboring surveys were unavailable, we used the density from the most recent survey.
A total of 1583 wood frog larvae were screened for ranavirus infection. Of those screened, 392 (24.8%) were ranavirus-positive; overall infection prevalence was 79.8%, 19.3%, and 1.5% in the Dieoff, Infected, and Uninfected groups, respectively (Table 1). Infection intensities of tadpoles in the Dieoff group (i.e., ponds with a ranavirus die-off event) showed a distinct spike in ranavirus infection intensities coincident with the die-off event. In contrast, infection intensities of positive individuals in both the Infected and Uninfected groups were almost uniformly low (Figure 3).
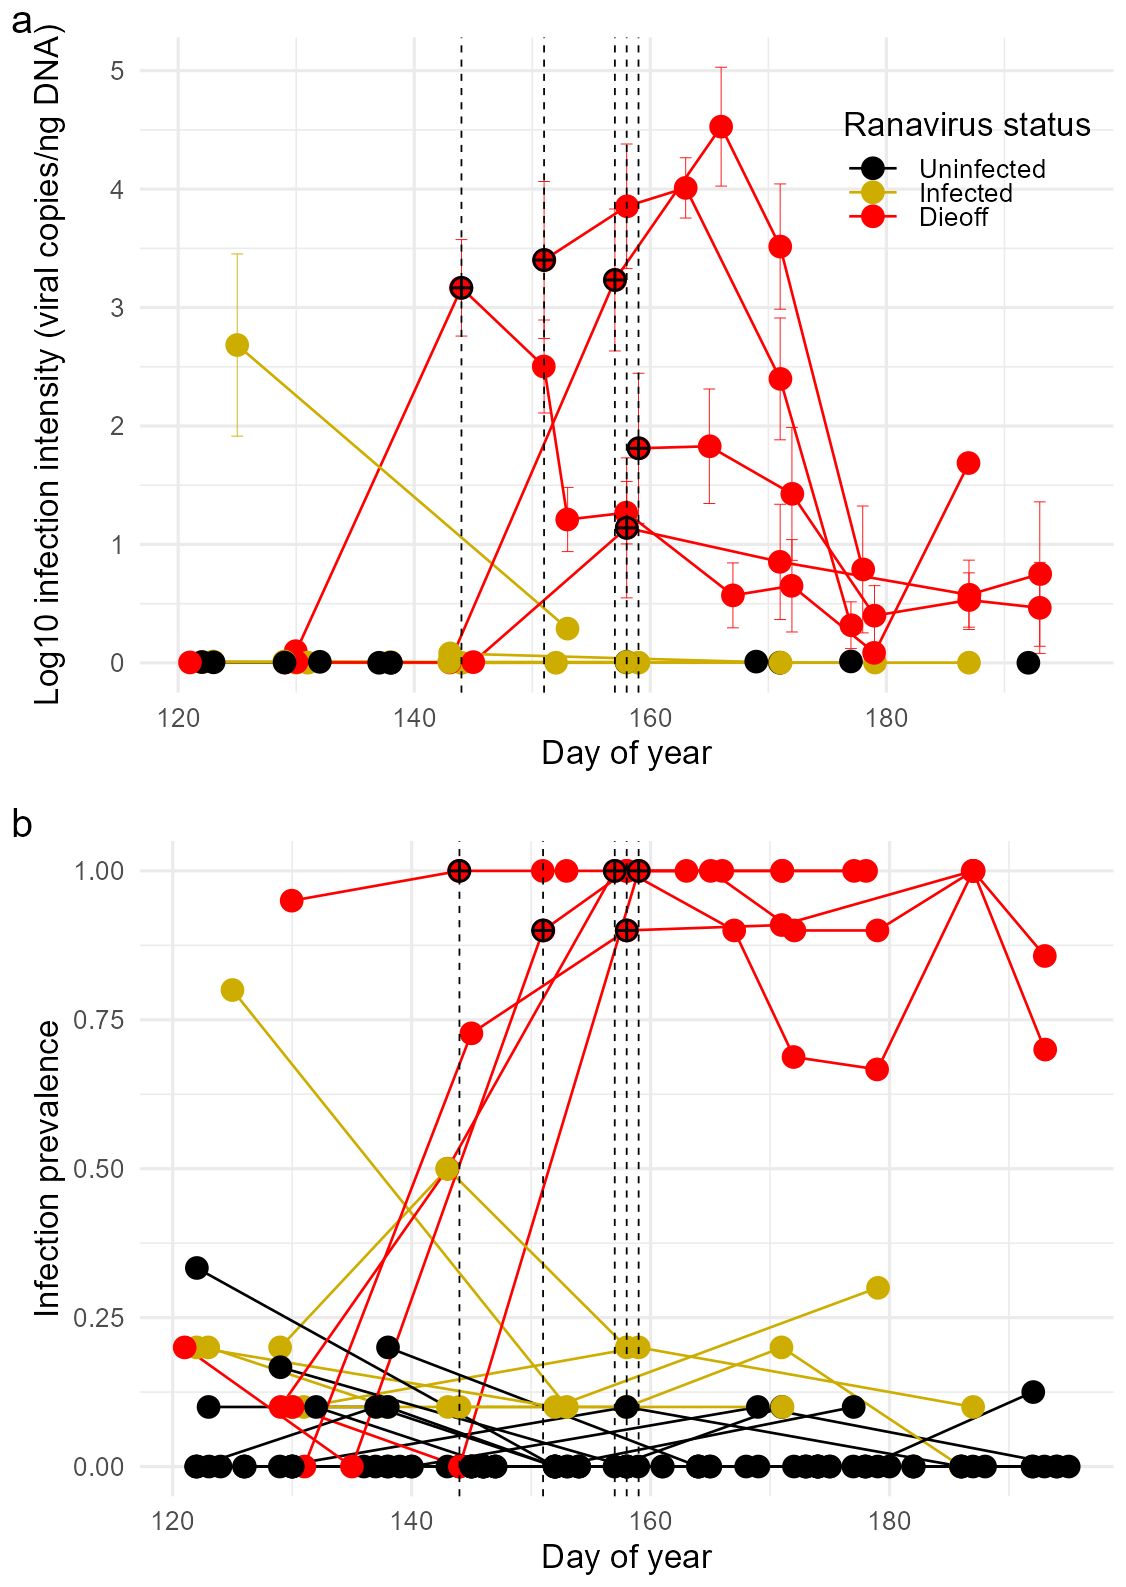
Figure 3. Temporal dynamics of (A) ranavirus infection intensity (± 1 SE) and (B) prevalence in larval wood frog populations. Each line represents an individual pond, and points represent the average value at individual sampling events. Ponds were grouped into three categories based on the absence of ranavirus (Uninfected; black), presence of ranavirus (Infected; yellow), or presence of ranavirus with a die-off event (Dieoff; red). Each vertical dashed line indicates the start of a die-off event, with crosshairs over the points where die-offs began as a visual aid. We added 1 to the average ranavirus infection intensities before log transforming.
For model summary tables, see Appendix S3 in Supplementary Material.
Average growth rate in the Uninfected group was 0.16 ± 0.013 SE mm/day over the entire larval period. Relative to tadpoles from Uninfected ponds, tadpoles from Infected ponds were, on average, 1.63 ± 0.17 SE mm larger over the entire larval period (t = 9.54, P < 0.001); however, the growth rates of the two groups did not differ significantly from one another at any point during the larval period (Supplementary Figure S2.1). Instead, tadpoles from Infected ponds were larger at the time of the initial sample and maintained this difference through time (Figures 4A, B).
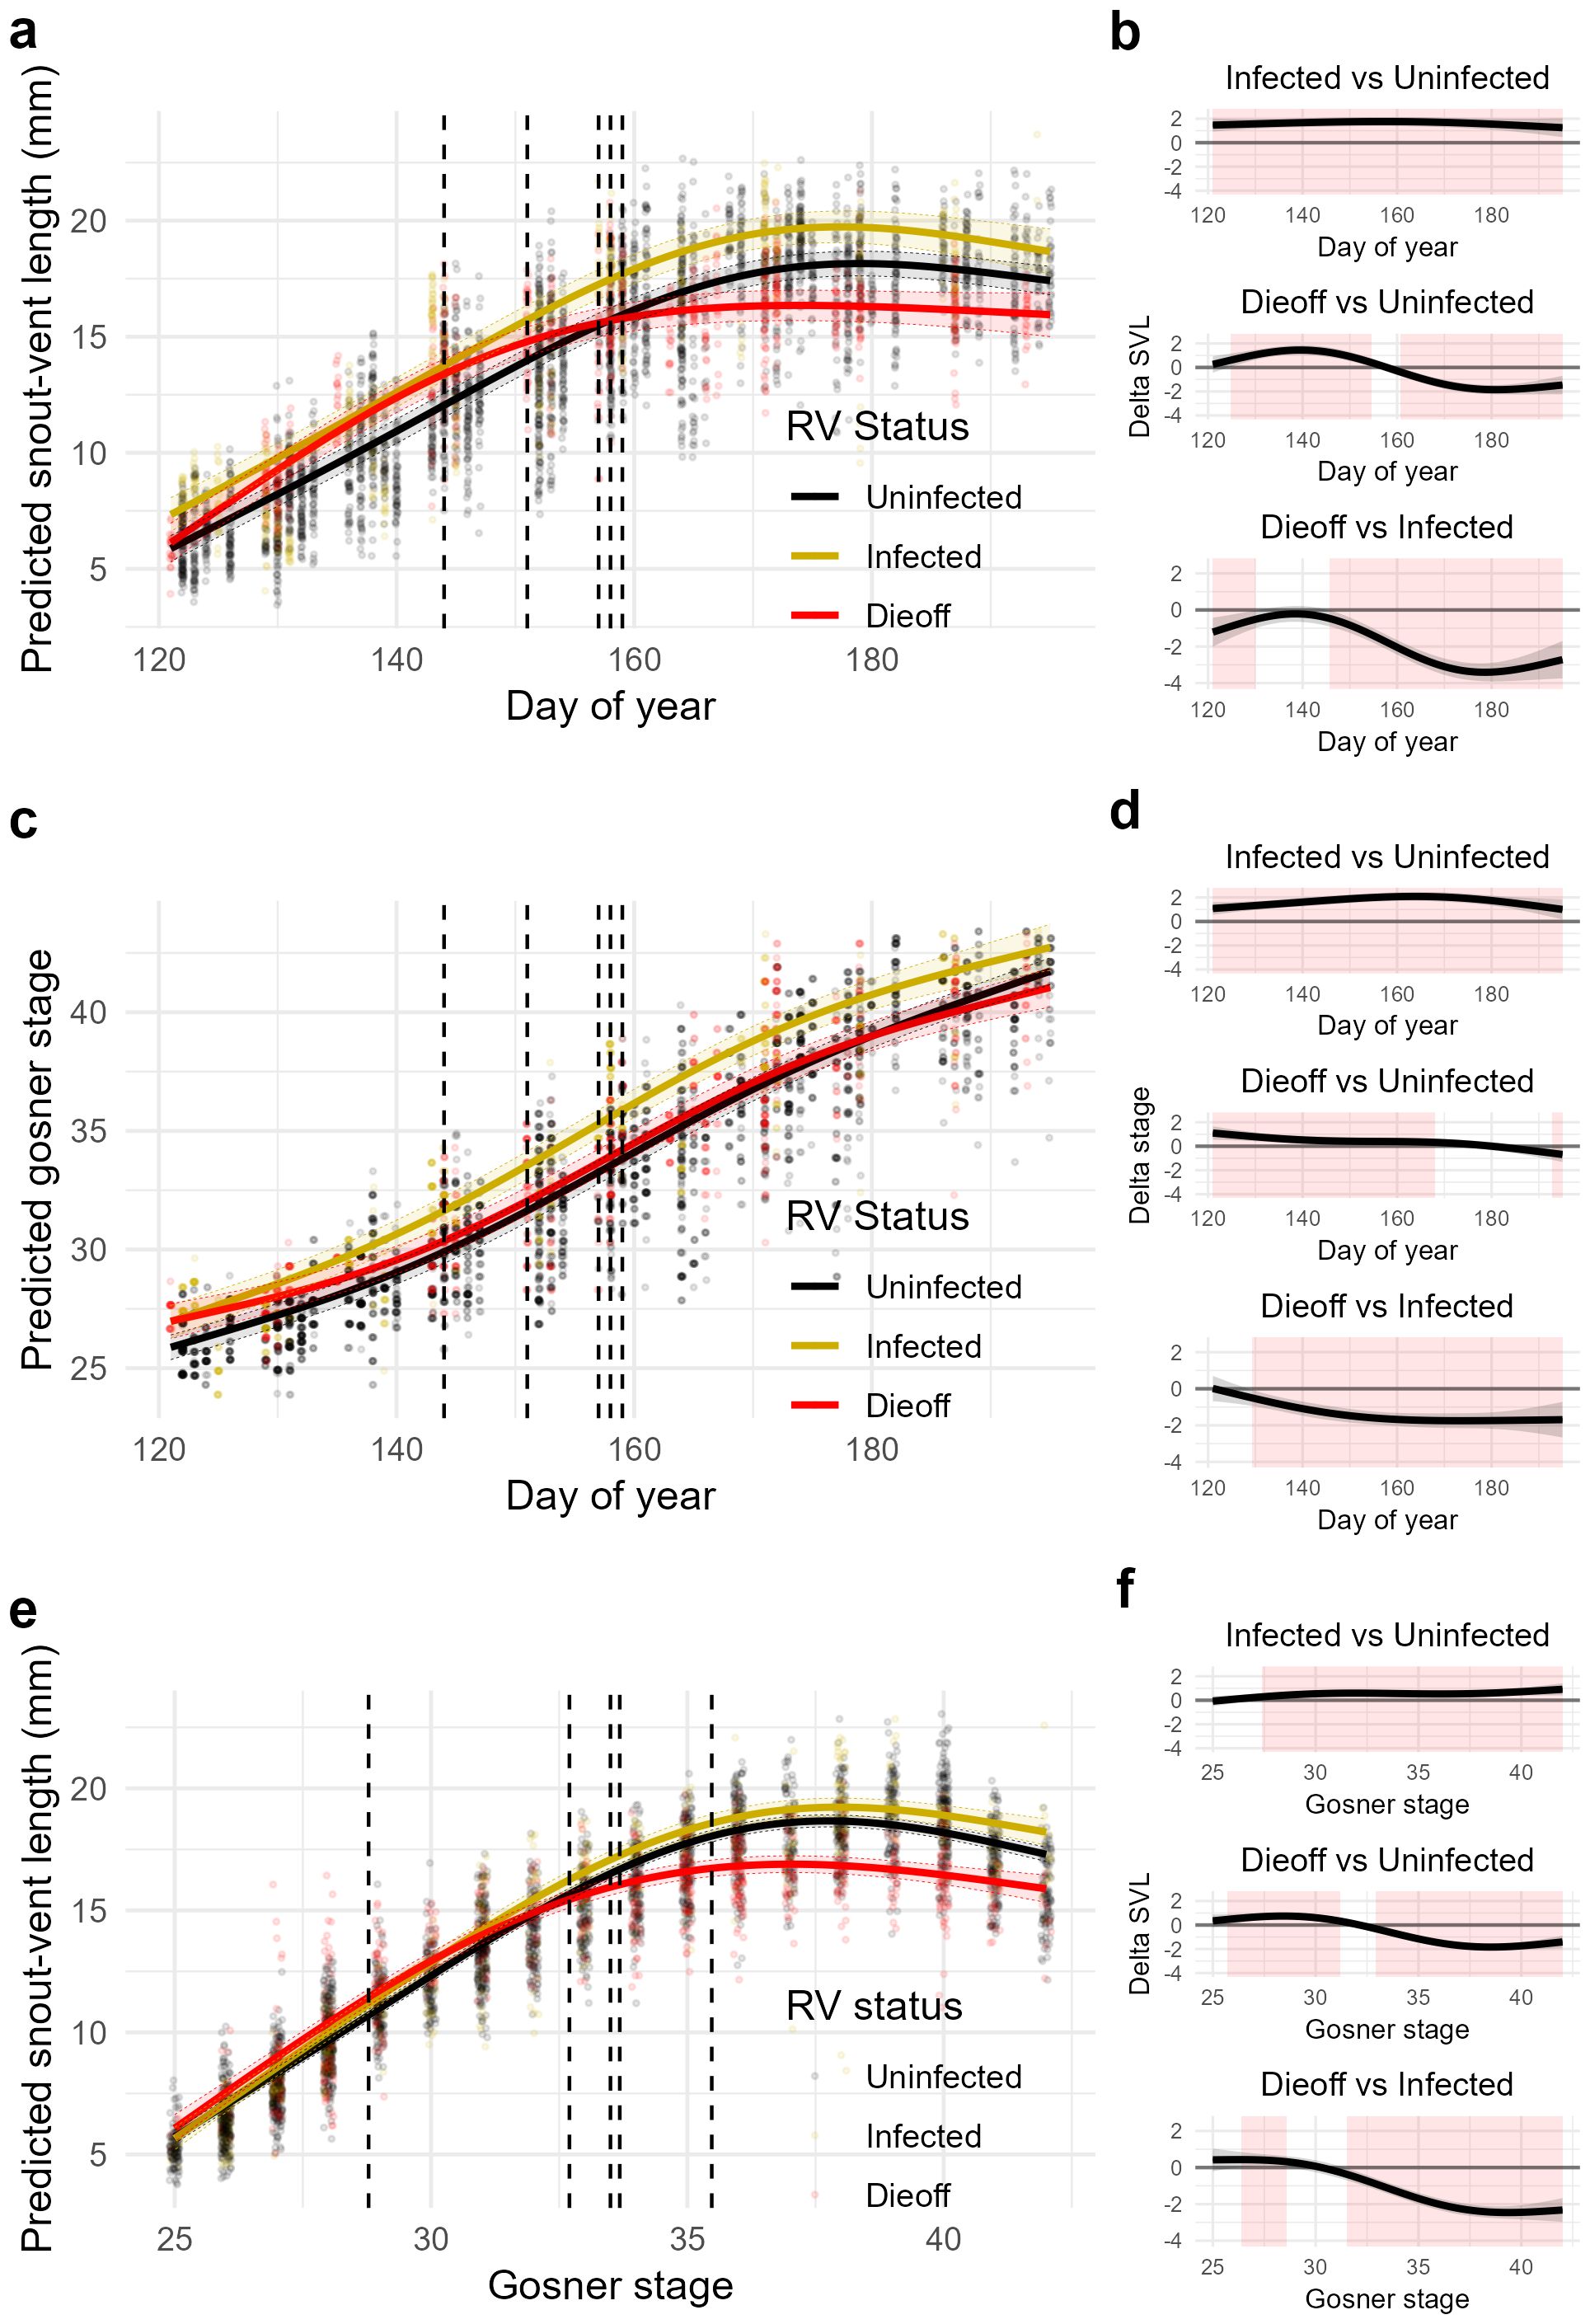
Figure 4. Estimated growth rates (snout-vent length [mm] per day) (A), developmental rates (Gosner stages per day) (C), and allocation rates (snout-vent length per Gosner stage) (E) from generalized additive models (GAMs) using measurements of wild-captured wood frog tadpoles. Solid lines represent marginal trends for tadpoles from Uninfected (black), Infected (gold) and Dieoff (red) ponds with 95% CIs (shaded areas) and conditional residuals (colored points). Vertical dashed lines in (A, C) indicate the start of each observed ranavirus die-off (i.e., the first observation of carcasses); vertical dashed lines in (E) represent the average Gosner stage of tadpoles at the start of each observed ranavirus die-off. To the right of each GAM plot are the pairwise differences of smooths with 95% CIs for the estimates of growth rates (B), developmental rates (D), and allocation rates (F). Red shading indicates regions of significant difference between smooths (i.e., no overlap with zero).
Tadpoles from Uninfected versus Dieoff ponds exhibited distinct growth patterns over the larval period. Early in the larval period (DOY ~121-135), tadpoles from Dieoff ponds grew more rapidly, resulting in larger body sizes over the first third of the larval period (DOY ~125-154). However, the occurrence of ranavirus die-offs caused estimated growth rates of larvae from Dieoff ponds to slow dramatically below those of Uninfected tadpoles, resulting in smaller body sizes over the final half of the larval period (DOY ~161-196; Supplementary Figure S2.1). Because of these differential growth rates before and after ranavirus die-offs, there was no overall average size difference between tadpoles from Uninfected and Dieoff ponds (β = -0.07, t = -0.451, P = 0.652; Figures 4A, B).
The average developmental rate in the Uninfected group was 0.21 ± 0.004 SE stages/day over the entire larval period. Relative to tadpoles from Uninfected ponds, tadpoles from Infected ponds were, on average, 1.7 ± 0.15 stages more developed over the entire larval period (t = 11.25, P < 0.001). Moreover, tadpoles from Uninfected and Infected ponds exhibited distinct patterns of development over the larval period; specifically, larvae from Infected sites tended to develop faster for the first quarter of the larval period (DOY ~136-156; Supplementary Figure S2.2), resulting in a maximum difference in developmental stage of ~2.1 stages halfway through the larval period (DOY ~164; Figures 4C, D).
Tadpoles from Uninfected and Dieoff ponds exhibited distinct developmental patterns over the larval period. Specifically, larvae from Dieoff sites tended to be more developed early in the larval period and less developed late in the larval period. This shift through time was driven by overall slower developmental rates of individuals from Dieoff ponds (0.19 ± 0.005 SE stages/day; Supplementary Figure S2.2). There was also a modest overall average difference in development between tadpoles from Uninfected and Dieoff ponds: tadpoles from Dieoff ponds were on average 0.38 ± 0.13 stages more developed over the entire larval period (t = 2.85, P = 0.004; Figures 2C, D).
The average allocation rate in the Uninfected group was 0.68 ± 0.07 SE mm/stage during development. Relative to tadpoles from Uninfected ponds, tadpoles from Infected ponds were on average 0.48 ± 0.1 SE mm larger per developmental stage (t = 4.28, P < 0.001; Figures 4E, F), but the relationship varied throughout development. At the beginning of larval development (stages ~25 - 28), tadpoles from Uninfected and Infected ponds were approximately the same size per stage; however, tadpoles from Infected ponds tended to have a slightly higher allocation rate throughout development (Supplementary Figure S2.3), resulting in tadpoles that were modestly larger per developmental stage from Gosner stage ~28 through the start of metamorphosis.
Relative to tadpoles from Uninfected ponds, tadpoles from Infected ponds were on average 0.39 ± 0.1 mm smaller at a given developmental stage (t = -3.92, P < 0.001; Figures 4E, F), but the effect varied markedly throughout development. Similar to Infected tadpoles, tadpoles from Dieoff ponds were approximately the same size per stage as tadpoles from Uninfected ponds at the start of the larval period. However, a higher allocation rate of tadpoles from Dieoff ponds early in larval development resulted in tadpoles on average ~0.6 mm (6%) larger from Gosner stage 26 - 31, with a maximum average size difference of ~0.7 mm (7%) at stage ~28 (Supplementary Figure S2.3). However, a dramatic decline in average allocation rates began on average at stage ~29 (i.e., within the developmental window where die-off events began), resulting in tadpoles from Dieoff ponds being on average ~1.5 mm (8%) smaller per stage from Gosner stage 33 through the start of metamorphosis, with a maximum average size difference of ~1.9 mm (10%) at stage 38.
After accounting for wood frog density, the presence of predatory salamander larvae (Ambystoma opacum) was associated with slower tadpole development (β = -0.36 ± 0.11 stages SE, t = -3.27, P < 0.001) and accelerated tadpole allocation (i.e., larger size at a given stage developmental stage; β = 0.56 ± 0.08 SE, t = 7.10, P < 0.001), but did not affect tadpole growth (β = -0.12 ± 0.12 SE, t = -1.00, P = 0.314).
The smooth term for average pond temperature revealed an approximately concave down relationship with both tadpole growth and development, with predicted values of both size and developmental stage gradually increasing from 13.6 to ~16°C and gradually declining as average pond temperature approaches the maximum value of 18.2°C. Allocation rate, in comparison, showed a negative, approximately linear relationship with average pond temperature (i.e., tadpoles size-at-stage is larger at colder temperatures).
The smooth term for conspecific density revealed a non-linear decreasing relationship with tadpole growth up to a density of ~40 conspecifics per person-minute, flattening out and marginally increasing beyond this density. The smooth term for conspecific density had a similar relationship with tadpole growth, with a marginally declining but relatively flat relationship up to a density of ~40 conspecifics/person-minute, and increasing slowly beyond this density.
Our study provides evidence that the presence of ranavirus affects the growth, development, and resource allocation of wood frog tadpoles. Specifically, relative to ponds without ranavirus infection, the presence of ranavirus infection in a pond was associated with modest increases in tadpole allocation (size per developmental stage), tadpole growth (size per unit time), and tadpole development (developmental stage per unit time) early in the larval period and before the onset of die-off events, counter to our expectation that individuals from ponds with ranavirus would be smaller but more developed during this period. In ponds where ranavirus was present but did not lead to a die-off, these advantages in growth, development, and allocation were maintained over the entire larval period through the start of metamorphosis. This pattern contrasts ponds where a ranavirus die-off event occurred, where physiological rates, particularly growth and allocation, declined markedly following die-offs, resulting in tadpoles that were significantly smaller at the start of metamorphosis.
Mortality rates from ranavirus infection can be very high, often matching or exceeding mortality rates associated with conditions known to elicit strong responses in tadpoles, such as predation and pond drying. The observed increases in growth and allocation early in the larval period at ponds with ranavirus may represent an adaptive response to mitigate the fitness costs associated with ranavirus infection. Recent work shows that juvenile frogs display avoidance behaviors toward ranavirus-infected conspecifics, even in the absence of symptoms (Le Sage et al., 2022; Herczeg et al., 2024), indicating that amphibians, like other taxa, can pick up cues of infection and pathogen presence (Kavaliers et al., 2004; Curtis, 2014; Stephenson et al., 2018). Although no work currently demonstrates that tadpoles can detect ranavirus-infected conspecifics, there are studies demonstrating responses of aquatic organisms to conspecifics infected by other pathogens using a combination of chemical and visual cues (Behringer et al., 2018; Côté and Binning, 2025). Increasing growth and allocation in response to ranavirus cues, rather than other responses such as priming the immune system, are intuitive in the context of larval amphibian immunobiology; work in the model species Xenopus laevis suggests that tadpoles are weakly immunocompetent, with some delayed innate immune components and weak acquired immune components (Rollins-Smith, 1998; Andino et al., 2012). By increasing body condition prior to infection by accelerating growth and allocation, tadpoles may better tolerate severe infection, which incurs a high energetic cost coupled with reduced energy acquisition via cessation of feeding (Gray et al., 2009).
While we expected tadpoles in ponds with ranavirus present (i.e., Infected and Dieoff ponds) would accelerate development at the expense of reduced growth before die-offs, we did not find this trade-off; instead, there was a clear increase in growth and weaker impacts on development. The exact drivers behind this pattern are unclear, but multiple mechanisms may allow tadpoles to accelerate growth and allocation early in development. Under most conditions, tadpoles do not grow at the maximum possible rate, as the potential benefits of faster growth must be balanced with exposure to predators and other environmental risks (Petranka, 1989; Skelly, 1994, 1995). Moreover, under many conditions, faster growth may not necessarily be optimal and in fact, may incur fitness costs (Morgan and Metcalfe, 2001; Gahm et al., 2020). Therefore, tadpoles typically constrain growth rates below what is maximally possible but do have the potential to accelerate them under a variety of conditions (e.g., compensatory growth; Mangel and Munch, 2005). Accelerated growth may be mediated through increased foraging rates per se or via increased risk tolerance to threats that otherwise reduce foraging rates, as well as through shifting the diet toward food sources that promote growth over development (Richter-Boix et al., 2007). Interestingly, preliminary evidence suggests that tadpoles exposed to ranavirus, regardless of infection status, increase their activity rates (Howard, 2020); however, it is unclear if these changes in activity affect foraging or diet. Similarly, diet can affect ranavirus infection loads (Hughey et al., 2023), but it is unclear if tadpoles shift their diet in response to infection. Future work addressing foraging rates and dietary shifts in response to ranavirus exposure would provide valuable insights into how tadpoles respond to the presence of ranavirus in their environment and provide insights into the potential mechanisms behind our observations.
Though ranavirus epizootics frequently cause near 100% mortality, we observed repeated instances of cohorts that partially or predominantly survived widespread ranavirus infection. However, our population-level estimates of physiological rates suggest that surviving or avoiding severe infections may have incurred significant energetic costs for many individuals; we observed sharp declines in growth and allocation following the epizootic peak, resulting in nearly 10% smaller tadpoles at the onset of metamorphosis. Although some energetic costs of infection may be offset by increased rates of growth we observed before the die-offs, as well as through reduced resource competition following the mortality of conspecifics, it is still likely that effects of ranavirus epizootics carry over into the terrestrial phase. Though we did not measure lipid stores or body condition directly, lipid stores have been found to be allometrically related to body size, and individuals with lower lipid stores at metamorphosis are less likely to survive to adulthood (Scott et al., 2007). A negative effect of ranavirus infection on growth has been observed in experimental settings (Echaubard et al., 2010; Warne et al., 2011; Wright et al., 2023); our study provides evidence that field patterns match experimental expectations.
Relative to growth and allocation, rates of development were more modestly impacted by ranavirus presence, even in ponds where severe epidemics led to die-offs. Experimental work suggests that tadpoles may accelerate development following infection with ranavirus (Warne et al., 2011), although it is unclear if this is an adaptive response to escape a stressful environment or by-product of elevated corticosterone levels. Our findings are not in conflict with these results - maintaining developmental rate through severe infection while also navigating the complexities of a natural environment suggests that individuals continue to invest resources to maintain development, which is energetically costly and becomes more so for tadpoles in an energetically depleted state (Orlofske and Hopkins, 2009). Alternatively, developmental plasticity may be more limited early in prometamorphosis, limiting the ability of tadpoles to accelerate development in the period before die-offs (Denver et al., 1998). Although our work does not clarify whether developmental responses to ranavirus are a hormonal by-product or an aid in escaping the ephemeral larval environment, it provides field-based evidence that the severe infections associated with die-off events have limited impacts on the development of survivors.
Observational studies are a powerful tool to investigate natural responses to complex ecological phenomena that are difficult to replicate in a controlled experiment; however, because of the nature of such work, it is critical to consider alternative explanations for our observed patterns, as multiple mechanisms are likely at play and are difficult to fully account for in an observational study, warranting further exploration. For example, the observed differences in size early in the larval period between ranavirus-positive and ranavirus-negative ponds could be partially driven by other processes, such as undetected size-biased mortality from ranavirus infection. Although we are unaware of any demonstrations of size-biased mortality occurring in this study system, it has been observed in other host-pathogen systems (e.g., Burrow et al., 2017) and warrants experimental exploration as an alternative explanation for the patterns seen here. Though we rarely found tadpoles with high infection loads prior to the start of die-offs, low-intensity infections can still sometimes lead to less obvious mortality that can be missed even with frequent surveillance. Though we accounted for density in our analysis, unobserved mortality in Infected ponds could have reduced resource competition, increasing growth rates in surviving individuals. There is also the potential that some other unmeasured environmental factor may influence both growth and ranavirus outcomes, resulting in a pattern where we find accelerated growth and/or development in ponds that are also more likely to experience ranavirus epizootics. Although we aimed to account for several key factors that influence tadpole physiological rates in our analyses, we cannot rule out that some other factor(s) that we did not consider influenced the patterns found herein. For example, there is also the potential that some other unmeasured environmental factors, such as pond productivity or nutrient levels, may influence both growth and ranavirus outcomes, which could partially drive patterns such as those in our study. We also did not test for other pathogens, such as Batrachochytrium dendrobatidis, that can co-occur with ranavirus, and so the responses observed here could instead reflect a response to overall pathogen risk instead of just ranavirus specifically. Additionally, although ranavirus has been documented in this amphibian metapopulation over the past 10+ years, the long-term ranavirus infection history of these sites is unclear, and the responses we see could be an evolutionary adaptation to prolonged ranavirus exposure rather than a plastic response to the presence or absence of ranavirus. Finally, though extensive literature shows that larger tadpole body sizes tend to be beneficial for metamorph survival rates, adult size, reproductive output, and locomotor performance (e.g., Scott et al., 2007; Cabrera-Guzmán et al., 2013; Székely et al., 2020), most experimental studies use more exaggerated size differences than some of those found across ranavirus categories in our study (e.g., allocation differences between tadpoles from Infected and Uninfected ponds; Figure 4E), and so more work is needed to understand how the size and allocation differences we identified might impact these populations. Despite these limitations, field studies like ours provide crucial insights into real-world ecological dynamics that cannot be fully replicated in controlled experiments. They capture the complex interplay of multiple factors affecting host-pathogen interactions in natural settings, offering a more holistic view of how organisms respond to infection risk. Our findings serve as a foundation for generating new hypotheses and informing future experimental designs, ultimately contributing to a more comprehensive understanding of amphibian responses to pathogens in their natural habitats. By combining observational studies with carefully designed experiments, we can build a more robust and ecologically relevant understanding of host-pathogen dynamics in amphibian populations.
Our study reveals patterns consistent with novel physiological responses to the presence of ranavirus in the environment. Evaluating these responses to identify the underlying mechanism, whether it is an adaptive response as hypothesized here or an alternative, will require further research, including controlled experimentation. For organisms to evolve a response to an environmental challenge like ranavirus, several conditions must be met, including reliable cues associated with the challenge and demonstrable fitness benefits of the response that outweigh potential costs. It remains unclear what cues are used to detect the presence of ranavirus without direct exposure. Ranavirus environmental DNA (eDNA) can be reliably detected in environments where some ranavirus infection was present for extended periods following the removal of the infectious individual (e.g., Hall et al., 2020), and so tadpoles may be able to detect and respond to ranavirus presence via exposure to non-viable ranavirus particles, similar to responses in amphibians evoked by exposure to dead chytrid fungi (McMahon et al., 2014). It will also be important to investigate how the size and developmental differences we observed between ranavirus-free and ranavirus-infected ponds influence disease outcomes. We can begin by asking: all else equal, are large tadpoles better defended against ranavirus infection? To fully address this question, studies that manipulate food quantity and quality with the presence or absence of ranavirus cues are needed, as well as studies that expose tadpoles to ranavirus cues in a semi-natural environment before introducing infectious ranavirus.
It is well understood that ecological challenges such as predation, desiccation, and competition can induce strong responses in amphibian larvae and other organisms. Yet, induced responses to perceived risk of infection have largely been ignored. Our study sheds light on the physiological responses of amphibian larvae to the presence of a deadly viral pathogen. The observed responses in our study highlight the necessity of identifying the cues that uninfected tadpoles may use to detect pathogens in conspecifics and the environment and how these physiological changes impact disease outcomes. Future studies will increasingly reveal the complex nature of interactions between hosts and pathogens. As has been so well documented for prey response to predators, animals are likely to be active agents in mediating the infection risks they encounter.
The datasets presented in this study can be found in online repositories. The names of the repository/repositories and accession number(s) can be found below: http://datadryad.org/stash/share/JF8e4GtawGj1j7Fovy0YTd8oEBFR22MQT0FTyDVPyC8.
The animal study was approved by Yale University Institutional Animal Care & Use Committee (protocol 2019-10361). The study was conducted in accordance with the local legislation and institutional requirements.
LB: Conceptualization, Data curation, Formal analysis, Funding acquisition, Investigation, Methodology, Visualization, Writing – original draft, Writing – review & editing. DS: Conceptualization, Funding acquisition, Resources, Supervision, Writing – review & editing.
The author(s) declare financial support was received for the research, authorship, and/or publication of this article. This project was supported by funds awarded to LB from the Kohlberg-Donohoe Research Fellowship, the Yale Institute for Biospheric Studies, the Yale Law School LEAP Student Grant Program, the AMNH Theodore Roosevelt Memorial Fund, and Sigma Xi Grants in Aid of Research, and awarded to DS from Yale University.
We thank Claire E. Schraidt for substantial help with the conceptualization of Figure 1, Adriana Rubinstein, Dr. L. Kealoha Freidenburg, Carolyn Skotz, and Karinne Tennenbaum for their assistance with fieldwork, AR, KT, and CS for their assistance with labwork, and Yara Alshwairikh, Dr. David Klinges, Julia Portmann, Samantha Tracy, CES, LKF, and AR for early reviews of this manuscript. Animal handling was approved by Yale University IACUC protocol 2019-10361 and 2022-10361. Specimens were collected under CT DEEP Permit 0124002. Field surveys were conducted with permission from Yale Myers Research Committee (BILL21).
The authors declare that the research was conducted in the absence of any commercial or financial relationships that could be construed as a potential conflict of interest.
The author(s) declare that no Generative AI was used in the creation of this manuscript.
All claims expressed in this article are solely those of the authors and do not necessarily represent those of their affiliated organizations, or those of the publisher, the editors and the reviewers. Any product that may be evaluated in this article, or claim that may be made by its manufacturer, is not guaranteed or endorsed by the publisher.
The Supplementary Material for this article can be found online at: https://www.frontiersin.org/articles/10.3389/famrs.2025.1529060/full#supplementary-material
Altizer S., Becker D. J., Epstein J. H., Forbes K. M., Gillespie T. R., Hall R. J., et al. (2018). Food for contagion: synthesis and future directions for studying host-parasite responses to resource shifts in anthropogenic environments. Philos. Trans. R. Soc. London Ser. B Biol. Sci., 373, 20170102. doi: 10.1098/rstb.2017.0102
Andino F. D. J., Chen G., Li Z., Grayfer L., Robert J. (2012). Susceptibility of Xenopus laevis tadpoles to infection by the ranavirus Frog-Virus 3 correlates with a reduced and delayed innate immune response in comparison with adult frogs. Virology 432, 435–443. doi: 10.1016/j.virol.2012.07.001
Arietta A. Z. A., Skelly D. K. (2021). Rapid microgeographic evolution in response to climate change. Evolution 75, 2930–2943. doi: 10.1111/evo.14350
Auld J. R., Agrawal A. A., Relyea R. A. (2010). Re-evaluating the costs and limits of adaptive phenotypic plasticity. Proc. R. Soc. B: Biol. Sci. 277, 503–511. doi: 10.1098/rspb.2009.1355
Barnett H. K., Richardson J. S. (2002). Predation risk and competition effects on the life-history characteristics of larval Oregon spotted frog and larval red-legged frog. Oecologia 132, 436–444. doi: 10.1007/s00442-002-0981-x
Behringer D. C., Karvonen A., Bojko J. (2018). Parasite avoidance behaviours in aquatic environments. Philos. Trans. R. Soc. B: Biol. Sci. 373, 20170202–20170202. doi: 10.1098/rstb.2017.0202
Berven K. A., Gill D. E., Smith-Gill S. J. (1979). Countergradient selection in the green frog, Rana clamitans. Evolution 33, 609–623. doi: 10.1111/j.1558-5646.1979.tb04714.x
Bienentreu J. F., Lesbarrères D. (2020). Amphibian disease ecology: Are we just scratching the surface? Herpetologica 76, 153–166. doi: 10.1655/0018-0831-76.2.153
Bourdeau P. E., Johansson F. (2012). Predator-induced morphological defences as by-products of prey behaviour: a review and prospectus. Oikos 121, 1175–1190. doi: 10.1111/j.1600-0706.2012.20235.x
Burrow A. K., Rumschlag S. L., Boone M. D. (2017). Host size influences the effects of four isolates of an amphibian chytrid fungus. Ecol. Evol. 7, 9196–9202. doi: 10.1002/ece3.3255
Cabrera-Guzmán E., Crossland M. R., Brown G. P., Shine R. (2013). Larger Body Size at Metamorphosis Enhances Survival, Growth and Performance of Young Cane Toads (Rhinella marina). PloS One 8, e70121. doi: 10.1371/journal.pone.0070121
Coretta S., et al. (2023). tidymv: Tidy Model Visualisation for Generalised Additive Models. Available online at: https://cran.r-project.org/web/packages/tidymv/index.html (Accessed September 18, 2024).
Côté A., Binning S. A. (2025). The importance of visual and chemical cues in infection detection and avoidance in a freshwater fish. Animal Behaviour. 123060. doi: 10.1016/j.anbehav.2024.123060
Curtis V. A. (2014). Infection-avoidance behaviour in humans and other animals. Trends Immunol. 35, 457–464. doi: 10.1016/j.it.2014.08.006
Daly E. W., Johnson P. T. J. (2011). Beyond immunity: Quantifying the effects of host anti-parasite behavior on parasite transmission. Oecologia 165, 1043–1050. doi: 10.1007/s00442-010-1778-y
Denver R. J., Mirhadi N., Phillips M. (1998). Adaptive plasticity in amphibian metamorphosis: Response of Scaphiopus hammondii tadpoles to habitat desiccation. Ecology 79, 1859–1872. doi: 10.1890/0012-9658(1998)079[1859:apiamr]2.0.co;2
DeWitt T. J., Sih A., Wilson D. S. (1998). Costs and limits of phenotypic plasticity. Trends Ecol. Evol. 13, 77–81. doi: 10.1016/S0169-5347(97)01274-3
Dobson A., Lafferty K. D., Kuris A. M., Hechinger R. F., Jetz W. (2008). Homage to Linnaeus: How many parasites? How many hosts? Proc. Natl. Acad. Sci. 105, 11482–11489. doi: 10.1073/pnas.0803232105
Echaubard P., Little K., Pauli B., Lesbarrères D. (2010). Context-dependent effects of ranaviral infection on northern leopard frog life history traits. PloS One 5, e13723. doi: 10.1371/journal.pone.0013723
Ezenwa V. O. (2004). Selective defecation and selective foraging: antiparasite behavior in wild ungulates? Ethology 110, 851–862. doi: 10.1111/j.1439-0310.2004.01013.x
Gahm K., Arietta A. Z. A., Skelly D. K. (2020). Temperature-mediated trade-off between development and performance in larval wood frogs (Rana sylvatica). J. Exp. Zool Part A: Ecol. Integr. Physiol. 335, 146–157. doi: 10.1002/jez.2434
Gaynor K. M., Brown J. S., Middleton A. D., Power M. E., Brashares J. S. (2019). Landscapes of fear: spatial patterns of risk perception and response. Trends Ecol. Evol. 34 (4), 355–368. doi: 10.1016/j.tree.2019.01.004
Gosner K. (1960). A simplified table for staging anuran embryos and larvae with notes on identification. Herpetologica 16, 183–190.
Gray M. J., Brunner J. L., Earl J. E., Ariel E. (2015). “Design and analysis of ranavirus studies: surveillance and assessing risk,” in Ranaviruses: Lethal Pathogens of Ectothermic Vertebrates. Eds. Gray M. J., Chinchar V. G. (Springer International Publishing, Cham), 209–240. doi: 10.1007/978-3-319-13755-1_8
Gray M. J., Miller D. L., Hoverman J. T. (2009). Ecology and pathology of amphibian ranaviruses. Dis. Aquat. Organisms 87, 243–266. doi: 10.3354/dao02138
Hall E. M., Brunner J. L., Hutzenbiler B., Crespi E. J. (2020). Salinity stress increases the severity of ranavirus epidemics in amphibian populations. Proc. R. Soc. B: Biol. Sci. 287. doi: 10.1098/rspb.2020.0062
Hall E. M., Goldberg C. S., Brunner J. L., Crespi E. J. (2018). Seasonal dynamics and potential drivers of ranavirus epidemics in wood frog populations. Oecologia 188, 1253–1262. doi: 10.1007/s00442-018-4274-4
Herczeg D., Horváth G., Bókony V., Herczeg G., Kásler A., Holly D., et al. (2024). Juvenile agile frogs spatially avoid ranavirus-infected conspecifics. Sci. Rep. 14, 23945. doi: 10.1038/s41598-024-74575-2
Hoverman J. T., Gray M. J., Haislip N. A., Miller D. L. (2011). Phylogeny, life history, and ecology contribute to differences in amphibian susceptibility to ranaviruses. EcoHealth 8, 301–319. doi: 10.1007/s10393-011-0717-7
Hoverman J. T., Gray M. J., Miller D. L., Haislip N. A. (2012). Widespread occurrence of ranavirus in pond-breeding amphibian populations. EcoHealth 9, 36–48. doi: 10.1007/s10393-011-0731-9
Howard H. (2020). Ranavirus increases vulnerability to predation by altering tadpole behavior (West Lafayette, IN: Purdue University).
Hughey M. C., Warne R., Dulmage A., Reeve R. E., Curtis G. H., Whitfield K., et al. (2023). Diet- and salinity-induced modifications of the gut microbiota are associated with differential physiological responses to ranavirus infection in Rana sylvatica. Philos. Trans. R. Soc. B: Biol. Sci. 378, 20220121. doi: 10.1098/rstb.2022.0121
Jones K. E., Patel N. G., Levy M. A., Storeygard A., Balk D., Gittleman J. L., et al. (2008). Global trends in emerging infectious diseases. Nature 451, 990–993. doi: 10.1038/nature06536
Kavaliers M., Choleris E., Ågmo A., Pfaff D. W. (2004). Olfactory-mediated parasite recognition and avoidance: linking genes to behavior. Hormones Behav. 46, 272–283. doi: 10.1016/j.yhbeh.2004.03.005
Koprivnikar J., Forbes M. R., Baker R. L. (2006). On the efficacy of anti-parasite behaviour: a case study of tadpole susceptibility to cercariae of Echinostoma trivolvis. Can. J. Zool. 84, 1623–1623. doi: 10.1139/z06-158
Lane S. J., Mahony M. J. (2002). Larval anurans with synchronous and asynchronous development periods: contrasting responses to water reduction and predator presence. J. Anim. Ecol. 71, 780–792. doi: 10.1046/j.1365-2656.2002.00644.x
Laurila A., Kujasalo J. (1999). Habitat duration, predation risk and phenotypic plasticity in common frog (Rana temporaria) tadpoles. J. Anim. Ecol. 68, 1123–1132. doi: 10.1046/j.1365-2656.1999.00354.x
Le Sage E. H., Diamond M., Crespi E. J. (2022). Ranavirus infection-induced avoidance behaviour in wood frog juveniles: do amphibians socially distance? Biol. Lett. 18, 20220359. doi: 10.1098/rsbl.2022.0359
Leung W. T.M., Thomas-Walters L., Garner T. W.J., Balloux F., Durrant C., Price S. J. (2017). A quantitative-PCR based method to estimate ranavirus viral load following normalisation by reference to an ultraconserved vertebrate target. J. Virological Methods. 249, 147–155. doi: 10.1016/j.jviromet.2017.08.016
Mangel M., Munch S. B. (2005). A life-history perspective on short- and long-term consequences of compensatory growth. Am. Nat. 166, E155–E176. doi: 10.1086/444439
McMahon T. A., Sears B. F., Venesky M. D., Bessler S. M., Brown J. M., Deutsch K., et al. (2014). Amphibians acquire resistance to live and dead fungus overcoming fungal immunosuppression. Nature 511, 224–227. doi: 10.1038/nature13491
Miaud C., Arnal V., Poulain M., Valentini A., Dejean T. (2019). eDNA increases the detectability of ranavirus infection in an alpine amphibian population. Viruses 11, 1–15. doi: 10.3390/v11060526
Mondet F., Blanchard S., Barthes N., Beslay D., Bordier C., Costagliola G., et al. (2021). Chemical detection triggers honey bee defense against a destructive parasitic threat. Nat. Chem. Biol. 17, 524–530. doi: 10.1038/s41589-020-00720-3
Morgan I. J., Metcalfe N. B. (2001). Deferred costs of compensatory growth after autumnal food shortage in juvenile salmon. Proc. Biol. Sci. 268, 295–301. doi: 10.1098/rspb.2000.1365
O’Connor K. M., Rittenhouse T. A. G., Brunner J. L. (2016). Ranavirus is Common in Wood Frog (Lithobates sylvaticus) Tadpoles throughout Connecticut, USA. Herpetol Rev. 47, 394–397.
Orlofske S. A., Hopkins W. A. (2009). Energetics of metamorphic climax in the pickerel frog (Lithobates palustris). Comp. Biochem. Physiol. Part A: Mol. Integr. Physiol. 154, 191–196. doi: 10.1016/j.cbpa.2009.06.001
Peacor S. D., Werner E. E. (2001). The contribution of trait-mediated indirect effects to the net effects of a predator. Proc. Natl. Acad. Sci. 98, 3904–3908. doi: 10.1073/pnas.071061998
Petranka J. W. (1989). Response of Toad Tadpoles to Conflicting Chemical Stimuli: Predator Avoidance versus “Optimal” Foraging. Herpetol. 45 (3), 283–292.
Poulin R. (2014). Parasite biodiversity revisited: Frontiers and constraints. Int. J. Parasitol. 44, 581–589. doi: 10.1016/j.ijpara.2014.02.003
Rakus K., Ronsmans M., Vanderplasschen A. (2017). Behavioral fever in ectothermic vertebrates. Dev. Comp. Immunol. 66, 84–91. doi: 10.1016/j.dci.2016.06.027
R Core Team (2023). R: A Language and Environment for Statistical Computing (version 4.3.2). Vienna: R Foundation for Statistical Computing. Available online at: https://www.R-project.org/ (Accessed February 15, 2021).
Relyea R. A. (2002). Competitor-induced plasticity in tadpoles: consequences, cues, and connections to predator-induced plasticity. Ecol. Monogr. 72, 523–540. doi: 10.1890/0012-9615(2002)072[0523:CIPITC]2.0.CO;2
Relyea R. A. (2004). Fine-Tuned Phenotypes: Tadpole Plasticity under 16 Combinations of Predators and Competitors. Ecology 85, 172–179. doi: 10.1890/03-0169
Relyea R. A. (2007). Getting out alive: How predators affect the decision to metamorphose. Oecologia 152, 389–400. doi: 10.1007/s00442-007-0675-5
Richter-Boix A., Llorente G. A., Montori A., Garcia J. (2007). Tadpole diet selection varies with the ecological context in predictable ways. Basic Appl. Ecol. 8, 464–474. doi: 10.1016/j.baae.2006.09.009
Rollins-Smith L. A. (1998). Metamorphosis and the amphibian immune system. Immunol. Rev. 166, 221–230. doi: 10.1111/j.1600-065X.1998.tb01265.x
Sauer E. L., Trejo N., Hoverman J. T., Rohr J. R. (2019). Behavioural fever reduces ranaviral infection in toads. Funct. Ecol. 33, 2172–2179. doi: 10.1111/1365-2435.13427
Scott D. E., Casey E. D., Donovan M. F., Lynch T. K. (2007). Amphibian lipid levels at metamorphosis correlate to post-metamorphic terrestrial survival. Oecologia 153, 521–532. doi: 10.1007/s00442-007-0755-6
Semlitsch R. D., Caldwell J. P. (1982). Effects of density of growth, metamorphosis, and survivorship in tadpoles of Scaphiopus holbrooki. Ecology 63, 905–911. doi: 10.2307/1937230
Skelly D. K. (1992). Field evidence for a cost of behavioral antipredator response in a larval amphibian. Ecology 73, 704–708. doi: 10.2307/1940779
Skelly D. K. (1994). Activity level and the susceptibility of anuran larvae to predation. Anim. Behav. 47, 465–468. doi: 10.1006/anbe.1994.1063
Skelly D. K. (1995). A behavioral trade-off and its consequences for the distribution of pseudacris treefrog larvae. Ecology 76, 150–164. doi: 10.2307/1940638
Skelly D. K., Werner E. E. (1990). Behavioral and life-historical responses of larval american toads to an odonate predator. Ecology 71, 2313–2322. doi: 10.2307/1938642
Stephenson J. F., Perkins S. E., Cable J. (2018). Transmission risk predicts avoidance of infected conspecifics in Trinidadian guppies. J. Anim. Ecol. 87, 1525–1533. doi: 10.1111/1365-2656.12885
Székely D., Cogălniceanu D., Székely P., Armijos-Ojeda D., Espinosa-Mogrovejo V., Denoël M. (2020). How to recover from a bad start: size at metamorphosis affects growth and survival in a tropical amphibian. BMC Ecol. 20, 24. doi: 10.1186/s12898-020-00291-w
Thornhill J. A., Jones J. T., Kusel J. R. (1986). Increased oviposition and growth in immature Biomphalaria glabrata after exposure to Schistosoma mansoni. Parasitology 93, 443–450. doi: 10.1017/S0031182000081166
Van Buskirk J., Relyea R. A. (1998). Selection for phenotypic plasticity in Rana sylvatica tadpoles. Biol. J. Linn. Soc. 65, 301–328. doi: 10.1111/j.1095-8312.1998.tb01144.x
Warne R. W., Crespi E. J., Brunner J. L. (2011). Escape from the pond: stress and developmental responses to ranavirus infection in wood frog tadpoles. Funct. Ecol. 25, 139–146. doi: 10.1111/j.1365-2435.2010.01793.x
Weinstein S. B., Buck J. C., Young H. S. (2018). A landscape of disgust. Science 359, 1213–1214. doi: 10.1126/science.aas8694
Wellborn G. A., Skelly D. K., Werner E. E. (1996). Mechanisms creating community structure across a freshwater habitat gradient. Annu. Rev. Ecol. Systematics 27, 337–363. doi: 10.1146/annurev.ecolsys.27.1.337
Werner E. E. (1986). Amphibian metamorphosis: growth rate, predation risk, and the optimal size at transformation. Am. Nat. 128, 319–341. doi: 10.1086/284565
Werner E. E. (1998). “Ecological experiments and a research program in community ecology,” in Experimental Ecology: Issues and Perspectives. Eds. Resetarits W. J., Bernardo J. (New York, New York: Oxford University Press). doi: 10.1093/oso/9780195102413.003.0001
Werner E. E., Gilliam J. F., Hall D. J., Mittelbach G. G. (1983). An experimental test of the effects of predation risk on habitat use in fish. Ecology 64, 1540–1548. doi: 10.2307/1937508
Werner E. E., Skelly D. K., Relyea R. A., Yurewicz K. L. (2007). Amphibian species richness across environmental gradients. Oikos 116, 1697–1712. doi: 10.1111/j.2007.0030-1299.15935.x
Wheelwright N. T., Gray M. J., Hill R. D., Miller D. L. (2014). Sudden mass die-off of a large population of wood frog (Lithobates sylvaticus) tadpoles in Maine, USA, likely due to ranavirus. Herpetol Rev. 45, 240–242. doi: 10.1038/srep01515.s
Wickham H. (2016). ggplot2: Elegant Graphics for Data Analysis (Verlag New York: Springer). Available at: https://ggplot2.tidyverse.org (Accessed March 31, 2021).
Wilbur H. M., Collins J. P. (1973). Ecological aspects of amphibian metamorphosis. Science 182, 1305–1314. doi: 10.1126/science.182.4119.1305
Wood S. N. (2011). Fast stable restricted maximum likelihood and marginal likelihood estimation of semiparametric generalized linear models. J. R. Stat. Society: Ser. B (Statistical Methodol), 73, 3–36. doi: 10.1111/j.1467-9868.2010.00749.x
Wright M., Oleson L., Witty R., Fritz K. A., Kirschman L. J. (2023). Infection causes trade-offs between development and growth in larval amphibians. Physiol. Biochem. Zool 96, 727729. doi: 10.1086/727729
Keywords: Iridoviridae, infectious disease, disease ecology, host-pathogen interactions, larval amphibians, tradeoffs, metapopulation, physiological rates
Citation: Billet LS and Skelly DK (2025) Sublethal effects of a mass mortality agent: pathogen-mediated plasticity of growth and development in a widespread North American amphibian. Front. Amphib. Reptile Sci. 3:1529060. doi: 10.3389/famrs.2025.1529060
Received: 15 November 2024; Accepted: 22 January 2025;
Published: 26 March 2025.
Edited by:
Kurt K. Sladky, University of Wisconsin-Madison, United StatesReviewed by:
Amanda Linda Jean Duffus, Gordon State College, United StatesCopyright © 2025 Billet and Skelly. This is an open-access article distributed under the terms of the Creative Commons Attribution License (CC BY). The use, distribution or reproduction in other forums is permitted, provided the original author(s) and the copyright owner(s) are credited and that the original publication in this journal is cited, in accordance with accepted academic practice. No use, distribution or reproduction is permitted which does not comply with these terms.
*Correspondence: Logan S. Billet, YmlsbGV0LmxvZ2FuQGdtYWlsLmNvbQ==
Disclaimer: All claims expressed in this article are solely those of the authors and do not necessarily represent those of their affiliated organizations, or those of the publisher, the editors and the reviewers. Any product that may be evaluated in this article or claim that may be made by its manufacturer is not guaranteed or endorsed by the publisher.
Research integrity at Frontiers
Learn more about the work of our research integrity team to safeguard the quality of each article we publish.