 Leo J. Fleishman
- Department of Biology, Union College, Schenectady, NY, United States
Visual ecology is the study of how visual systems are evolutionarily adapted to the light conditions animals experience and the visual tasks they must perform. The greatest progress in this field has been made in studies of aquatic systems. Our understanding of the influence of how different terrestrial habitats have shaped the evolution of visual physiology and anatomy is more limited. Lizards are an excellent model system for examining terrestrial visual ecology because in most cases, each species experiences a limited range of habitat light conditions and these differ among species. Some aspects of visual physiology and anatomy have evolved in response to habitat conditions, while others are widely shared by a great diversity of species, suggesting that their features are largely inherited and have changed very little through evolutionary time. Understanding which features have evolved as specializations to current conditions and which are inherited and largely unchanged is critical to understanding the role that visual ecology plays in shaping behavior. In this article I review some basic features of the lizard visual system, including the processes by which lizards estimate distance and depth. I then explore the evolutionary response (or lack thereof) to differences in habitat structure, light intensity and spectral quality. I also explore some relationships between lizard color patterns and their color perception. The phylogenetic range of species that have been studied is small, and many key aspects of behavior have received relatively little attention. These are potentially rich areas for future study.
1 Introduction
Cronin et al. (2014, p.2) define visual ecology as “the study of how visual systems function to meet the ecological needs of animals, how they have evolved for proper function, and how they are specialized for, and involved in, particular visual tasks.” Land and Nilsson (2012) state: “[visual ecology refers to] the ways the eyes are specifically adapted to the lifestyles of the animals that bear them.” These definitions imply that if we examine related species that live in different visual environments, or perform different visual tasks, we expect to find differences in the anatomy and physiology of their visual systems. On the other hand, all animals have inherited their current anatomy and physiology from ancestral species. It is often the case that different species – even those that currently experience very different ecological conditions -- exhibit shared ancestral traits. These inherited visual-system characteristics may interact with different ecological parameters in ways that alter their function and act as constraints on behavior (Fleishman, 1992). Thus, the task for a visual ecologist is, on the one hand, to identify the properties that the environment and behavior require of the visual system and look for evidence of evolutionary adaptation to these requirements and, on the other hand, to identify those visual system properties that exist because they were inherited from ancestors and understand how these inherited patterns may interact with specific habitat light conditions to influence or limit behavior.
Historically, the concepts of visual ecology have been applied most successfully to aquatic systems. Water creates a spectrally filtered background. The visual pigments in the eyes of aquatic animals often vary depending on the spectral quality of water the animals occupy (Lythgoe, 1979; Osorio and Vorobyev, 2005; Cronin et al., 2014). Air typically does not spectrally filter light or reduce its intensity, although certain atmospheric conditions such as fog or haze can occasionally have major impacts. The terrestrial visual world is largely determined by the vegetation and/or substrate structure and time of day of activity. The problems posed by terrestrial ecosystems are less obvious and less clearly divergent than those of aquatic systems (e.g. see Chiao et al., 2000), and it has been harder to show clear relationships between terrestrial habitat variants and visual-system properties (Fleishman et al., 1997; Osorio, 2019).
Lizards are an excellent group in which to examine terrestrial visual ecology. Compared to birds and mammals, for example, each species is much more restricted in the habitat it occupies. Each species tends to exist within a well-defined range of light conditions, determined by the main times of activity, shade level (often determined by thermal requirements), and vegetation or substrate structure.
2 Basic anatomical features of lizard eyes
Lizards possess a typical vertebrate “camera” eye (Figure 1). Light rays striking the front of the eye pass through the pupil. The pupil varies in size and modifies the intensity of light (photons per unit time) entering the eye. These light rays are refracted (bent inwards) by the curved cornea and then further refracted by the lens, which causes the light rays emanating from each point on a stimulus object to converge to a point (or, in reality, a small blur circle) on the retina. In this way an image of the object is created on the retina.
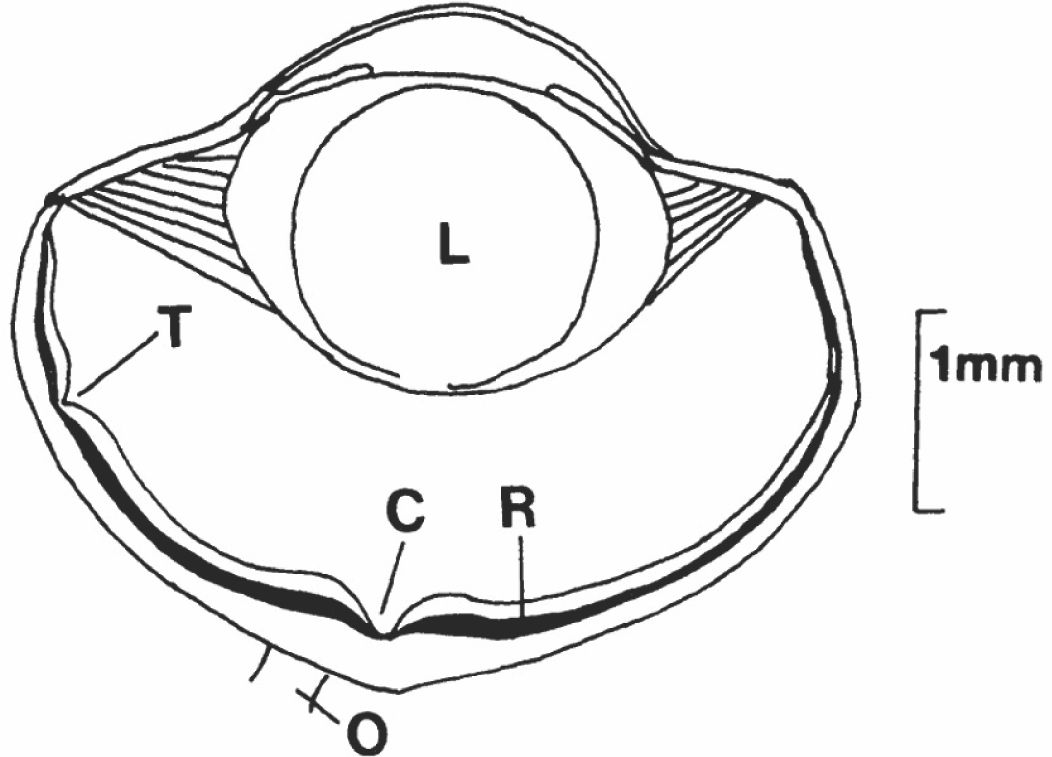
Figure 1. The left eye of a typical Anolis lizard, facing to the right. C, central (convexiclivate) fovea; L, lens; O, optic nerve; R photoreceptor layer of the retina; T, temporal fovea. The white area immediately in front of the photoreceptor layer is the neural layer that includes the ganglion cells that carry visual information to the brain. Based on Underwood (1970) and Fleishman (1992).
While the optics of the vertebrate eye are rather complex, the key features can be represented in a simplified form known as a schematic eye (Martin, 1983; Figure 2). The “principal plane” (H) represents the combined focusing effects of the cornea and lens. Also shown is a “nodal point” (N), which is a point along the optic axis with the following property: the direction of a light ray from outside the eye passing through the cornea, lens and nodal point does not change direction. The distance from the nodal point to the retina is referred to as the “Posterior Nodal Distance” (PND). As shown in Figure 2, if light emanates (or reflects) from an object stimulating the eye, one can trace the rays originating from the edges of the object that pass directly through the nodal point until they make contact with the retina, and easily estimate the size of the image on the retina. Location of the nodal point can be determined by a process known as ray tracing (Martin, 1983). In most cases the PND can be reliably approximated as equal to 0.64 × the of the distance from retina to cornea (axial length of the eyeball) in diurnally active animals and 0.55 × the axial distance in nocturnally active animals (Pettigrew et al., 1988).
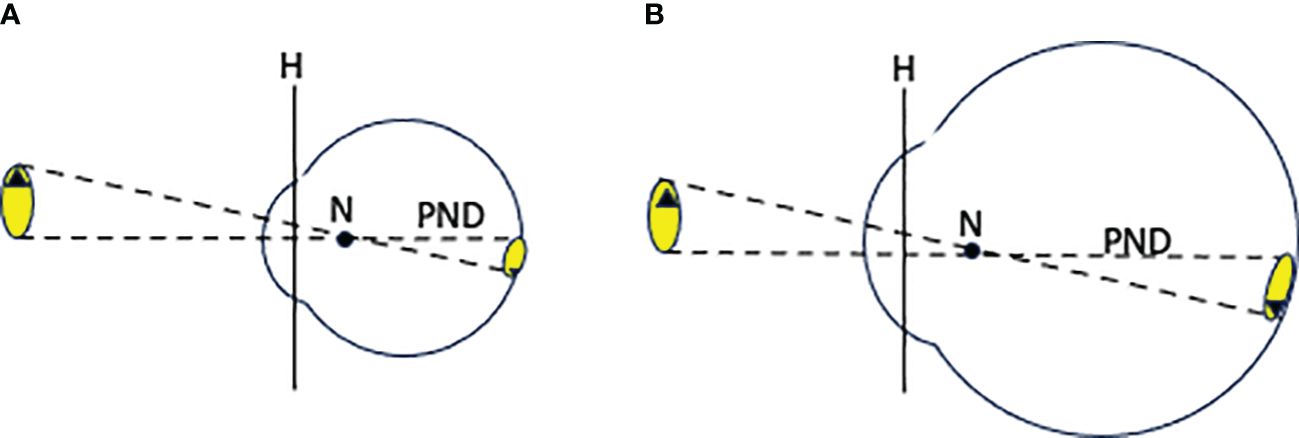
Figure 2. (A) A simplified schematic vertebrate eye. “H” is the principal plane, “N” is the posterior nodal point, and “PND” is the posterior nodal distance. Dashed lines represent rays of light traveling from edges of the object into the eye. (B) The same eye scaled up in size. This enlargement of the eye results in a larger image but has no effect on the image brightness per unit area of retina.
The basic anatomy of terrestrial vertebrate eyes is remarkably similar across taxonomic groups. One important difference is in the accommodation mechanism used to change lens shape in order to adjust focus. In most lizards (and birds) the lens is quite flexible and the striated ciliary muscles contact it directly. Contraction of the ciliary muscles bends the surface of the lens to make it rounder and increase its focusing power. In mammals, the lens, which is not as flexible, is held stretched to a flattened position by fibers attached to smooth ciliary muscles. Contraction of the ciliary muscles loosens the tension on the lens, and the lens naturally becomes more rounded, increasing focus power. The mechanism found in lizards allows for a much faster and more fine-tuned accommodation response (Walls, 1942; Ott et al., 1998).
Differences in the shape and/or size of the eye can alter its basic properties. Figure 2B illustrates the effect of increasing overall eye size. A larger image is created on the retina. Assuming that the pupil size is scaled up with the rest of the eye, the light intensity per unit area of the image falling on the retina is unchanged. While a larger eye with a larger pupil accepts more light rays from each point of the image, these points are spread out over a larger area on the retina. Due to the physics of light capture, the lower limit to the diameter of a photoreceptor cell in the retina that detects light is approximately 1µm (Underwood, 1970). The more photoreceptor cells an image spreads out over, the greater the detail that can be extracted by the sensory system. If the image is larger, it is possible to extract spatial details with larger diameter photoreceptors. Larger diameter photoreceptors are more sensitive to low light because they capture more photons per unit time. Eye size can thus play an important role in determining the sensitivity and fine detail (acuity) of the eye to natural images.
There is an additional way that eye shape differs among different species that experience different levels of habitat light intensity, which is illustrated in Figure 3. The eyes of nocturnal lizards (and most other nocturnal terrestrial vertebrates) are specialized for detection of images in low light. For this purpose, they possess a pupil which can be opened to a large diameter, allowing a wider cone of light rays from each point on a stimulus object to enter the eye (Figure 3B). To allow for the capture and focus of this wide cone of light rays, they possess a relatively large diameter cornea, and large diameter, and thicker, lens. The combination of the large pupil and lens moves the nodal point of the eye towards the retina (Figure 3D). This results in the creation of a smaller image on the retina, but one that is brighter, because each point on the retina is created from a wider cone of light rays, and the individual points of focused light are spread out over a smaller area (Walls, 1942; Kirk, 2004; Veilleux and Lewis, 2011; Land and Nilsson, 2012).
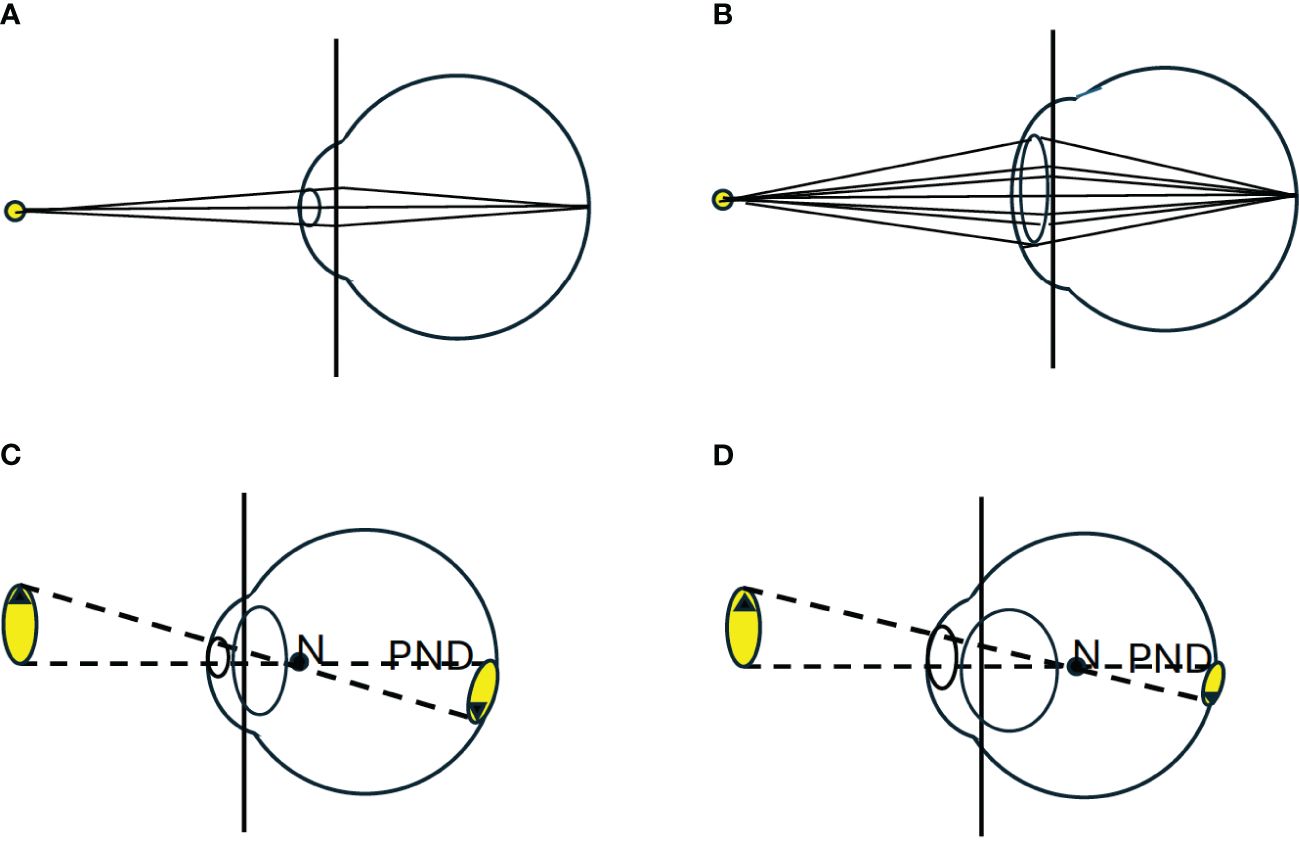
Figure 3. (A) Illustrates the impact of pupil size on the image brightness. Light rays emanating from each point on an object form a cone. The pupil determines the radius of the cone of rays that enter the eye. The rays passing through the pupil are focused (by the cornea and lens) onto the retina. (B) Illustrates that a larger pupil allows a wider cone of rays to enter the eye, increasing the brightness of the spot imaged on the retina. (C) Illustrates a typical schematic eye of a diurnal vertebrate. (D) Illustrates a common set of modifications seen in the eyes of nocturnal animals (Walls, 1942; Land and Nilsson, 2012). The pupil is greatly enlarged and the corneal radius is increased to allow more light rays to pass through the enlarged pupil. To capture and focus this wider cone of light the lens is typically larger, more spherical and occupies a greater portion of the front of the eye. This change in the focusing elements moves the posterior nodal point (N) further back in the eye, reducing the PND. The combined effect of these modifications is the creation of a smaller, brighter image on the retina.
3 Some basic features of the retina
When a visual stimulus enters the eye, it is converted into an image that falls on the visual photoreceptor layer of the retina. Vision in vertebrates is based on the capacity of visual pigment in the outer segments of retinal photoreceptor cells to capture photons of light and create a neural response that is proportional to the rate of photon capture. The photoreceptor responses to light stimulation trigger a train of neural processing within the retina resulting in action potentials that are transmitted via retinal ganglion cells to the brain. The details of the spatial properties, color and motion of visual stimuli that can be perceived are ultimately limited by the anatomical arrangement of photoreceptor cells in the retina and their response to arriving photons.
Many vertebrate species possess a duplex retina that includes cones, which operate over a range of relatively high light intensities, and rods that respond over a range of very low light intensities. Cones typically have a small tapered outer segment, while rods have a longer rod-shaped outer segment. Rods capture photons more efficiently because their outer segments are larger and contain more pigment, and because they have a lower baseline noise level (Kojima et al., 2021). Cones support color vision as well as detailed spatial and motion vision in higher light levels. Both rods and cones undergo light adaptation and adjust their sensitivity to average light conditions, but rods ultimately can adapt to a much lower intensity. Lizards lack a duplex retina and are often said to have pure cone retinas (e.g. Underwood, 1970; Röll, 2001). However, the question of whether or not rods are present in the lizard retina is complicated. The photoreceptor cells of nocturnal geckos resemble rods in appearance and function (Kojima et al., 2021), but they have visual pigments that biochemically appear to be evolutionarily-modified cone pigments. On the other hand, while all of the photoreceptors in diurnal lizard retinas morphologically appear to be cones, some of these cones have the visual pigment – rhodopsin – typically found in rods. The functional significance of these cone-like photoreceptors with the rod pigment is not known (Osorio, 2019). Ultimately the question of whether or not lizards possess rods is largely a semantic one: some nocturnal species have rod-like photoreceptors with cone-like visual pigments, while most diurnal species have at least some cone-like photoreceptors with rod-like pigments. However, since lizards lack a duplex retina, for simplicity in this manuscript I refer to all of the lizard photoreceptors as cones.
3.1 Temporal acuity of the retina
In order to detect visual motion the retina must sample incoming light for a finite duration, then stop, reset, and sample again. The time period over which this sampling occurs is known as the retinal sampling time, and it limits the temporal precision with which moving objects can be located and/or detected. This can be measured indirectly by measuring the response to rapidly flashing light stimuli while recording the summed electrical activity of the retina. This procedure produces an “electroretinogram” (ERG). Temporal acuity is typically assessed by determining the rate of flickering light that is required to produce a uniform, unvarying ERG response, known as the “flicker fusion frequency” (FFF), which is known to vary with the intensity and/or spectrum of the flickering light. Fleishman et al. (1995) measured the ERG temporal response in three species of Anolis, that inhabited three distinctly different levels of light intensity (unshaded, partial shade and full shade). They found only very minor differences in the overall flicker response and the FFF of the three species. The values ranged from 55 to 70 Hz at high light intensity. They concluded that at the level of retinal physiology, there was little or no evidence of evolutionary adaption of the temporal properties of the eye to typical habitat light intensity within this group of photopically (i.e. active in daylight) active lizards. The FFF values recorded, and the different responses to different wavelengths, were very similar to those reported for other non-reptilian terrestrial vertebrates that rely on primarily on cone-based vision. FFF values were higher for higher light intensities, and were higher for longer wavelength light (e.g. green, orange, red) than for shorter wavelengths (blue or ultraviolet). The temporal properties of the visual system were thus similar to those of other terrestrial vertebrates with cone-based vision, including humans (Fleishman et al., 1995).
3.2 Spatial acuity of the retina
Most lizard species exhibit relatively high spatial acuity, which is determined by the size of the image projected onto the retina and the density of the photoreceptors in the region where the image falls. This is limited by the diameter of the photoreceptors. The thinnest photoreceptors observed among vertebrates have a diameter of approximately 1 µm (Underwood, 1970). Another determinant of spatial acuity is the ratio of retinal ganglion cells (that carry visual signals from the eye to the brain) to photoreceptor cells. Multiple photoreceptor outputs sometimes converge on single ganglion cells as a mechanism to increase sensitivity. This process simultaneously reduces spatial acuity. In general, retinal properties exhibit a trade-off between high spatial acuity and high sensitivity under low light conditions, since higher sensitivity is achieved with larger diameter photoreceptor cells, or by greater convergence on retinal ganglion cells.
A commonly used measure of visual spatial acuity for comparative purposes is the “grating acuity”: the number of repetitions of black and white lines that can fit in one degree of visual angle, and still be perceived as separate lines. This can be estimated from anatomical data if the following are known (see Figure 1): (1) the axial length of the eye, (2) the location of the posterior nodal point, and (3) the density of photoreceptor cells (e.g. cells/mm2 of retina) of the relevant section of retina, and (4) the approximate ratio of retinal ganglion cells to photoreceptor cells. In general, smaller, more densely packed photoreceptors, and larger eyes with larger images result in greater acuity.
Of the species for which grating acuity has been determined, the Ctenophorus species have the highest value: 20–26 cycles per degree (Nagloo et al., 2020), and Anolis carolinensis is second at 12–14 cycles per degree (Fleishman et al., 2017; Nagloo et al., 2020). The sleepy lizard Tiliqua rugosa, a slow-moving animal that feeds on vegetation and slow-moving prey has a value of 7.3 cycles per degree (New and Bull, 2011). There is a clear relationship between visual acuity and activity. High visual acuity is optimal, but costly to maintain metabolically, so it is found in those species that (1) can experience sufficient light to effectively stimulate narrow diameter cones, and (2) capture small fast-moving prey. In general, nocturnal and burrowing lizards have lower acuity values. This is due to the necessity of having larger diameter photoreceptors to capture photons more efficiently to enhance sensitivity (further discussion below). By comparison the maximum grating acuity for humans in bright light is 50 cycles per degree (Olsson et al., 2013). The difference is mainly due to the much larger size of the human eye.
3.3 Variations in the spatial distribution of photoreceptors cells across the retina
In most cases the photoreceptor densities are not uniform across the retina. Specialized regions of higher photoreceptor density take three main forms. In many species there is a zone near the center of the retina with higher photoreceptor numbers, known as an “area.” Many species that live on flat, fairly open surfaces such as deserts or flat rocky outcrops, have a higher photoreceptor density along the visual horizon (i.e. along the midline of the retina), a pattern known as a visual streak. Another variant is the presence of a specialized area of high photoreceptor density over which there is a displacement of retinal neural tissue causing either a shallow indentation or a steep-walled pit. This is known as a fovea. Species from low light habitats (e.g. nocturnal geckos) tend to have larger diameter photoreceptors that function to increase sensitivity and generally lack specialized retinal regions such as the fovea.
In some species that possess a fovea, the walls of the structure are steep, creating a funnel shape (Figure 1). This is referred to as a “convexiclivate fovea.” There are two distinct placement locations for the fovea. In some species the fovea is positioned in the temporal region. Since most species have laterally placed eyes, with a small area of binocular overlap directly toward the front, this is where there is overlap between the visual fields of the two eyes. Temporally placed foveae are found, for example, in a number of diurnal gecko species. They are associated with prey localization and capture. The utilization of two foveae at once is believed to increase sensitivity by sending information simultaneously from both eyes, thereby increasing the reliability of image location. It is also possible that foveal detection of objects simultaneously by both eyes aids in distance or depth perception in the region of visual field overlap.
A more common case is the presence of a single convexiclivate fovea (in each eye) located centrally in the retina, within the portion of the visual field covered by only one eye. When an image of interest is detected in the lower acuity visual periphery, a reflex shift of the gaze brings the image onto the high acuity central fovea (Fleishman, 1992). The special role of the convexiclivate fovea and its particular shape are discussed further below.
A retinal streak refers to a linear region of higher photoreceptors density placed horizontally roughly along the midline of the retina. It is typically associated with species that occupy flat open habitats and coincides spatially with the horizon. Dragons (genus Cteophorus) are Australian lizards that occupy open, flat rocky habitats in direct sun. Nagloo et al. (2020) studied retinal morphology of six species. All six possessed retinal streaks with higher photoreceptors density in the ventral half of the retina (stimulated by light from above the horizon). In addition all of these species possessed a central convexiclivate fovea.
3.4 Possible functions of convexiclivate foveae
The convexiclivate foveal shape (Figure 1) is found in many different vertebrate groups. It is not known for certain what advantage (or advantages) this shape confers, but a number of hypotheses have been suggested. The funnel-shape of this fovea arises because the neural connections from the photoreceptors sit in front of the photoreceptor layer such that light must pass through it on the way to the photoreceptors. Because of the high density of photoreceptors in this region, the cells that carry the information to the brain are displaced to the side. This forms a steep wall of tissue that is raised on either side. The refractive index of the retinal tissue differs from that of the vitreous through which the light passes from the lens. As rays of light pass through the shoulders of the convexiclivate-shaped neural material they will be bent slightly away from the center of the retina. Walls (1942) proposed that this acts as a negative lens and causes a localized magnification of the image reaching the fovea. This would result in a significant increase in acuity. Pumphrey (1948) argued that the localized difference in refraction would create a distorted image which would degrade rather than improve acuity. He argued instead that this distortion would enhance perception of a moving image by causing it to change shape and jump rapidly across this section of retina. Harkness and Bennet-Clark (1978) proposed that the convexiclivate shape creates a small patch of retina that is highly sensitive to very small changes in focus, and supports accommodation-based depth perception (see below). More recent studies have found support for each of these functions (image magnification, enhanced motion detection, increased focus sensitivity) in certain situations (Locket, 1992; Bingham, 2019).
3.5 Two foveae in Anolis eyes
An interesting retinal variation is found only in Anolis lizards (Makaretz and Levine, 1980; Fite and Lister, 1981). They possess a deep convexiclivate fovea in the center of the retina near the optic axis, and a smaller, shallower fovea in the temporal region of the eye (see Figure 1). The temporal fovea appears to play an important role in prey capture. Anoles have laterally placed eyes that move independently. When an object of importance – such as a prey item – is detected a rapid shift of eye position brings it onto the central fovea of one of the eyes. The lizard will move quickly toward the prey item. When it is within striking distance it shifts its head position so that the prey item is directly in front of it, where it is presumably viewed simultaneously by the pair of temporal foveae (Moermond, 1981). It then lunges forward and grabs the prey in its mouth. This close-range fixation of prey appears to be the only use of the temporal foveae. It is possible that the anole fixates on its prey with both temporal fovea, and is then able to judge distance based on the vergence (the extent to which the two eyes rotate inward to bring the image of the prey onto both foveae). It is also possible that the lizard focuses the prey items with both foveae and is able to judge distance based on this accommodation. The temporal foveae seem to have a similar convexiclivate shape to the central foveae, and this shape has been hypothesized to be associated with very fine focus and distance perception (see below).
4 Distance perception
The capacity to estimate the distance to various objects or locations in the habitat is critical for nearly all lizards, yet the basis (and/or limits) of this capacity have been studied only in a small number of species. There are two distinct contexts in which most lizard species need to be able to accurately estimate distances. Long range (typically more than one body length) distance perception is important for activities such as leaping between perches, assessing the threat posed by predators, or territorial or other social interactions. Short range distance perception -- typically over distances less than one body length away -- is required for close range activities such as prey capture.
4.1 Short-range distance estimation
When lizards prepare to lunge at a nearby object such as a food item, they first usually face it directly (Moermond, 1981). Before attempting to capture the prey, they must precisely judge the distance from tongue tip to prey. For objects at close range small changes in distance will typically bring the object into and out of focus (Schaeffel, 1994). These changes in focus are corrected by accommodation (changing the curvature of the lens), which can provide a useful distance cue. Additionally, since the lizard is facing directly forward, it is typically viewing the object in a region where the visual fields of the two eyes overlap, raising the possibility of binocular depth estimation methods.
Close range distance estimation has been studied most extensively in chameleons. Chameleons capture their prey with a long-range ballistic tongue projection. They must accurately estimate distance to the prey item when they launch the tongue. They have a unique set of visual-system adaptions related to their unusual, specialized prey capture behavior (Ketter-Katz et al., 2020). They possess very large (for their head size) and highly mobile eyes that move independently. Each eye possesses a visual streak of high acuity along the midline and a convexiclivate central fovea. The two eyes can be simultaneously directed straight forward. Just before ballistically releasing its long tongue to attempt prey capture, it fixates on the prey with both eyes. It was thought that this might support stereoscopic estimation of prey distance, but it has been shown that even when fixated on a prey item, the relative position of the two eyes is too variable to allow for any type of binocular distance estimation (Ott et al., 1998). In a series of elegant experiments, it was shown that the precise distance to the prey is determined by the extent of accommodation required to bring the prey item clearly into focus (Harkness, 1977; Harkness and Bennet-Clark, 1978). The critical role of focus adjustment rather than binocular depth perception, was demonstrated by showing that (1) the animals could effectively capture prey with one eye covered, and (2) placing lenses in front of the eyes that changed the focus caused systematic and predictable errors in the position of the tongue strike. The function of directing both eyes towards the prey appears to be to improve the precision of the focus adjustment on which the tongue strike distance is based, and helps to position and center the mouth directly at the prey item (Ott et al., 1998).
The capacity to precisely judge distance based on accommodation requires a suite of specialized adaptations. First, the spatial acuity of the system must be very high. Chameleons have large eyes, and a very high density of photoreceptors cells (Ketter-Katz et al., 2020). Ott and Schaeffel (1995) showed that the chameleon eye has a heavily curved cornea, which brings light rays together sharply to a focus point in front of the retina, combined with a negatively powered lens that brings the image into focus on the retina. This optical arrangement shifts the posterior nodal point towards the front of the eye and substantially increases the image size on the retina, which is presumably useful for fine focus discrimination. Harkness and Bennet-Clark (1978) argued that in chameleons the convexiclivate fovea serves as a fine focus indicator by exaggerating small changes in focus over a tiny area in the retina, thus allowing the chameleon to rapidly make very precise adjustments in response to changes in the position of the object.
To what extent are adaptations seen in chameleons relevant to other species? Only one other species has been studied in detail. Texas horned lizards (Phrynosoma cornutum) capture prey (mainly ants) by running to within a short distance, and then using a short-distance tongue strike. They can strike at prey accurately with one eye covered. In this condition, placing an external lens in front of the eye that changes the focus location of the prey causes predictable misses in tongue strikes. These results show that they can use accommodation for distance estimation. However, in additional experiments, focus-distorting lenses were placed on both eyes. In this case the lizards were still able to capture prey accurately. This shows that they have the capacity to rely on some form of binocular distance estimation as well as accommodation, since in this case focusing on the prey items would cause an error in distance estimation (Ott et al., 2004).
The results from chameleons and Texas horned lizard suggest that the use of focus/defocus to judge distance may be common. Some form of binocular processing probably also plays a role. Nearly all lizard species have an area of overlap of the visual fields of their two eyes toward the front. Based on work with birds (McFadden, 1994) the likeliest binocular cues are vergence – the extent to which both eyes must bend inward to fixate on a single object in the forward-looking binocular field (Tresilian and Mon-Williams, 2000) – or some form of retinal disparity, in which the separation of the position of the same object viewed in both eyes is analyzed by the brain.
4.2 Long-range distance estimation
In nearly all lizard species the eyes are positioned laterally, with most of the visual fields of the two eyes non-overlapping, and the two eyes move independently. Long range distance perception, therefore, almost certainly relies on monocular vision. Steinberg and Leal (2013) provided evidence that the capacity exists in Anolis gundlachi. They showed, experimentally, that the visibility and effectiveness of vertical motion patterns, such as those used in push-up displays, were maximal when they covered a certain visual angle on the viewer’s retina. For a given movement amplitude, this visual angle depends the distance from signaler to viewer. In the field, they presented tethered stimulus males to territorial males at a range of different distances and recorded the resulting aggressive motion displays. The displaying lizards adjusted the motion amplitude of their displays depending on the distance to the stimulus lizard and usually produced the most effective range of amplitudes to stimulate the receiver visual system. To make this adjustment of display amplitude correctly, the displaying lizard must be able to judge distance to the intended receiver. Long range depth perception is also necessary for accurately judging the true size of images. It has been argued, for example, that dewlap size in some anoline species is an “honest” indicator of fighting ability (e.g. Henningsen and Irschick, 2012). The size of the image created by an object changes with distance. Therefore, estimating the size of a competitor's dewlap requires that capacity to judge its distance from the viewer.
There is no direct evidence concerning what combination of monocular cues lizards use to assess distances greater than one body length away. Motion parallax, in which head movements will cause nearby objects to move by different amounts and in different directions than distant objects is probably important. Lizard frequently make small up-and-down head movements, and it has been hypothesized that these movements could generate useful parallax cues (Jenssen and Feely, 1991; Torr and Shine, 1994). Other likely cues are the relative size of known objects, the general tendency for distant objects to appear smaller, linear perspective, height of objects on the retina (for animals living in relatively flat environments) and the position of objects in front or, in back, of others (Davies and Green, 1994; Zeil, 2000). Accommodation cues are typically not useful over longer distances, because even rather large changes in the position of far-off objects produce very little change in focus (Schaeffel, 1994).
Analysis of lizard depth perception over long and short ranges is a fascinating area that has received very little attention, and is likely to be a rewarding area for future study.
5 The retinal basis of color and brightness perception
The retinal cones are responsible for the perception of two distinct aspects of visual stimuli that are processed by different areas within the brain: color and brightness. Color refers to perceived chromatic properties of different visual stimuli. Perception of color is based on the relative stimulation of different classes of cones. Here I use the term brightness to refer to perceived intensity of a visual stimulus. The relationship between stimulus color and its perceived intensity (brightness) is known as a luminance. A luminance function is a plot of stimulus wavelength versus relative perceived intensity. The luminance function can be determined with either electrophysiology (ERG) or behavior. Studies on anoles have shown these two methods to yield similar results (Fleishman and Persons, 2001). Among vertebrates, perception of spatial detail and motion is largely based on a luminance channel in the visual system, with a measurable spectral response curve. In lizards the capacity to detect fine detail and motion is based on the stimulus-background contrast in the luminance channel (Fleishman and Persons, 2001). The input to the luminance channel comes from a single class of cones (see below).
Each cone possesses, within its outer segment, visual pigment molecules that capture photons of light and convert them to neural signals. The probability of capture of a photon by a cone depends on the spectral absorption characteristics of its pigment. The spectral absorption functions of the different cone visual pigments are fairly broad and consistent in shape (Figure 4). The spectral sensitivity of each pigment can be specified by its peak absorption wavelength, referred to as λmax. With a knowledge of λmax one can calculate the shape of the full spectral absorption function (Lamb, 1995; Govardovskii et al., 2000). The majority of cones also contain an oil droplet filter, positioned just in front of the visual pigment, through which light rays must pass to reach the pigment in the outer segment. An exception to this is that one member of the pair of double cones (described below) contains a dispersed filtering pigment in the same location, that appears to function in the same manner as an oil droplet (Loew et al., 2002).
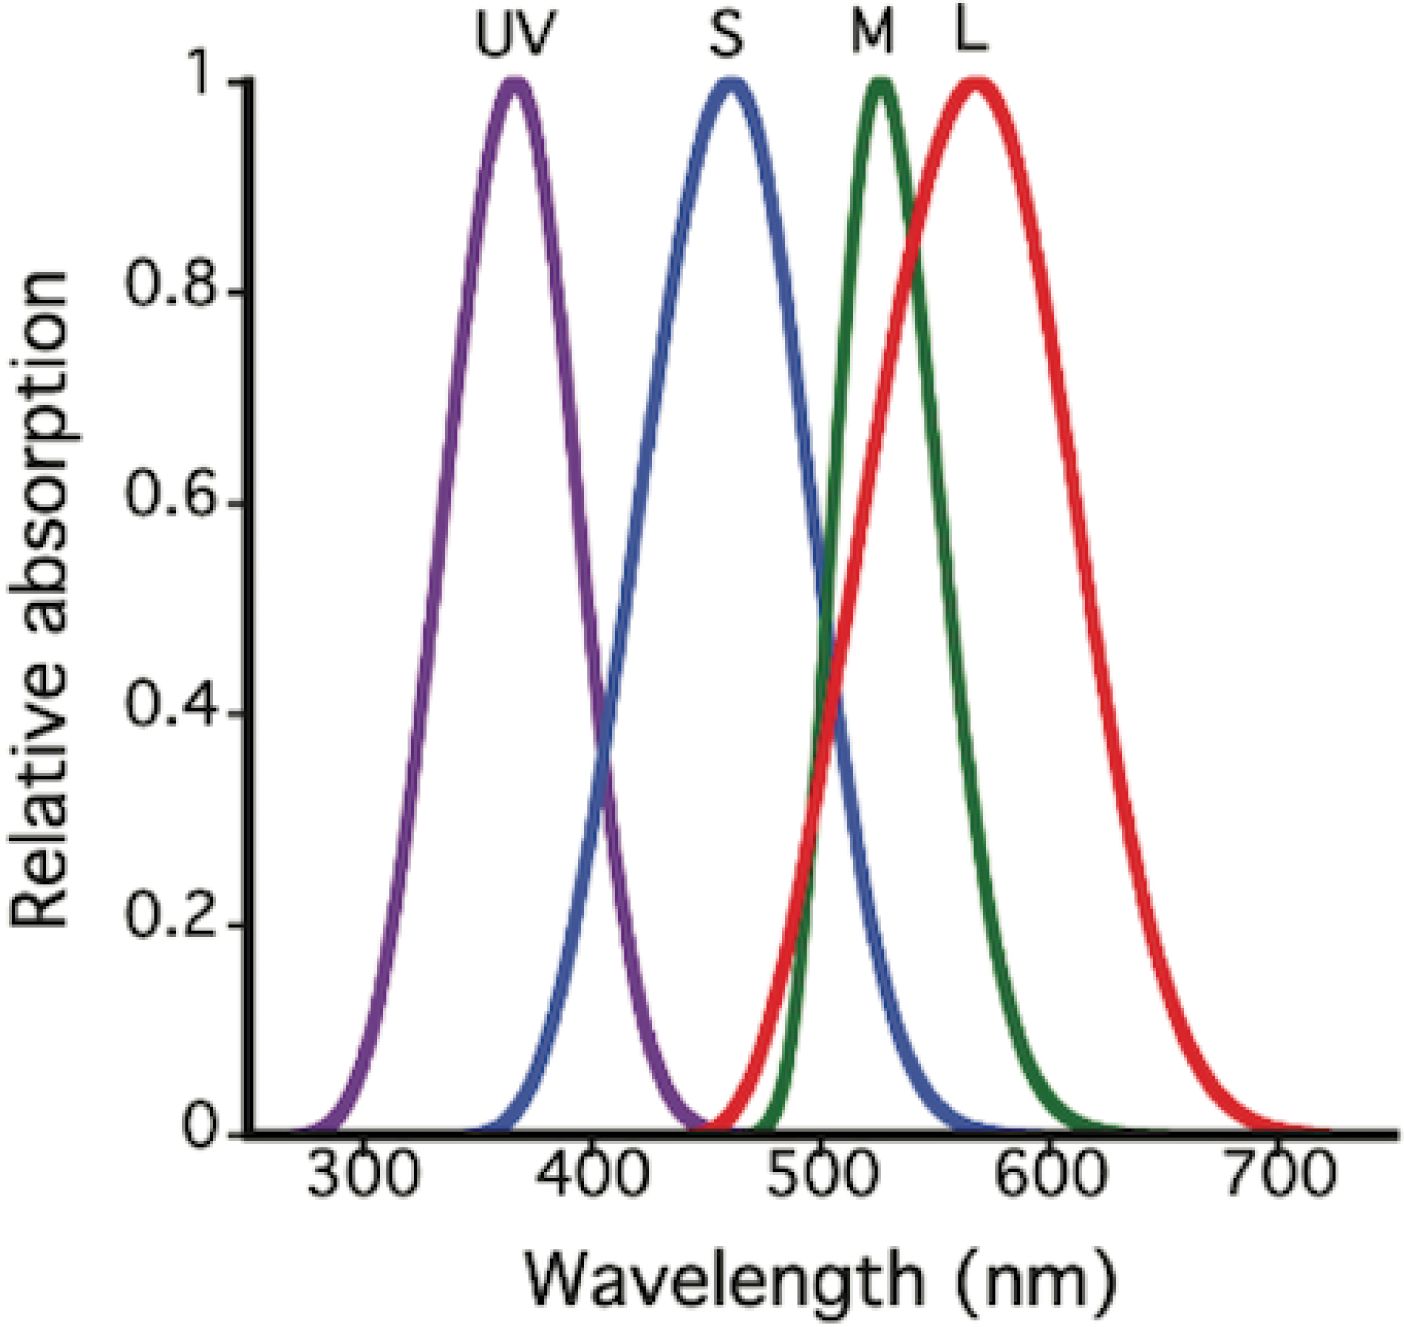
Figure 4. Relative spectral absorption curves, normalized to a peak value of 1.0 for the cone outer segments of Anolis sagrei. These curves are based on λmax values of pigments and oil droplets reported in Loew et al. (2002). Pigment functions are modeled following Lamb (1995). The effects of the oil droplets were modeled based on procedures described in Hart and Vorobyev (2005).
The spectral tuning characteristics of photoreceptor pigments and oil droplets can be measured by microspectrophotometry (MSP), which involves shining a narrow beam of light through the outer segment or oil droplet of isolated photoreceptors and measuring transmission/absorption as a function of wavelength (Loew et al., 2002).
All lizard species appear to have two morphologically distinct cone types: single and double. The single cones are believed to mediate color perception (Fleishman et al., 2022). The function of the double cones is not known for certain. They consist of two paired cells: a principal and an accessory cone. They are found in a wide variety of vertebrate eyes (but not mammals) and are usually the most common type of cone in the retina. It has been hypothesized that the double cones of birds are responsible for the perception of luminance, and thus underlie perception of spatial form and motion (Osorio and Vorobyev, 2005; Hart and Hunt, 2007). It is probable that the double cones serve the same role in lizard eyes (Olsson et al., 2013). In lizards the spectral absorption curve of these double cones matches the spectral sensitivity of the luminance function (Fleishman and Persons, 2001). It has also been hypothesized that double cones might play a role in polarized light perception (e.g. Underwood, 1970; Chetverikova et al., 2022). While a role for polarized light perception in orientation has been demonstrated for some lizard species, the perception is based on stimulation of the parietal eye. Polarized light perception by the eyes and visual system has not yet been demonstrated in any lizard species (Beltrami et al., 2012).
The perception of color in lizards is based on the relative stimulation of the different single cone types found in the retina. Based on λmax values, all lizard species that have been studied have been shown to possess either three (in the case of geckos), or four, different classes of pigment. Cones with pigments in the following ranges are regularly found: “UV” (ultraviolet, λmax 350–385 nm), “S” (short wavelength, λmax 440–475), “M” (middle wavelength, λmax 485–503), and “L” (long wavelength, λmax 521–625). Typical absorption spectra of a lizard eye is shown in Figure 4.
The oil droplets found in most cones act as long-pass filters capturing photons of wavelengths considerably shorter than λmax before they reach the pigment. In this way they sharpen the spectral tuning of the individual cones. The oil droplets appear to have different colors, due to differences in their spectral transmission properties. In diurnal species UV cones are always paired with droplets that are clear down to very short wavelengths. S cones are paired with droplets that block light in the ultraviolet range. The M and single L cones are associated with two different types of oil droplets that cut out different ranges of short wavelengths. Double cone principal cells are always paired with yellow oil droplets that cut off a small portion of the short wavelength end of the curve, while the accessory member has a dispersed pigment with similar filtering properties below its outer segment. The importance of the specific pairing of oil droplets of different types with different pigments is not well understood. Oil droplet properties are quite variable within and between individuals (Loew et al., 2002; Fleishman et al., 2011). Nocturnal species often lack colored oil droplets.
5.1 Visual pigments of geckos
As described above, the majority of lizard species share the same basic sets of cone photoreceptors: four types of single cones and one class of double cones. Geckos (infraorder Gekkota), however, are unusual among lizards. They evolved from diurnal ancestors into a completely nocturnal group. Subsequently a number of diurnally and arrhythmically (active night and/or day) active species evolved from nocturnal ancestors (Gamble et al., 2015). These steps produced evolutionary alterations in their retinal photoreceptors. Historically the ancestors of geckos had retinas based on cones and cone-pigments. In the course of evolving nocturnality it is hypothesized that the cones evolved into morphologically rod-like photoreceptors (Walls, 1942) that utilized cone pigments, a condition that is maintained in present-day nocturnal geckos. The diurnal geckos retained the same visual pigment types, but their photoreceptors have evolved back into typical diurnal cones in morphology (Kojima et al., 2021). Nocturnal geckos have retained three of the five pigments usually found in lizard retinas: UV, M and L (Loew, 1994; Loew et al., 1996). These pigments have evolved specializations associated with nocturnality: much lower spontaneous noise levels and much greater sensitivity to low photon flux rates than typical cone pigments. Diurnal gecko species have retained the same three basic photoreceptor pigment classes (Ellingson et al., 1995). In diurnal geckos the visual pigments have evolved the properties typical of cones, making them suitable for use in daylight.
6 Genetics of visual pigments
Genes have been sequenced and expressed in a number of species and a remarkably uniform picture emerges. Across all lizard species except for geckos, five classes of opsin genes have been identified (Yokoyama and Yokoyama, 1996). All are present in most lizard species as well as other terrestrial vertebrates including birds, turtles and crocodilians. Moreover, variants of these genes have been identified in various ancestral fish lineages. Each gene is associated with a typical range of λmax values. The UV cones are coded for by the gene “SWS1” (short-wavelength sensitive 1), the S cone by “SWS2” (short-wavelength-sensitive 2), the M cone by “RH2” and the L cone by “LWS” (long wavelength sensitive). In addition, a gene has been found in most lizard retinas tested (but not geckos; Kojima et al., 2021) called “RH1” that encodes a middle wavelength pigment that is, in many non-lizard vertebrate species, found in rods (Kawamura and Yokoyama, 1997).
The role of RH1 in the lizard retina is unclear (Loew et al., 2002; Baden and Osorio, 2019). Although most lizard retinas express five pigment genes, MSP generally reveals the presence of only four pigment λmax values. It has been suggested that each M cone expresses either the RH2 gene or the RH1 gene (Loew et al., 2002; Baden and Osorio, 2019). Nagloo et al. (2022) used immunohistochemistry to identify the presence of RH1 within 17% of retinal cones in the lizard Tiliqua rugosa. RH1 (and 4 other opsins) have been found in Ctenophorus decresii (Dong et al., 2019) and Anolis carolinensis (Kawamura and Yokoyama, 1998).
It is interesting that none of the gecko photoreceptors, which, in the nocturnal forms, are the most rod-like in physiology and appearance of any lizard photoreceptors, express the rod pigment gene RH1, while most other lizards do. Geckos appear to have lost the RH1 and SWS2 genes during the fully nocturnal part of their ancestry but have retained the other three (Kojima et al., 2021).
MSP sampling of lizard retinas is quite challenging and in some instances investigators have not been able to find all photoreceptor pigment classes. The determination of the opsin genes found in lizard retinas has proven to be useful in determining what classes of cone are present in lizard retinas in these cases. For example, Dong et al. (2019) showed that although UV cones were not revealed by MSP in Ctenophorus species (Barbour et al., 2002), molecular techniques revealed the presence of SWS1 gene expression in the retina, which strongly supports the presence of UV photoreceptors.
7 Sources of variation in lizard photoreceptors
In order to understand ways that the visual systems have become adapted to habitat light and visual tasks, it is important to understand the possible ways that cones may vary. The λmax of any pigment can be shifted by various point mutations along the opsin protein sequence, with the result that there is some modest variation among vertebrates in the λmax values of the pigments encoded by the different genes.
A second potential source of variation is differences in the relative numbers of the different cone classes in a retina, which can influence color vision in specific spectral regions, by making the eye more sensitive to specific regions of the spectrum, or more sensitive to small color variations in specific regions of the spectrum.
A third source of variation arises from changes in the oil droplets associated with specific cone pigment combinations, since oil droplets filter the light reaching the photopigment and thereby alter their spectral response. Oil droplets are the most variable element of the color vision system. Differences have been observed between closely related species, and changes in light environment or diet have been observed to change oil droplet properties in some bird species (Hart et al., 2006). The relationship between specific oil droplets and particular pigments also appears to be variable within a single individual. The impact of variations in oil droplets on overall color perception in lizards is poorly understood (Loew et al., 2002).
A visual pigments consist of a protein opsin bound to a chromophore based on vitamin A. A fourth mechanism that generates variation in photoreceptor spectral response is the existence of two different chromophore molecules that have been found in visual pigments. The large majority of lizard visual pigments are based on a vitamin A1chromophore. However, a few examples have been found of species in which the retina contains a mixture of A1 and A2 chromophores -- probably in different cones (Provencio et al., 1992; Bowmaker et al., 2005; Martin et al., 2015). In one known case, the visual pigments of Anolis carolinensis are based entirely on vitamin A2 (Provencio et al., 1992; Loew et al., 2002). A change in chromophore from A1 to A2 shifts the λmax of the visual pigment to a longer value. The effect is more pronounced on longer wavelength λmax pigments.
8 Behavioral evidence of color vision
Given the presence of multiple spectral classes of cones in the retina, and the wide range of body colors used in social interactions, it would be surprising if lizards did not exhibit excellent color vision across the entire visible spectrum. However, clear behavioral demonstrations are rare. Demonstrating animal color vision, independent of brightness perception, typically requires lengthy conditioning experiments, in which animals must learn to select stimuli of a certain color and distinguish it from other color or achromatic stimuli presented over a wide series of intensities. Lizards are quite capable of learning and there have been many experiments demonstrating this capacity (Leal and Powell, 2012; Szabo et al., 2021), but they are not easy subjects to use in such experiments. Never-the-less there are a few examples of experimental demonstrations of color-based discrimination based on behavioral conditioning.
Wagner (1932) used trained responses to food to demonstrate the capacity of Lacerta vigilis to discriminate a wide range of colors across the spectrum. Benes (1969) showed that whiptail lizards (Cnemidophorus tigris) could be trained to reject or accept food based on background color (red or green). Once trained, they were able to discriminate colors that were increasingly similar to one another on a Munsell color scale. Pérez i de Lanuza et al. (2018) demonstrated the ability of the common wall lizard (Podarcis muralis) to discriminate among various biologically relevant hues (orange, yellow, white, gray), and discriminate all from a gray stimulus of comparable luminance. Roth and Kelber (2004) used behavioral conditioning with effective controls to demonstrate that a nocturnal gecko, Tarentola chazaliae, was capable of distinguishing blue from gray under low light conditions (below the intensity threshold for human color vision). To date, however, there are no examples of conditioning-based studies that have conclusively demonstrated the full range of color vision capacity in any species (Jacobs, 2018).
Attentional gaze shift has been used as an assay for color detection in Anolis (Fleishman and Persons, 2001; Fleishman et al., 2016). In these experiments lizards were presented with moving stimuli in their visual periphery, and the probability of an attentional gaze shift towards the novel stimulus was recorded. The stimuli consisted of a colored background (either uniform or variable in brightness), and a colored square that was moved into place in front of it. The relative color and intensity of the background and stimulus square were systematically varied. These experiments proved to be particularly useful because the photoreceptor classes were known (from MSP) and it was possible to establish a quantitative relationship between probability of detection and the relative stimulation of the different color-sensitive elements of the retina. It was found that detection probability was a simple additive function of the absolute value of stimulus-vs.-background luminance (i.e. brightness) contrast plus the chromatic contrast, measured as a distance in chromatic color space between stimulus and background.
Two different approaches have been used to quantify chromatic contrast in analyzing these results (i.e. the perceptual distance between different color stimuli independent of brightness). One approach was to plot the relative stimulation of the different cone classes by each stimulus color in a “tetrachromatic color space.” It was then possible to calculate a Euclidian distance in this space. Fleishman and Persons (2001) found that this distance between stimulus and background correlated well with the probability of detection, and was thus an effective measure of chromatic distance. An alternative approach that has been widely applied is to use a “receptor noise limited” (RNL) model. In RNL modeling, in response to a colored stimulus, the relative response of each cone type is calculated. However, since photon flux rates vary through time, the response of each cone type will vary in a statistically predictable manner. This inherent noise in each photoreceptor is taken into account. The same calculation is carried out for a second color stimulus. One can then calculate whether or not the two stimuli can be reliably distinguished, or whether the noise (i.e. statistical variation in photon capture) arising from each of the two stimuli makes them indistinguishable. Two color stimuli that are just discriminable (i.e. no overlap of the noise associated with each) are said to be one “Just Noticeable Difference (JND)” apart. This approach has been shown to accurately estimate color discrimination thresholds (Vorobyev and Osorio, 1998; Osorio et al., 2004) In addition, it has been shown – using detection experiments like those described above – that the probability of detection of a colored stimulus against a colored background is directly proportional to the distance between the stimulus and background in units of JND (Fleishman et al., 2016; 2020). Thus the RNL model can be used to estimate chromatic distance in the detection estimates. The RNL model has the further advantage that it can be used to model the effect of different densities of different photoreceptor classes in the retina (relatively greater density of photoreceptors reduces the noise in that channel) and it can also be used to model the effects of relatively low light level, which increases receptor noise (Olsson et al., 2018; Fleishman et al., 2020).
Using this approach (Fleishman et al., 2016, 2020) were able to demonstrate that anoline lizard detection of a colored stimuli against a colored backgrounds can be accurately predicted as a sum of luminance contrast and chromatic contrast, using chromatic distance (in units of JND) from a RNL model to estimate the latter.
9 Adaptations of the visual system to different habitats
Two factors dramatically affect the typical light conditions in which lizards use their visual systems: the time of day of activity and the vegetation structure of the microhabitat. The latter variation influences light in two ways. Different physical habitat types and vegetation structure result in distinctly different visual backgrounds (e.g. green vegetation versus sand and rock). The structure of overhead vegetation determines the extent of shade and nature of ambient light. Here we consider the impacts of these differences and review the evolutionary adaptations that have resulted.
9.1 Adaptations to differences in total light intensity: nocturnal versus diurnal habit
Most lizard species can be classified as either primarily photopically active (during the day) or scotopically active (during the night), with a few that are in between (Hall, 2008). Ancestrally, all lizards were originally photopic, and at present the large majority of species are photopic. Most of the scotopic species are in the infraorder Gekkota, although are also a few genera of Scincidae and potentially some Xantusidae (Hall, 2008). The major evolutionary challenge for the change to a scotopic lifestyle is the need to drastically increase visual sensitivity, without too great a loss of acuity. In addition, scotopically-active animals sometimes need to function during the day (for escape, for example), so they must have a mechanism to moderate their extremely high sensitivity when exposed to photopic conditions. Potential evolutionary modifications to support scotopic activity include changes in the eye size and shape, changes in the pupil, changes in the size and density of retinal photoreceptors, and changes in the photoreceptor pigments.
As described earlier most nocturnal terrestrial vertebrates possess a large pupil, and a large thick lens that creates a relatively small image on the retina, with a high intensity per unit area (Figure 3). Hall (2008) studied eye size and shape, corrected for body size and phylogeny, in 116 species, including scotopic and photopic geckos (infraorder Gekkota) and a variety of other lizard species (photopic and scotopic) from eleven distinct clades. She measured the ratio of the corneal diameter to the axial length (the distance from the front of cornea to the retina along the central optic axis) of the eyes. She predicted that this ratio should be significantly higher in scotopic lizards, as is the case in other, non-lizard, nocturnal vertebrates. She also directly compared axial lengths as an estimate of overall eye size. She determined that the corneal diameter-to-axial-length ratio was significantly greater for scotopic species as predicted. She found no significant difference between the photopic or scotopic groups in axial length of the eye. Thus, she concluded that the main adaptation of eye anatomy for scotopic vision in lizards is an increase in the light capture by enlargement of the cornea and pupil, accompanied by a large lens that creates a smaller, more intense image on the retina. In contrast, photopic geckos have an eye shape that is very similar to other photopic lizards. They possess a small round or oval pupil, and a corneal diameter and lens shape that is similar to other diurnal lizards. The photopic geckos evolved from scotopic ancestors, so that the similarity of their eye and pupil shape to other diurnal lizards represents convergent evolution.
Most scotopic lizard species possess slit-shaped pupils that can open very wide. When these pupils close there are typically several small round notched openings, which act like pinhole cameras. These small holes form a greatly reduced-intensity image that can be processed effectively by the highly sensitive retina, allowing these animals to be active in the daylight if needed (Walls, 1942; Land and Nilsson, 2012). It has been proposed that this pupil design may also facilitate depth perception under photopic conditions (Murphy and Howland, 1986). As described above, degree of focus or defocus appears to be, in at least some species, an important distance cue, particularly for prey capture. This works best when the depth of focus is quite small, so that small changes in distance produce a detectable change focus. A nocturnal gecko with its wide-open pupil and broad cylindrical lens will tend to have a fairly small depth of focus (because the cone of rays arriving from each stimulus point will be wide and small changes in position of the stimulus will cause the light cone to fall over several photoreceptors). Murphy and Howland (1986) pointed out that when the pupil is closed down in daylight, the multiple pinhole openings in the pupil will create a single image on the retina only if the object is in focus. If an object is not in focus, even by a small amount, a series of displaced images will appear on the retina – with each pinhole producing an image at a different location. Thus, the series of pinhole openings in the pupil could provide a sensitive measure of defocus that might be useful for distance estimation of close-range objects.
There are also differences between scotopic and photopic geckos in the retina itself. The photoreceptors of scotopic species resemble rods in their morphology (Röll, 2000; Kojima et al., 2021). The outer segments are quite long and large in diameter (up to 10 µm), which greatly increases their photon-capture efficiency. By comparison photopic geckos have photoreceptor cells that have cone-like morphology with outer segment diameters of 1.3–2.1 µm (Röll, 2000). Scotopic geckos lack a fovea, while photopic geckos typically possess temporal foveae. Interestingly, in both scotopic and photopic forms, there is very little pooling of photoreceptor inputs into ganglion cells, which, in other vertebrates is a typical method for increasing sensitivity in low light (Röll, 2000, 2001). This indicates that, although they require very high sensitivity, they are also adapted to maintain reasonably high visual acuity even in low light.
The photopigments found in scotopic gecko photoreceptors are evolutionarily derived from those of ancestral photopic species. They are typical of cone pigments in structure but have evolved much lower spontaneous noise and much greater sensitivity (Kojima et al., 2021), which is typical of rods.
Some authors have hypothesized that in addition to the larger pupil, cornea and lens found in nocturnal lizards, the overall size of the eyes of scotopic species should be greater than those of diurnal lizards (Werner and Seifan, 2006; Schmitz and Higham, 2018). The typical measure of “overall eye size” is axial length. Hall (2008), found no difference between scotopic and photopic lizard eyes in axial length. Schmitz and Higham (2018) compared the “anteroposterior” eye diameters of 99 gecko species and found that overall, nocturnal species possess larger eyes. However, when they examined nine evolutionary transitions from nocturnality to diurnality they found that in only two cases were these associated with a reduction in eye size. These results suggest that there may be some relationship between axial length and diel pattern, but not a particularly straightforward or convincing one.
In fact, it is not completely clear why larger eyes in scotopic geckos would be expected. As illustrated in Figure 2, scaling up the eye size does not increase the image brightness. An argument can be made that the reduction in image size that occurs in the typical nocturnal eye (Figure 3), combined with the larger diameter photoreceptor outer segments required for sensitivity, results in a substantial decrease in acuity. This could be compensated for to some extent by a larger axial length eye, which will increase image size. However, diurnal species are also presumably selected for maximum acuity, and selection should favor increased eye size in these species as well. Thus, the reason why nocturnal geckos sometimes (but not always) exhibit larger eyes remains unclear.
9.2 Fossorial lizards
Burrowing lizards are expected to experience low light conditions and limited visual fields. It seems reasonable that they would show greatly reduced visual capacity, or adaptations to low light. Retinal and ocular anatomy has been studied in a few burrowing species (Underwood, 1970; Canei et al., 2020). In general, the eyes are smaller and in each case the eye is protected by a clear scale called a spectacle (Underwood, 1970). The shape of the eyes is typical of a diurnal species. Photoreceptor diameters are larger (ca. 4 µm in the center, 6 µm in the periphery compared to ca. 1 µm in Anolis) than in non-burrowing diurnal lizards and they lack a fovea. Where examined, it has been found that the ratio of ganglion cells to photoreceptors is near 1:1 in the center of the eye and a bit lower in the periphery. A ratio like this is associated with a relatively high acuity eye. The cones possess oil droplets like a typical diurnal lizard. Overall, the eyes seem typical of diurnal lizards, with a somewhat reduced acuity, and lacking a fovea.
9.3 Adaptations to differences in total light intensity: differences in shade in photopic lizards
While differences in habitat shade produce much less dramatic effects than differences between night and day, unshaded habitats in full sun experience light intensities that are several orders of magnitude greater than what is experienced in full shade (Fleishman et al., 1995).
Relatively few studies have examined the possibility that diurnally active lizards that occupy habitats that differ in light intensity have experienced adaptions of the visual system to these differences. Most carefully studied have been lizards of the genus Anolis. Figure 5 illustrates habitat spectra and total intensity for habitat localities occupied by three different species of Puerto Rican Anolis. The numbers at the top of each graph on the lefthand column indicate average side-welling irradiance values in units of µmol of photons per m2. Irradiance is a measure of the light striking a flat surface arising from a full hemisphere orthogonal to the measurement surface. Since the variable of interest was light striking the eyes, the measurement direction was oriented parallel to the ground so that it approximated the light striking the eye from all directions. As can be seen from the numbers in parentheses, light intensity increased by an order of magnitude moving from full shade to partial shade to no shade. The righthand column gives values of radiance, which is the light intensity measured over a small solid angle, and represents the light that forms the background against which objects would be viewed.
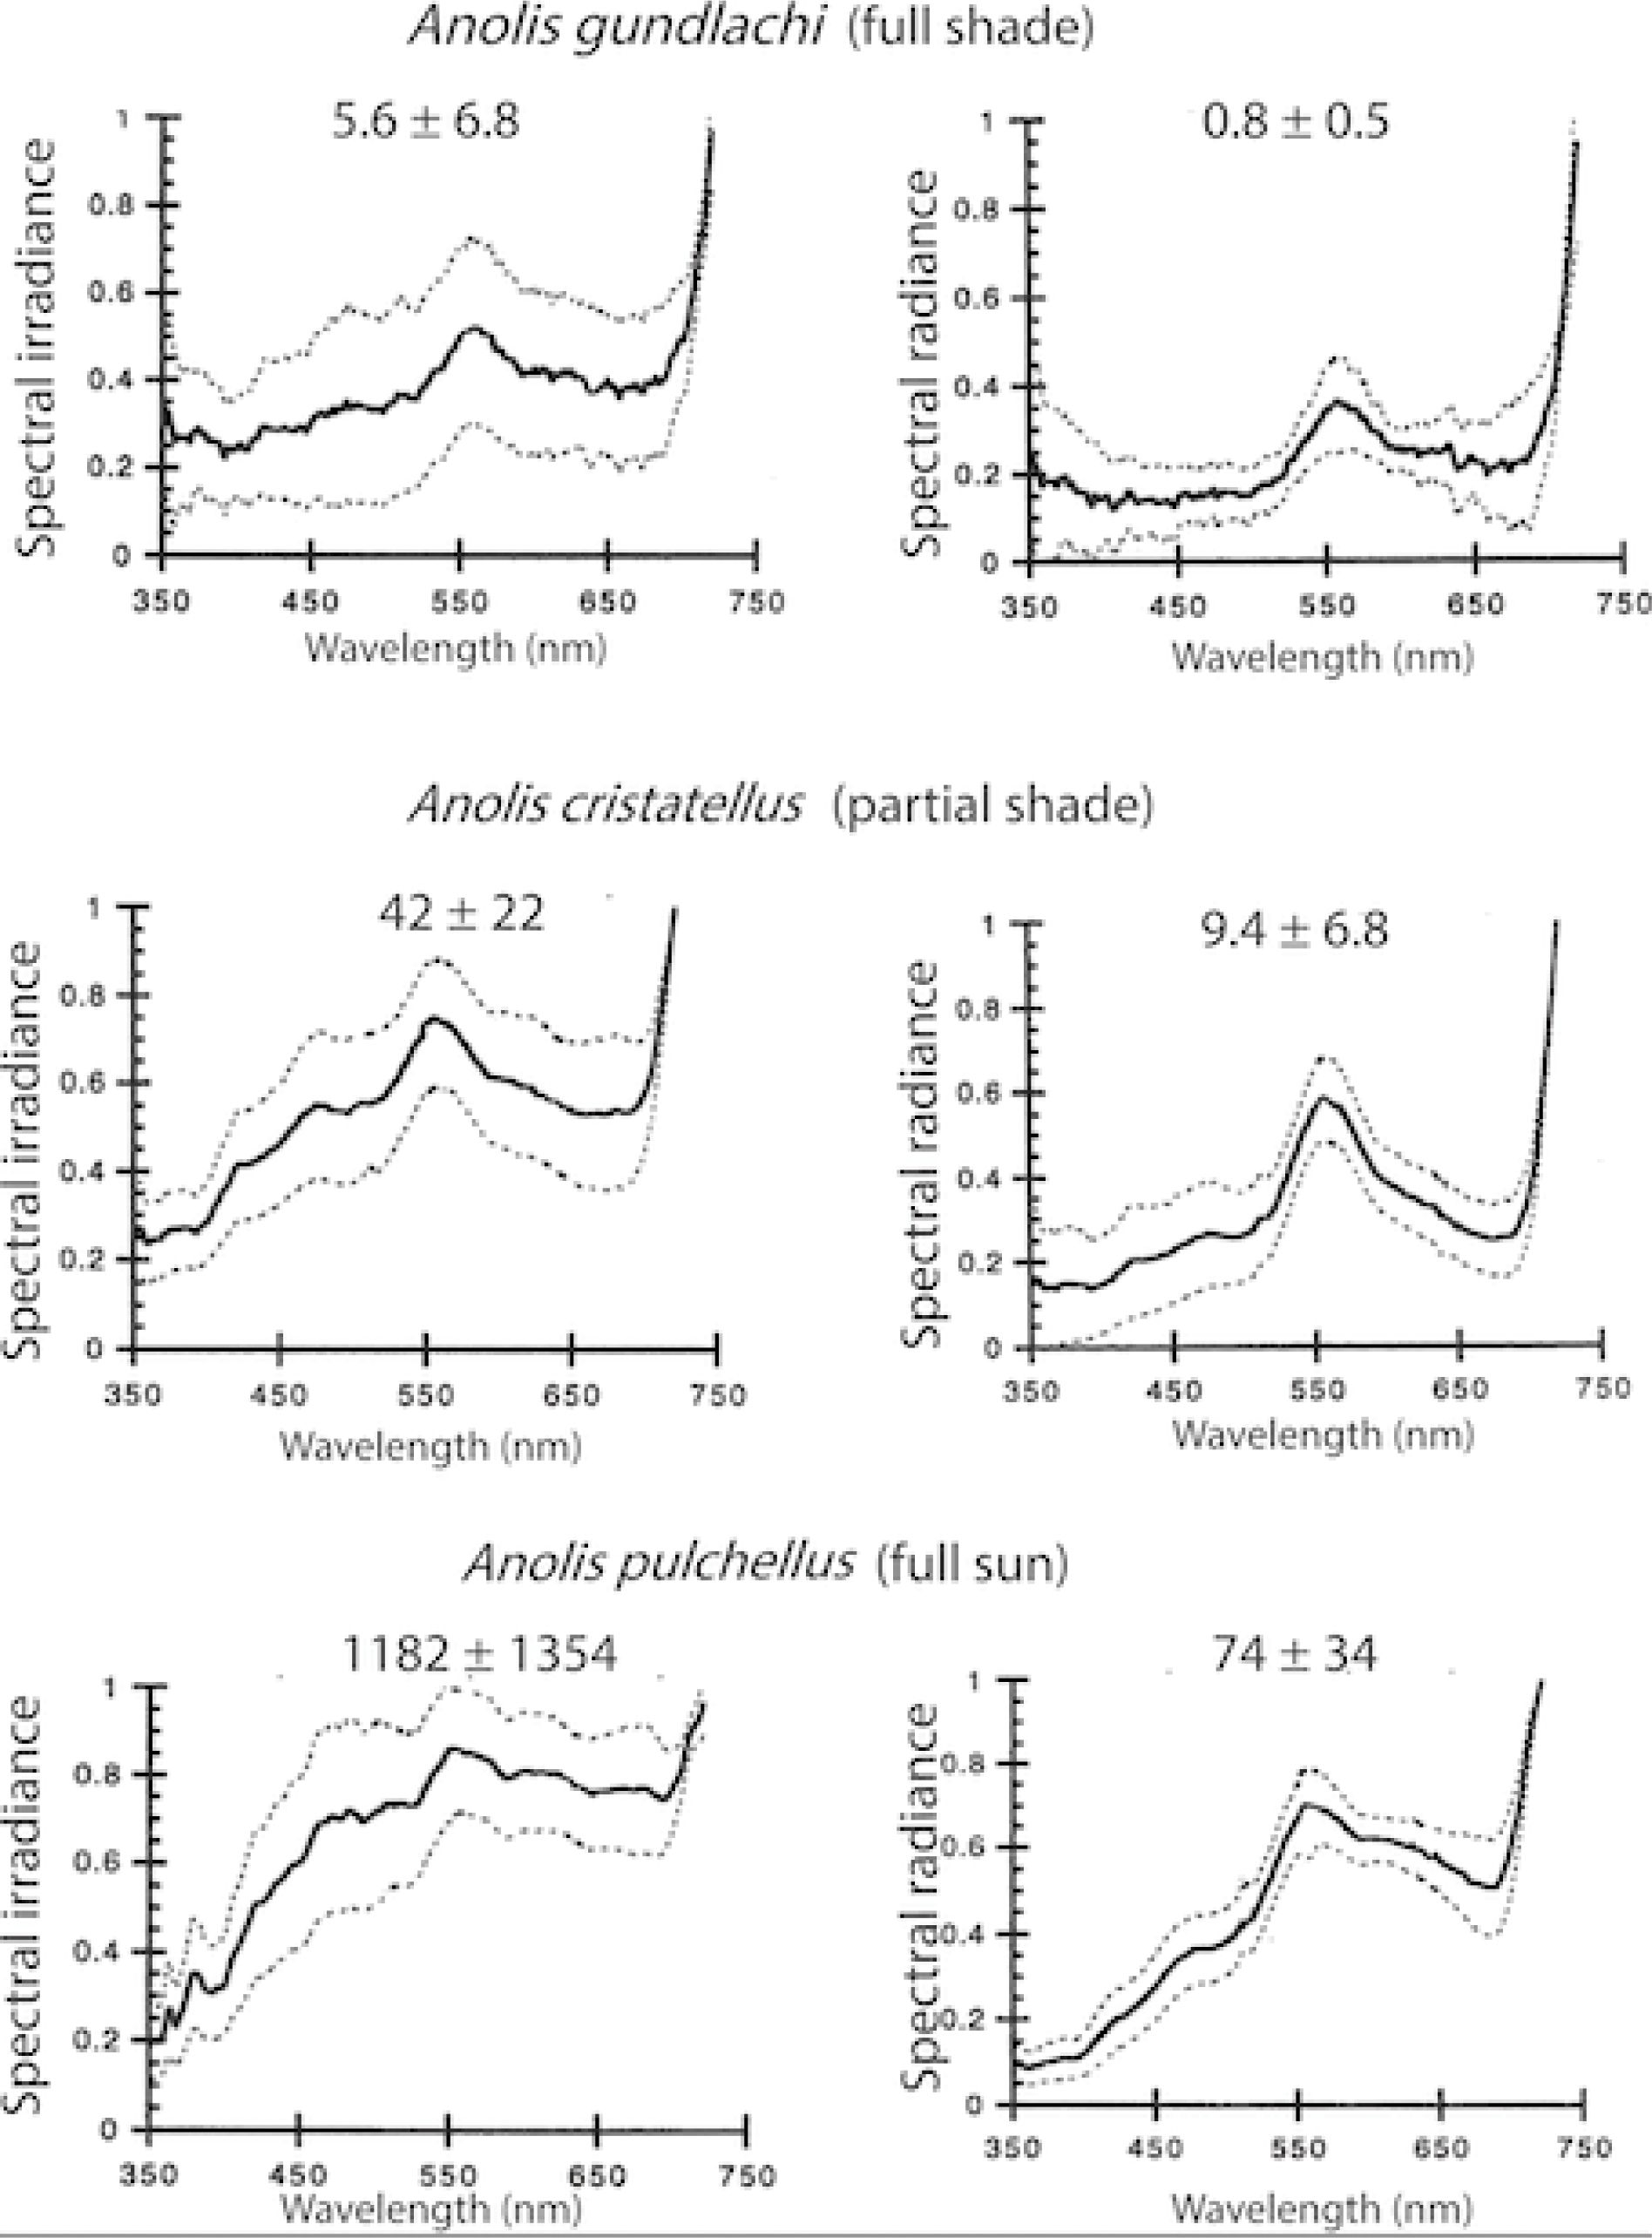
Figure 5. Average normalized irradiance spectra (µmol m−2 s−1 nm−1) on left, and average normalized background radiance spectra (µmol m−2 s−1 sr−1 nm−1) on right for three Puerto Rican Anolis species. Numbers at the top of each graph show average values (± 1 SD) measured at lizard locations. Anolis gundlachi inhabits heavily shaded forest understory. Anolis cristatellus inhabits forest edge partial shade. Anolis pulchellus inhabits unshaded grassy areas. From Fleishman et al. (1997).
Fleishman et al. (1997) used a black and white striped slowly rotating optomotor stimulus to test minimum detection thresholds as a function of light intensity in three species of Anolis: one from an unshaded habitat, one from partial shade, and one from heavily shaded forest understory (the three species shown in Figure 5). They found fairly small differences. The partial and full shade species had nearly identical low-light thresholds, while the threshold for the unshaded habitat species was slightly higher. This difference could conceivably be due to small differences in the size of photoreceptors or differences in the density of oil droplets. It would appear that the capacity of the visual system to adjust to average intensity through the process of light adaptation reduces selective pressure for larger scale adaptations of the eyes to function at different light intensities within the photopic range.
10 The influence of habitat spectral properties
One of the basic premises of visual ecology is that the anatomy and physiology underlying perception of colored stimuli has evolved in response to variations of natural habitat light spectra. For example, the spectral sensitivities of fish photoreceptors often match the dominant colors of the waters they inhabit (Lythgoe, 1979; Carleton, 2009; Osorio, 2019). Lizards occupy habitats that vary widely in the physical properties of the natural lighting and background. A key question is whether variations in color vision among lizard species reflect differences in the chromatic properties of their habitats and/or visual tasks.
The spectral quality of terrestrial habitat light depends on the natural substrate color (e.g. rocks, sand, lichens), density and nature of vegetation and shade, cloud cover, height in the forest, for arboreal species, and time of day (Hailman, 1977; Endler, 1993; Fleishman et al., 1997; 2022; Leal and Fleishman, 2002). Since responses of animal eyes to light stimuli are determined by the rate of photon capture it is useful to measure habitat light in quantal units: typically in µmol (of photons). The most useful habitat light measurements for studying lizards are (1) side-welling spectral irradiance (light striking a plane surface emanating from a full hemisphere normal to it, with the surface oriented perpendicular to the ground), which characterizes the light striking the eyes as well as the light illuminating objects and surfaces in the habitat and (2) the spectral radiance (light emanating from a small area of surface), to characterize the color of specific objects as well as background against which stimuli are viewed. Fleishman et al. (1997) measured side-welling spectral irradiance and background spectral radiance in naturally-observed locations of six different species of anoline lizards in Puerto Rico (three of which are illustrated in Figure 5). Unshaded habitats exhibited a spectrally broad, sunlight-based, irradiance spectrum. The irradiance spectrum of partially shaded habitats included a mix of blue and ultraviolet light from the sky and green light reflected from vegetation. Forest understory habitats exhibit a greenish peak, dominated by the spectrum of chlorophyll reflected from leaves and other vegetation. Height within the forest also impacted habitat spectral quality, transitioning from heavy shade, to partial shade to a fairly open habitat as one moved up towards the canopy. Background spectral radiance in all of these anoline habitats was similar: dominated by green vegetation, except for the upper canopy where the background contained blue and white patches (skylight) as well (Fleishman et al., 1997).
While many lizard species live in heavily vegetated habitats, a number occupy sandy or rocky habitats or habitats with other types of vegetation (Leal and Fleishman, 2002; Mclean et al., 2014; Nagloo et al., 2020) that experience other kinds of visual backgrounds. The irradiance of such habitats tends to resemble the spectrum of sunlight (high intensity across all wavelengths) and exhibit greater total intensity. The radiance of these more thinly vegetated habitats typically exhibits a broader, flatter spectra than those recorded in moist tropical habitats. Arid, lightly vegetated backgrounds often reflect a great deal of ultraviolet, while green vegetation generally absorbs most ultraviolet (Leal and Fleishman, 2002). Thus habitat light experienced by different photopic lizard species can be expected to vary from low intensity, green-dominated spectra of forests to broad sunlight dominated spectra of desert and rocky areas. Low vegetation areas will exhibit background spectra determined by the dominant color of the soil, rock or sand in the area.
11 Comparative analysis of visual pigments across species in relation to habitat light
The most comprehensive study to date of visual pigments in lizards focused on anoline lizards. Results are summarized in Figure 6. Loew et al. (2002), used MSP to analyze photoreceptor pigments in 17 species of Anolis and one close relative (Polychrus marmoratus). The species examined represented five different monophyletic clades and occupied a full range of habitat shade conditions from dark forest understory, to unshaded grass, and forest canopy. Sixteen of the seventeen anoline species and Polychrus had vitamin A1 based pigments, while a single species -- A. carolinensis -- had vitamin A2-based pigments. In all but four anoline species, cones with four different visual pigment λmax values were found. In four instances, no UV pigment was found, but this was probably due to sampling limitation since UV cones were the rarest type in all species examined, and are typically difficult to find in lizard retinas. All of the species of Anolis, except for one, exhibited very similar sets of retinal cone pigments. Anolis carolinensis with its vitamin A2-based chromophore, exhibited a notable shift in the λmax values of its pigments to longer wavelengths.
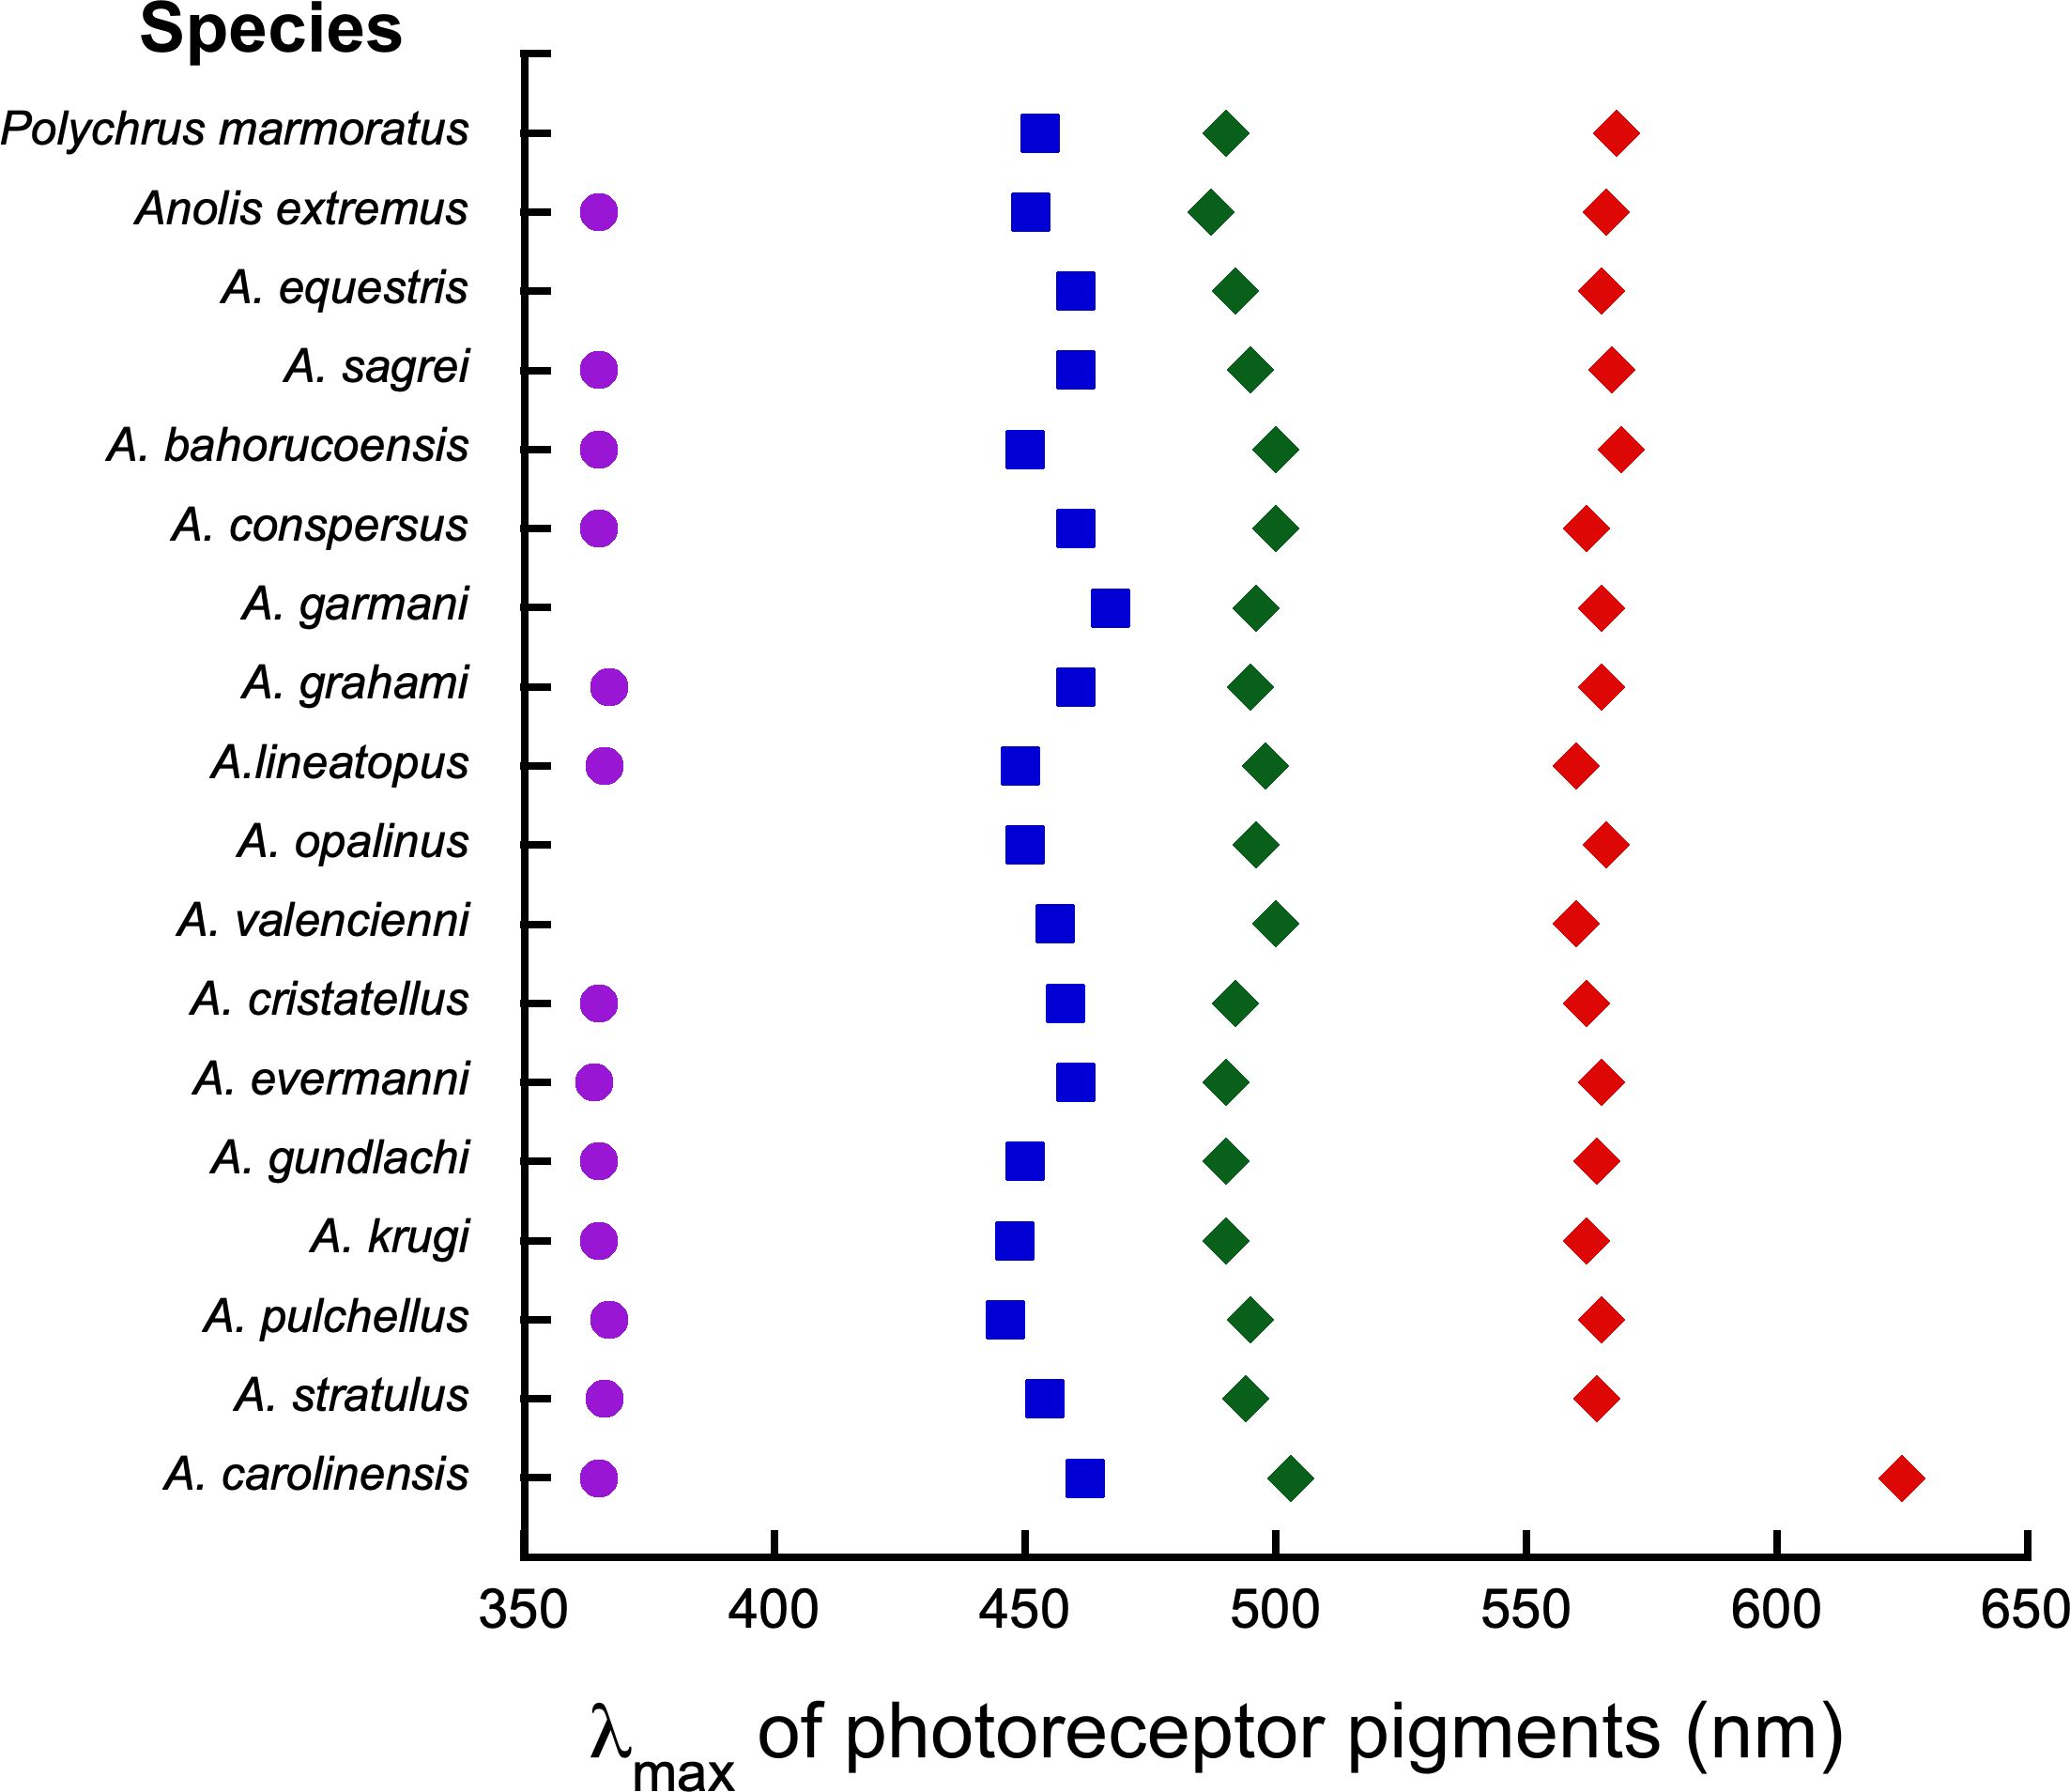
Figure 6. Average λmax values for 17 Anolis visual pigments based on MSP. Polychrus mormoratus is a closely related outgroup species. Species represent five different clades and inhabit a variety of light environments including full sun, partial shade, full shade, and forest canopy. In examples where no UV is listed, no UV photoreceptors were found during MSP, but it is likely that they are present. Anolis carolinensis has a vitamin A2-based chromophore that shifts its λmax values to longer wavelengths. For details see Loew et al. (2002).
Examples of pigment λmax values of other species that have been examined with MSP are summarized in Figure 7. Looking from the top, the first entries illustrate what appears to be the most typical lizard pattern: photoreceptor with approximately the same four average λmax values. These examples represent distinctly different clades and occupy very different habitats. The anoles (Iguania) live in moist tropical habitats. Podarcis (Lacertoidae) inhabits stone walls and rock outcrops (Martin et al., 2015). Crotaphytus (Iguania) is a rock dweller, and Platysaurus (Sincomorpha) occupies flat open rocky areas. The next group includes three species for which only three pigments were identified. The λmax of these pigments match the three longer wavelength pigments of the species described above, but no UV cone was found. In the case of Ctenophorus, genetic analysis has shown that the missing pigment (UV) is probably present and simply was not found by MSP (Dong et al., 2019). The next four examples include species that exhibit four pigment types. However they appear to have vitamin A2-based pigments (A. carolinensis) or a mixture of A1 and A2, which has resulted in a shift in λmax of the L cone to a longer wavelength. The next four species are three nocturnal and one diurnal gecko species.
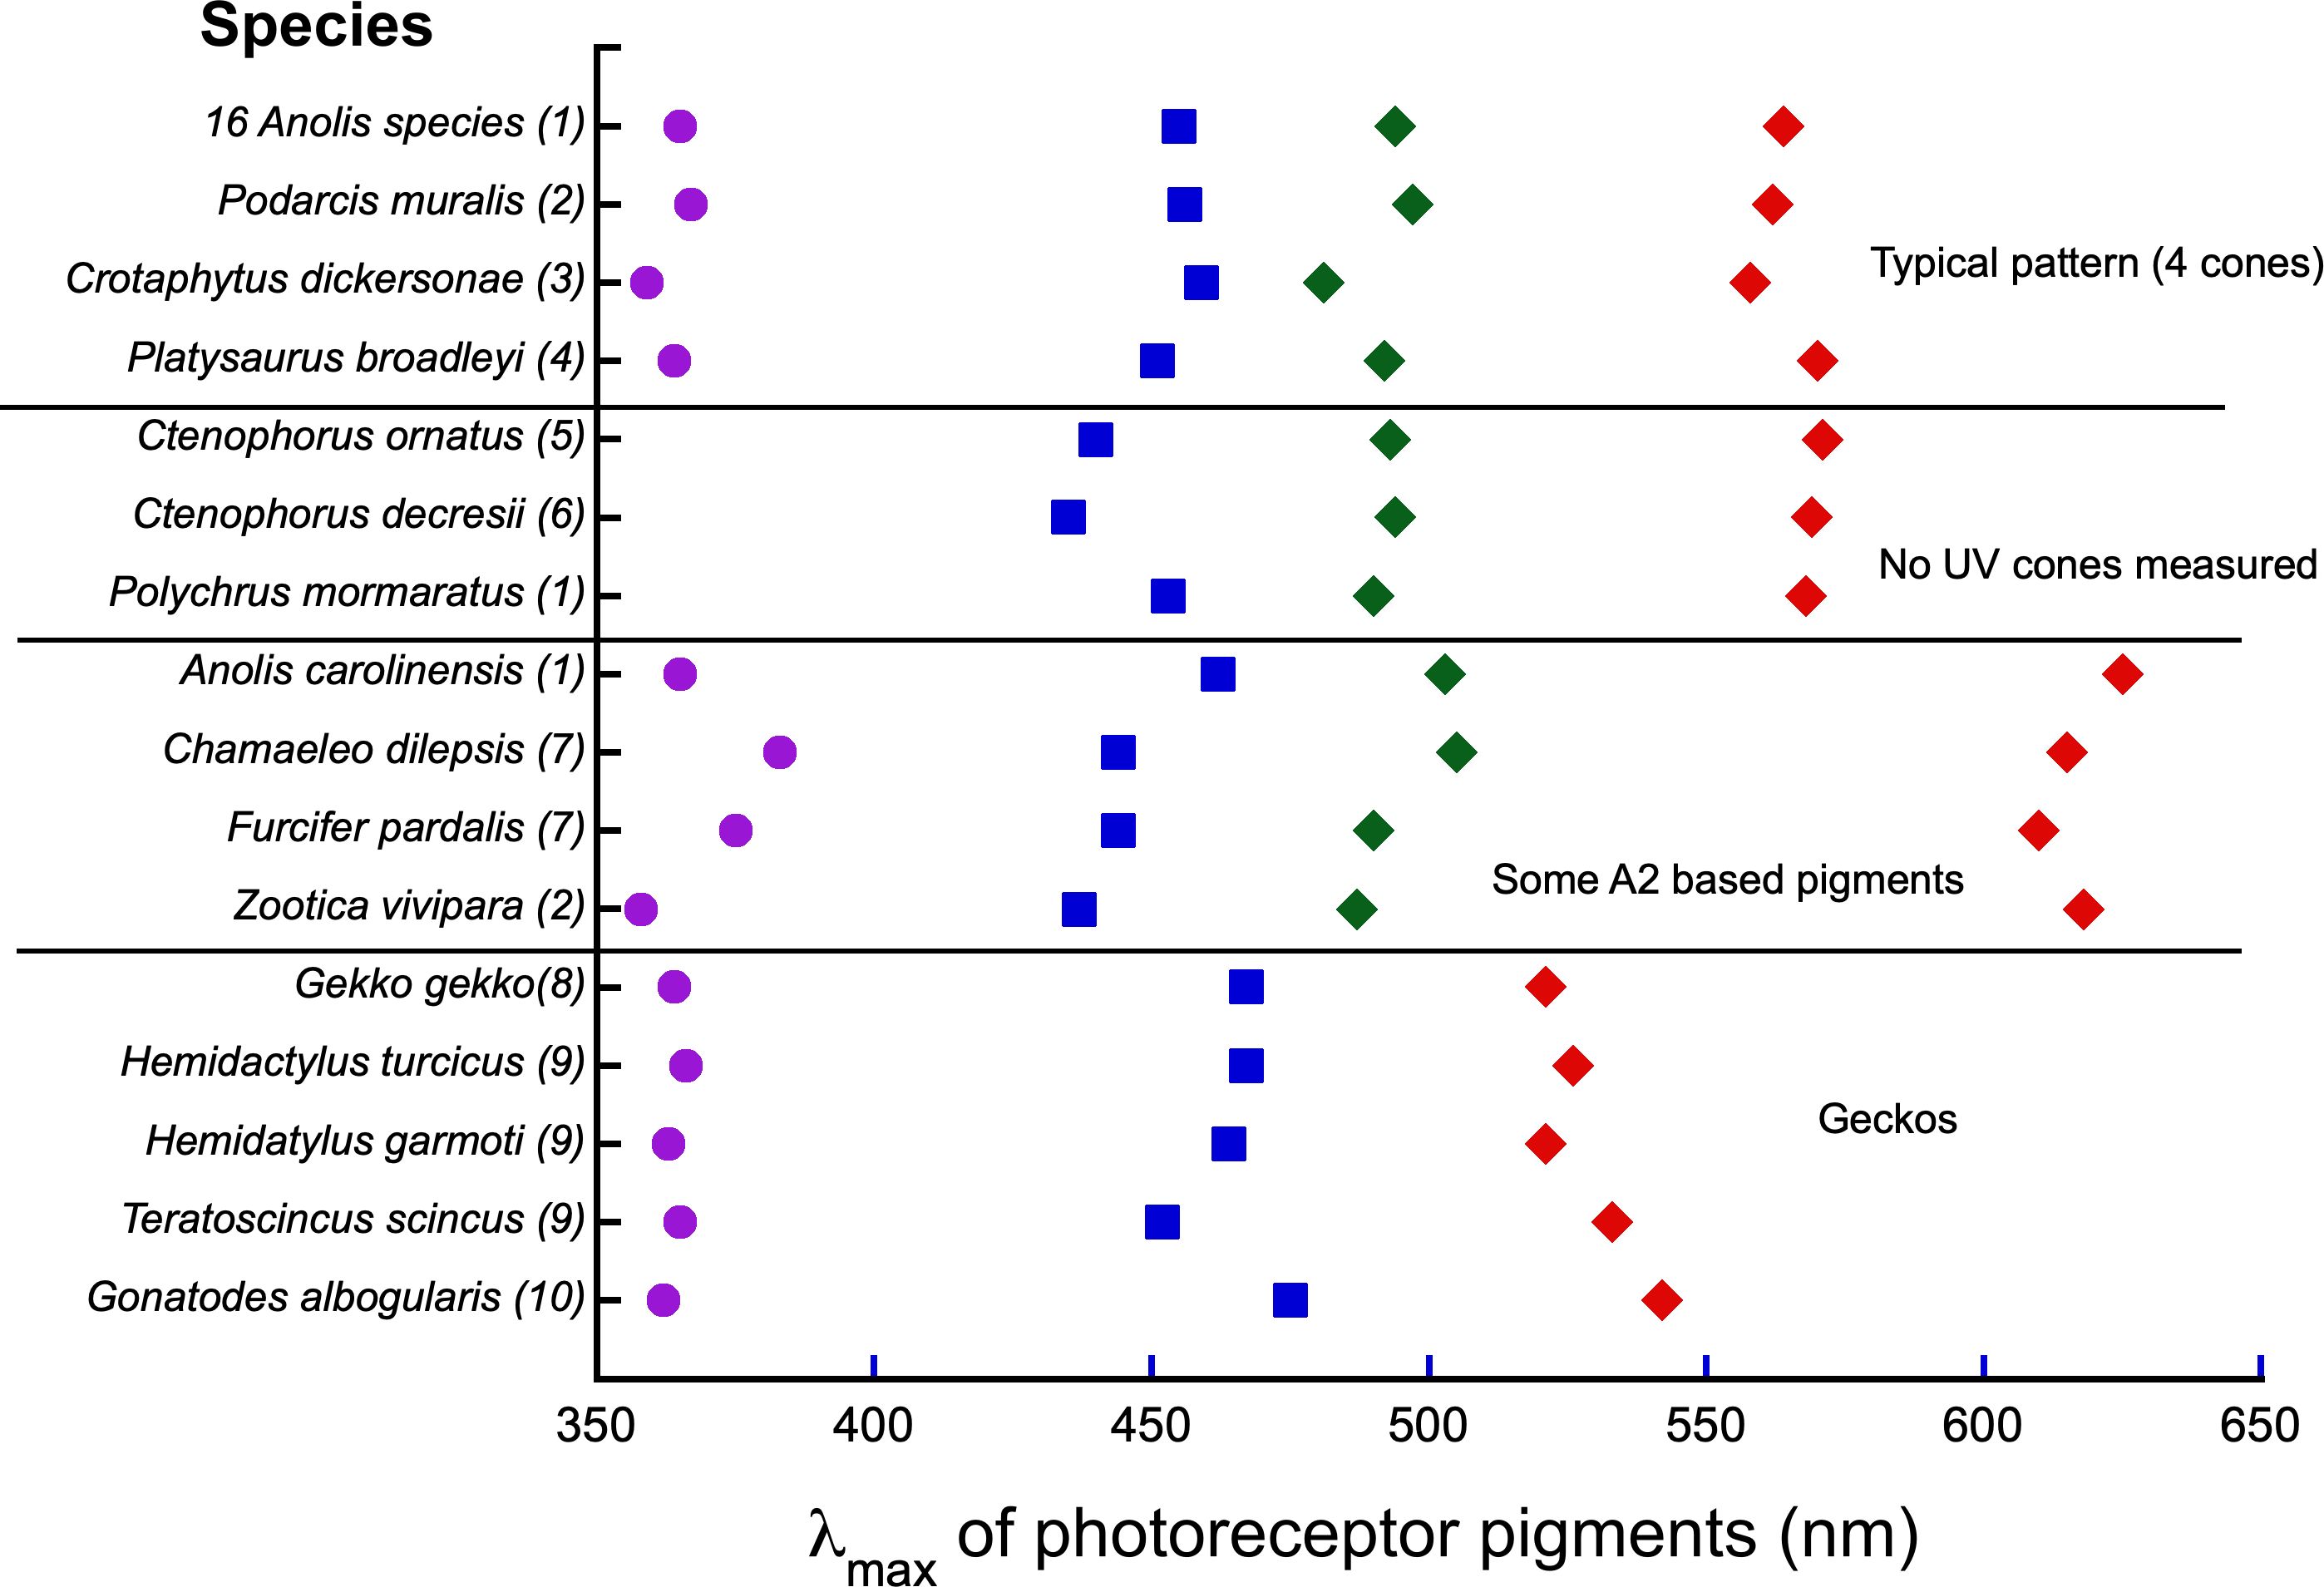
Figure 7. Average λmax values from MSP on a variety of lizard groups. The upper group of four illustrates the most typical pattern. In the second group UV cones were not found, but are likely to be present. The third groups shows species whose pigments were based on a vitamin A2 chromophore or a mixture of A1 and A2. The last group are nocturnal and diurnal geckos. Numbers with species refer to references as follows: (1) Loew et al. (2002), (2) (Martin et al., 2015), (3) Macedonia et al. (2009), (4) Fleishman et al. (2011), (5) Barbour et al. (2002), (6) Yewers et al. (2015), (7) Bowmaker et al. (2005), (8) Loew (1994), (9) Loew et al. (1996), (10) Ellingson et al. (1995).
The λmax for the L cone pigment is nearly the same for the majority of species. Cones with this pigment form the basis of the luminance channel. There are two obvious exceptions to this generalization. Nocturnal geckos possess an L cone with a peak closer to 520 nm. This is consistent with peak sensitivity found in the rods of animals that have nocturnal vision. The diurnal gecko, Gonatodes albogularis has an L cone with a greater λmax value than that of the nocturnal geckos, but shorter than that found in other diurnal lizards. The lizards that utilize A2 chromophores possess L cones with longer wavelength peaks.
In summary, lizard retinas from a broad range of lineages occupying light habitats that vary from unshaded flat rocks and desert to heavily shaded tropical forest understory share very similar sets of cone pigments. Most species that have been studied possess four cone classes, and the λmax values of the pigments of different species show relatively little variation. There are a few examples of species that utilize A2 in the pigment chromophores (or a mix of A1 and A2) resulting in longer wavelength values for some pigments. Overall, no apparent relationship between habitat light spectra and cone pigment λmax values was observed. Lind et al. (2017) modeled the impacts of small alterations in λmax values on the capacity to discriminate small differences in relevant colors and found the effects to be minor. In sum, there is little evidence of evolution of different pigment spectral absorption functions as adaptations for particular habitat spectra or specific behavioral tasks. Interestingly this conclusion extends to birds as well, which have similar sets of visual pigments and no obvious link between habitat spectra and visual pigments (Osorio, 2019).
12 Visual ecology of color signals
A topic of broad general interest to visual ecologists is the relationship between animal signal colors and the sensory systems that detect them. A signal may be defined as a behavior or structure that influences the behavior of a signal receiver, has evolved or is maintained through selection because of this influence, and is effective because it provides the receiver with information about the sender or its environment (Carazo and Font, 2010; Fleishman and Font, 2018). A complete review of colors as visual signals is beyond the scope of this paper. Here we explore some examples of color as visual signals and their evolutionary relationship to the color visual system. Photopically-active lizards exhibit remarkable diversity in body and display organ coloration. These colors serve a wide variety of functions, including several that are unrelated to signaling such as crypsis and/or thermoregulation. As signals, colors play important roles in territoriality, dominance, courtship and mating, agonistic behavior, and social status (Olsson et al., 2013).
In a broad sense, animal colors fall into two categories in terms of visual system stimulation. First, many signal colors evolve under selective pressure to be highly visible and easily recognizable in the presence of environmental visual noise. This often involves reflecting wavelengths that are strongly present in the ambient lighting (spectral irradiance), and that exhibit chromatic contrast with natural backgrounds. I refer to this feature as selection for detectability. Second, in many signaling contexts different individuals exhibit variations of a given color pattern that correlate with some feature of the individual. The effectiveness of such signals is limited by the capacity of the receiver visual system to discriminate among different variants of the color. I refer to this process as selection for information.
12.1 Selection for detectability: habitat light influences
In many cases there are evolutionary pressures on signals to be highly conspicuous and/or recognizable in a complex environment. It is known from experiments on signal visibility (described above) that contrast in color and brightness between stimulus and background determines signal detectability. Color vision properties are largely consistent across groups of related species, but habitat background radiance and irradiance properties vary widely. Differences in habitat light conditions can, therefore, favor the evolution of different colors for species with similar visual systems. For example, Stuart-Fox et al. (2007) compared aggressive signals in 21 species of dwarf chameleons from a range of habitat types. Lizards from more shaded habitats exhibited greater reflectance in the UV, most likely because UV makes up a greater proportion of the available light in shady conditions. McLean et al. (2014) measured throat coloration in two populations (northern and southern) of Ctenophorus decresii in Australia. The irradiance spectrum was similar in both habitats, but the background was dominated by an orange lichen species in the southern population, and a blue-colored lichen in the northern population. The individuals in the southern population typically possessed a blue throat coloration. Those in the northern population possessed orange throat coloration Thus the throat colors of each population appeared to evolve in response to colors of the background in their respective habitats in order to favor greater detectability in each habitat.
12.2 Background color/light intensity interactions
Fleishman et al. (2022) studied habitat light and dewlap coloration in 17 anoline species from (Puerto Rico, Jamaica and Hispaniola). In these habitats background brightness was highly variable so that differences in brightness contrast had little impact on dewlap visibility (but see Leal and Fleishman, 2002). The critical variable influencing dewlap visibility was the chromatic contrast against the natural background. However, most anoline species that have been examined occupy habitats dominated by green vegetation, with very similar spectral radiances, and share very similar color visual systems.
It turns out that the critical difference among habitats was the total irradiance. Color perception, and discrimination thresholds are known to change with changes in light intensity (Reitner et al., 1992; Rovama et al., 2001; Yebra et al., 2001). Fleishman et al. (2020) studied experimentally the relationship between total light intensity and chromatic contrast in anoline lizards. They discovered that in bright, unshaded habitats, red dewlaps form the highest chromatic contrast with the background. In relatively low light intensity environments, typical of partial or fully shaded habitats, the red dewlaps reflected/transmitted too little total light to create an effective chromatic contrast against the green background. Anoles from shaded habitats typically have yellow or white dewlaps, which reflect more total photons. They are also quite translucent, and diffusely transmit more light. Under the lower light conditions these colors create a stronger chromatic contrast against the green background.
Indeed, a phylogenetic analysis of these species revealed a strong correlation between habitat light intensity and dewlap “redness.” Examples of the chromatic contrast of dewlaps in low and high light conditions are shown in Figure 8. In a high total irradiance habitat, red or orange was the most visible color against the green background, but in low total irradiance (shaded) habitats yellow or white was as, or more, visible due to the interacting effects of light intensity and chromatic contrast.
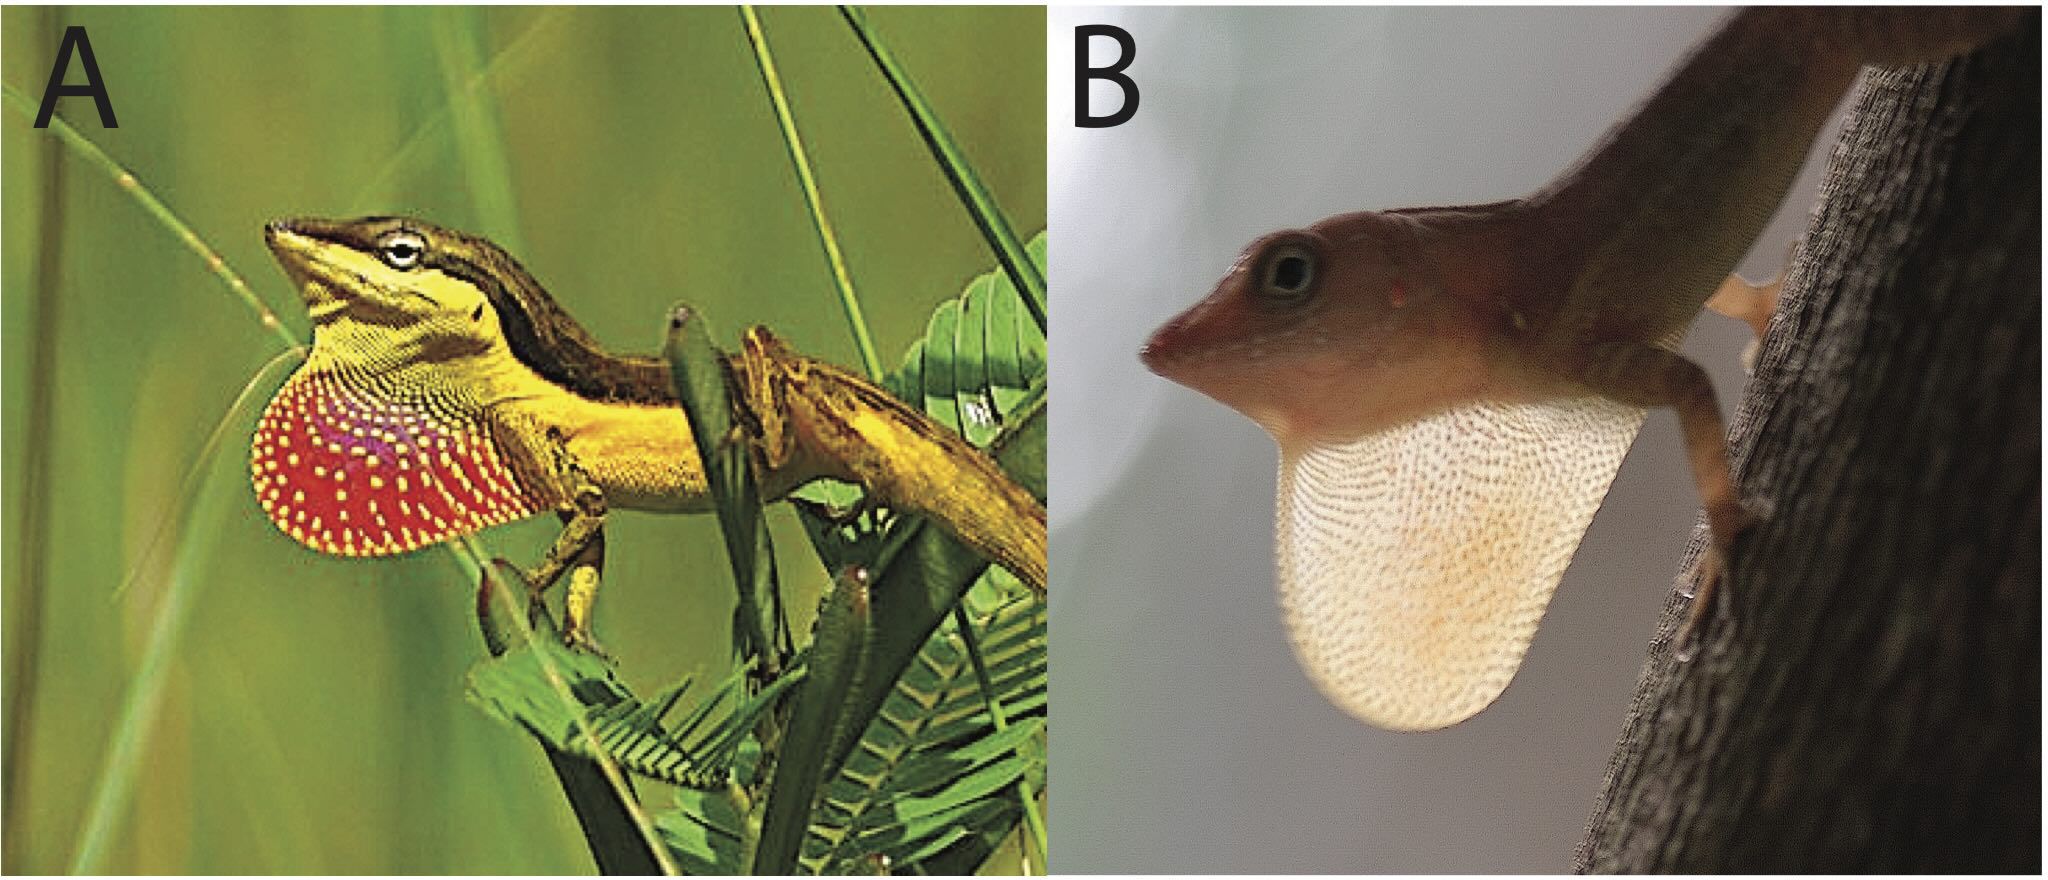
Figure 8. (A) A male Anolis pulchellus (from Puerto Rico) displaying its dewlap. This species occupies unshaded grassy habitats. The red coloration of the dewlap achieves near optimal visibililty due to its chromatic contrast with the natural background. Photograph by Emelia Failing. (B) A male Anolis lineatopus from Jamaica displaying its dewlap. This species occupies shaded forest understory. In this relative low light condition a yellow/white dewlap reflects more light and creates a greater chromatic contrast with the background. In addition, the dewlap is translucent and transmits light, further increasing its visibility in the darker habitat. Photograph by Manuel Leal.
12.3 Selection for information: discrimination among color variants
Lizards often possess color patches whose properties depend on the anatomical bases of the color production. Within species, individuals and/or populations often exhibit distinctly different patterns. These colors can provide a wide variety of different sorts of information, including aspects of individual state, such as health, age, dominance, mating status, distinct behavior pattern, territorial status, motivation etc. The colors that are observed and their patterns of variation often reflect physiological, dietary and/or developmental constraints. It is these constraints that often cause color variations to be meaningful indicators of condition (Stuart-Fox et al., 2021).
However, the effectiveness with which such colors transmit the information they potentially contain to other individuals depends on how they stimulate the color-vision system. Figure 9 illustrates an example. Males of the diurnal gecko Gonatodes albogularis possess head color that varies from yellow to orange/red depending on the precise location of a high-to-low reflectance increase. The color correlates strongly with dominance status. The range of wavelength variations possessed by different individuals all fall in a zone of overlap between the two longer wavelength photoreceptors in the retina. In this range of the spectrum small changes produce large shifts in the response ratio of the two cone classes, and make fine signal variants easy to reliably distinguish (Ellingson et al., 1995). The correlation of the color to dominance is undoubtedly related to age and/or other physiological correlates with the color, but there has presumably been selection for the colors to be easily discriminated by the ancestral visual system. There are many other examples of variable signals that have evolved to signal information, but also to allow effective discriminated by the visual system (Fleishman and Font, 2018).
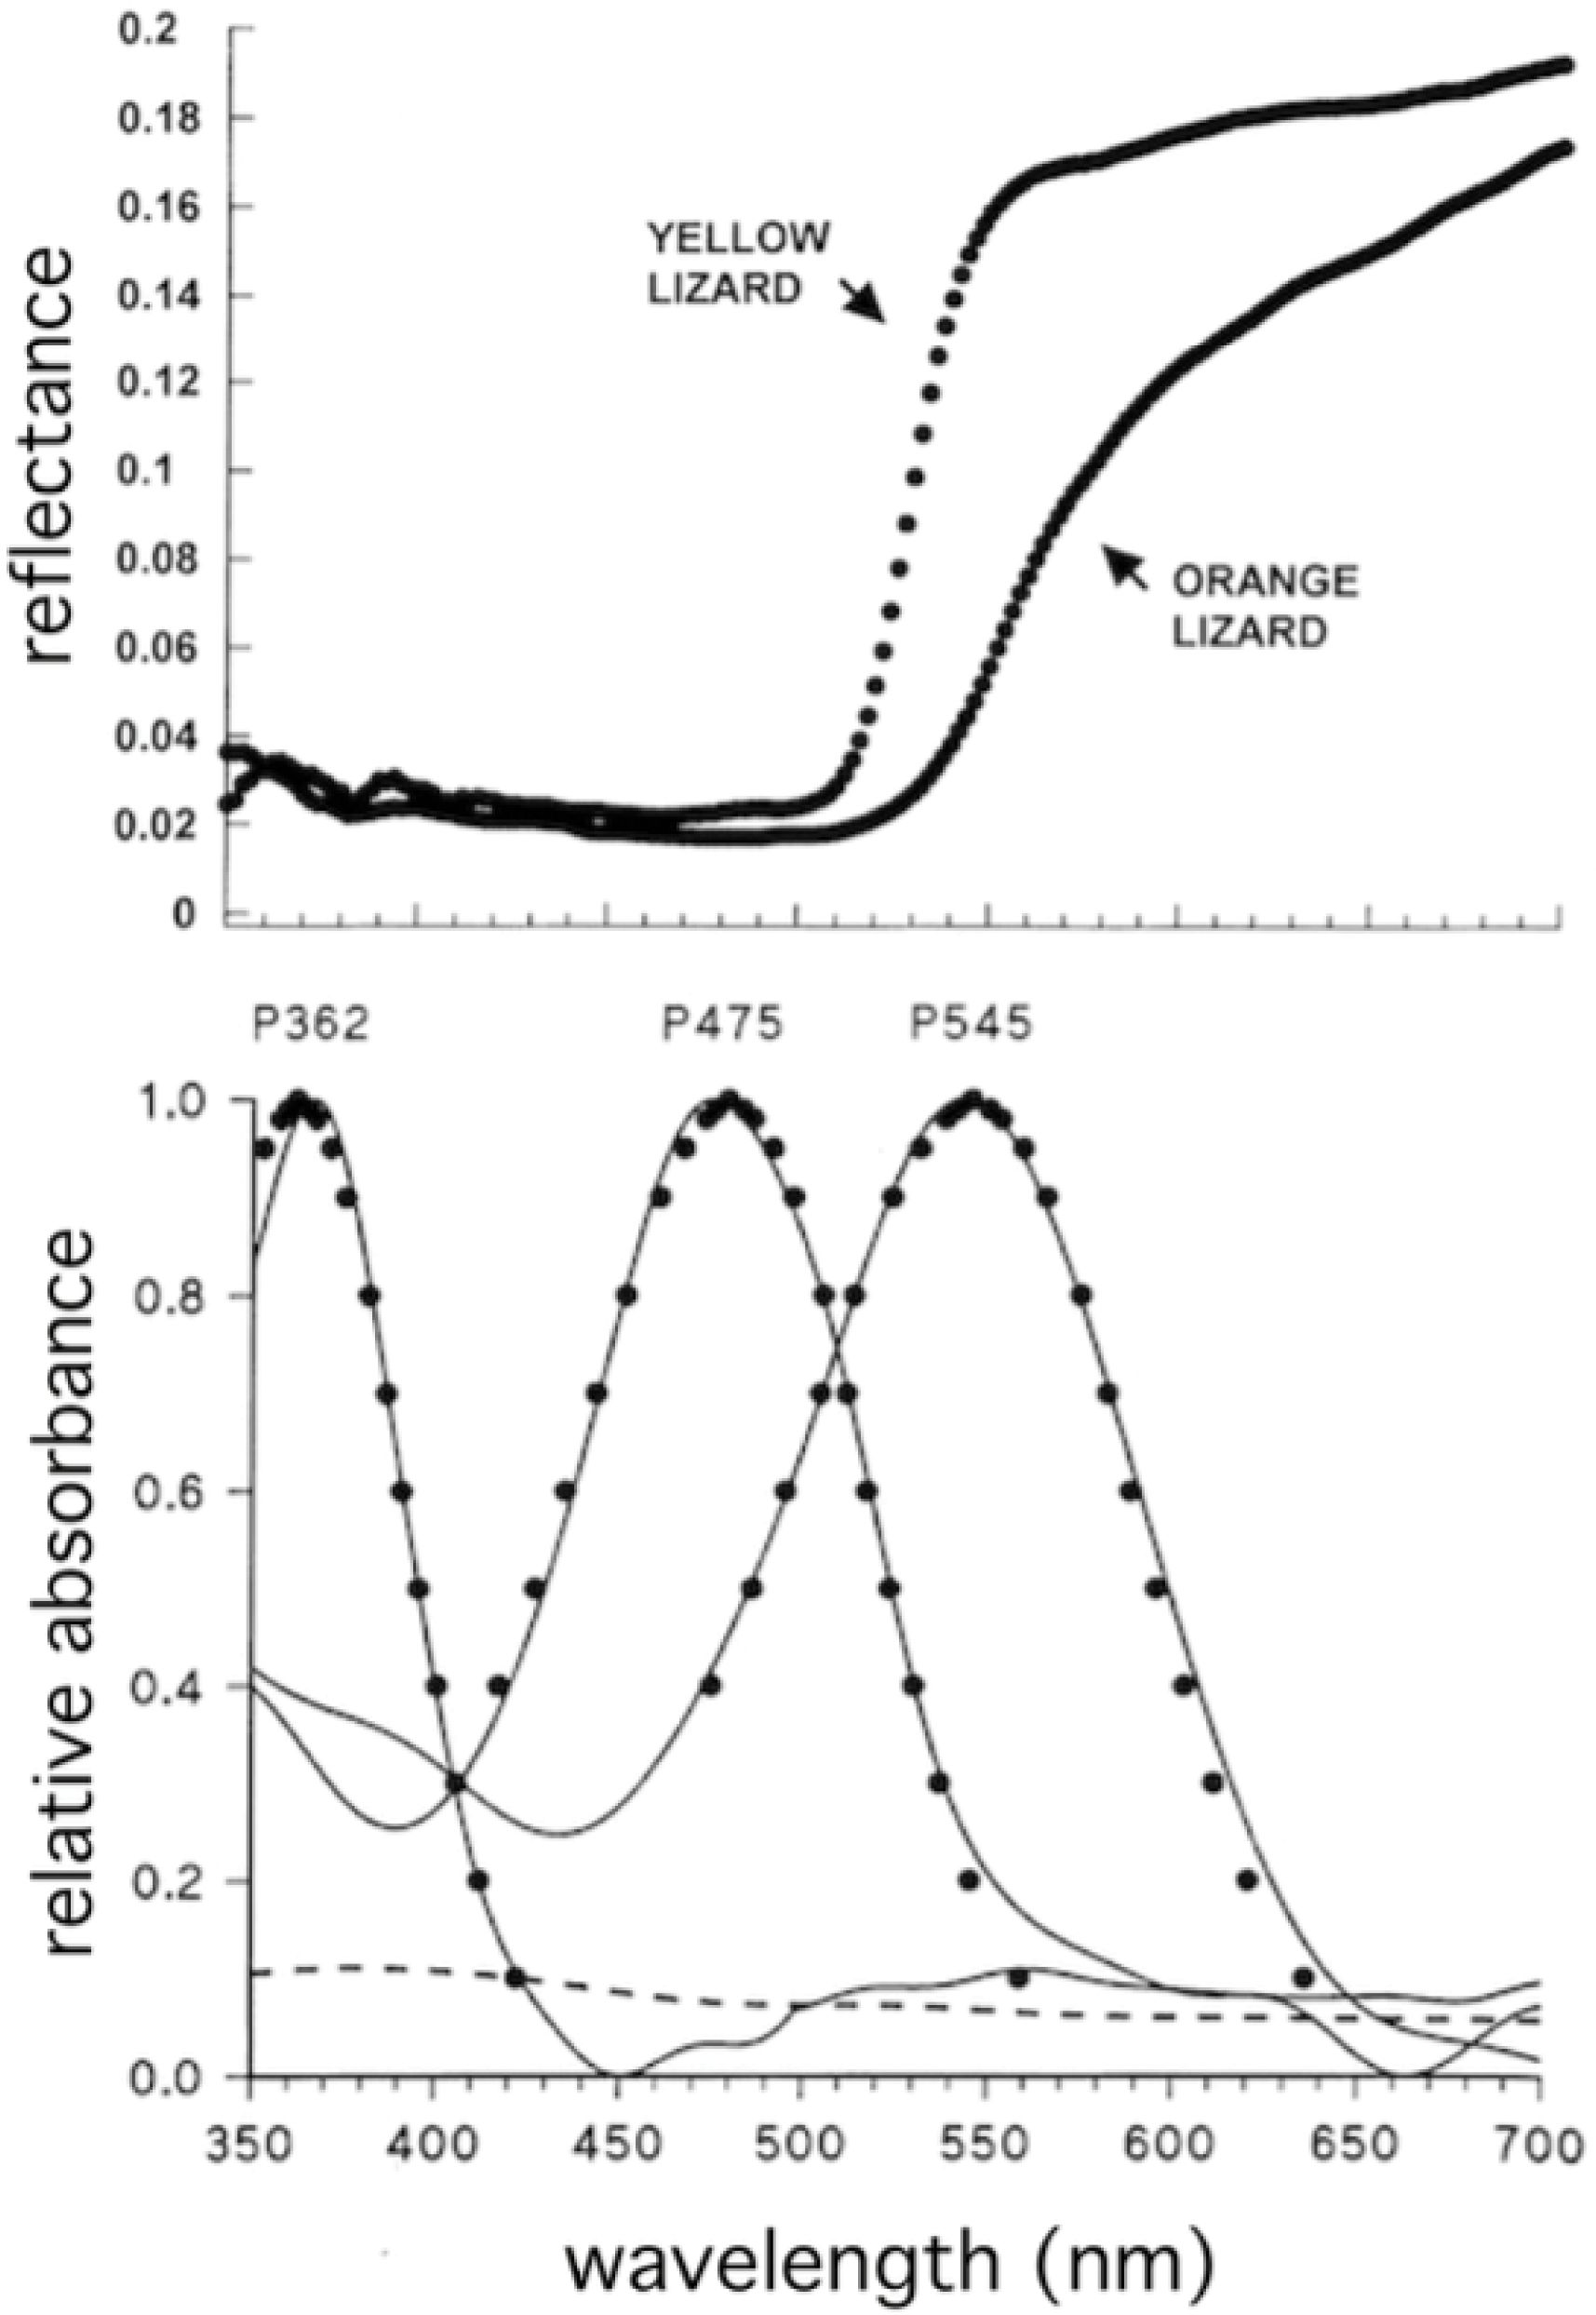
Figure 9. The upper graph shows the spectral reflectance curves of the head color of two individual male Gonatodes albogularis that represent the range of color observed in the population. The lower graph shows spectral absorbance curves for the three photoreceptors classes in the retina. The head colors fall in the wavelength range where the photoreceptor pigments overlap and change steeply. This combination of photoreceptor spectral sensitivities and head colors will enhance the ability of the viewers to discriminate among the different head colors. From Ellingson et al. (1995).
12.4 Can selection for signal effectiveness shape the evolution of visual-system properties?
The similarity of visual pigments across broad phylogenetic groups suggests that, for the most part, color vision systems in lizards are widely shared, and ancestral to the evolution of signal colors. It is therefore likely that in most cases the color patterns have evolved in response to the constraints imposed by the visual system. There are, however, some examples of variations in the retinal photoreceptor composition in certain species, that may have resulted from selection on the visual system to more effectively extract information from specific color signals. Here I consider three examples.
Based on MSP, Martin et al. (2015) found evidence of increased numbers of UV photoreceptors in the retina of the lacertid lizard Zootoca vivipara compared to other closely related species, as well as shift in the λmax of L cones to longer wavelengths (due to an A2 chromophore mixture). Using RNL modeling they determined that the increase in density of UV cones in the retina plus the increased long wavelength sensitivity of L cones improved the ability of lizards to distinguish individual differences in body color patches of different male individuals. This raises the possibility that the unusual aspects of the visual system of this species may have arisen, in part, under selection for more effective signaling.
Using ERG recordings Fleishman et al. (2011) observed unusually high sensitivity to ultraviolet wavelengths in Platysaurus broadleyi. This was consistent with an observation of high numbers of colorless oil droplets, that suggested the presence of an unusually high density of UV-sensitive photoreceptors. Males of this species use ultraviolet colors as honest signals of fighting ability (Stapley and Whiting, 2006). RNL modeling demonstrated that the increase in UV photoreceptor numbers significantly increased the number of naturally occurring male color patterns that could be discriminated by conspecifics (Fleishman et al., 2011), because the increased density of UV photoreceptors reduced the noise in the signal created by UV stimuli. They argued that the increase in UV-sensitivity due to an increase in the number of UV cones may have evolved in concert with the increase in dependence on UV coloration in their signaling system.
The blue-tongued skink (the sleepy lizard) Tiliqua rugosa (Nagloo et al., 2022) has a conspicuous blue tongue that is displayed in male–male agonistic contests. ERG measurement revealed an unusually high spectral sensitivity between 375 and 450 nm. Sensitivity below 375 nm was unusually low. Nagloo et al. (2022) hypothesized that the SWS1 pigment, which in lizards normally confers sensitivity in the UV, may have undergone a mutation that shifted its sensitivity to a longer wavelength. In addition, they hypothesized that the numbers of SWS2 pigments (S pigments) may be greater than is typical of other lizards. While the mechanism is unclear, it is apparent that the species has a greatly increased sensitivity to the color blue, which coincides with the color of the blue tongue that plays an important role in social interactions. Increased sensitivity and photoreceptor numbers in this spectral range is likely to improve the ability to discriminate among the blue tongue color of different individuals.
While suggestive, these results do not prove that the response properties evolved for detection of a specific signal. It is equally possible that the novel visual properties arose ancestrally (for unknown reason) and that the signals evolved in response to them. It is also possible that the changes in the visual system and signal are chance events that are not directly related (Nagloo et al., 2022).
13 Summary and challenging questions for the future
Understanding the visual ecology of terrestrial animals can be a complex problem. Three elements strongly combine to influence selection on visual systems: evolutionary history, behavioral requirements, and habitat light properties. There are a number of distinctly different light environments, but many species occupy environments with broadly similar light characteristics. This, combined with the capacity of the eye to adapt to chromatic and intensity properties tends to lessen the diversifying effects of these differences.
A complicating factor is the need to fully understand the role of ancestry in controlling the anatomical and physiological properties of the eye and vision. For example, we find in diurnal geckos only three visual pigment types, compared to four or five in other species. We might be tempted to relate this to their habitat or behavior, but it is fairly clear that this is an inheritance from their nocturnal ancestors. In studies of the evolution of dewlap colors in anoline lizards, Fleishman et al. (2022) found that differences arose not from differences in color vision physiology, since nearly all species share the same color perception system, but in how this shared system functions differently depending on the light intensity in the different habitats. Thus, understanding terrestrial visual ecology requires an analysis of how visual systems have adapted to specific habitats and behaviors, but it also requires an understanding of what aspects of the visual system have been inherited with very little modification.
A number of fascinating unanswered questions remain. First, the phylogenetic range of species that have been studied is rather limited, with many major groups as of yet unexamined. The coverage of certain aspects of visual ecology is extremely narrow. For example, our knowledge of distance perception mechanisms is limited to two species, and almost nothing is known about the capacity for distance estimation over distances greater than one body length. The ecological importance of the photoreceptor oil droplets and how variations in oil droplets impact color vision, is largely unknown. Lizard visual processing and visual ecology continues to be a wide-open area for future research. Compared to other animal groups, lizards are relatively unstudied, and their sensory systems offer an array of fascinating problems.
Author contributions
LF: Conceptualization, Writing – original draft, Writing – review & editing.
Funding
The author(s) declare that no financial support was received for the research, authorship, and/or publication of this article.
Conflict of interest
The author declares that the research was conducted in the absence of any commercial or financial relationships that could be construed as a potential conflict of interest.
Publisher’s note
All claims expressed in this article are solely those of the authors and do not necessarily represent those of their affiliated organizations, or those of the publisher, the editors and the reviewers. Any product that may be evaluated in this article, or claim that may be made by its manufacturer, is not guaranteed or endorsed by the publisher.
References
Baden T., Osorio D. (2019). The retinal basis of vertebrate color vision. Ann. Rev. Vis. Sci. 5, 177–200. doi: 10.1146/annurev-vision-091718-014926
Barbour H. R., Archer M. A., Hart N. S., Thomas N., Dunlop S. A., Beazley L. D., et al. (2002). Retinal characteristics of the ornate dragon lizard, Ctenophorus ornatus. J. Comp. Neurol. 450, 334–344. doi: 10.1002/cne.10308
Beltrami G., Parretta A., Petrucci F., Buttini P., Bertolucci C., Foà A. (2012). The lizard celestial compass detects linearly polarized light in the blue. J. Exp. Biol. 215, 3200–3206. doi: 10.1242/jeb.074419
Benes E. S. (1969). Behavioral evidence for color discrimination by the whiptail lizard, Cnemidophorus tigris. Copeia 1969, 707–722. doi: 10.2307/1441798
Bingham A. (2019). Structure and function of bird fovea. Anat. Histol. Embryol. 48, 177–200. doi: 10.1111/ahe.12432
Bowmaker J. K., Loew E. R., Ott M. (2005). The cone photoreceptors and visual pigments of chameleons. J. Comp. Physiol. A 191, 925–932. doi: 10.1007/s00359-005-0014-4
Canei J., Burtea C., Nonclercq D. (2020). Comparative study of the visual system of two psammophilic lizards (Scincus scincus & Eumeces schneideri). Vis. Res. 171, 17–30. doi: 10.1016/j.visres.2020.04.004
Carazo P., Font E. (2010). Putting information back in biological communication. J. Evol. Biol. 23, 661–669. doi: 10.1111/j.1420-9101.2010.01944.x
Carleton K. (2009). Cichlid fish visual systems: mechanisms of spectral tuning. Integr. Zool. 4, 75–86. doi: 10.1111/j.1749-4877.2008.00137.x
Chetverikova R., Dautaj G., Schwigon L., Dedek K., Mouritsen H. (2022). Double cones in the avian retina form an oriented mosaic which might facilitate magnetoreception and/or polarized light sensing. J. @ R. Soc Interface 19, 20210877. doi: 10.1098/rsif.2021.0877
Chiao C. C., Cronin T. W., Osorio D. (2000). Color signals in natural scenes: characteristics of reflectance spectra and effects of natural illuminants. JOSA A 17, 218–224. doi: 10.1364/JOSAA.17.000218
Cronin T. W., Johnsen S., Marshall N. J., Warrant E. J. (2014). Visual ecology (Princeton: Princeton U. Press).
Davies M. N. O., Green P. R. (1994). “Multiple sources of depth information: an ecological approach,” in Perception and motor control in birds: an ecological approach. Eds. Davies M. N. O., Green P. R. (Springer, Berlin, Heidelberg), 339–356. doi: 10.3389/famrs2023.1129253
Dong C. M., McLean C. A., Moussalli A., Stuart-Fox D. (2019). Conserved visual sensitivities across divergent lizard lineages that differ in an ultraviolet sexual signal. Ecol. Evol. 9, 11824–11832. doi: 10.1002/ece3.5686
Ellingson J. M., Fleishman L. J., Loew E. R. (1995). Visual pigments and spectral sensitivity of the diurnal gecko. Gonatodes albogularis. J. Comp. Physiol. A. 177, 559–567. doi: 10.1007/BF00207185
Endler J. A. (1993). The color of light in forests and its implications. Ecol. Monogr. 63, 1–27. doi: 10.2307/2937121
Fite K. V., Lister B. C. (1981). Bifoveal vision in Anolis lizards. Brain Behav. Evol. 19, 144–154. doi: 10.1159/000121639
Fleishman L. J. (1992). The influence of the sensory system and the environment on motion patterns in the visual displays of anoline lizards and other vertebrates. Am. Nat. 139, S36–S61. doi: 10.1086/285304
Fleishman L. J., Bowman M., Saunders D., Miller W. E., Rury M. J., Loew E. R. (1997). The visual ecology of Puerto Rican anoline lizards: habitat light and spectral sensitivity. J. Comp. Physiol. A 181, 446–460. doi: 10.1007/s003590050128
Fleishman L. J., Font E. (2018). “Sensory processing in relation to signaling behavior,” in Behavior of lizards: evolutionary and mechanistic perspectives. Eds. Bels V. L., Russell A. P. (CRC Press, London, New York), 207–257.
Fleishman L. J., Loew E. R., Whiting M. J. (2011). High sensitivity to short wavelengths in a lizard and implications for understanding the evolution of visual systems in lizards. Proc. R. Soc B 278, 2891–2899. doi: 10.1098/rspb.2011.0118
Fleishman L. J., Marshall C. J., Hertz P. E. (1995). Comparative study of temporal response properties of the visual system of three species of anoline lizards. Copeia 1995, 422–431. doi: 10.2307/1446905
Fleishman L. J., Perez C. W., Yeo A. I., Cummings K. J., Dick S., Almonte E. (2016). Perceptual distance between colored stimuli in the lizard Anolis sagrei: comparing visual system models to empirical results. Behav. Ecol. Sociobiol. 70, 541–555. doi: 10.1007/s00265-016-2072-8
Fleishman L. J., Perez-Martinez C. A., Leal M. (2022). Can sensory drive explain the evolution of visual signal diversity in terrestrial species? A test with Anolis lizards. Am. Nat. 200, 236–249. doi: 10.1086/720267
Fleishman L. J., Persons M. (2001). The influence of stimulus and background colour on signal visibility in the lizard Anolis cristatellus. J. Exp. Biol. 204, 1559–1575. doi: 10.1242/jeb.204.9.1559
Fleishman L. J., Wadman C. S., Maximov K. J. (2020). The interacting effects of total light intensity and chromatic contrast on visual signal visibility in an Anolis lizard. Anim. Behav. 167, 263–273. doi: 10.1016/j.anbehav.2020.07.008
Fleishman L. J., Yeo A. I., Perez C. W. (2017). Visual acuity and signal color pattern in an Anolis lizard. J. Exp. Biol. 220, 2154–2158. doi: 10.1242/jeb.150458
Gamble T., Greenbaum E., Jackman T. R., Bauer A. M. (2015). Into the light: diurnality has evolved multiple times in geckos. Biol. J. Linn. Soc 115, 896–910. doi: 10.1111/bij.12536
Govardovskii V. I., Fyhrquist N., Reuter T., Kuzmin D. G., Donner K. (2000). In search of the visual pigment template. Visual Neurosci. 17, 509–528. doi: 10.1017/S0952523800174036
Hailman J. P. (1977). Optical signals: animal communication and light (Bloomington, Indiana: Indiana U. Press).
Hall M. I. (2008). Comparative analysis of the size and shape of the lizard eye. Zoology 111, 62–75. doi: 10.1016/j.zool.2007.04.003
Harkness L. (1977). Chameleons use accommodation cues to judge distance. Nature 267, 346–349. doi: 10.1038/267346a0
Harkness L., Bennet-Clark H. C. (1978). The deep fovea as a focus indicator. Nature 272, 814–816. doi: 10.1038/272814a0
Hart N. S., Hunt D. M. (2007). Avian visual pigments: characteristics, spectral tuning, and evolution. Am. Nat. 169, S7–S26. doi: 10.1086/510141
Hart N. S., Lisney T. J., Collin S. P. (2006). Cone photoreceptor oil droplet concentration is affected by ambient light intensity. J. Exp. Biol. 209, 4776–4787. doi: 10.1242/jeb.02568
Hart N. S., Vorobyev N. M. (2005). Modelling oil droplet absorption spectra and spectral sensitivities of bird cone photoreceptors. J. Comp. Physiol A 191, 381–392. doi: 10.1007/s00359-004-0595-3
Henningsen J. P., Irschick D. J. (2012). An experimental test of the effect of signal size and performance capacity on dominance in the green anole lizard. Funct. Ecol. 26, 3–10. doi: 10.1111/j.1365-2435.2011.01893.x
Jacobs G. H. (2018). Photopigments and the dimensionality of animal color vision. Neurosci. Biobehav. Rev. 86, 108–130. doi: 10.1016/j.neubiorev.2017.12.006
Jenssen T. A., Feely P. C. (1991). Social behavior of the male anoline lizard Chamaelinorops barbouri, with a comparison to Anolis. J. Herpetol. 25, 454–462. doi: 10.2307/1564769
Kawamura S., Yokoyama S. (1998). Functional characterization of visual and nonvisual pigments of American chameleon (Anolis carolinensis). Vis. Res. 38, 37–44. doi: 10.1016/S0042-6989(97)00160-0
Ketter-Katz H., Lev-Ari T., Katzir G. (2020). Vision in chameleons—a model for non-mammalian vertebrates. Semin. Cell Dev. Biol. 106, 94–105. doi: 10.1016/j.semcdb.2020.05.009
Kirk E. C. (2004). Comparative morphology of the eye in primates. Anatomical Rec. Part A 281, 1095–1103. doi: 10.1002/ar.a.20115
Kojima K., Matsutani Y., Yanagawa M., Imamoto Y., Yamano Y., Wada A., et al. (2021). Evolutionary adaptation of visual pigments in geckos for their photic environment. Sci. Adv. 7, eabj1316. doi: 10.1126/sciadv.abj13
Lamb T. D. (1995). Photoreceptor spectral sensitivities: common shape in the long wavelength region. Vis. Res. 35, 3083–3091. doi: 10.1016/0042-6989(95)00114-F
Leal M., Fleishman L. J. (2002). Evidence for habitat partitioning based on adaptation to environmental light in a pair of sympatric lizard species. Proc. R. Soc B: Biol. Sci. 269, 351–359. doi: 10.1098/rspb.2001.1904
Leal M., Powell B. J. (2012). Behavioural flexibility and problem-solving in a tropical lizard. Biol. Lett. 8, 28–30. doi: 10.1098/rsbl.2011.0480
Lind O., Henze M. J., Kelber A., Osorio D. (2017). Coevolution of coloration and colour vision? Phil. Trans. R. Soc B: Biol. Sci. 372, 20160338. doi: 10.1098/rstb.2016.0338
Locket N. A. (1992). Problems of deep foveas. Aust. New Z. J. Ophthalmol. 20, 281–295. doi: 10.1111/j.1442-9071.1992.tb00740.x
Loew E. R. (1994). A third, ultraviolet-sensitive, visual pigment in the Tokay gecko (Gekko gekko). Vis. Res. 34, 1427–1431. doi: 10.1016/0042-6989(94)90143-0
Loew E. R., Fleishman L. J., Foster R. G., Provencio I. (2002). Visual pigments and oil droplets in diurnal lizards: a comparative study of Caribbean anoles. J. Exp. Biol. 205, 927–938. doi: 10.1242/jeb.205.7.927
Loew E. R., Govardovskii V. I., Röhlich P., Szel A. (1996). Microspectrophotometric and immunocytochemical identification of ultraviolet photoreceptors in geckos. Vis. Neurosci. 13, 247–256. doi: 10.1017/S0952523800007483
Macedonia J. M., Lappin A. K., Loew E. R., Mcguire J. A., Hamilton P. S., Plassman M., et al. (2009). Conspicuousness of Dickerson's collared lizard (Crotaphytus dickersonae) through the eyes of conspecifics and predators. Biol. J. Linn. Soc. 97, 749–765. doi: 10.1111/j.1095-8312.2009.01217.x
Makaretz M., Levine R. L. (1980). A light microscopic study of the bifoveate retina in the lizard Anolis carolinensis: general observations and convergence ratios. Vis. Res. 20, 679–686. doi: 10.1016/0042-6989(80)90092-9
Martin G. R. (1983). “Schematic eye models in vertebrates,” in Progress in sensory physiology, vol. 4 . Eds. Ottoson D., Autrum H., Schmidt R. F., Willis W. D. (Springer, Berlin Heidelberg), 43–81. doi: 10.1007/978-3-642-69163-8_2
Martin M., Le Galliard J. F., Meylan S., Loew E. R. (2015). The importance of ultraviolet and near-infrared sensitivity for visual discrimination in two species of lacertid lizards. J. Exp. Biol. 218, 458–465. doi: 10.1242/jeb.115923
McFadden S. A. (1994). “Binocular depth perception,” in Perception and motor control in birds: an ecological approach. Eds. Davies M. N. O., Green P. R. (Springer-Verlag, Berlin Heidelberg), 54–70.
McLean C. A., Moussalli A., Stuart-Fox D. (2014). Local adaptation and divergence in colour signal conspicuousness between monomorphic and polymorphic lineages in a lizard. J. Evol. Bio. 27, 2654–2664. doi: 10.1111/jeb.12521
Moermond T. C. (1981). Prey-attack behavior of Anolis lizards. Z. Tierpsychol. 56, 128–136. doi: 10.1111/j.1439-0310.1981.tb01291.x
Murphy C. J., Howland H. C. (1986). On the gekko pupil and Scheiner's disc. Vis. Res. 26, 815–817. doi: 10.1016/0042-6989(86)90097-0
Nagloo N., Coimbra J. P., Hoops D., Hart N. S., Collin S. P., Hemmi J. M. (2020). Retinal topography and microhabitat diversity in a group of dragon lizards. J. Comp. Neurol. 528, 542–558. doi: 10.1002/cne.24780
Nagloo N., Mountford J. K., Gundry B. J., Hart N. S., Davies W. I., Collin S. P., et al. (2022). Enhanced short-wavelength sensitivity in the blue-tongued skink Tiliqua rugosa. J. Exp. Biol. 225 (11), jeb244317. doi: 10.1101/2022.03.25.485754
New S. T., Bull C. M. (2011). Retinal ganglion cell topography and visual acuity of the sleepy lizard (Tiliqua rugosa). J. Comp. Physiol. A. 197, 703–709. doi: 10.1007/s00359-011-0635-8
Olsson P., Lind O., Kelber A. (2018). Chromatic and achromatic vision: parameter choice and limitations for reliable model predictions. Behav. Ecol. 29, 275–282. doi: 10.1093/beheco/arx133
Olsson M., Stuart-Fox D., Ballen C. (2013). Genetics and evolution of colour patterns in reptiles. Semin. Cell Dev. Biol. 24, 529–541. doi: 10.1016/j.semcdb.2013.04.001
Osorio D. (2019). The evolutionary ecology of bird and reptile photoreceptor spectral sensitivities. Curr. Opin. Behav. Sci. 30, 223–227. doi: 10.1016/j.cobeha.2019.10.009
Osorio D., Smith A. C., Vorobyev M., Buchanan-Smith H. M. (2004). Detection of fruit and the selection of primate visual pigments for color vision. Am. Nat. 164, 696–708. doi: 10.1086/425332
Osorio D., Vorobyev M. (2005). Photoreceptor spectral sensitivities in terrestrial animals: adaptations for luminance and colour vision. Proc. R. Soc. B: Biol. Sci. 272, 1745–1752. doi: 10.1098/rspb.2005.3156
Ott M., Ostheim J., Sherbrooke W. C. (2004). Prey snapping and visual distance estimation in Texas horned lizards, Phrynosoma cornutum. J. Exp.l Biol. 207, 3067–3072. doi: 10.1242/jeb.01153
Ott M., Schaeffel F. (1995). A negatively powered lens in the chameleon. Nature 373, 692–694. doi: 10.1038/373692a0
Ott M., Schaeffel F., Kirmse W. (1998). Binocular vision and accommodation in prey-catching chameleons. J. Comp. Phsyiol. 182, 319–330. doi: 10.1007/s003590050182
Pérez i de Lanuza G., Ábalos J., Bartolomé A., Font E. (2018). Through the eye of a lizard: hue discrimination in a lizard with ventral polymorphic coloration. J. Exp. Biol. 221, jeb169565. doi: 10.1242/jeb.169565
Pettigrew J. D., Dreher B., Hopkins C. S., McCall M. J., Brown M. (1988). Peak density and distribution of ganglion cells in the retinae of microchiropteran bats: implications for visual acuity. Brain Behav. Evol. 32, 39–56. doi: 10.1159/000116531
Provencio I., Loew E. R., Foster R. G. (1992). Vitamin A2-based pigments in fully terrestrial vertebrates. Vis. Res. 32, 2201–2208. doi: 10.1016/0042-6989(92)90084-V
Reitner A., Sharpe L. T., Zrenner E. (1992). Wavelength discrimination as a function of field intensity, duration and size. Vis. Res. 32, 179e185. doi: 10.1016/0042-6989(92)90126-4
Röll B. (2000). Gecko vision—visual cells, evolution, and ecological constraints. J. Neurocytol. 29, 471–484.
Röll B. (2001). Gecko vision—retinal organization, foveae and implications for binocular vision. Vis. Res. 41, 2043–2056. doi: 10.1016/S0042-6989(01)00093-1
Roth L. S., Kelber A. (2004). Nocturnal colour vision in geckos. Proc. R. Soc B: Biol. Sci. 271, S485–S487. doi: 10.1098/rsbl.2004.0227
Rovama J. M., Kankaanpaa M. I., Hallikainen J. (2001). Spatial neural modulation transfer function of human foveal vision for equiluminous chromatic gratings. Vis. Res. 41, 1659e1667.
Schaeffel F. (1994). “Functional accommodation in birds,” in Perception and motor control in birds: an ecological approach. Eds. Davies M. N. O., Green P. R. (Springer-Verlag, Berlin Heidelberg), 35–51. doi: 10.3389/famrs2023.1129253
Schmitz L., Higham T. E. (2018). Non-uniform evolutionary response of gecko eye size to changes in diel activity patterns. Biol. Lett. 14, 20180064. doi: 10.1098/rsbl.2018.0064
Stapley J., Whiting M. J. (2006). Ultraviolet signals fighting ability in a lizard. Biol. Lett. 2, 169–172. doi: 10.1098/rsbl.2005.0419
Steinberg D. S., Leal M. (2013). Sensory system properties predict signal modulation in a tropical lizard. Anim. Behav. 85, 623–629. doi: 10.1016/j.anbehav.2012.12.025
Stuart-Fox D., Moussalli A., Whiting M. J. (2007). Natural selectino on social signals: signal efficacy and evolution of chameleon display coloration. Am. Nat. 170, 916–930. doi: 10.1086/522835
Stuart-Fox D., Rankin K. J., Lutz A., Elliot A., Hugall A. F., McLean C. A., et al. (2021). Environmental gradients predict the ratio of environmentally acquired carotenoids to self-synthesised pteridine pigments. Ecol. Lett. 24, 2207–2218. doi: 10.1111/ele.13850
Szabo B., Noble D. W. A., Whiting M. J. (2021). Learning in non-avian reptiles 40 years on: advances and promising new directions. Biol. Rev. 96, 331–356. doi: 10.1111/brv.12658
Torr G. A., Shine R. (1994). An ethogram for the small scincid lizard Lampropholis guichenoti. Amphibia-Reptilia 15, 21–34. doi: 10.1163/156853894X00524
Tresilian J. R., Mon-Williams M. (2000). Getting the measure of vergence weight in nearness perception. Exp. Brain Res. 132, 362–368. doi: 10.1007/s002210000333
Underwood G. (1970). “The eye,” in Biology of the reptilia, vol. 2 . Eds. Gans C., Parsons T. S. (Academic Press, London, New York), 1–97. Morphology B.
Veilleux C. C., Lewis R. J. (2011). Effects of habitat light intensity on mammalian eye shape. Anatomical Rec. 294, 905–914. doi: 10.1002/ar.21368
Vorobyev M., Osorio D. (1998). Receptor noise as a determinant of colour thresholds. Proc. R. Soc. B. 265, 351–358. doi: 10.1098/rspb.1998.0302
Wagner H. (1932). Über den Farbensinn der Eidichsen. Z. für Vergleichende Physiol. 18, 378–392. doi: 10.1007/BF00340648
Walls G. L. (1942). The vertebrate eye and its adaptive radiation (New York: Hafner). doi: 10.5962/bhl.title.7369
Werner Y. L., Seifan T. (2006). Eye size in geckos: asymmetry, allometry, sexual dimorphism, and behavioral correlates. J. Morphol. 267, 1486–1500. doi: 10.1002/jmor.10499
Yebra A., García J. A., Nieves J. L., Romero J. (2001). Chromatic discrimination in relation to luminance level. Color Res. Appl. 26, 123e131. doi: 10.1002/(ISSN)1520-6378
Yewers M. S., McLean C. A., Moussalli A., Stuart-Fox D., Bennett A. T., Knott B. (2015). Spectral sensitivity of cone photoreceptors and opsin expression in two colour-divergent lineages of the lizard Ctenophorus decresii. J. Exp. Biol. 218, 1556–1563. doi: 10.1242/jeb.131854
Yokoyama S., Yokoyama R. (1996). Adaptive evolution of photoreceptors and visual pigments in vertebrates. Ann Rev. Ecol. Syst. 27, 543–567. doi: 10.1146/annurev.ecolsys.27.1.543
Keywords: lizard, eye, retina, photoreceptor, vision, color, depth, intensity
Citation: Fleishman LJ (2024) Lizard visual ecology. Front. Amphib. Reptile Sci. 2:1426675. doi: 10.3389/famrs.2024.1426675
Received: 01 May 2024; Accepted: 11 July 2024;
Published: 09 August 2024.
Edited by:
Faraham Ahmadzadeh, Shahid Beheshti University, IranReviewed by:
Ulrike E. Siebeck, The University of Queensland, AustraliaKerim Çiçek, Ege University, Türkiye
Copyright © 2024 Fleishman. This is an open-access article distributed under the terms of the Creative Commons Attribution License (CC BY). The use, distribution or reproduction in other forums is permitted, provided the original author(s) and the copyright owner(s) are credited and that the original publication in this journal is cited, in accordance with accepted academic practice. No use, distribution or reproduction is permitted which does not comply with these terms.
*Correspondence: Leo J. Fleishman, ZmxlaXNobWxAdW5pb24uZWR1