 Darlene Campbell
 Ellis R. Loew
- Department of Biomedical Sciences, Cornell University, Ithaca, NY, United States
Colored oil droplets are a common feature in the cones of almost all diurnal lizards. Using white light microscopy, three chromotypes of droplet can be identified in anoles – yellow, green and colorless. These droplets have been associated with different cone classes using microspectrophotometry. The principal member of double cones contain a yellow droplet while the accessory member contains a diffuse yellow pigment. Both members contain the LWS visual pigment. One class of large single cone contains a yellow droplet and the LWS visual pigment. The two remaining classes of large single cone contain the green droplet and either the LWS or MWS visual pigment. As such, by noting the distribution and numbers of the different droplet chromotypes, information about cone distribution, type, and number can be deduced microscopically. Retinas from three anole species (A. cristatellus, A. sagrei, and A. carolinensis) were isolated, flattened and oriented using the two foveae as landmarks. A 19-gauge needle was used to punch out six full-thickness retinal disks from identical retinal regions from both eyes of the three species. The different oil droplets were microscopically identified by color and counted. In all three species at all six retinal areas, the colorless droplets associated with the UVS and SWS single cones represented approximately 10% of the total droplets counted. However, the proportions of the yellow and green droplets were significantly different between the species. For A. cristatellus, 80% of the droplets were green while 10% were yellow. For A. sagrei approximately 85% of the droplets were yellow while only 5% were green. For A. carolinensis 50% of the droplets were yellow while 40% were green. The possible significance of these variable proportions is discussed in terms of possible effects on color vision and ecotype of the three anoles.
1 Introduction
Oil droplets are a common feature in the cones of almost all diurnal lizards (Walls, 1942; Walls and Judd, 1933) where they function as long-pass filters enhancing color discrimination (Govardovskii, 1983; Vorobyev, 2003), light-collecting lenses increasing sensitivity in the passband and perhaps enabling polarized light detection (Young and Martin, 1984), and absorbers of actinic short-wavelength radiation that can damage the outer segments (see review of Toomey and Corbo, 2017). A microspectrophotometric (MSP) study of 17 species of Caribbean anoles measured five distinct oil droplet types (Loew et al., 2002). Based on their color as seen using white-light microscopy they are identified as G1 (Green 1), G2 (Green 2), Y (Yellow), C1 (Colorless 1) and C2 (Colorless 2). While C1 and C2 are colorless, C1 shows strong absorbance below 400nm while C2 remains transparent to below 300nm. This same study also measured four visual pigments having absorbance maximums (λmax) in the region of 565nm, 495nm, 465nm and 365nm, respectively. Note that the long-wavelength visual pigment of Anolis carolinensis has a λmax of 625nm due to its use of a vitamin A2-based chromophore (Provencio et al., 1992). Combining the two sets of MSP data yields six classes of cone (Figure 1). However, as noted above, only three chromomorphs can be identified using white-light microscopy of flat mounts –Yellow, Green and Colorless. Even so, much can still be learned by determining the distribution of the different chromotypes in the retina. Presented here are such data for three anole species – Anolis carolinensis, A. cristatellus and A. sagrei.
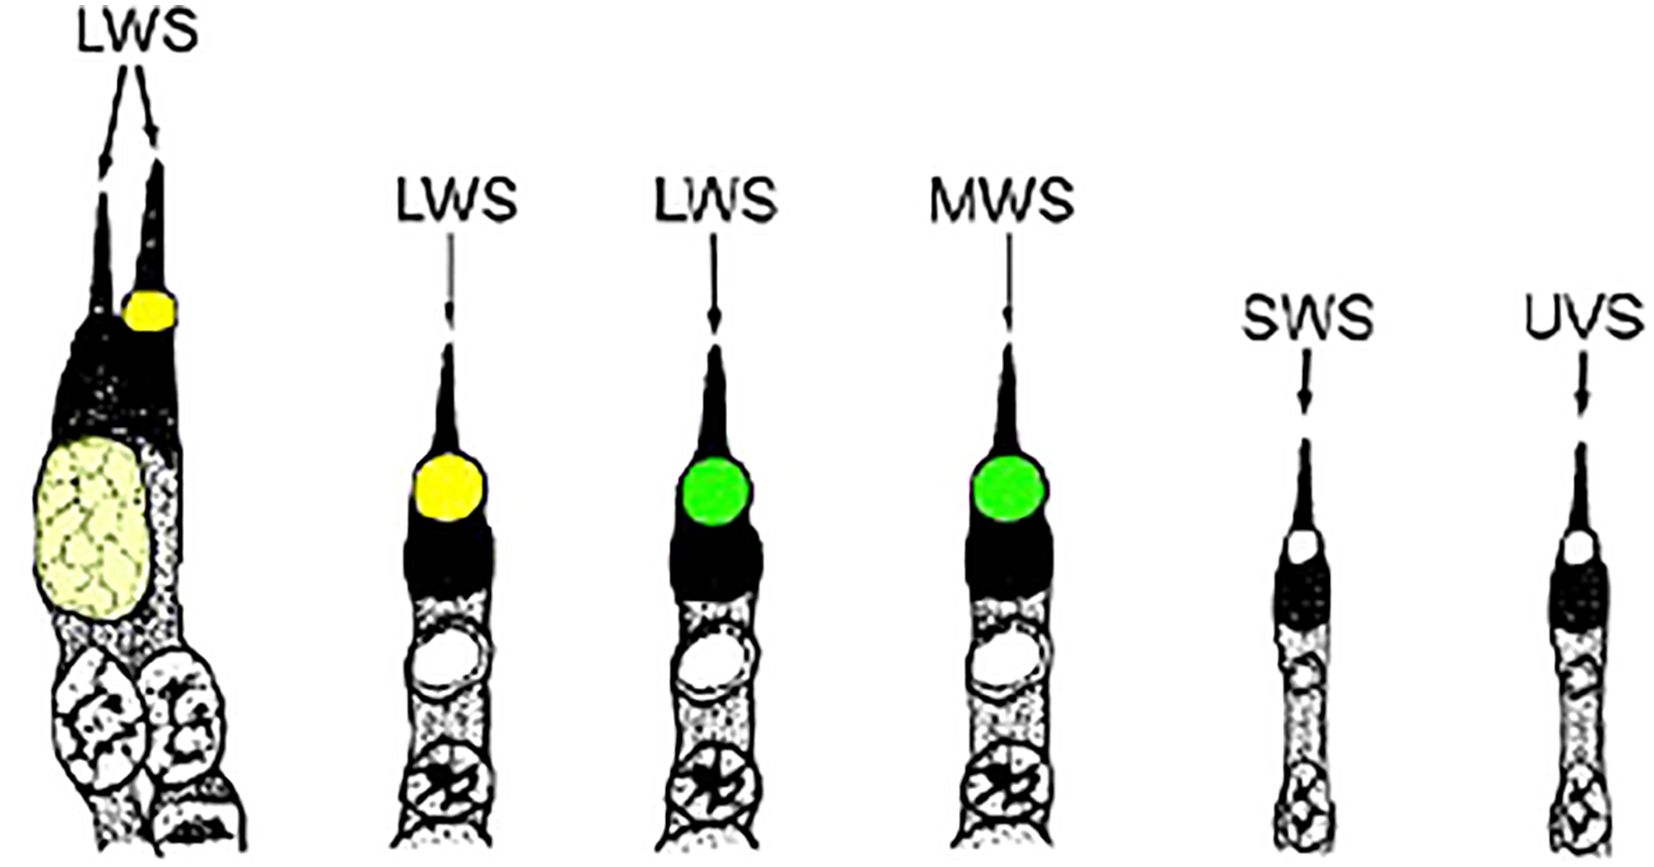
Figure 1. Drawings of the photoreceptors typically found in anoline lizards. The visual pigment is shown in its associated cell type, as is the oil droplet that is linked to it. The color of the oil droplets shown is representative of their visual appearance in light micrographs of retinal preparations. LWS, long-wavelength-sensitive; MWS, medium-wavelength-sensitive; SWS, short-wavelength-sensitive; UVS, ultraviolet-sensitive (adapted from Loew et al., 2002).
2 Methods
2.1 Species
All anoles were obtained from Glades Herp, Bushnell, Florida. The three species used were Anolis carolinensis, A. cristatellus and A. sagrei. All animals were wild-caught. Individuals of each species were kept for phylogenetic identification and verification. The anoles used in this study were chosen to represent several different ecotypes. This would hopefully allow correlation of any differences in the distribution of cone class with the photic environment and/or visual tasks of the animal. The anoles investigated in this current study are the green anole, A. carolinensis, the crested anole, A. cristatellus, and the brown anole, Anolis sagrei.
Anolis carolinensis, a trunk-crown ecomorph, is the only anole native to the United States and is widely distributed in the southeastern states. It is variable in size, with a snout-vent length (SVL) of about 48 mm in males and 26 mm in females, and spends significant amounts of time in the canopy (Roughgarden, 1995). Its dewlap is yellow and pink. Three females (average weight 2.169g) and seven males (average weight 2.991g) were used in this study.
Anolis cristatellus is slightly larger than other anoles, with an average SVL of 75 mm in males and 55 in females and is a trunk-ground ecomorph native to Puerto Rico (Roughgarden, 1995). They have yellow and red dewlaps. Ten males (average weight 8.516g) were used in this study.
Anolis sagrei are small diurnal lizards native to Cuba. The average snout-to-vent length (SVL) of males is 50 mm, while that of females is 39 mm (Schettino, 1999). This species is a highly successful invader and is now found in Jamaica, Grand Cayman, and Florida (Kolbe et al., 2004). They are trunk-ground ecomorphs. Compared to species of a similar ecomorph on different islands, A. sagrei is smaller and is found in a more open habitat (Roughgarden, 1995). The dewlap of the brown anole is red, outlined with yellow. Ten males (average weight 4.770g) and three females (average weight 2.254 g) were used in this study.
Animals were housed and cared for in accordance with IACUC Protocol # 01-115. The animals were in a glass terrarium equipped with water, a hot rock, and tree branches. A heat lamp was directed at the cage on a 12-hour cycle so that the cage was kept at 70–75°Fahrenheit at night (7:00PM – 7:00AM) and 75–80°Fahrenheit (7:00AM – 7:00PM) during the day. The animals were misted daily, and their containment room was kept under constant heat and humidity control. If the animals were held for more than 3 days, they were fed live crickets. No animal was held in captivity for greater than 10 days.
2.2 Sample preparation
Animals were anesthetized using halothane after which they were weighed and sexed. The animals were then decapitated and enucleated. The eyes were placed in a 0.01M PBS solution and left overnight (up to 14 hours) in a refrigerator to facilitate retinal detachment from the retinal pigment epithelium (RPE). The following day, each eye was hemisected with a fine razor blade and the lens and vitreous removed. The eyecup was immersed in 0.01M PBS and the retina dissected away from the RPE. Once the retina was free from the eyecup, small radial cuts were made at its edges in order to flatten it (Stone, 1981). The conus papillaris – emerging from the center of the optic disk – was then removed with a blunt needle, leaving behind a hole in the retina. Once the retina was flattened, its orientation was determined using retinal landmarks. In addition to the hole that is left behind from the removal of the conus, the central and temporal foveae are easily discernible. The central fovea appears as a dark area in the retina, while the temporal fovea is only slightly darker than the parafoveal regions surrounding it. These landmarks are then used to locate the areas of interest.
Due to the size and delicate nature of the isolated retina, only six areas could be sampled before the tissue degraded to a point where further samples could no longer be consistently obtained. The six areas were chosen to be representative of different retinal regions, e.g., central, peripheral, etc. (Figure 2). Once located using the retinal landmarks, the areas of interest are “punched” out of the whole retina with a 19-gauge blunt hypodermic needle, resulting in circular discs 0.68 mm in diameter and an area of 0.363 mm2. Both foveae were excluded from this study. Their anatomy prevents the technique used here from acquiring consistently accurate counts of oil droplets from these areas.
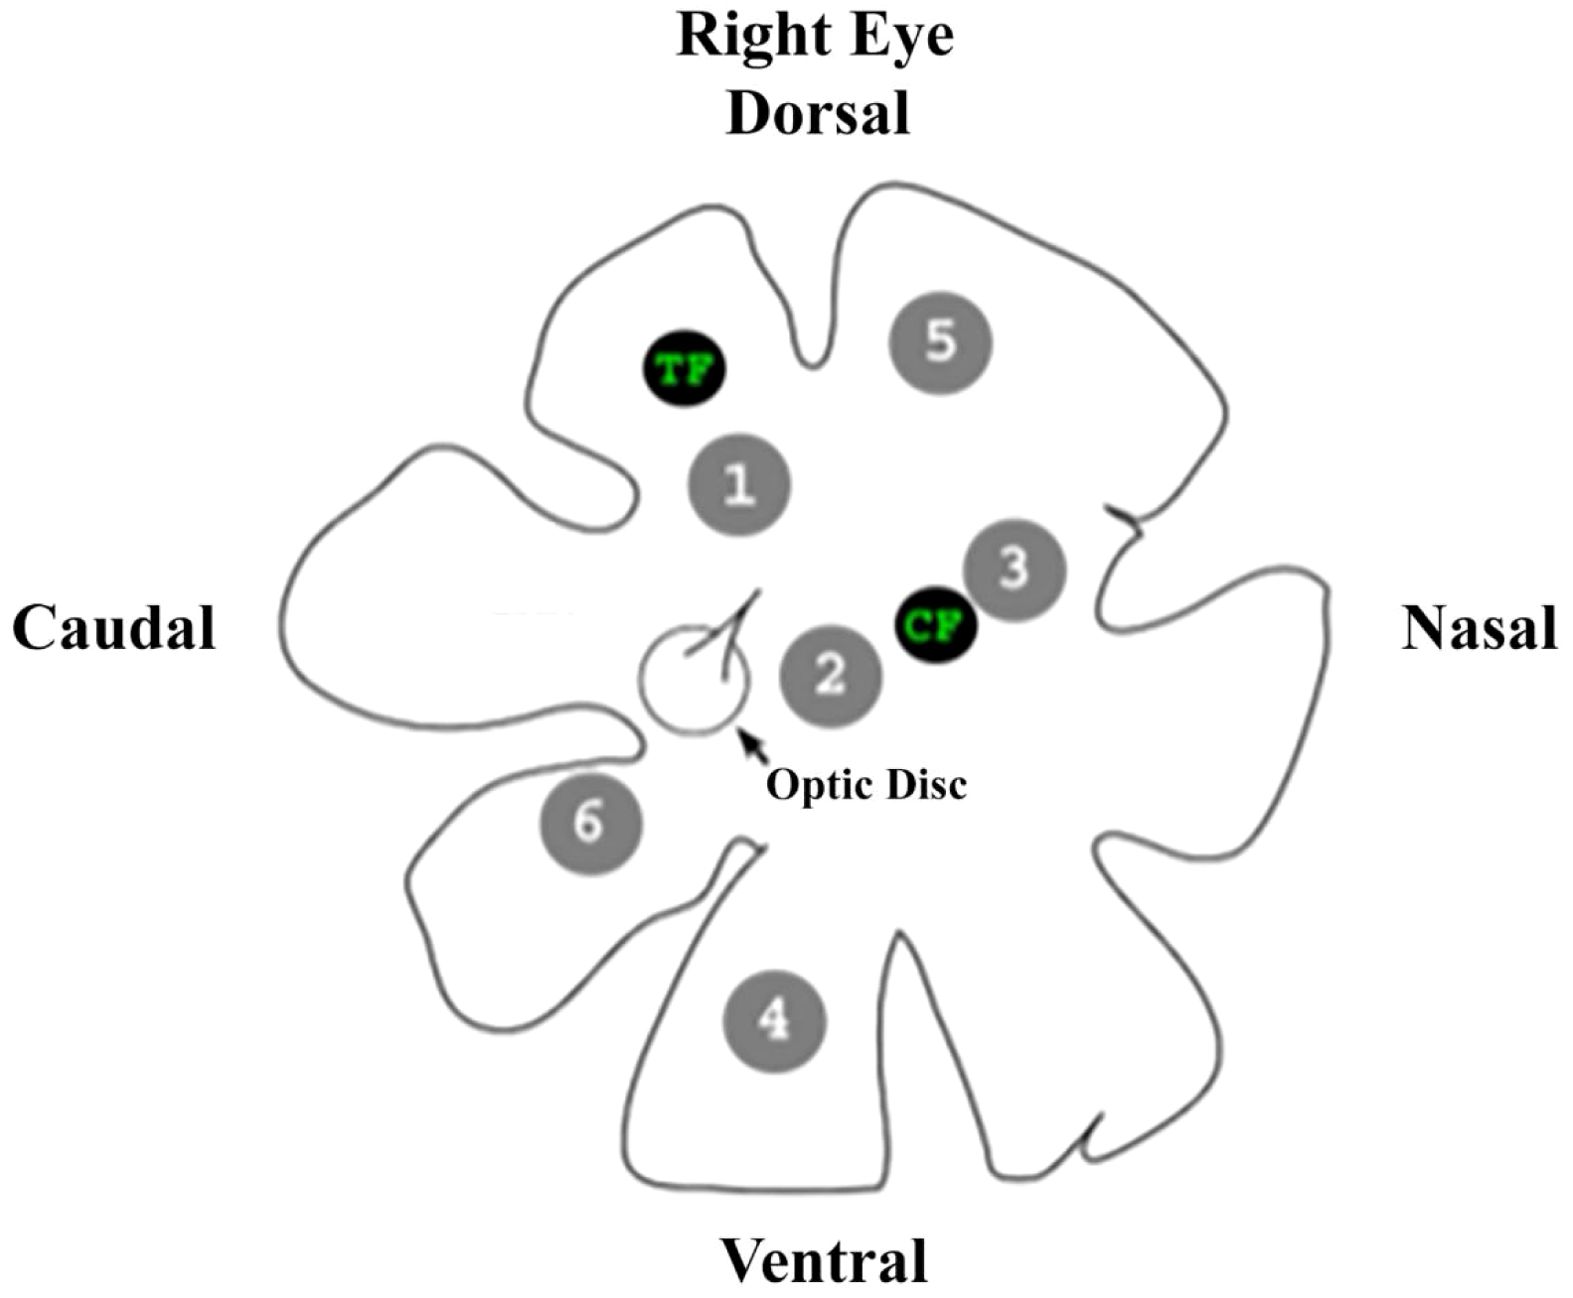
Figure 2. A drawing of the right eye of an anoline lizard showing the retinal landmarks used to determine the areas of interest excised from each retina for investigation, as well as the location of each area. TF, temporal fovea; CF, central fovea.
2.3 Data collection
Each individual retinal disc was placed onto a clean glass slide, photoreceptor side up, and covered with a raised glass cover slip. The preparations were examined with a Zeiss Photomicroscope III microscope under tungsten illumination at 400X magnification. Figure 3 shows a typical microscopic field of view of the retinal preparation. The right ocular eyepiece was equipped with a reticle marked with crosshairs and evenly spaced concentric circles, dividing the field into four quadrants of ten regions. The number of oil droplets of each class was counted using a manual cell counter from the live view of the microscope field. The oil droplets were counted and recorded from six non-overlapping fields of view from each punched out retinal area.
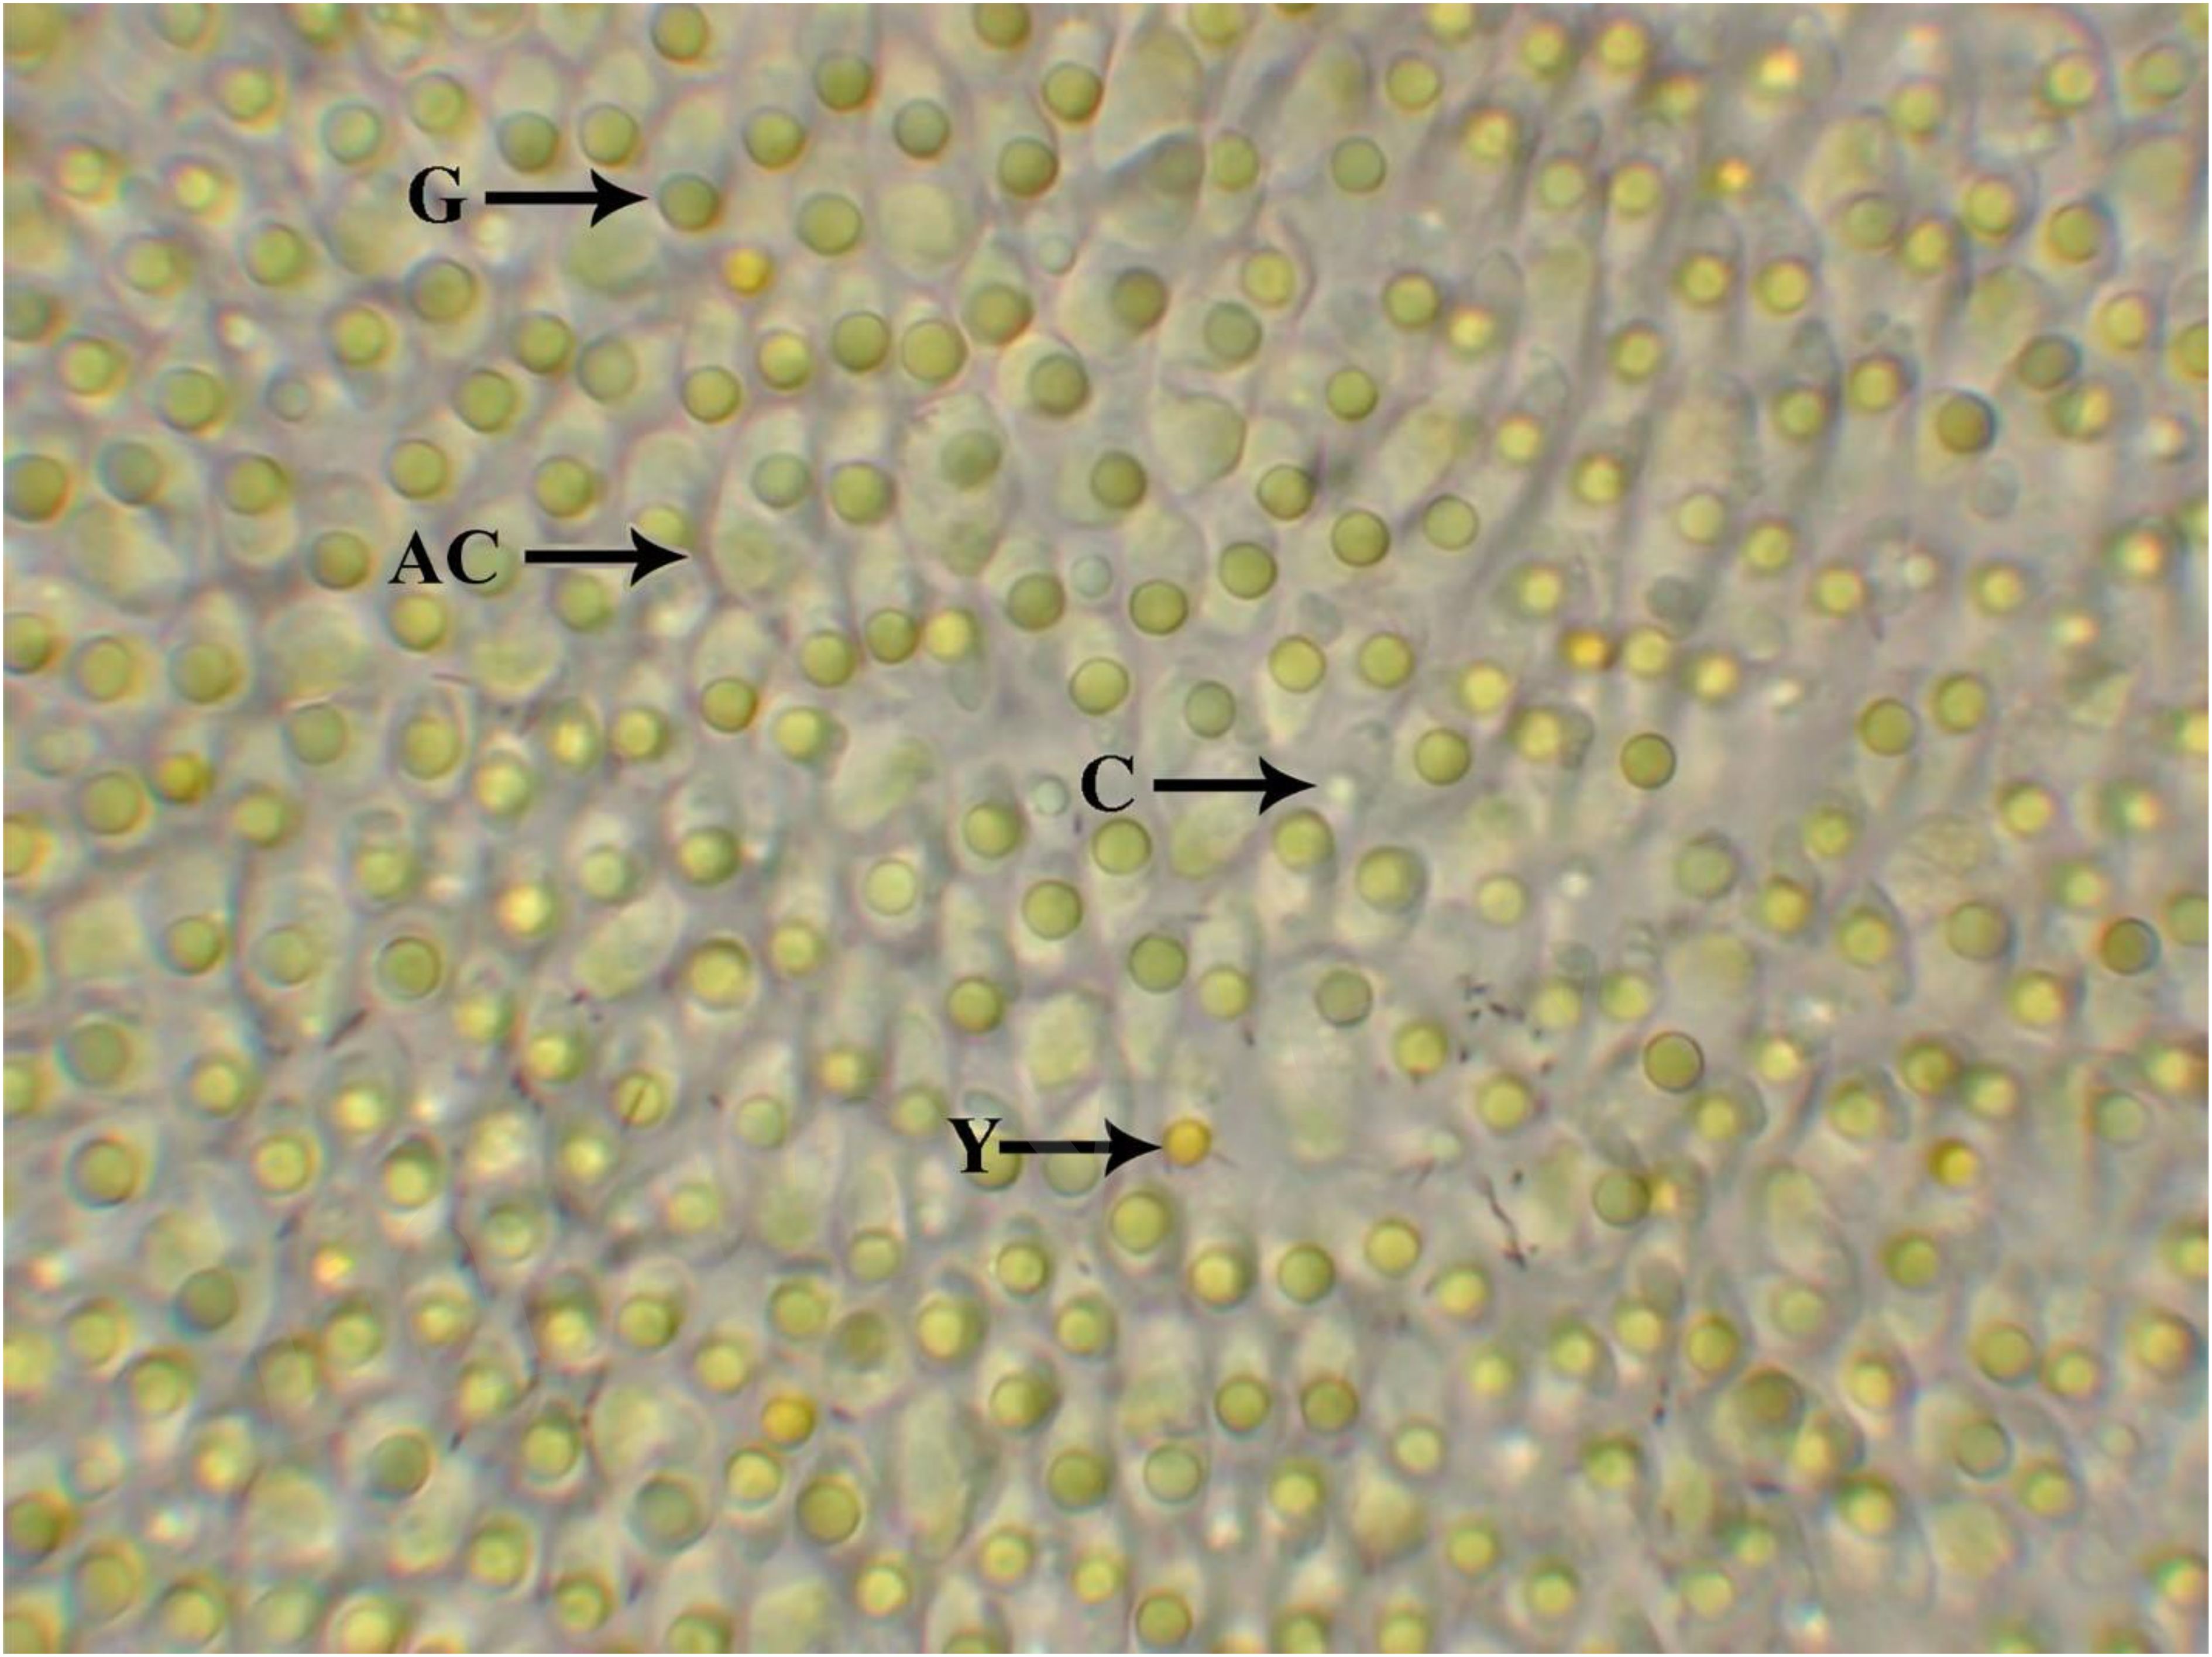
Figure 3. Appearance of oil droplets in A. cristatellus. Examples of the three color morphs are identified – Y, yellow; G, green and C, colorless. AC, accessory member of double cone. Note the preponderance of green droplets relative to the yellow and colorless droplets.
This method gave more accurate results than earlier attempts in which counts were made from a computer image of the field. Because of their refractive nature, the color of the droplets varied somewhat as they moved in and out of focus. The consequence of this arrangement is that not all classes of oil droplets are in focus at one time. Accurate classification required active focusing.
Control counts were performed to validate the counting method used and determine the observer variability or bias.
2.3.1 Control #1
To test for any potential sampling error, the cells in several regions were counted four times by the same individual. The oil droplet types were recorded and then the same region was blindly counted again. The results of these counts were analyzed for any statistically significant differences using a 1-sample Sign test (1-sample Sign, Minitab 14, Minitab, USA).
2.3.2 Control # 2
Because the potential existed of not obtaining the samples from identical areas of each retina, another control was performed to ensure the areas of interest sampled from each retina were as close to identical as possible. In four of the investigated retinas, four additional sampling areas, located at 3 o’clock, 6 o’clock, 9 o’clock and 12 o’clock, were taken immediately contiguous to the area of interest. These areas were counted in the same manner as the areas of interest. The results of these areas were tested for significance using a 1-sample Sign test (1-sample Sign, Minitab 14, Minitab, USA).
2.3.3 Control # 3
To eliminate the question of any subjectivity that may have infiltrated the counting of oil droplets, a single neutral observer made counts of the same areas after the primary observer. The two counts were then assessed for significance using a 1-sample Sign test (1-sample Sign, Minitab 14, Minitab, USA).
2.4 Statistical treatment of data
The raw data consisted of counts of oil droplets of different spectral class for each of the six retinal areas. To determine if the proportion of droplets of different classes varied across the retina, significance testing using analysis of variance (ANOVA, Minitab 14, Minitab, USA) was performed. Each class of oil droplet was tested separately with the number of oil droplets serving as the dependent variable and the retinal area (1–6) serving as the within-subjects factor. To further investigate potential variability between the six measured areas, 1-sample t-tests were performed comparing each area to another within each eye. Fifteen comparisons for each spectral class of oil droplet were performed.
To test for intraretinal variation of the proportions of oil droplet classes across the retina, significance was also assessed using analysis of variance (ANOVA, Minitab 14, Minitab, USA), with the proportion of oil droplets being the dependent variables and the retinal area being the within-subjects factor. A separate ANOVA was performed for each class of oil droplets.
The significance of right eye/left eye symmetry variation was measured using a nonparametric 1-sample Wilcoxon test (1-sample Wilcoxon, Minitab 14, Minitab, USA). Again, the three classes of oil droplets were tested separately. Both intra- and inter-species variation were assessed using analysis of variance (ANOVA, Minitab 14, Minitab, USA). The counts or proportion of oil droplets served as the dependent variable in each test case. A separate ANOVA was performed for each class of oil droplet. To measure intraspecies variation, “individual” was the between-subjects factor, while “species” was the between-species factor in the assessment of inter-species variation.
In all significance testing of proportions of classes of oil droplets, the proportions were normalized using the arcsine-square-root transformation prior to statistical analysis (Sokal and Rohlf, 1981).
In all of the above tests, the confidence interval was set at 0.05. The null hypothesis, that the variable being tested was not different with respect to the proportion of oil droplets, was accepted if p > 0.05. The alternative hypothesis stated that the variable being tested was different with respect to the proportions of oil droplets and was accepted if p < 0.05.
3 Results
3.1 General observation
3.1.1 Retinal appearance
The retinas of all three species of Anolis lizards investigated possess the same three spectral classes of oil droplets, classified by their appearance upon visual inspection – yellow, green, and colorless. Although the three classes could be differentiated in the retinas of all three species, the actual hue of the droplets varied among the species. The most striking difference is that the “yellow” droplets of A. carolinensis have a more “orange” appearance than those found in either A. cristatellus or A. sagrei. Also, the yellow oil droplets appear darker in A. cristatellus than in both A. carolinensis and A. sagrei. Likewise, the green oil droplets also appear paler in the latter two species than in A. cristatellus (Figure 3). The colorless oil droplets have the same appearance in all three species. Whereas the yellow and green oil droplets were consistently the same size in all species, the colorless droplets appeared noticeably smaller. While there was no evidence of a retinal mosaic, there was indication of local clumping or grouping in the visual inspection of all six measured areas of the retinal preparations. For example, Figure 3 shows that the retina of Anolis cristatellus contains a much higher proportion of green oil droplets than either yellow or colorless droplets. Because of the sheer number of green droplets as compared to yellow or colorless droplets, clumping of the green oil droplets results, leading to an apparent uniformity across the retinal area. Tests for uniformity in the arrangement of all three different oil droplet classes revealed that across local regions of the retinas of both A. cristatellus and A. sagrei, uniformity exists (χ2 = 1.156 for A. cristatellus; (χ26, 0.95 = 1.205 for A. sagrei). However, it appears that the different oil droplet classes are not uniformly distributed across local regions of the retina of A. carolinensis (χ2 6, 0.95 = 5.403). This lack of uniformity most likely results from the fact that the retinas of A. carolinensis contain nearly equal proportions of both yellow and green oil droplets. This equality varies greatly from the highly disparate proportions of yellow and green oil droplets found in both A. cristatellus and A. sagrei. It is believed that these extreme differences in proportions of yellow to green oil droplets leads to uniformity.
In all preparations, the colorless oil droplets were always in the minority, while the green and yellow droplets seemed to be distributed more evenly. As can be seen in Figure 3, the color of the oil droplets of each different class was nearly identical across an entire microscope field.
3.2 Retinal distribution of oil droplets
The raw counts of oil droplets of the three different classes were analyzed with significant testing methods in a number of different comparisons to look for variability. All raw data can be found in Campbell (2006).
3.2.1 Intraretinal variability – absolute counts
Figures 4–6 show the variability of absolute counts of oil droplets that exists between the six measured retinal areas in A.carolinensis, A. cristatellus, and A. sagrei, respectively. The differences between the counts of oil droplet classes between retinal areas appeared to be significant (p < 0.05, 1-sample t-test, Minitab 14, USA). More comprehensive significance testing using 1-Sample t-tests was performed to search for any trends that would further explain this variability. In all, 15 comparisons were made for each oil droplet class within each retina comparing each area to another. The p-values of more than 5% of the comparisons are significant (Campbell, 2006). These comparisons offer further evidence that the number of oil droplets of different classes is not static among individuals of the same species. No apparent trend is seen in the significant differences concerning oil droplet class, area, or species.
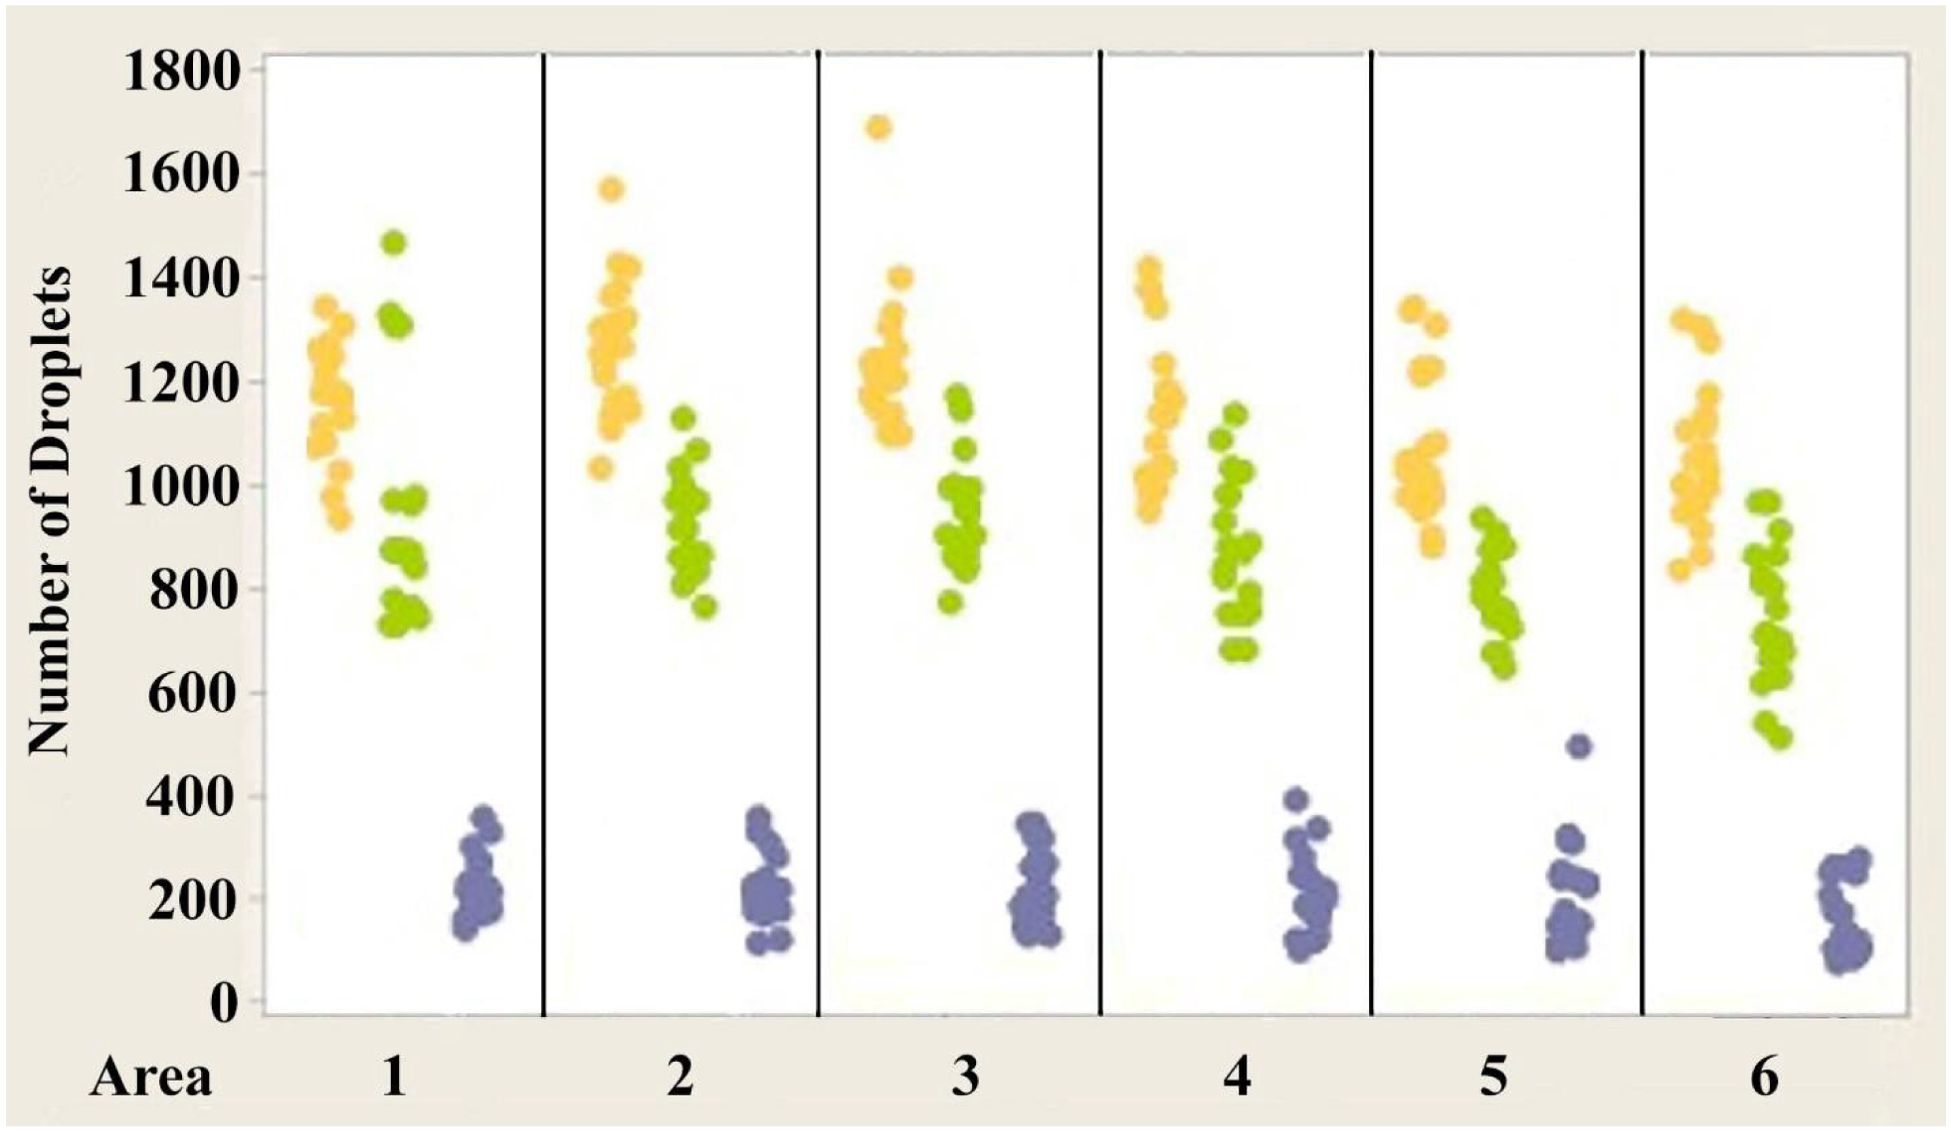
Figure 4. Individual value plot comparing the number of oil droplets of each class found in each of the six areas of interest from the eyes of Anolis carolinensis. Each point on the graph represents the number of oil droplets found in the two eyes of each individual. Y, Yellow; G, Green; C, Colorless. N=10.
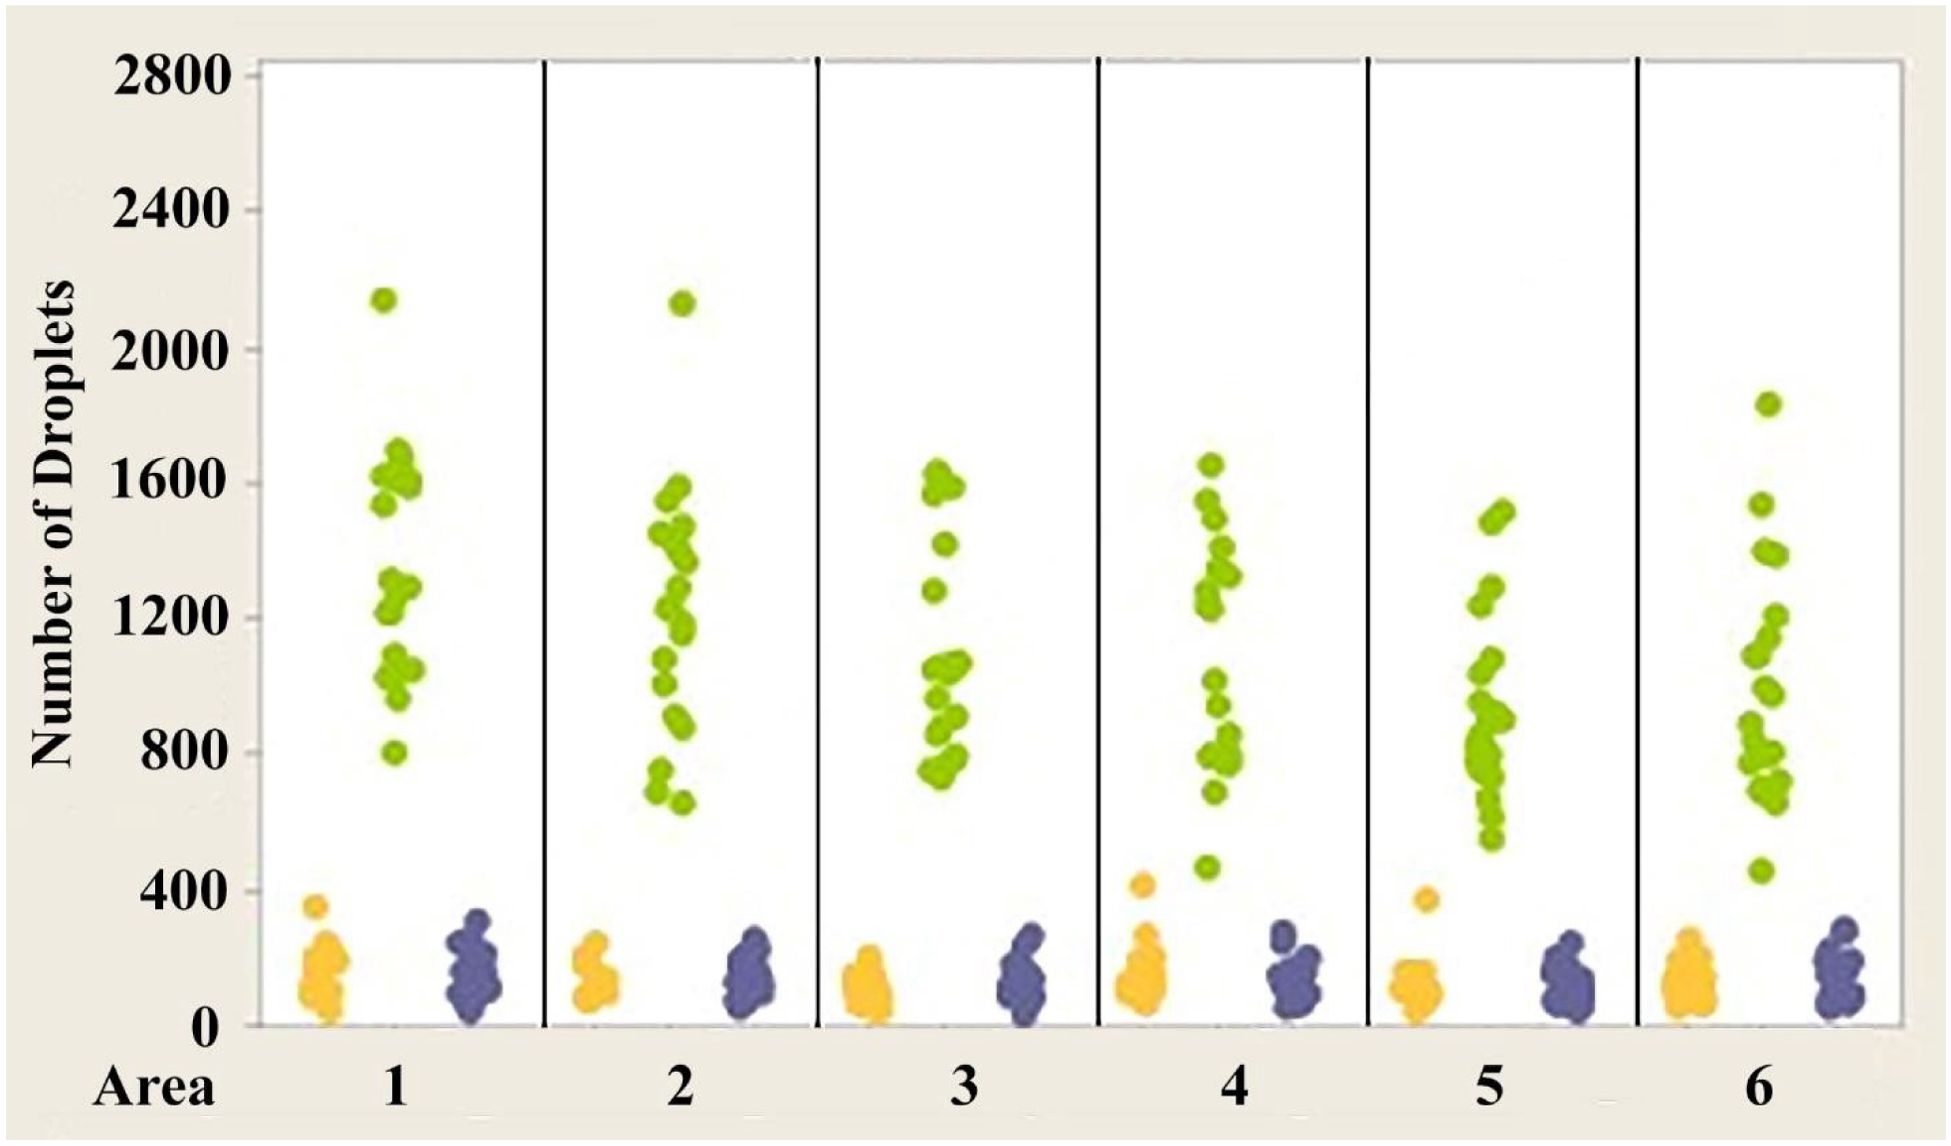
Figure 5. Individual value plot comparing the number of oil droplets of each class found in each of the six areas of interest from the eyes of Anolis cristatellus Each point on the graph represents the number of oil droplets found in the two eyes of each individual. Y, Yellow; G, Green; B, Colorless. N=10.
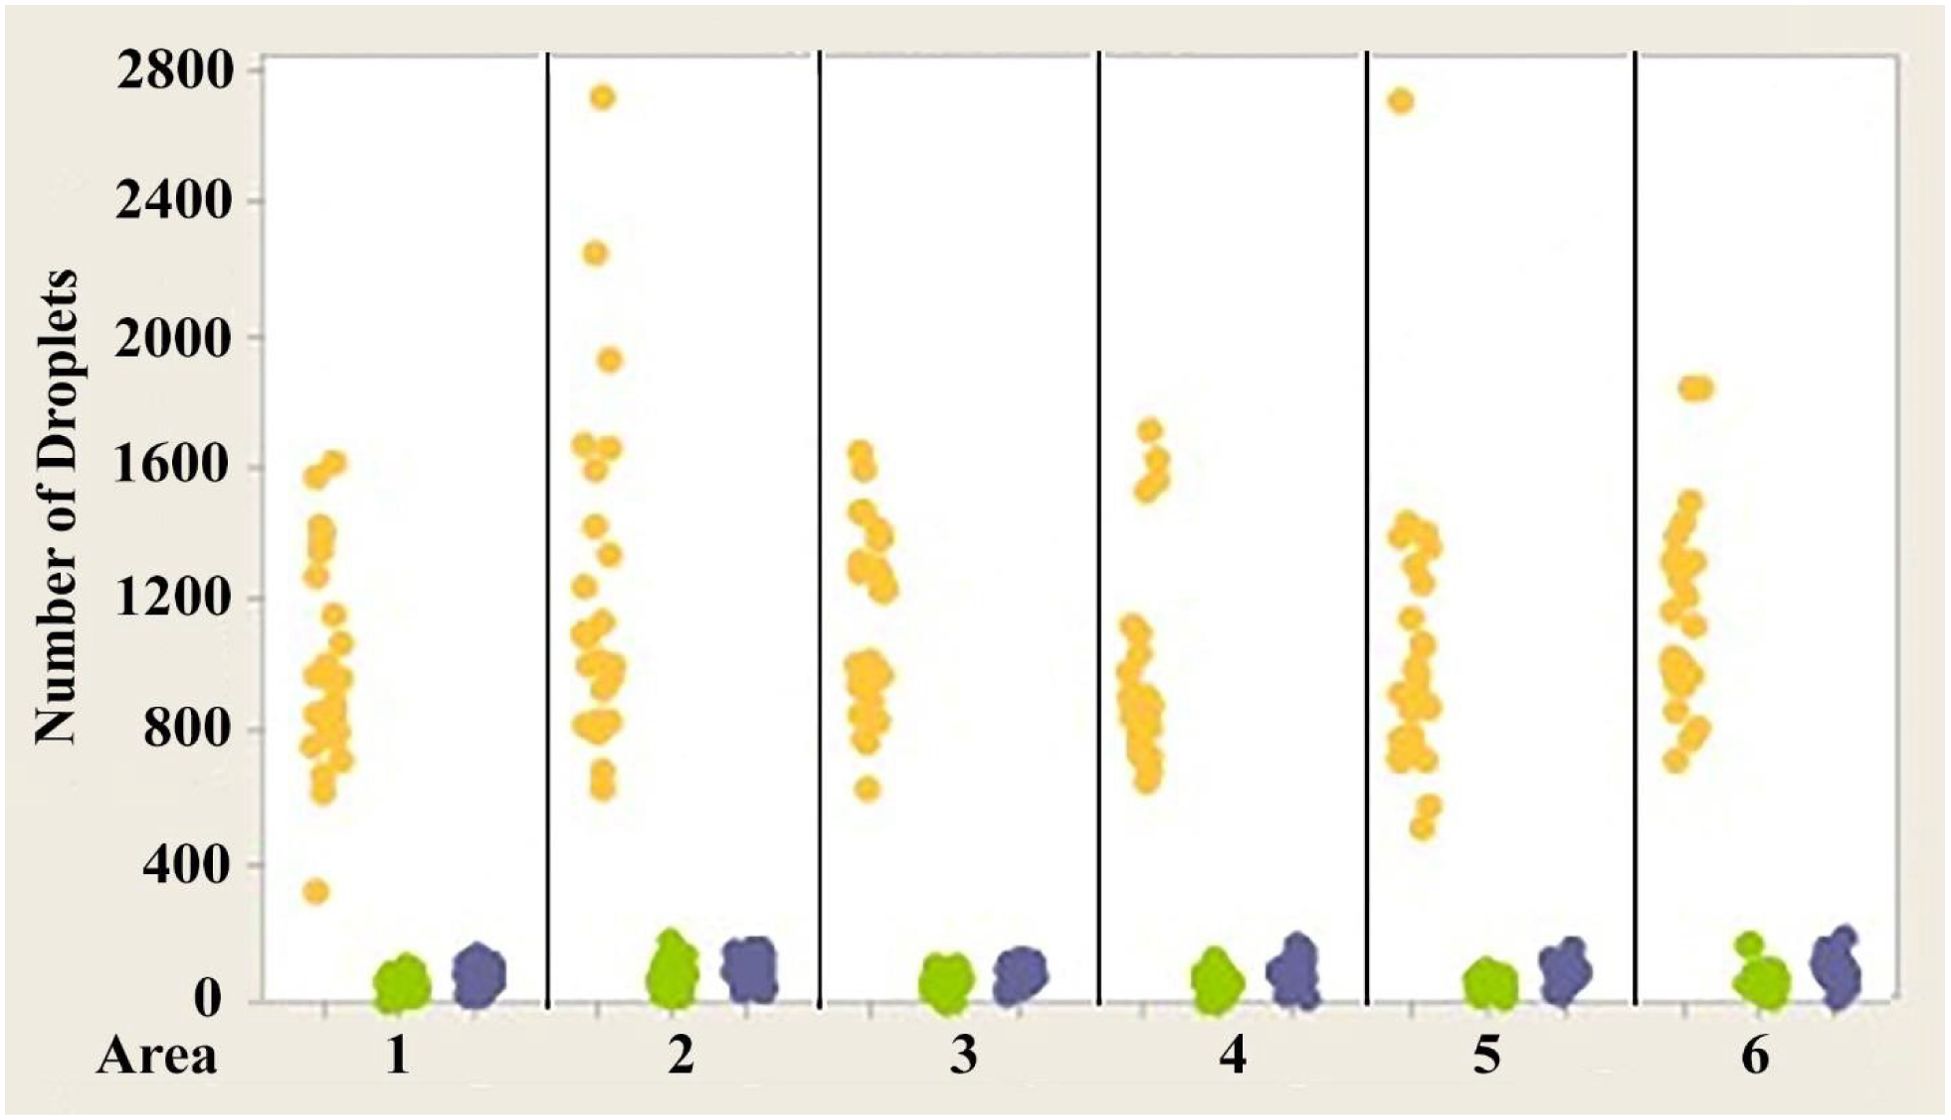
Figure 6. Individual value plot comparing the number of oil droplets of each class found in each of the six areas of interest from the eyes of Anolis sagrei. Each point on the graph represents the number of oil droplets found in the two eyes of each individual. Y, Yellow; G, Green; C, Colorless. N=13.
3.3 Proportions of oil droplets
In addition to the numbers of oil droplets, the proportion of each oil droplet spectral class in each counted region was also calculated and tested for variability. The proportions were first normalized and transformed prior to statistical testing using a square-root-arcsine transformation (Sokal and Rohlf, 1981).
3.3.1 Right eye/left eye symmetry – proportions
Figures 7–9 illustrate the trend that exists for the proportion of oil droplet classes found in the right and left eyes of A. carolinensis, A. cristatellus, and A.sagrei. The proportions were first normalized and transformed prior to statistical testing using a 1-sample Wilcoxon test (Sokal and Rohlf, 1981).
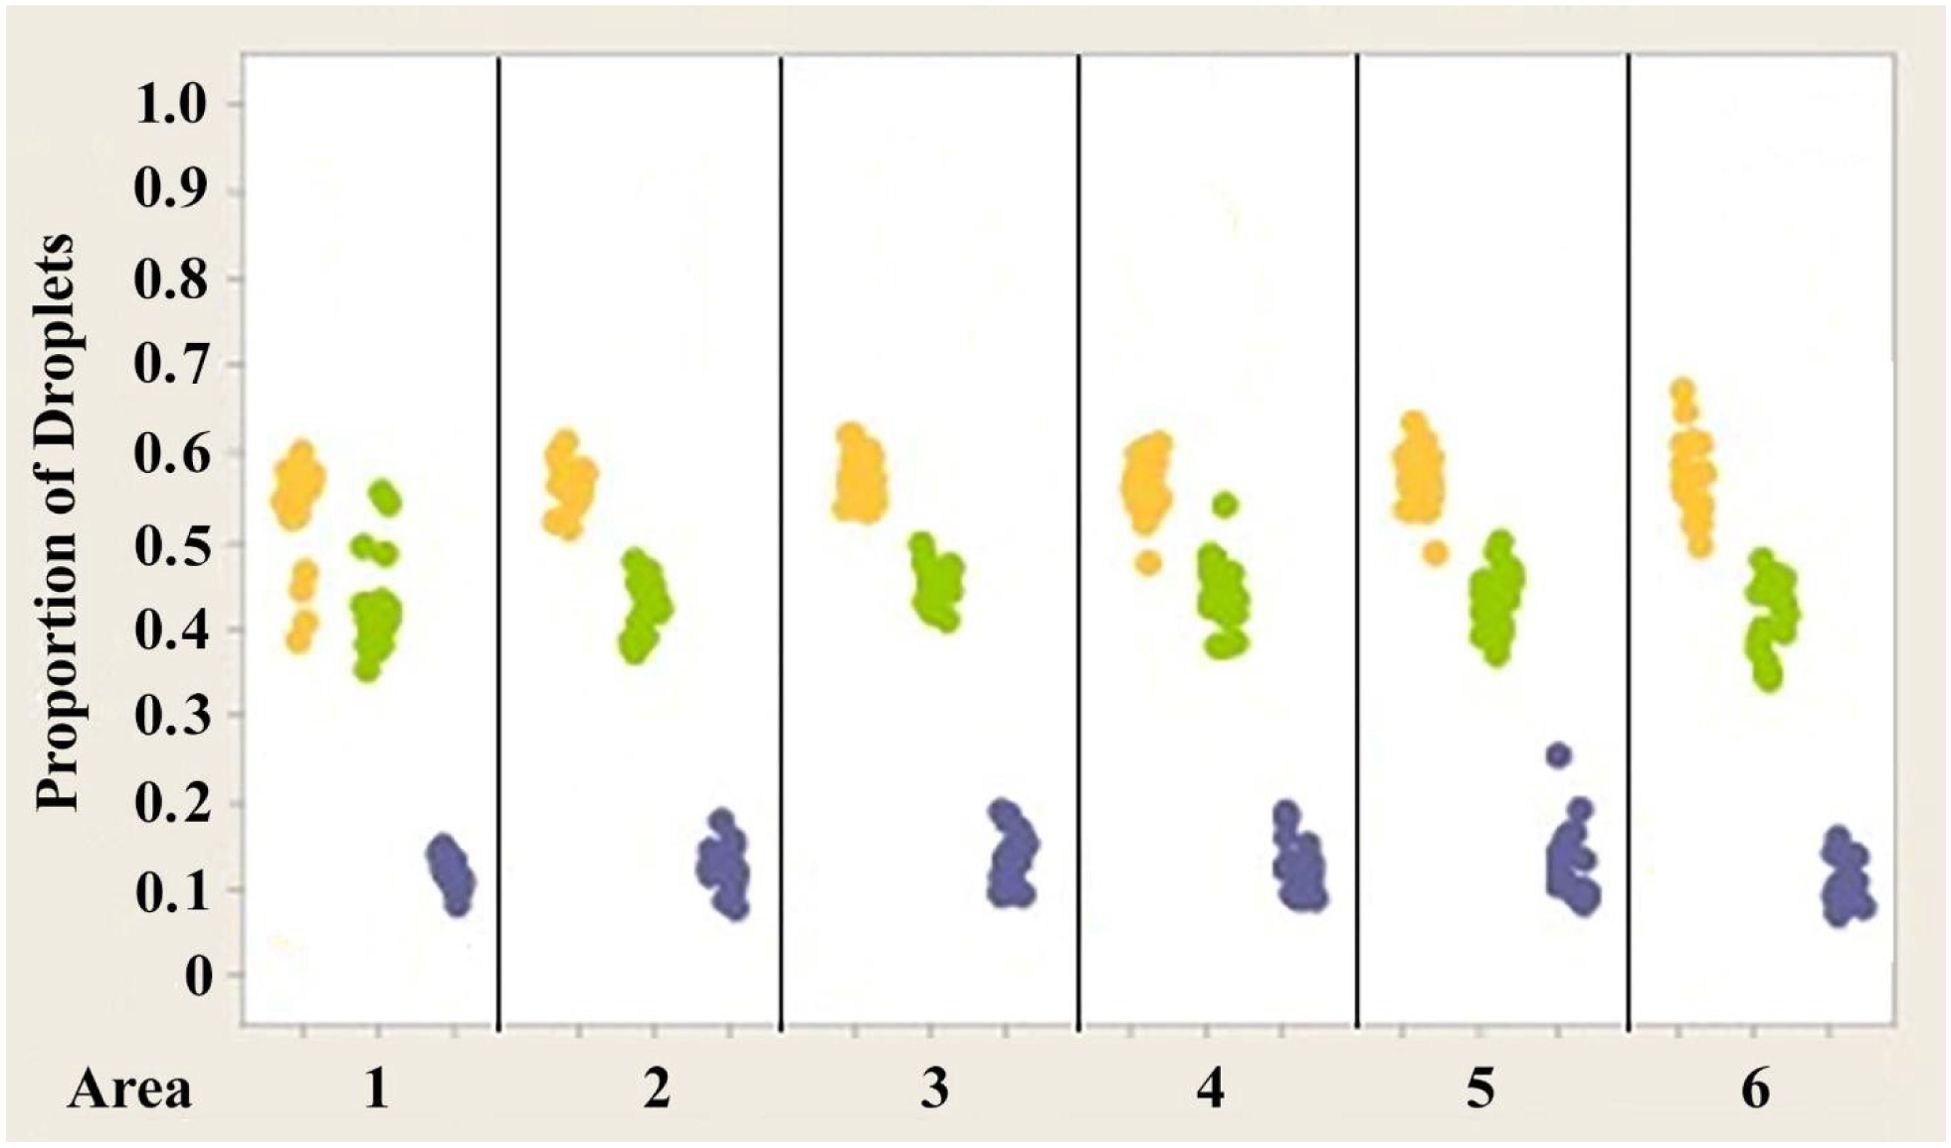
Figure 7. Individual value plot comparing proportions of oil droplets from the right and left eyes of Anolis carolinensis. Oil droplet counts from the different measured areas (1–6) were combined since no significant differences were found between the areas. Each point on the graph represents the proportion of oil droplets from one individual.
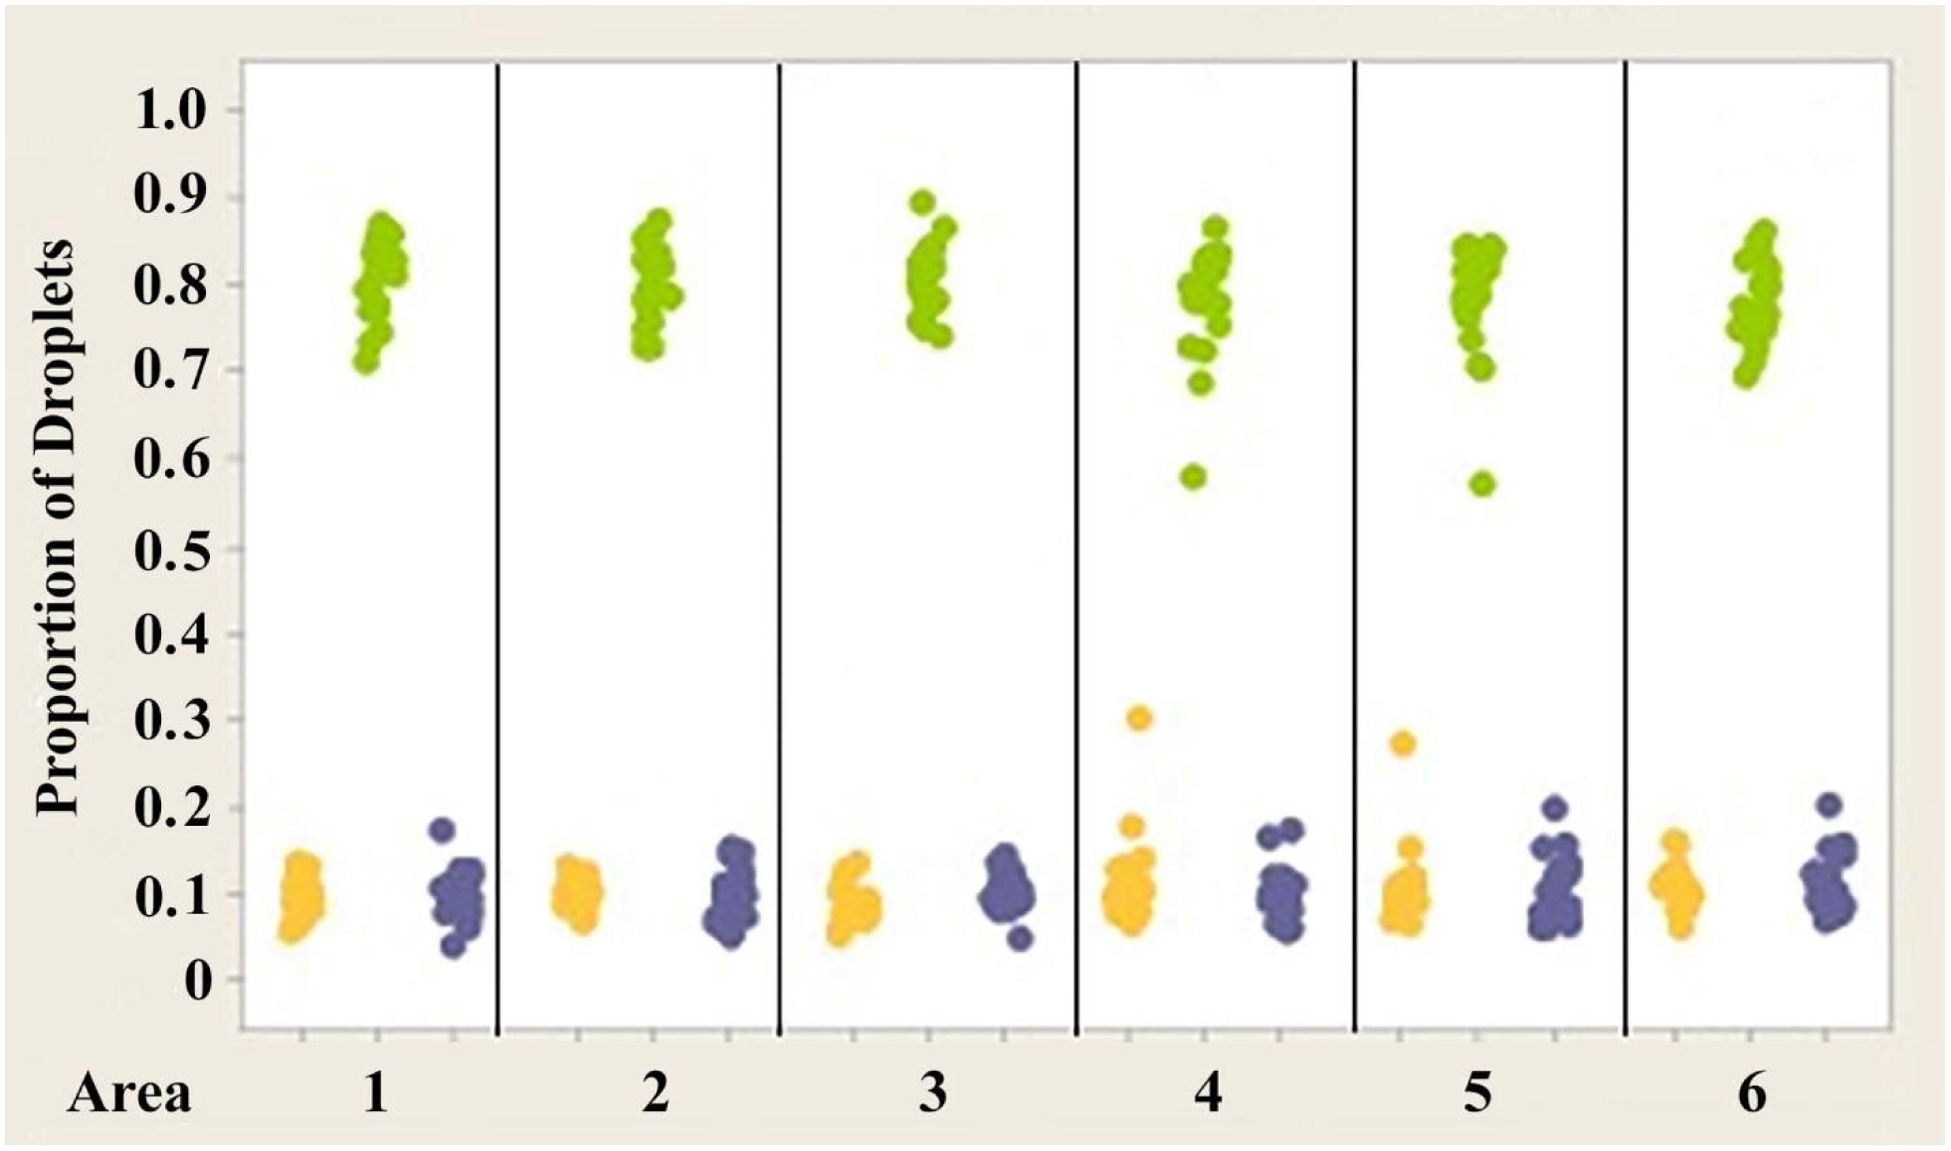
Figure 8. Individual value plot comparing proportions of oil droplets from the right and left eyes of Anolis cristatellus. Oil droplet counts from the different measured areas (1–6) were combined since no significant differences were found between the areas. Each point on the graph represents the proportion of oil droplets of one individual.
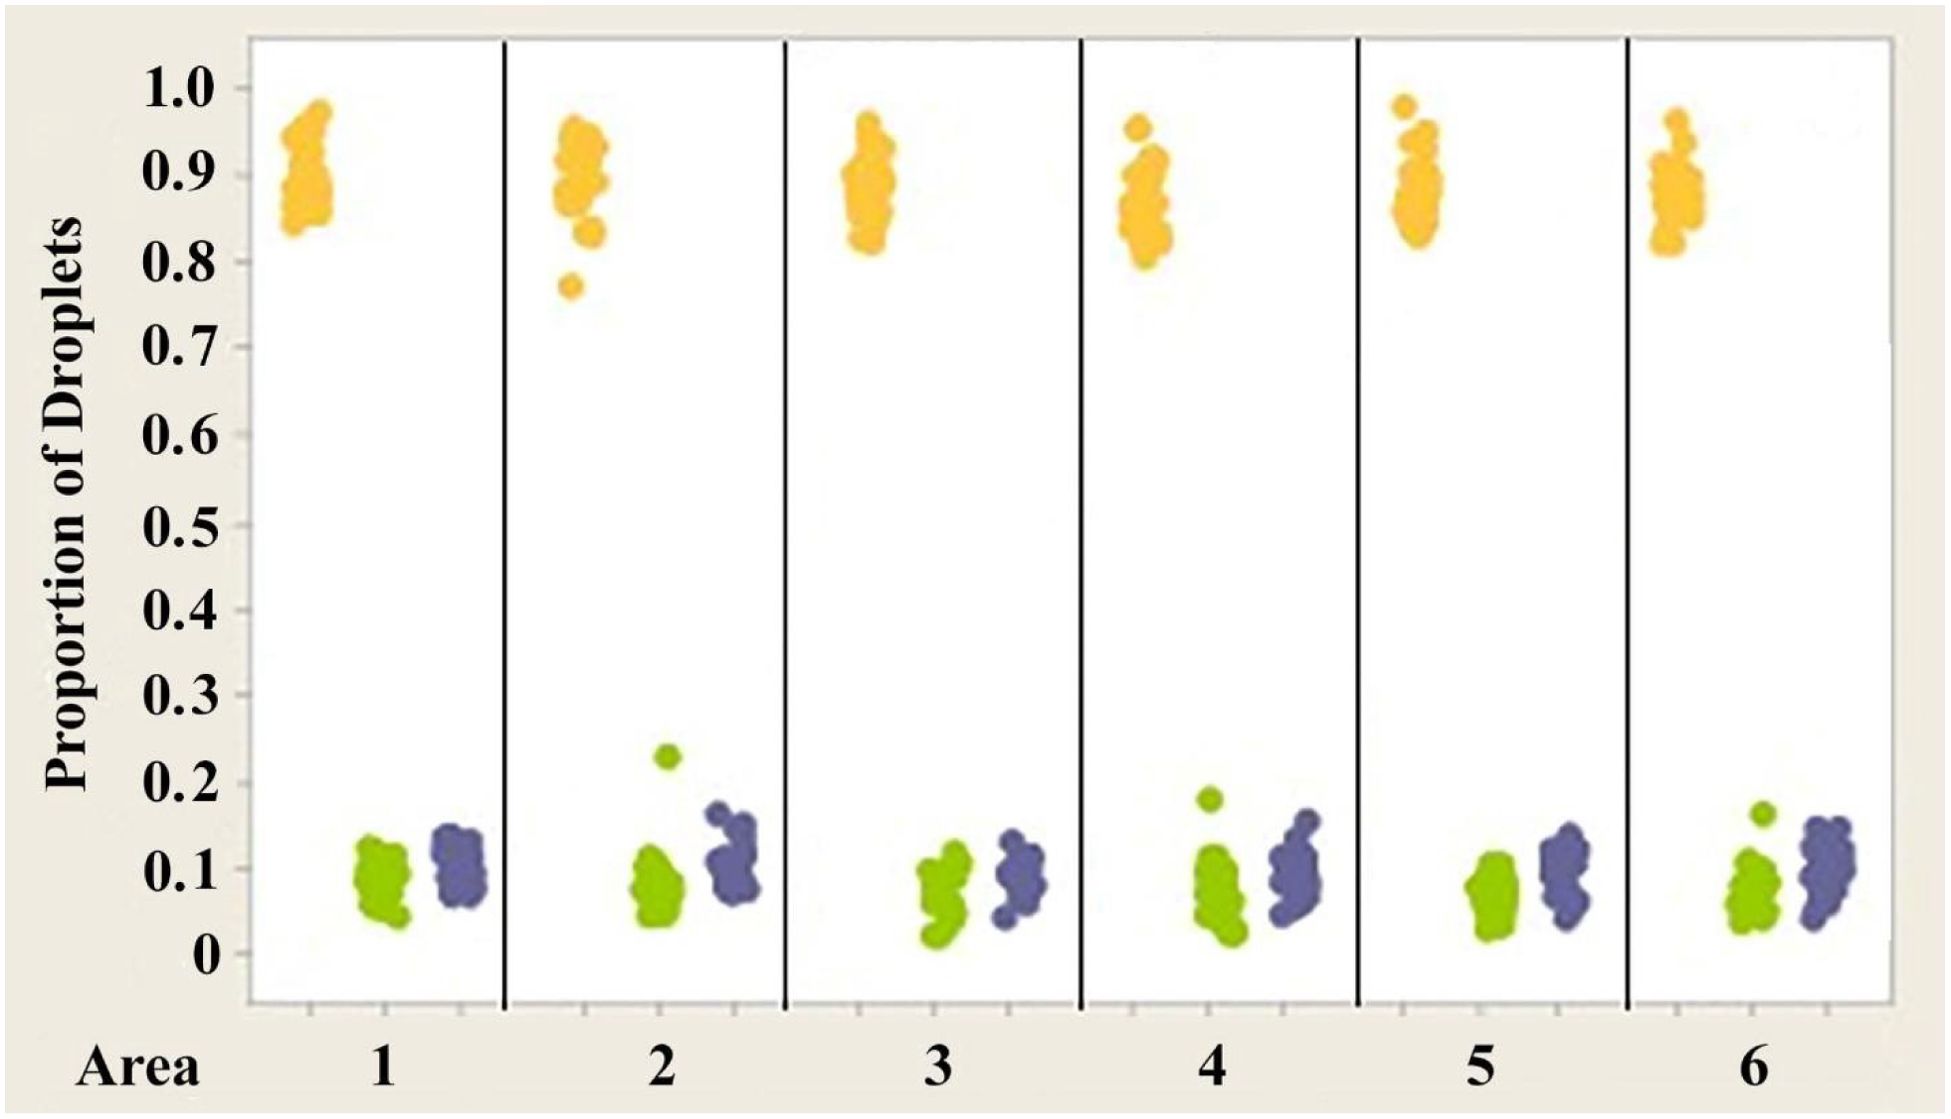
Figure 9. Individual value plot comparing proportions of oil droplets from the right and left eyes of Anolis sagrei. Oil droplet counts from the different measured areas (1–6) were combined since no significant differences were found between the areas. Each point on the graph represents the proportion of oil droplets from one individual.
3.3.2 Interspecies variability – proportions
Analysis of variance (ANOVA) testing revealed that significant differences exist in the proportion of yellow and green oil droplets present in the retinas of the three different species of anoles investigated (Figure 10) (p << 0.05). However, no significant differences were found in the proportion of colorless droplets (p > 0.05) present in the three species. The mean proportions of yellow droplets seen in the right eyes of the retinas of A. carolinensis, A. cristatellus, and A. sagrei were 0.52164, 0.10341 and 0.86371, respectively. The mean proportions of green droplets in the same eyes of the same species were 0.39036, 0.7988, and 0.06018. The proportions of colorless droplets counted were 0.08800, 0.09780, and 0.07610. Similar counts from the left eyes of the same animals were not significantly different (p > 0.05).
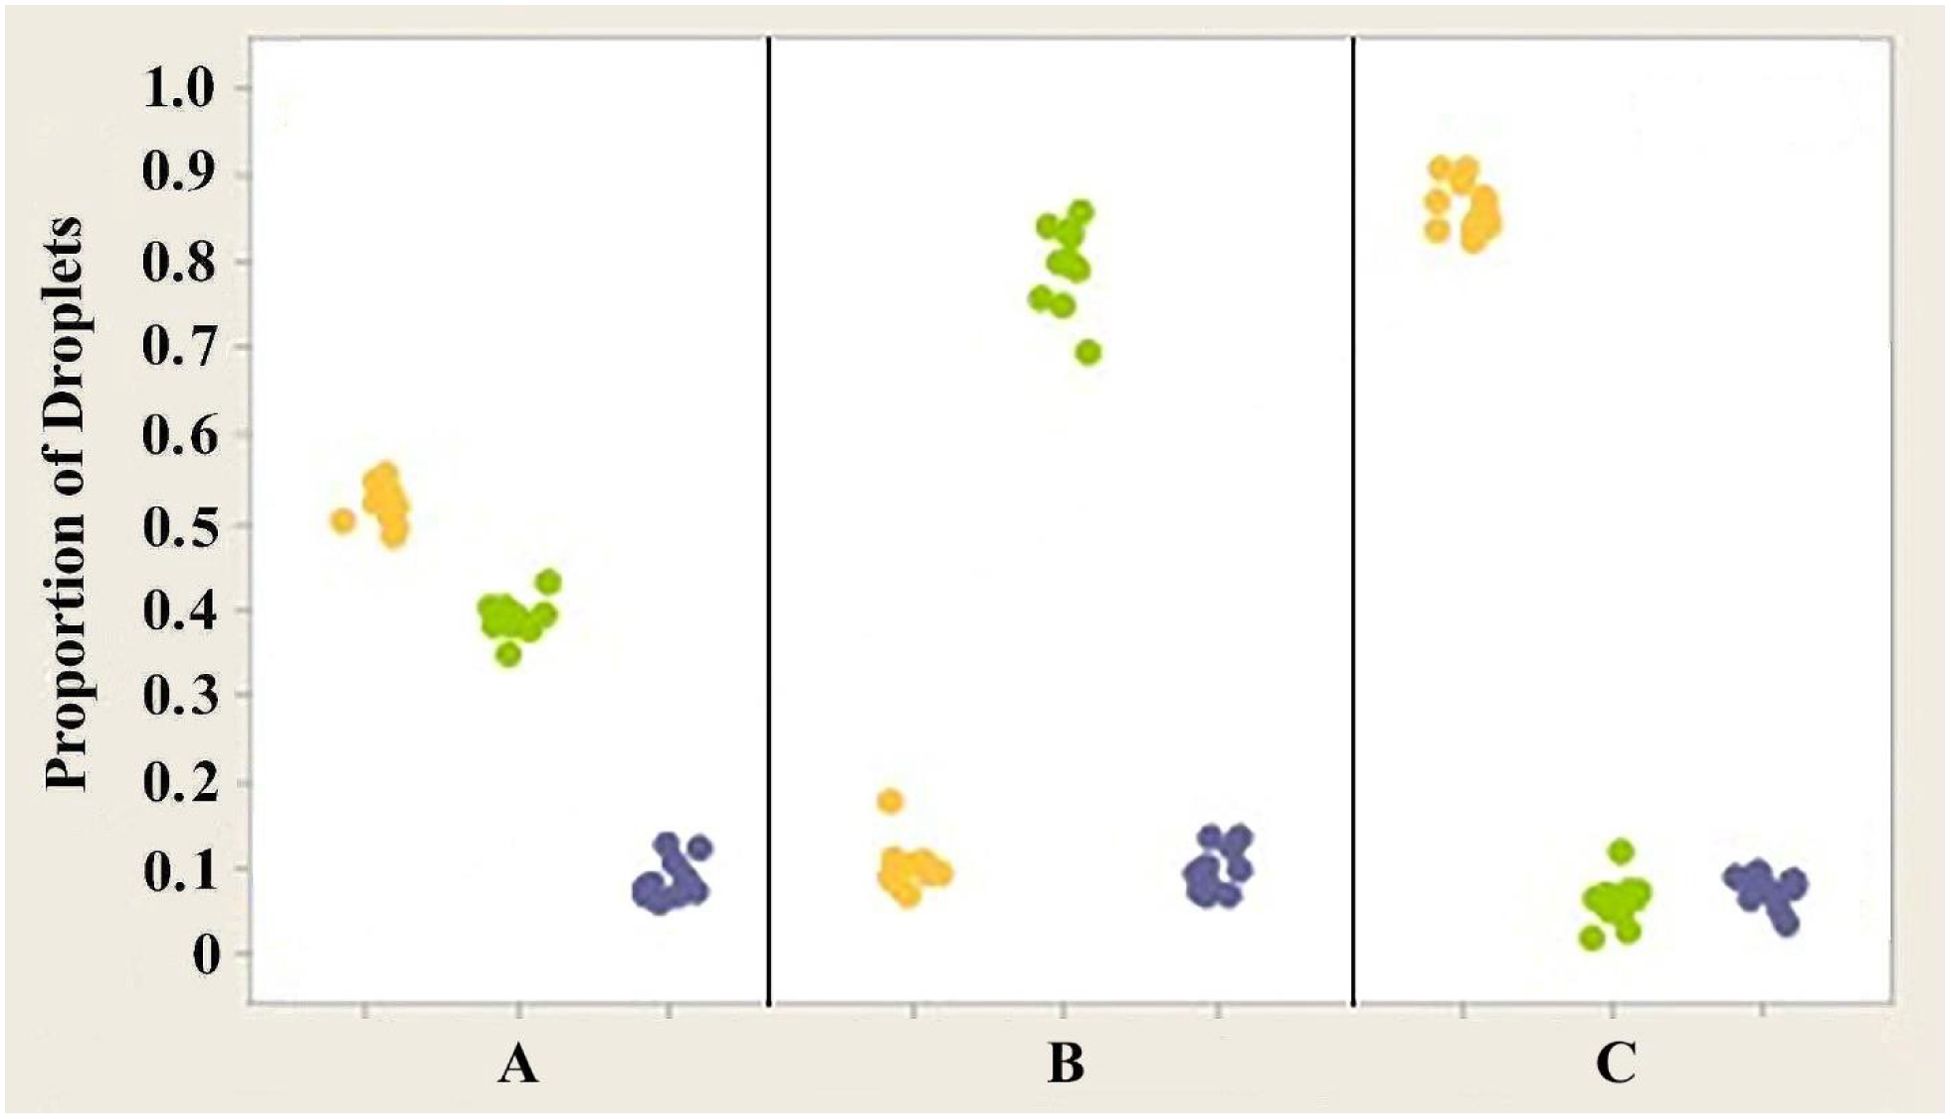
Figure 10. Individual value plot comparing the proportions of the three classes of oil droplets present in the retinas of the right eyes of three Anolis species, (A) A. carolinensis, (B) A. cristatellus, and (C) A. sagrei. The counts from the six measured areas of each retina were combined. Each point on the graph represents the proportion of droplets found in one individual. Y, Yellow; G, Green; Blue, Colorless. Results for the left eyes are essentially the same as for the right eyes.
4 Discussion
4.1 Introduction
The way an animal’s visual system samples the external world will depend on the characteristics of its retina. While the spectral characteristics of the cone cells determine the color vision capabilities of the system, their number and distribution across the retina determine the fundamental sampling grain of the animal’s visual field. Many studies have investigated the distribution of the different spectral classes of cones across the mammalian retina (Szél et al., 1988; Wikler and Rakic, 1990; Curcio et al., 1991; Mollon and Bowmaker, 1992). Other studies have investigated the same distributions in fish (Marc and Sperling, 1976; Novales-Flamarique and Hawryshyn, 1998; Fuller et al., 2003) and reptiles (Loew et al., 1996) and birds (Bowmaker et al., 1997; Hart, 2001; Hart et al., 2000). Variability of foveal cone number between individuals has been found to be almost 3-fold in humans (Curcio et al., 1987).
Referring to Figure 1, while both a class of single cone and the principal member of the double cone both have the yellow droplet, when counting droplets, the two cell types were easily distinguishable as the droplet from the principal cone was always associated with the accessory member containing the diffuse pigment. There was no evidence that the proportions of principal cones to single cones varied within the six sampled areas. Using this technique, it was not possible to distinguish between the LWS and MWS singles based on oil droplet color alone. Thus, we cannot exclude the possibility that the number of LWS versus MWS cones varied between sampled areas. However, the absolute number of green droplets did not vary appreciably between sampled areas. The same can be said for the SWS and UVS cones that both had colorless droplets. In the absence of how cone outputs translation into perceptual color signals, it is not possible to speculate on how changes in cell proportions of the same droplet color would affect color processing other than to say that if a region skews the number SWS to UVS cells, that region would be more blue-sensitive. It can be noted that using visual pigments to distinguish between LWS and MWS cones in the foveae of primates, significant intersubject variability was found that did not translate into significant differences in color perception (Roorda and Williams, 1999).
The parameters of interest investigated here were the numbers of photoreceptors in different areas of the retina and the proportions of cone spectral classes present in these areas. Because of the difficulties associated with correlating cone spectral class based on visual pigment with retinal location, the present investigation used oil droplet color as a marker for cone spectral class of three species of anoline lizards. Three droplet classes were identified on the basis of their color when viewed microscopically in white light. Absolute counts of oil droplets, as well as the proportions of different classes of oil droplet, were evaluated. The data collected were analyzed for differences within one retina, between retinas of the same animal, between individuals of the same species, and ultimately between different species.
4.2 Major findings
Three major findings resulted from this investigation:
1. While there is variability in the absolute numbers of different oil droplet classes among the six retinal areas in a given animal, regardless of eye or species (Figures 4–6), the proportions of the droplet classes in the six areas are statistically the same.
2. The proportions of each class of oil droplet found in specimens of each individual species are statistically the same in each species (Figures 7–9).
3. The proportion of each class of droplet shows statistical difference between species (Figure 10).
These results emphasize the potential importance of the maintenance of proportions of cone classes to ensure the proper encoding of visual information.
4.2.1 Intraretinal variability of oil droplet number in the six sampled areas
The variability in the total number of oil droplets measured in the six measured retinal areas is very large, approaching a tenfold difference between certain regions (see Campbell, 2006). While these differences are appreciable, no consistent trends are present that indicate regional specialization such as that seen in pigeons and other birds (Bowmaker, 1977; Bowmaker and Knowles, 1977; Meyer, 1977; Bowmaker et al., 1997; Partridge, 1989; Hart, 2001). There is no area that is consistently observed to have a greater number of oil droplets than any other (see Figures 4–6). The area showing the greatest (or least) number of a particular class of oil droplet can and does vary between individuals. If the retina of anoline lizards were to exhibit regional specialization, one would expect a greater consistency among individuals in the areas that have the highest and lowest numbers of a particular class of oil droplet. Of greater importance is the lack of right/left symmetry when ranking the areas by oil droplet count. If the variability had any adaptive significance, one would expect right/left symmetry – particularly since there is symmetry at all other structural and functional levels (see Campbell, 2006).
A possible explanation for the erratic counts is sampling error. However, this is most likely not the case since less variability was found in repeated counts of the same retinal areas. The observed intraretinal variability can more confidently be attributed to individual variability – perhaps due to developmental variability.
The question here is whether or not this variability has visual relevance with regards to acuity and color processing. Certainly, the sampling of the image falling on each area by each color channel will depend on the absolute number and distribution of the cones feeding into that channel. Whether this has visual relevance or is compensated for through variations in retinal or central wiring is unknown. The fact that there is no consistency between eyes or among animals suggests that it is not of adaptive significance and is somehow handled by the developing visual system. Interestingly, the variations in absolute counts among the six areas are not accompanied by differences in convergence ratios found across the non-foveal anoline retina (Makaretz and Levine, 1980). This would again suggest adaptation at higher levels.
4.2.2 Lack of variability in oil droplet proportions among the six areas
Unlike the absolute number of different spectral classes of oil droplets, the proportions of the different spectral classes of oil droplets are not significantly different from each other in each of the six measured retinal areas. This is true for the three species investigated here. As seen in Figures 4–6, the ranges of the proportions of each spectral class of oil droplet found in these areas are far narrower than the counts of the individual oil droplets. Considering the role oil droplets most likely play in color vision (see Vorobyev et al., 1998), this observation implies that the proportions, and not the actual numbers, are important for color processing. These findings also highlight the potential significance of color information in the entire visual world of anoles. While oil droplet class cannot be correlated exactly with visual pigment, it gives some indication of the probable cone class in which it resides. The relatively constant proportions of the classes of oil droplets across the retina can help ensure that the same spectral information is extracted from each location in the animal’s visual world regardless of eye position (ignoring the foveae, of course).
In addition to there being no statistically significant differences in the proportion of all oil droplets in a given area, the proportions of yellow to green oil droplets in all areas of one retina are statistically the same (p > 0.1). This conservation is another indication that proportions are important to the construction of color space.
4.2.3 Intraspecific variability of oil droplet distribution
As mentioned above, there appears to be a wide variation in the absolute numbers of the classes of oil droplets in the six areas among individuals of the same species. Significant differences exist among the absolute counts of all different classes of oil droplets observed in the six measured retinal areas of Anolis sagrei. Likewise, individuals of A. carolinensis and A. cristatellus demonstrate significantly different numbers of both green and colorless oil droplets.
However, the results from statistical analysis do not discern significant difference in the number of yellow oil droplets among the individuals of these species sampled. According to the individual value plot showing the intraspecies variability of A. carolinensis, however, it appears that all three classes of oil droplets have roughly the same variability among individuals, in contradiction with the statistical analysis. Another inconsistency between the statistical results and the trends seen in the individual value plots is the significant variability assigned to the colorless droplets of all species and the green droplets of A. sagrei. According to individual value plots (Figures 7–9), one might conclude that individuals do not differ significantly in their numbers of colorless droplets (and in the case of A. sagrei, green droplets), whereas statistical analysis shows the contrary. The clustering seen in the plots indicates that the differences that are revealed via statistical methods are not extreme.
Absolute eye size could be responsible for the variability in numbers of oil droplets seen between animals. However, since the size of the investigated eyes of animals of any one species did not vary to the same extent as the numbers, it is not likely that eye size contributed to the variability seen here.
The variability in the numbers suggests that acuity is variable among individuals. Since such variability is unlikely to be adaptive, there may be compensatory mechanisms in the retinal wiring at work in the processing of visual information. This compensation is not likely to take place at the level of the ganglion cells, where nearly constant convergence ratios are found in non-foveal retina (Makaretz and Levine, 1980).
4.2.4 Lack of variability in oil droplet proportions among members of the same species
The possibility arises of the proportions of different spectral classes of oil droplets playing a role in the color processing capabilities of anoles. While the animals may be able to compensate for intraspecific differences in absolute numbers of oil droplets, there could be an inability to compensate for different proportions in terms of color processing. If one were to compare the eyes of two individuals to two digital cameras – a 1 megapixel camera and a 5 megapixel camera – the functional significance of the variabilities can be explained. Both cameras process chromatic information identically since the sensing elements corresponding to different spectral sensitivities are uniformly adjacent to each other, sampling each portion of the image field. However, the 5 megapixel camera would have a higher resolving capacity than that of the megapixel camera. Given that anoles are highly visual animals and possess color vision capabilities, in conjunction with the data presented here, it is presumed that it is advantageous to them to tightly control the proportions of classes of oil droplets. It is possible that developmental processes govern the proportions of oil droplets. Once the spectral fate of one class of cell, and thus the oil droplet that will reside in it, is determined, lateral induction directs the determination of the classes of adjacent cells. The lateral induction process can therefore control the proportions of cell and oil droplet class. The differences between individuals could be due to the photic environment in which they developed, as has been suggested in cichlids (Braun et al., 1997; Kröger et al., 2001). It can be determined if photic environment plays a role in the number and class of cones that develop in the retina by controlled breeding and rearing of anoles in different photic environments, followed by the counting and identification of oil droplets and cell class.
To further investigate the functional significance of the intraspecies variability in oil droplet number and distribution, one could perform optomotor visual acuity tests on individuals of one species. Following these tests, the animals could be euthanized and the numbers and proportions of oil droplets counted as in the present study. Similarly, color discrimination behavioral tests performed on group of individuals of one species followed by the counting and analysis of oil droplet distribution could provide valuable insight into the significance of the conservation of proportions of classes of oil droplets.
4.2.5 Interspecific variability of oil droplet number and proportions of chromotypes
The most striking differences in both the numbers and proportions of the classes of oil droplets emerge as a result of the comparisons between species. Although the same three spectral classes of oil droplet were identified in the retinas of each species, the absolute numbers and proportions of the droplets varied considerably among them. For example, A. carolinensis possess yellow, green and colorless droplets in a ratio of 6.1:4.6:1, while that of A. cristatellus is 1:7.8:1. A. sagrei have the same spectral classes of droplets in an average ratio of 16.1:1:1.4. Significance testing revealed that all three species differ from another in their numbers and proportions of yellow and green oil droplets. Statistically significant differences were also found between the numbers of colorless droplets among the three species (Figures 4–6). However, each species appears to possess roughly the same proportion of colorless oil droplets. These trends are apparent in individual value plots of the data (Figures 7–10). Again, these results strongly suggest that the proportions of spectral classes of oil droplets are most likely related to different visual tasks and/or the lifestyle of the species.
Since it is conserved among members of a species, but can be different between species, it is likely that droplet proportion is visually adaptive. It has already been mentioned that recent models of color processing include cone ratio (specified as weighting) parameters (Vorobyev et al., 1998). One explanation for the differences in the proportions of the classes of oil droplets found in the three species could be the photic environment in which each resides. Anolis crisatellus and A.carolinensis are found in habitats of partial shade, while A. sagrei inhabits full sun environments (Losos et al., 1998; Loew et al., 2002). The spectral composition of light available to these environments differs in that short-wavelength light primarily penetrates partial shade environments, while broadband light is found in full sun habitats. Given that both A. cristatellus and A. carolinensis are found in partly shady habitats and exhibit differences in their proportions of oil droplets, it may be that visual tasks are more important than photic environment in determining oil droplet numbers and proportions. The two species also differ in their visual pigments, which may be a contributing factor to the observed differences in proportions. The visual pigments of A. carolinensis is the only anole studied to date that uses vitamin A2 as its chromophore whereas those of A. cristatellus use the more prevalent vitamin A1 (Provencio et al., 1992). This substitution affects the absorption spectra of the visual pigments of A. carolinensis in that they absorb maximally at longer wavelengths. Whether this substitution affects the proportions of oil droplets is unclear since its adaptive consequences are still unknown.
The observed species differences may be related not to the spectral composition of light, but to its intensity. The apparent color of oil droplets is a result of its density of carotenoid. While a higher density of carotenoid increases the hue of the droplet, for example, it may make it “redder”, it also decreases the light that ultimately reaches the visual pigment. Therefore, it may make sense for species inhabiting dim-light environments to have paler droplets to ensure an adequate amount of light reaches the outer segments of the cones. The species investigated in the current study do not support this hypothesis. One would expect that A. sagrei (a “full sun” species) would have less pale, redder oil droplets than either A. carolinensis or A. cristatellus (both “partial shade” species). However, the oil droplets of A. carolinensis are redder than those found in either of the other species (see Figure 3). Because of the intermediate nature of the “partial shade” habitat, the animals may not have to sacrifice spectral considerations for light-gathering ability. To properly investigate this hypothesis, more appropriate species should be examined. For example, comparing a “deep forest” species, such as A. gundlachi, who may benefit more from maximizing quantum catch than from spectral discrimination, to a full sun species may reveal more pronounced differences.
The boundaries of the color vision capabilities of an animal are set by the spectral sensitivities of the cone photoreceptors that can be modulated via spectral tuning. The visual pigments of different anoline lizards are very homogenous in terms of their absorbance maxima, while the cutoff wavelengths of their oil droplets have been found to be more variable (Loew et al., 2002). Therefore, the differences in the proportions of the classes of oil droplets may be evidence that it is the oil droplet composition of the retina that is of adaptive significance. Assuming color is encoded by opponent mechanisms, Vorobyev et al. (1998) developed a model to map the color space of eyes with and without oil droplets for different species of birds. It was determined that oil droplets can shift the color space and are in fact adaptive for discrimination of plumage colors in the avian species investigated. It is possible that the different proportions of oil droplets found in the different anoline species serve to shift the color space of the animal to its most adaptive location, perhaps to aid in dewlap color discrimination. To determine if this is indeed the case, observations of the visual world and tasks of different species of anoles must be made in conjunction with classification and counts of the oil droplets present in the animals.
Previous studies (Fleishman et al., 1997; Loew et al., 2002) have not found any correlation between the visual pigments of Anolis lizards and their photic environment. Since the measured λmax of each of the respective visual pigments of the three species investigated here varied very little (Loew et al., 2002), it is not surprising that such associations could not be made. However, the field of visual ecology predicts that certain features of an animal’s visual system would be adaptive to its environment and/or visual tasks. Anoles are highly visual animals, and are thought to rely on their color vision capabilities and visual systems as their primary sense (Fleishman et al., 1997). It seems unlikely that the anoline visual system would not possess adaptations to the environment. Therefore, the interspecies differences observed in the proportions of oil droplets, and their effect on spectral sensitivities, may fulfill the adaptive role of the anoline visual system. Additionally, the sensory drive hypothesis (Endler, 1992) has been invoked to explain the signal diversity seen in the dewlaps of anoles. Since a basic principle of this hypothesis states that natural selection is responsible for the divergence of communication signals such as dewlaps, it follows that the visual system on the receiving end of such a signal be adapted to best receive and interpret it (Leal and Fleishman, 2004). Therefore, since the photoreceptor cells are the first to process any color information contained within the image of the dewlap, or any part of the anole’s spectral world, it is thought that they would show adaptation to the habitat in which they live since this habitat affects spectral qualities (Fleishman et al., 1997). Since the dewlaps of different species of anoles differ in color, it is believed that the spectral sensitivities of the cone cells receiving the visual image of the dewlap would be adapted to the specific color of the species. Again, since the visual pigments of the species are similar, it may be the proportions of oil droplet classes that offer the adaptive significance.
Anoline lizards of the Caribbean have undergone an extensive divergence, and while they inhabit areas of broad-ranging light conditions, they have retained similar microhabitat preferences (Williams, 1972; Hertz et al., 1994). Other investigators have described examples of divergence in other systems in Anolis lizards, such as morphological characteristics (Losos et al., 1998; Jackman et al., 1999) and physiological temperature regulation (Hertz et al., 1994). These adaptations imply a sufficient passage of time since the different species of Anolis diverged from their common ancestors to allow for the natural selection of traits adaptive to the different habitats. Therefore, the divergence of altered proportions of oil droplet classes of different species of anoles may be adaptations to the different micro-environments.
Further experimentation should be done to more fully examine the functional significance(s) of the interspecies differences. First, more species from a greater variety of ecomorphs should be examined. There are almost 200 species of Caribbean anoles inhabiting 6 different ecomorphs. Second, of great importance in assigning significance to these findings is to observe the animals in their environments to note their visual tasks. As stated above, comparisons of bright light species to A. gundlachi, an inhabitant of deep forests that receive less light, may clarify many of the uncertainties surrounding the significance of the interspecies differences in proportions. Also, examination of species with markedly different dewlap color would be of value to see if the species differences in oil droplet proportions are due to dewlap recognition. This hypothesis could be easily tested with the current methods applied to the appropriate selection of species.
4.3 Acuity
It is widely known that photoreceptor spacing ultimately sets the upper limit on visual acuity of a system (Campbell and Green, 1965; Green, 1970). Based on the absolute numbers of the photoreceptor cells, it is possible to estimate the relative visual acuity of the anole eye (Fleishman et al., 2017). It was observed that A. carolinensis has a higher extrafoveal number of total oil droplets than the other two species investigated here (an average of 5987.16/mm2 as compared to 3873.82/mm2 in A. cristatellus and 3469.20/mm2 in A. sagrei). If colorless oil droplets are ignored, due to their consistently low numbers in all three species, A. carolinensis still has a higher number of oil droplets in the measured areas. This would mean that A. carolinensis has a higher resolution of their yellow and green channels than either A. cristatellus or A. sagrei. Both yellow and green oil droplets are found in LWS cones (Loew et al., 2002), which have been implicated in motion detection (Fleishman et al., 1997; Campenhausen and Kirschfeld, 1998). Perhaps the increased number of these cells in A. carolinensis serves as a mechanism to increase motion detection capabilities. It is unclear whether such abilities would be more adaptive to A. carolinensis than to the other anoline species investigated. Identification of the visual tasks of the animals would help to further explain this difference. In addition, to see if the increased number also translates into higher acuity in the green and yellow channels, behavioral optomotor response test could be performed.
If one adds droplet color of cones to acuity and spatial resolution issues, the picture becomes more confusing. If the wiring that underlies these tasks in all three species is the same for all the sampled areas, and involved in a chromaticity component, then it would follow that the large variability in cone class number among the species, particularly A. cristatellus and A. sagrei would mean that there are different chromatic specializations as regards the ability to resolve particular spatial characteristics of relevant visual targets. Unfortunately, we do not have the data about the different targets that might be of evolutionary significance underlying the difference in cone color classes between species.
Although in many circumstances, interphotoreceptor spacing sets the boundaries of visual acuity, performance can also be measured by hyperacuity. Many viewing conditions exist in which the spacing of photoreceptors does not impose resolution limits (e.g., dim light, abnormal refraction). It has been found that individual photoreceptors are capable of hyperacuity when their task has a threshold less than the diameter of an individual photoreceptor cell (Enoch and Hope, 1973; Geisler, 1984; Williams and Colletta, 1987).
4.4 Ecological importance of visual field
The results presented here suggest that the entire visual field sampled by the extrafoveal retina of anoline lizards could be of equal ecological importance. Though inhomogeneous numbers of photoreceptor cells were found in some of the extrafoveal regions investigated, there were no consistent trends found that indicated an advantage to any specific distribution. In addition, the lack of intraretinal variability concerning the proportion of oil droplet classes indicates that the entire extrafoveal retina may be performing the same visual tasks. This homogenous distribution is unlike that seen in some birds. For example, the pigeon retina (Pedler and Boyle, 1969; Bloch and Maturana, 1971; Bowmaker, 1977; Martin and Muntz, 1978) displays a great amount of intraretinal variation of colored oil droplets. The proportion of red droplets in the posterior dorsal region is so high that it is commonly referred to as the “red field” while the ventral retina is called the “yellow field” because of its high proportion of yellow droplets.
4.5 Scarcity of colorless oil droplets
One result consistently found in all the retinas examined was the low number of colorless oil droplets (≤ 10% of total oil droplets). Since colorless droplets are associated with either the short-wavelength-sensitive and ultraviolet-sensitive cones (Loew et al., 2002), it is safe to presume that these spectral classes of cones are also scarce across the extrafoveal retina. This shortage of SWS and UVS cells indicates that resolution in the short-wavelength and ultraviolet regions channels is decreased. Even with no convergence, this retinal wiring would impose limits on the capabilities of the system. Makaretz and Levine (1980) demonstrated that the anoline retina exhibits an almost constant convergence ratio between 1.33 and 1.42 across the extrafoveal retina. The convergence ratios and number of colorless oil droplets suggest that SWS and UVS cones in the anoline retina play a role in either low-resolution tasks or nonvisual tasks. It may be possible that the ultraviolet and short-wavelength visual targets of anoline lizards do not require high spatial resolution so that the low numbers of SWS and UVS cells are suitable and can perform perfectly well. For example, the UV channel could be used in dewlap recognition for those anoles that have ultraviolet-reflective dewlaps, as suggested by Fleishman et al. (1993).
4.6 Limitations of study
Although this study provided a considerable amount of data and information concerning the distribution of cone cells in the anoline retina, there were limitations that were inherent to this type of study. The first concerns the lack of foveal data. It would have been relevant to compare oil droplet counts from the foveal tissue since it is this area that is believed to be partly responsible for the acute vision of anoles. However, the deep clivus of both the central and temporal foveae prevented the removal and flat preparation of the tissue. Foveal anatomy has been studied using other techniques and reported in detail (Makaretz and Levine, 1980; Fite and Lister, 1981). However, the present study represents the first detailed report of the arrangement of spectral classes of cones in parafoveal regions, which also play an important role in lizard vision.
Another limitation of the study is due to the fact that a particular oil droplet class can be associated with more than one spectral class of cone. For example, the presence of a green oil droplet in a single cone could be representative of either a MWS or LWS cell. In addition, since the accessory members of the double cones do not contain an oil droplet, they are not included in this study. They are known to contain the LWS pigment, and therefore the LWS cells are underrepresented. However, the advantage offered by this study is that location of oil droplets, which affect spectral sensitivity, can be recorded over the entire retina. Also, oil droplets have been correlated with the visual ecology of birds and may act as a tool in such ecological considerations (Partridge, 1989). The present study does not make the distinction between the two subclasses of colorless droplets. The distinction between the two colorless droplets was made via fluorescence light microscopy in turtles (Kolb and Jones, 1987; Toomey and Corbo, 2017). It was determined that two classes of colorless droplets exist. The first fluoresces (C1) under ultraviolet illumination, while the other (C2) does not. In anoles, the C1 colorless droplet has been correlated with the SWS pigment and the C2 colorless droplet with the UVS pigment (Loew et al., 2002).
5 Conclusions
Based on the number and proportions of oil droplets found in selected retinal areas, the extrafoveal anoline retina does not appear to be adapted for regional specialization. The right/left symmetry of oil droplet numbers and proportions in both eyes indicates the same for lateral specialization. Comparisons of the proportions of oil droplets between individuals of the same species revealed that the anoline retina exhibits less intraspecies variability as the primate retina (Roorda and Williams, 1999). Also apparent from this study is that proportions of cell classes are of some importance to the anoline visual system and may compensate for variability in the actual numbers of cells. The variability in the proportions of the different spectral classes of oil droplets observed between species of anoles suggests that adjustment of the proportions of oil droplets may play an adaptive mechanism in the visual system of anoles.
While a great deal of information on the arrangement of the anoline retina was gained from this study, many interesting questions are left unanswered. It is clear that varied experimental approaches are necessary to solve them.
Data availability statement
The datasets presented in this study can be found in online repositories. The names of the repository/repositories and accession number(s) can be found in the article/supplementary material.
Ethics statement
The animal study was approved by Cornell University Care and Use of Research Animals, IACUC. The study was conducted in accordance with the local legislation and institutional requirements.
Author contributions
DC: Writing – review & editing, Writing – original draft, Methodology, Investigation, Formal analysis, Data curation, Conceptualization. EL: Writing – review & editing, Writing – original draft, Supervision, Resources, Project administration, Funding acquisition.
Funding
The author(s) declare financial support was received for the research, authorship, and/or publication of this article. College of Veterinary Medicine, Cornell University.
Conflict of interest
The authors declare that the research was conducted in the absence of any commercial or financial relationships that could be construed as a potential conflict of interest.
Publisher’s note
All claims expressed in this article are solely those of the authors and do not necessarily represent those of their affiliated organizations, or those of the publisher, the editors and the reviewers. Any product that may be evaluated in this article, or claim that may be made by its manufacturer, is not guaranteed or endorsed by the publisher.
References
Bloch S., Maturana H. (1971). Oil droplet distribution and color discrimination in the pigeon. Nat. New Biol. 234, 284–285. doi: 10.1038/newbio234284a0
Bowmaker J. K. (1977). The visual pigments, oil droplets and specrtal sensitivity of the pigeon. Vision Res. 17, 1129–1138. doi: 10.1016/0042-6989(77)90147-X
Bowmaker J. K., Heath L. A., Wilkie S. E., Hunt D. M. (1997). Visual pigments and oil droplets from six classes of photoreceptor in the retinas of birds. Vision Res. 37, 2183–2194. doi: 10.1016/S0042-6989(97)00026-6
Bowmaker J. K., Knowles A. (1977). The visual pigments and oil droplets of the chicken retina. Vision Res. 17, 755–764. doi: 10.1016/0042-6989(77)90117-1
Braun S. C., Kröger R. H. H., Wagner H.-J. (1997). Connectivity patterns of cone horizontal cells in blue acara (Aequidens pulcher, Cichlidae) reared in different light regimes. Neurosci. Lett. 235, 145–148. doi: 10.1016/S0304-3940(97)00762-3
Campbell D. (2006). Using oil droplets to map the distribution of cones in the anoline retina. Thesis (Ithaca, NY: Cornell University).
Campbell F. W., Green D. G. (1965). Optical and retinal factors affecting visual resolution. J. Physiol. - London 181, 576–593. doi: 10.1113/jphysiol.1965.sp007784
Campenhausen M. V., Kirschfeld K. (1998). Spectral sensitivity of the accessory optic system of the pigeon. J. Comp. Physiol. A 183, 1–6. doi: 10.1007/s003590050229
Curcio C. A., Allen K. A., Sloan K. R., Lerea C. L., Hurley J. B., Klock I. B., et al. (1991). Distribution and morphology of human cone photoreceptors stained with anti-blue opsin. J. Comp. Neurol. 312, 610–624. doi: 10.1002/cne.903120411
Curcio C. A., Sloan K. R., Packer O., Hendrickson A. E., Kalina R. E. (1987). Distribution of cones in human and monkey retina: Individual variability and radial symmetry. Science 236, 579–582. doi: 10.1126/science.3576186
Endler J. A. (1992). Signals, signal conditions, and the direction of evolution. Am. Nat. 139, S125–S153. doi: 10.1086/285308
Enoch J. M., Hope G. M. (1973). Interferometric resolution determinations in the fovea and parafovea. Doc. Ophthalmol. 34, 143–156. doi: 10.1007/BF00151803
Fite K. V., Lister B. C. (1981). Bifoveal vision in anolis lizards. Brain Behav. Evolut. 19, 144–154. doi: 10.1159/000121639
Fleishman L. J., Bowman M., Saunders D., Miller W. E., Rury M. J., Loew E. R. (1997). The visual ecology of Puerto Rican anoline lizards: habitat light and spectral sensitivity. J. Comp. Physiol. A. 181, 446–460. doi: 10.1007/s003590050128
Fleishman L. J., Loew E. R., Leal M. (1993). Ultraviolet vision in lizards. Nature 365, 397. doi: 10.1038/365397a0
Fleishman L. J., Yao A. I., Perez. C. W. (2017). Visual acuity and signal color pattern in an Anolis lizard. J. Exp. Biol. 220, 2154–2158. doi: 10.1242/jeb.150458
Fuller R. C., Fleischman L. J., Leal M., Travis J., Loew E. (2003). Intraspecific variation in retinal cone distribution in the bluefin killifish, Lucania goodei. J. Comp. Physiol. A. 189, 609–616. doi: 10.1007/s00359-003-0435-x
Geisler W. S. (1984). Physical limits of acuity and hyperacuity. J. Opt. Soc Am. A 1, 775–782. doi: 10.1364/JOSAA.1.000775
Govardovskii V. I. (1983). On the role of oil droplets in color vision. Vision Res. 23, 1739–1740. doi: 10.1016/0042-6989(83)90192-X
Green D. G. (1970). Regional variations in the visual acuity for interference fringes on the retina. J. Physiol. - London 207, 351–356. doi: 10.1113/jphysiol.1970.sp009065
Hart N. S. (2001). Variations in cone photoreceptor abundance and the visual ecology of birds. J. Comp. Physiol. A. 187, 685–698. doi: 10.1007/s00359-001-0240-3
Hart N. S., Partridge J. C., Cuthill I. C. (2000). Retinal asymmetry in birds. Curr. Biol. 10, 115–117. doi: 10.1016/S0960-9822(00)00297-9
Hertz P. E., Fleishman L. J., Armsby C. (1994). The influence of light intensity and temperature on microhabitat selection in two Anolis lizards. Funct. Ecol. 8, 720–729. doi: 10.2307/2390231
Jackman T. R., Larson A., deQueiroz K., Losos J. B. (1999). Phylogenetic relationships and tempo of early diversification in Anolis lizards. System. Biol. 48, 254–285. doi: 10.1080/106351599260283
Kolb H., Jones J. (1987). The distinction by light and electron microscopy of two types of cone containing colorless oil droplets in the retina of the turtle. Vision Res. 27, 1445–1458. doi: 10.1016/0042-6989(87)90154-4
Kolbe J. J., Glor R. E., Schettino L. R., Lara A. C., Larson A., Losos J. B. (2004). Genetic variation increases during biological invasion by a Cuban lizard. Nature 431, 177–181. doi: 10.1038/nature02807
Kröger R. H. H., Braun S. C., Wagner H.-J. (2001). Rearing in different photic and chromatic environments modifies spectral responses of cone horizontal cells in adult fish retina. Visual Neurosci. 18, 857–864. doi: 10.1017/S0952523801186025
Leal M., Fleishman L. J. (2004). Differences in visual signal design and detectability between allopatric populations of Anolis lizards. Am. Nat. 163, 26–39. doi: 10.1086/379794
Loew E. R., Fleishman L. J., Foster R. G., Provencio I. (2002). Visual pigments and oil droplets in diurnal lizards: a comparative study of Caribbean anoles. J. Exp. Biol. 205, 927–938. doi: 10.1242/jeb.205.7.927
Loew E. R., Govardovskii V. I., Rohlich P., Szél A. (1996). Microspectrophotmetric and immunocytochemical identification of ultraviolet photoreceptors in geckos. Visual Neurosci. 13, 247–256. doi: 10.1017/S0952523800007483
Losos J. B., Jackman T. R., Larson A., deQueiroz K., Rodriguez-Schettino L. (1998). Contingency and determinism in replicated adaptive radiations of island lizards. Science 279, 2115–2117. doi: 10.1126/science.279.5359.2115
Makaretz M., Levine R. L. (1980). A light microscopic study of the bifoveate retina in the lizard Anolis carolinensis: General observations and convergence ratios. Vision Res. 20, 679–686. doi: 10.1016/0042-6989(80)90092-9
Marc R. E., Sperling H. G. (1976). The chromatic organization of the goldfish cone mosaic. Vision Res. 16, 1211–1224. doi: 10.1016/0042-6989(76)90044-4
Martin G. R., Muntz W. R. A. (1978). Spectral sensitivity of the red and yellow oil droplet fields of the pigeon (Columba livia). Nature 274, 620–621. doi: 10.1038/274620a0
Meyer D. B. (1977). “The avian eye and its adaptations,” in Handbook of Sensory Physiology: The visual system in vertebrates, vol. VII/5 . Ed. Crescitelli F. (Springer-Verlag, New York), 549–611.
Mollon J. D., Bowmaker J. K. (1992). The spatial arrangement of cones in the primate fovea. Nature 360, 677–679. doi: 10.1038/360677a0
Novales-Flamarique I., Hawryshyn C. W. (1998). The common white sucker (Catostomus commersoni): A fish with ultraviolet sensitivity that lacks polarization sensitivity. J. Comp. Physiol. A. 182, 331–341. doi: 10.1007/s003590050183
Partridge J. C. (1989). The visual ecology of avian cone oil droplets. J. Comp. Physiol. A. 165, 415–426. doi: 10.1007/BF00619360
Pedler C., Boyle M. (1969). Multiple oil droplets in the photoreceptors of the pigeon. Vision Res. 9, 525–528. doi: 10.1016/0042-6989(69)90140-0
Provencio I., Loew E. R., Foster R. G. (1992). Vitamin A2-based visual pigments in fully terrestrial vertebrates. Vision Res. 32, 2201–2208. doi: 10.1016/0042-6989(92)90084-V
Roorda A., Williams D. R. (1999). The arrangement of the three cone classes in the living human eye. Nature 397, 520–522. doi: 10.1038/17383
Roughgarden J. (1995). Anolis lizards of the Caribbean: Ecology, evolution, and plate tectonics (New York: Oxford University Press).
Szél A., Diamanstein T., Rohlich P. (1988). Identification of the blue sensitive cones in the mammalian retina by anti-visual pigment antibody. J. Comp. Neurol. 273, 593–602.
Toomey M. B., Corbo J. C. (2017). Evolution, development and function of vertebrate cone oil droplets. Front. Neural Circuits 11. doi: 10.3389/fncir.2017.00097
Vorobyev M. (2003). Colored oil droplets enhance color discrimination. P. R. Soc Lond. B. 270, 1255–1261. doi: 10.1098/rspb.2003.2381
Vorobyev M., Osorio D., Bennett A. T. D., Marshall J., Cuthill I. C. (1998). Tetrachromacy, oil droplets and bird plumage colors. J. Comp. Physiol. A. 183, 621–633. doi: 10.1007/s003590050286
Walls G. L. (1942). The vertebrate eye and its adaptive radiation (Bloomfield Hills, MI: Cranbrook Institute of Science).
Walls G. L., Judd H. D. (1933). The intraocular filters of vertebrates. Br. J. Ophthalmol. 17, 641–675. doi: 10.1136/bjo.17.11.641
Wikler K. C., Rakic P. (1990). Distribution of photoreceptor subtypes in the retina of diurnal and nocturnal primates. J. Neurosci. 10, 3390–3401. doi: 10.1523/JNEUROSCI.10-10-03390.1990
Williams D. R., Colletta N. J. (1987). Cone spacing and the visual resolution limit. J. Opt. Soc Am. A. 4, 1514–1523. doi: 10.1364/JOSAA.4.001514
Williams E. (1972). “The origin of faunas. Evolution of lizard. Congeners in a complex. Island fauna: A trial analysis,” in Evolutionary Biology. Ed. Dobzhansky T., et al. (New York, NY: Meredith Corporation), 47–89.
Keywords: retina, cones, oil droplet, anole, lizard
Citation: Campbell D and Loew ER (2024) Variability in oil droplet numbers and proportions in the retinas of anole lizards. Front. Amphib. Reptile Sci. 2:1410763. doi: 10.3389/famrs.2024.1410763
Received: 01 April 2024; Accepted: 19 August 2024;
Published: 17 September 2024.
Edited by:
Leo Fleishman, Union College, United StatesReviewed by:
Daniel Osorio, University of Sussex, United KingdomKaren Carleton, University of Maryland, College Park, United States
Copyright © 2024 Campbell and Loew. This is an open-access article distributed under the terms of the Creative Commons Attribution License (CC BY). The use, distribution or reproduction in other forums is permitted, provided the original author(s) and the copyright owner(s) are credited and that the original publication in this journal is cited, in accordance with accepted academic practice. No use, distribution or reproduction is permitted which does not comply with these terms.
*Correspondence: Ellis R. Loew, RVJMMUBjb3JuZWxsLmVkdQ==; Darlene Campbell, ZGM3OEBjb3JuZWxsLmVkdQ==