 Bibek Acharya
 Vivek Sharma
95% of researchers rate our articles as excellent or good
Learn more about the work of our research integrity team to safeguard the quality of each article we publish.
Find out more
ORIGINAL RESEARCH article
Front. Agron. , 21 February 2025
Sec. Agroecological Cropping Systems
Volume 7 - 2025 | https://doi.org/10.3389/fagro.2025.1552425
Analyzing soil water dynamics is crucial for the advancement of sustainable agriculture, encompassing crop growth management, soil health preservation, and the strategic use of resources. This study assessed the impact of conventional and sod-based crop rotations on water dynamics within the Suwannee River Basin’s unique karst and sandy soil environment from 2019-2022. The study was conducted on a 16-hectare center pivot irrigated field, featuring two conventional crop rotations: one comprising maize (Zea mays) and peanut (Arachis hypogaea), and another including maize, carrot (Daucus carota), and peanut. In addition, two sod-based rotations were evaluated: one involving two years of bahiagrass (Paspalum notatum) followed by maize and peanut, and another comprising two years of bahiagrass succeeded by maize, carrot, and peanut. The results indicated that maize maintained consistent crop water productivity (WPC-ETc) at 2.6 kg m-3 across rotations, while WPC-ETc for peanuts ranged from 1.5 kg m-3 for conventional rotation and 1.1 kg m-3 for sod-based. The cumulative crop evapotranspiration (ETc) for maize throughout the years was on an average 477 mm (Standard Deviation (SD) = 44 mm), while peanuts showed an average cumulative ETc of 354 mm (SD = 39 mm). Carrots and bahiagrass recorded cumulative ETc values in the range of 225-259 mm and 1611 mm (over two years), respectively. Deep percolation accounted for 31% of total water input, which emphasizes the need for strategic water management in porous soils. Additionally, sod-based rotations increased field capacity by 32%, soil organic carbon (SOC) by 31% in the top 15 cm, and soil aggregate stability by 101%, enhancing soil structure and moisture conservation. This study highlights sod-based rotations as effective for soil and water conservation, offering practical strategies for water-efficient agriculture in similar ecosystems.
With global warming and emerging water scarcity posing formidable challenges, the pivotal role of soil and water dynamics in agricultural systems, encompassing crop growth, soil health, ecosystem resilience, irrigation, fertilizer management, and crop rotation strategies, demands urgent adaptation and innovation (Yang et al., 2020). Globally, and across many regions in the United States, growers, along with state and federal agricultural and water resource agencies, face the challenge of adopting climate-smart and integrated conservation practices. These practices aim to sustain agricultural productivity while maximizing water, nutrient, and economic efficiency, reducing environmental and social impacts, and preserving the natural productivity and quality of land and water resources (Sassenrath et al., 2009). Integrated conservation agriculture is a diversified farming approach based on three core principles: (i) maintaining a permanent vegetative cover on the soil surface, (ii) minimizing soil disturbance, and (iii) implementing diversified crop rotations (FAO, 2008). This approach optimizes natural resource use by integrating crop and livestock inputs and outputs to foster environmentally sustainable practices. Such conservation methods can significantly influence soil chemical, biological, and physical properties across various soils, climates, and cropping systems.
The Suwannee River Basin (SRB) of Northern Florida spans roughly 10,955 km2 and has the highest density of large artesian spring in the world with approximately 300 springs feeding the Suwannee River, which ultimately drains into the Gulf of Mexico. For example, the Suwannee County in SRB reported freshwater withdrawals of 0.116 million m³ day-1 from surface (~0.5%) and groundwater (~99.5%) sources for agriculture use (Marella, 2020). The nutrient-poor soils in the basin necessitate nitrogen (N) inputs to meet crop production goals. However, the region’s humid subtropical climate, characterized by high annual rainfall, combined with coarse-textured, sandy, and well-draining soils, and karst (carbonate) landscapes with low water and nutrient retention capacity, makes the SRB particularly sensitive to changes in water quality and the efficiency of water use in agricultural systems (Sexton et al., 1996; Alva et al., 2006; Katz et al., 2010; Scanlon et al., 2023; Vadez et al., 2023). Maize and peanuts represent significant agricultural products in the SRB and throughout Florida. According to a 2022 report on agriculture in Florida, peanuts were cultivated on roughly 57,465 ha, generating a production value of about $147.3 million (USDA, 2022). In comparison, grain maize cultivation covered an area of about 22,662 ha, with the production value reaching $67.5 million within the state (USDA, 2022).
In the southeastern United States, including the SRB region, soils are typically low in fertility and organic matter content. In many cases, long term continuous row cropping have further degraded these fragile soils (Katsvairo et al., 2006). Historical data suggest that the decline in cropping system diversity, notably the shift from perennial to annual crops, has led to increased environmental challenges related to water, such as erosion and water quality degradation (Aguilar et al., 2015). Growers in the North Florida region frequently adopt a traditional crop rotation practice involving maize and peanuts (Wright et al., 2022). Traditional crop rotation, such as maize-peanut or peanut-cotton, often face challenges like reduced yields, soil structure degradation, and increased susceptibility to pests and diseases (Crookston, 1995; Tanaka et al., 2002). Among many management practices, the adoption of perennial grasses into rotations contributes to larger and deeper root systems, which increase soil organic matter content, improve soil structure, enhance water retention, nutrient storage, infiltration, and aeration, and increase water use efficiency. This also leads to increased soil organic carbon and sequestering of carbon from the atmosphere (Santos and Whitford, 1981; Gupta and Yeates, 1997; Wright et al., 2004; Katsvairo et al., 2006; Franzluebbers and Triplet, 2006; Wright et al., 2010; Gamble et al., 2014; Dourte et al., 2015; Zhang et al., 2022b). These grasses also serve as non-hosts for common crop pathogens and nematodes, supporting the integrated pest and weed management (Dickson and Hewlett, 1989; Brenneman et al., 1995; Johnson et al., 1999; Katsvairo et al., 2007b; Sudini et al., 2011). For instance, drought-resistant bahiagrass is adaptable to various soil types, including sandy ones (Field and Taylor, 2002). Furthermore, incorporating livestock into crop rotation can mitigate financial risks for farmers, especially under variable weather conditions, while grazing animals can enhance soil fertility through effective nutrient recycling, thus benefiting future crops. Grazing can affect soil compaction, which subsequently affects water infiltration rates and the overall soil moisture dynamics. Moreover, the nutrient cycling facilitated by grazing animals can impact soil fertility and water quality, further illustrating the complex interplay between sod-based rotation, water dynamics, and agricultural sustainability (Katsvairo et al., 2006; George et al., 2013). In addition to agronomic benefits, implementing diverse systems strengthens both resistances, enabling crops to endure environmental stresses, and resilience, allowing them to recover from such stresses (Nicholls and Altieri, 2004).
Estimating soil water balance components, including crop evapotranspiration, is crucial for comparing water use in sod-based versus conventional crop systems. While some research has focused on how sod-based rotations impact soil aggregate stability, structure, and infiltration rates, there remains limited data on the dynamics of water balance components and water-use efficiency within sod-based systems. Most studies emphasize crop yield and soil fertility rather than these water-related metrics. For instance, Long and Elkins (1983) compared cotton grown after three years of continuous bahiagrass with continuous cotton. They observed a sevenfold increase in pore volume (>1.0 mm) in the soil layer beneath the plow depth in the bahiagrass system. This increase was attributed to the deep penetration of bahiagrass roots, which, after decomposing, left channels spacious enough to support the growth of cotton roots. Elkins et al. (1977) further found that perennial grasses like bahiagrass could reduce irrigation needs in subsequent crops. They reported that, on coarse-textured sandy soil with limited water-holding capacity, crops with 30 cm rooting depths in conventional systems would experience around 60 drought days from May through August. However, under sod-based rotations with deeper root networks, drought days were reduced to just eleven. Katsvairo et al. (2007a) found that peanut and cotton systems following bahiagrass demonstrated higher infiltration rates than conventional peanut-cotton rotations in Florida, which they attributed to root channels and improved soil structure from the perennial grass. Additionally, cotton grown after bahiagrass developed more root biomass than cotton in traditional systems. A study conducted in Quincy, FL, from 2002 to 2007 revealed that, in sod-based rotations, water-use efficiency for peanut crops improved by 15% in irrigated fields and by 19% in non-irrigated fields, relative to conventional rotations (Zhao et al., 2008). In particularly dry years, like 2006 and 2007, peanut yields in sod-based rotations outperformed those in conventional rotations by 13%.
In humid areas, efficient management of fertilizer and irrigation plays a crucial role in crop water productivity because of the increased risk of leaching, which can lower yields and, in turn, reduce crop water productivity (Sharma and Bhambota, 2022). While existing studies provide critical insights into crop and irrigation management impacts on crop water productivity (Howell et al., 1995; Evans and Sadler, 2008), few long-term studies have examined interannual variation within maize-peanut rotations in both continuous and sod-based systems. Before widespread adoption of sod-based rotation practices in crop production systems, their suitability and effectiveness should be thoroughly researched and evaluated at local scales. Thus, this study evaluates soil water retention, crop water productivity, and soil moisture levels, alongside assessing the balance of water inputs and outputs in both conventional and sod-based crop rotation. The goal of this research is to put forward agricultural practices that adhere to water stewardship principles and to inform the development of BMPs focused on enhancing crop yields while protecting essential water resources. The findings could significantly inform sustainable water management strategies in agriculture, particularly in areas sharing the environmental and climatic traits of the SRB. By examining soil water dynamics across varied crop rotation, this research aims to offer concrete evidence and practical recommendations to advance water-efficient and ecologically sustainable farming methods. The specific objectives of this research are to assess the effectiveness of a rotational production system involving maize, peanut, carrot, and bahiagrass with integrated cattle grazing in improving soil physical properties, and to compare water balances and crop water production functions within conventional and sod-based rotational production systems.
The field study was conducted from 2019 to 2022 on a 16 ha center pivot irrigated field at North Florida Research and Education Center-Suwannee Valley (NFREC-SV) in Live Oak, Florida (82°54’20.956” W and 30°18’16.697” N) within the Suwannee River basin (Figure 1). The Suwannee River basin covers an area of 28,500 km2 and is characterized by its karstic wetland and lowland terrain. The predominant land uses within the basin include forestry, agriculture, and wetlands (Ham and Hatzell, 1996). The study area’s climate is subtropical, featuring long, warm summers and mild winters, with 20 year average annual rainfall of about 1243 mm (FAWN, 2022). Rainfall distribution is highly variable by location and year, with roughly 50% occurring between June and September.
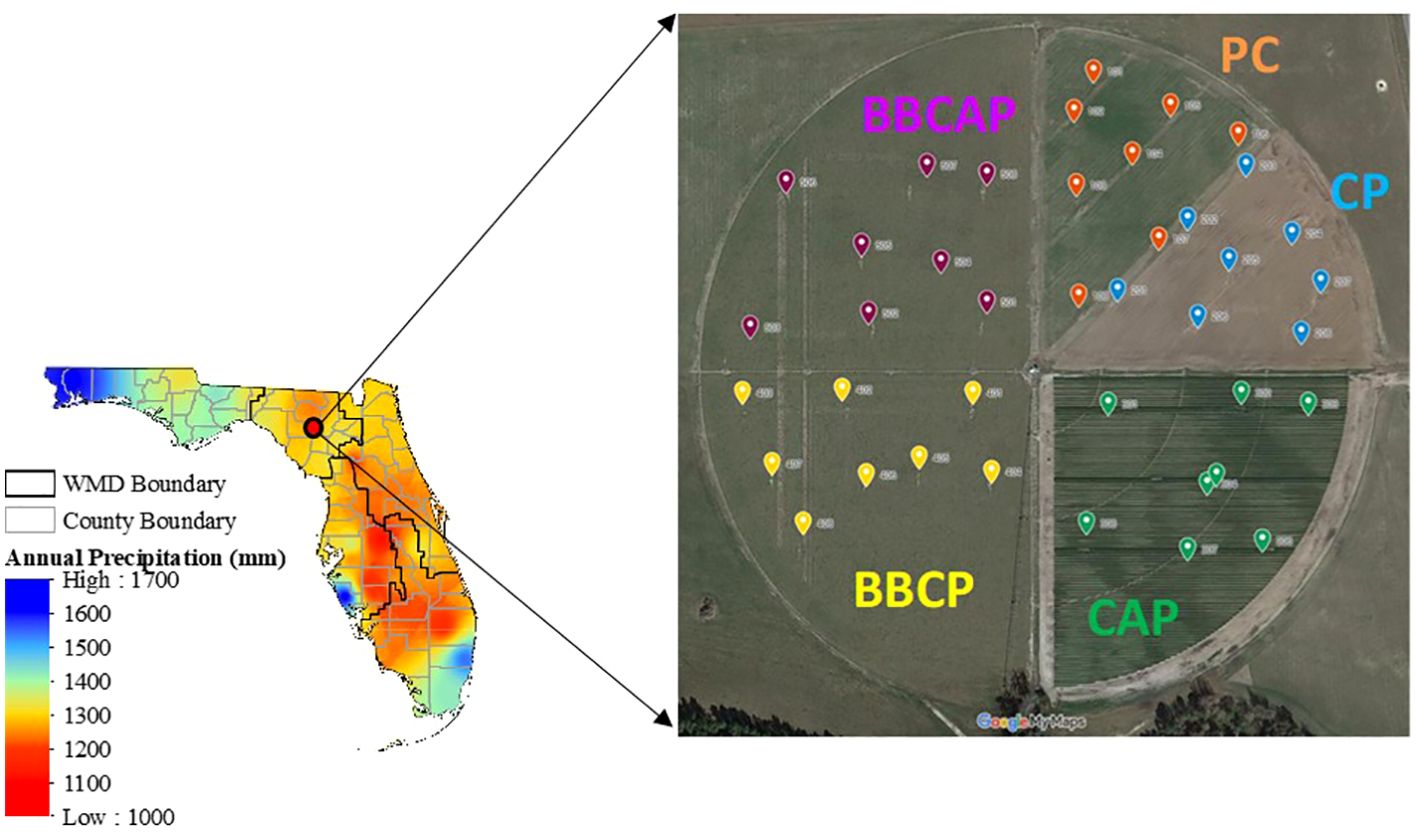
Figure 1. Aerial photograph of the study area located at NFREC, Live Oak, FL (Google, “Google map of study area located in NFREC, Live Oak”). The map represents the spatial variation of long-term annual precipitation (mm) in Florida.
The field was divided into four 4 ha sections for distinct crop rotation strategies (Figure 1). Of the four sections, two were allocated for sod-based rotation treatments involving bahiagrass. These include two years of bahiagrass followed by maize and peanuts (BBPC), and two years of bahiagrass followed by maize, carrots, and peanuts (BBCAP). The remaining two sections served as a control and followed the conventional farming rotation: one with a continuous cycle of maize and peanuts (CP), and another with maize, carrots, and peanuts (CAP). The CP section was further split into two 2 ha plots of maize-peanut (CP) and peanut-maize (PC) to facilitate two full rotations within four years (Figure 1). Over the four-year period, each subsection completed two full rotational cycles. In the CAP rotation, carrots were planted before peanuts within the same year, allowing the BBAPC and BBPC rotations to complete one cycle, while the CAP rotation achieved two cycles within this timeframe. A one-year pre-treatment phase was implemented, during which maize was cultivated uniformly across all subsections. During the initial four years of the 16-year study, the primary focus was on assessing BMPs, integrating fertilization and irrigation practices guided by local growers’ knowledge in Northern Florida. These practices involved using both inorganic fertilizers and broiler litter as manure, with irrigation decisions based on field observations.
The study site’s soil composition predominantly includes the Hurricane, Albany, and Chipley mix in CAP, BBCP, and BBCAP rotation, characterized by a 0-3% slope, high sand content of 95.4%, and somewhat poor drainage. The Blanton, Foxworth-Alpin complex in PC and CP rotation, features a 0-5% slope, 94.8% sand content, and a moderate drainage (NRCS, 2024). The hurricane series is comprised of very deep sandy, siliceous, thermic oxyaquic Alorthod, which are somewhat poorly drained, and have rapid permeability, while the Blanton series comprises of loamy, silicous, semiactive thermic Grossarenic Paleudults, deep and moderately well drained soils. Table 1 lists the soil physical properties measured on 23 April 2018, for the two major soil types found at the study site.
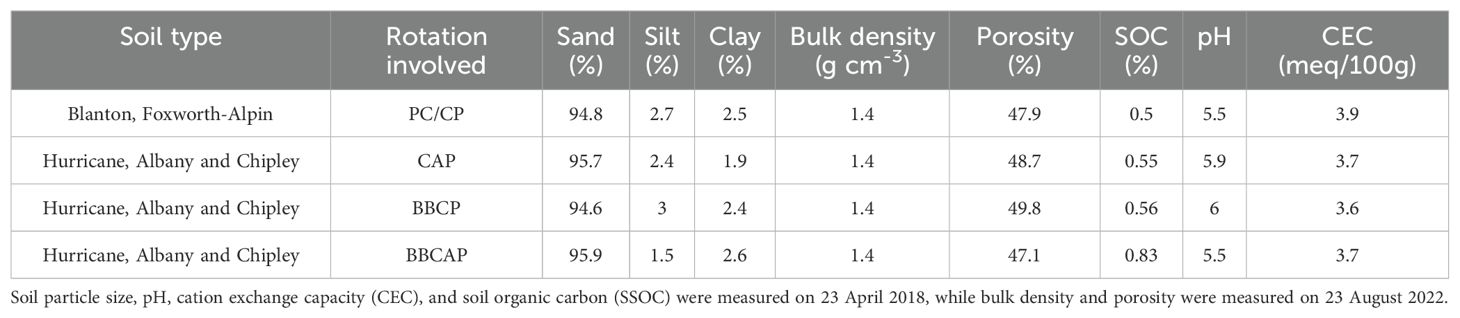
Table 1. Measured soil properties of the predominant soil types in each section at the research site.
The study employed a five span GPS guided center pivot irrigation system with Variable rate Irrigation (VRI) zone control capabilities (Valmont Industries, Valley, Nebraska), adhering to standard irrigation scheduling practices common in Northern Florida. This study spans 16 years, with the first four years specifically designed to mimic farmers’ irrigation practices for different crops to better understand real-world challenges faced in agricultural production. These practices rely on farmers’ experience, where irrigation decisions are informed by their understanding of crop water requirements, local weather conditions, and soil characteristics. This approach ensures the study captures the conditions and challenges typically encountered by farmers in the region. Fertilization was applied in two forms: inorganic fertilization utilized a mix of granular and liquid fertilizers, while broiler litter, commonly used as organic fertilizer in the North Florida region, was specifically applied to maize. The study also incorporated an animal grazing component, with cows rotated on sections BBCP and BBCAP. This grazing protocol involved rotating 65 to 75 cows off the land when the grass reached approximately 5 cm in height. For corn and peanut, field preparation included strip-tilling, with residue from the previous crops (peanut and corn) managed by disking. Plowing was avoided in both crops to prevent damage to lysimeters installed in the field. For carrot, the field was prepared by discing and using a rototiller to create a fine seedbed conducive to optimal germination and growth. The peanut variety Georgia 06 G was planted with rows spaced 76.2 cm apart and plants set 6 cm apart within each row, reaching a seeding rate of 289,113 seeds ha-1. Meanwhile, maize variety Dekalb 62 08RIB was established with the same row spacing of 76.2 cm but with plants spaced 16.5 cm within rows, yielding a seeding rate of 79,074 seeds ha-1. Carrot cultivar Maverick was planted in 1-meter wide beds constructed in an East-West direction with a bed spacing of 1.3 m, at a seeding rate of 1,235,526 seeds ha-1. Pensacola, Argentine, Tift 9, and Riata Bahiagrass were seeded at 56 kg seeds ha-1. A summary of crop management practices, including planting and harvest dates, irrigation amounts, and nitrogen fertilizer applications throughout the growing season, is provided in Table 2. Supplementary Table S1 provides a detailed overview of the types, compositions, application rates, and dosages (kg ha-1) of nitrogen fertilizers used throughout the crop rotation from the 2019 to 2022 growing seasons.
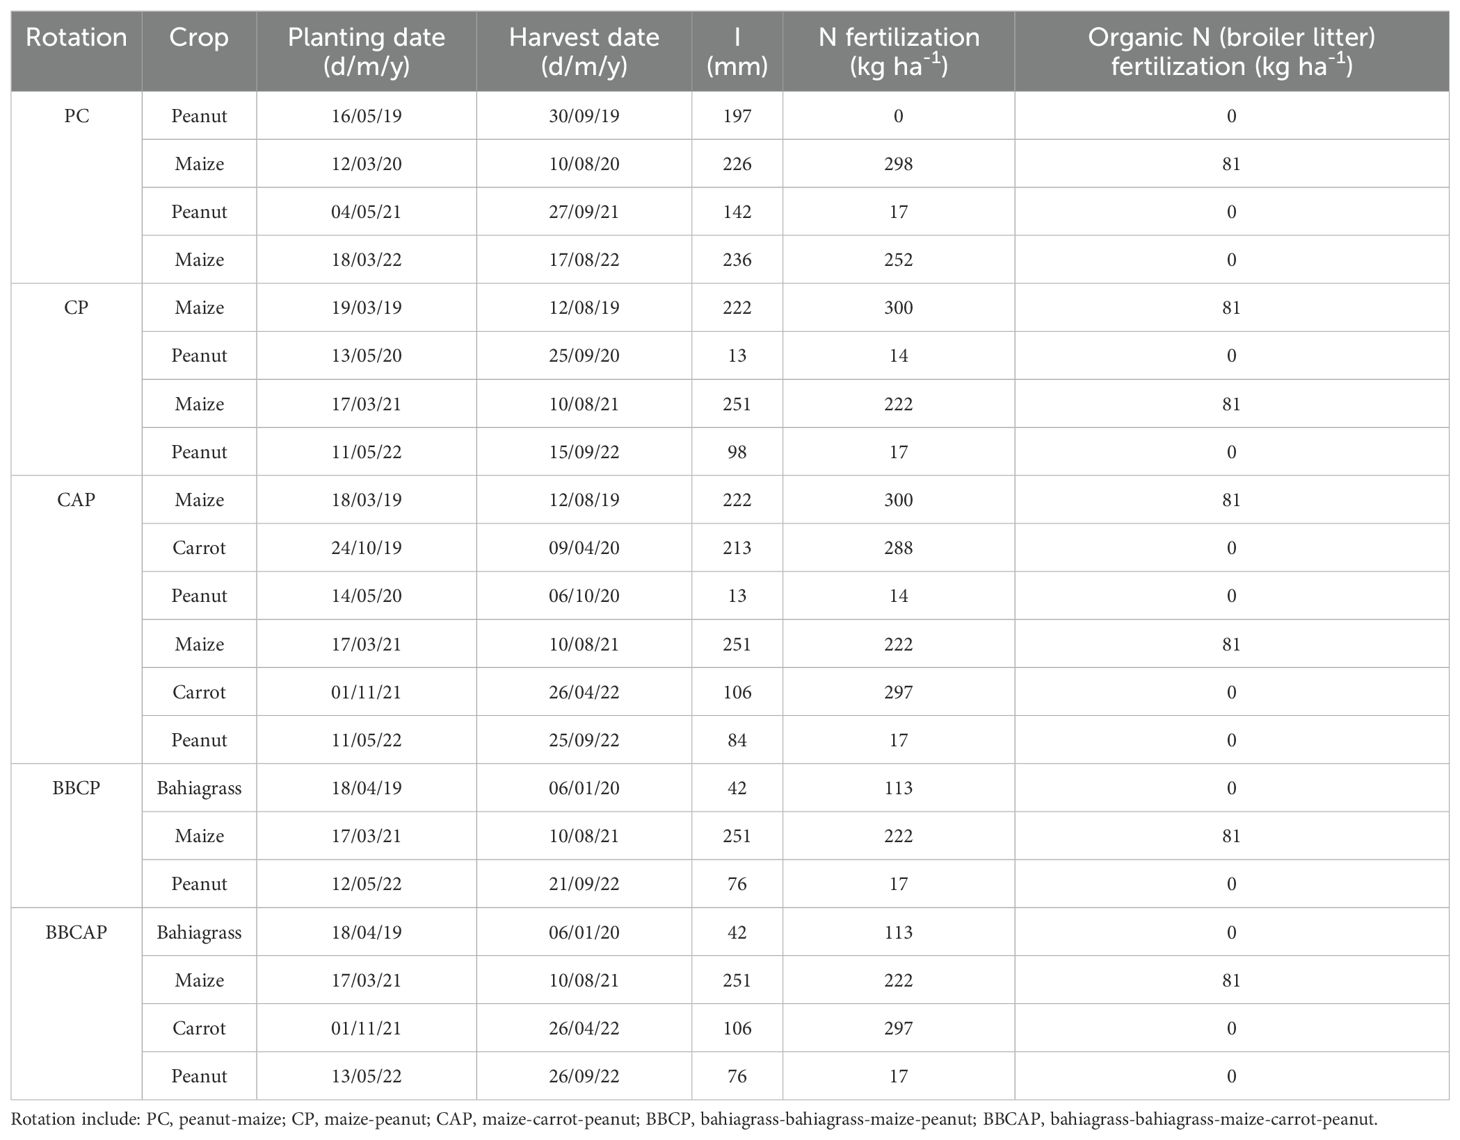
Table 2. Crop management practices across rotation.
Soil samples were taken from four different locations within each quarter of a pivot section, covering six depth intervals from 0 to 90 cm: 0-15, 16-30, 31-45, 46-60, 61-75, and 76-90 cm. These samples were shipped fresh and received by the lab within two days at Waters Agricultural Lab in Camilla, GA. Soil organic matter content was determined using the loss on ignition method (Latimer, 2023), while soil texture was analyzed using the Bouyoucos hydrometer method (Bouyoucos, 1936; Day, 1965). Soil sampling for soil texture and initial organic matter content was performed on 23 April 2018, while final organic matter content test was performed on 17 May 2022. Although soil organic matter content was measured, the results are reported as SOC values (Minasny and McBratney, 2018; Thompson, 2023).
The soil aggregate stability test used a volumetric wet sieving method to measure the volume change before and after aggregate breakdown. A set volume of air-dried soil was placed in a 30-mesh concave sieve and immersed by hand in deionized water 20 times over 15 seconds to disintegrate water-sensitive particles. Remaining stable aggregates were then measured on a scanning grid, with accuracy to the nearest 0.25 cm in diameter. The soil was then dipped once more, and the aggregates were manually broken down with a small rubber spatula. Non-aggregate sand particles were subsequently measured on the surface-area grid. Water-stable aggregate calculation involved the difference between the initial surface area before dipping and the final area after the second dip, divided by the initial fresh surface area before dipping (Jemison et al., 2019). Soil samples for this test were collected on 17 May 2022.
Bulk density and total porosity samples were gathered from six different depths at 15 cm intervals up to 90 cm, totaling 30 samples, with six from each rotation. Bulk density and total porosity were calculated using Equations 1 and 2, respectively.
Soil core samples were collected at the end of a 4-year crop rotation cycle on 23 August 2022, using a cylindrical ring with a volume of 153.9 cm³. A total of 15 soil cores, three from each rotation, were taken from the top 15 cm depth to develop the soil moisture characteristics curve for coarse sandy soil in both conventional and sod-based rotation. The soil cores were subjected to varying air pressures (0 to ~-914 cm [H20]) in tempe cells, and the soil moisture at different pressures was recorded. The soil moisture characteristics curve was then fitted using the Van Genuchten model as outlined in Equation 3 where, is soil water content (cm3 cm-3), is saturated water content (cm3 cm-3), is soil residual water content (cm3 cm-3), n is a dimensionless pore size distribution measure, and m is a shape parameters, α is inverse of air entry suction (cm-1) (α > 0), and h is the soil suction (cm of H20) (Van Genuchten, 1980). The initial estimates for these retention parameters were derived using the Rosetta Lite v 1.1 software (Schaap et al., 2001). It employs a neural network-based prediction method that utilizes the soil texture percentages (sand, silt, clay) and bulk density values to estimate the water retention characteristics of soils. In addition, Brooks and Corey model was also used to fit the soil water retention curve as shown in Equation 4 (Brooks and Corey, 1964) where, is air entry pressure (cm) and is a dimensionless shape parameter. Moreover, left part of Equations 3 and 4 denote effective water saturation. Curve fitting was done using RETC, Version 6.02 (Van Genuchten et al., 1991). Oven dry weight was calculated by placing the soil in oven at 105°C for 24 hrs. Particle density was assumed to be 2.65 g cm-3.
Soil water balance accounts for the water entering, stored (, and leaving the soil system. Inputs included precipitation (P) and irrigation (I), while outputs encompassed crop evapotranspiration (ETc, combined water loss through soil evaporation and plant transpiration), runoff (RO), and deep percolation (DP) beyond the root zone. In the context of fine sandy soil, the upward movement of water through capillary action from the water table was considered to be minimal. Weather variables, including maximum and minimum temperature, maximum and minimum relative humidity, solar radiation, wind speed, and precipitation, were retrieved from the Florida Automated Weather Network (FAWN, 2022) station located at Live Oak, FL (30.305 N, -82.89876 W, elevation: 50 m) for the study years 2018-2022. Wind speed measured at 10-meter height by FAWN station were adjusted to 2-meter height. Precipitation was measured using the tipping bucket rain gauges with sampling frequency of 0.0254 cm and reporting frequency of 15 minutes. Irrigation (I) volumes were farm measured. Air temperature data was obtained from high-resolution measurements recorded by FAWN’s Bandgap sensor. Growing Degree Days (GDD) were calculated by taking the difference between the daily average temperature and the specified base temperature. The base temperatures applied were 10°C for maize, 13.3°C for peanuts, and 3.33°C for carrots (Fraisse and Paula-Moraes, 2018; Hochmuth et al., 2021). The soil moisture was monitored via time-series capacitance soil moisture probes (Teros 11, Meter group, Pullman WA). Sensors were installed at 15 different locations (3 per rotation) at 15 cm, 30 cm and 45 cm depths. The soil moisture content measurements were multiplied by corresponding soil depth intervals to calculate the soil moisture storage at each level. The change in soil moisture storage (ΔS) was then computed by subtracting the initial soil water storage from the soil water storage measured after a 7–10 day period. The growing season SWS was determined by taking the means of all SWS measurements throughout the growing season. Runoff was estimated using the NRCS Curve Number (CN) method, which accounts for land use, soil type, and antecedent moisture conditions (AMC) categorized as I, II, or III (NRCS, 1985).
DP is the movement of water from the crop root zone into lower soil layers. This process occurs when the water applied surpasses the soil’s holding, known as field capacity. DP was indirectly computed through soil water balance model, accounting for soil characteristics and moisture levels (Equation 5) where represents the depth of deep percolation (mm) on day I, indicates the depth of irrigation (mm) on day I, is precipitation (mm) on day i, denotes the depth of runoff (mm) from the soil surface on day i, fw is the fraction of soil that is moistened due to irrigation, refers to the crop evapotranspiration (mm) on day I, and signifies the total reduction in the crop root zone moisture (mm) by the end of day i-1 (Bryant et al., 1992).
The model’s inputs consisted of daily weather data (including air temperature, incoming shortwave radiation, relative humidity, wind speed, and precipitation), along with irrigation schedules, soil moisture levels, and crop- and site-specific information such as planting and maturity dates, soil characteristics, and maximum rooting depth. Using these inputs, the model calculates daily ETc and water balance within the crop root zone. This involves computing ETc by multiplying grass-reference evapotranspiration (ETo) with the crop coefficient (Kc) (Allen et al., 1998; Equation 6). The Kc values used in this study were also sourced from Allen et al. (1998).
The (ETo) was determined using the FAO-56 Penman-Monteith equation as described by Allen et al. (1998) (Equation 7) as:
where ( is radiation component and is aerodynamic component, Δ is the slope of the saturation vapor pressure versus air temperature curve (kPa °C−1), Rn is the net radiation at the surface (MJ m-2 day-1); γ is psychrometric coefficient (kPa°C−1); G is soil heat flux density (Wm-2) summed to be zero at daily time step, u2 is wind speed at 2 m height (ms-1), ea is actual vapor pressure (kPa), and es saturation vapor pressure (kPa) and T is average daily air temperature (°C).
This paper represents crop water productivity through two approaches: (i) WPC-ETc, calculated as the grain yield per square meter divided by ETc (Equation 8), and (ii) WPC-TWU, determined as the grain yield per square meter divided by the total water involved in crop production (TWU) (Equation 9; Viets, 1962; Fernández et al., 2020). At complete maturity, yield (Y) samples were hand-harvested from plots using specific standard dimensions: 6 m by 1.3 m for carrots, 2 rows each 6 m long and 1.5 m wide for peanuts, and 2 rows each 5.3 m long for maize. Carrots were harvested based on a target date recommended by local growers to achieve the optimal size range specific to the ‘Maverick’ variety. As the anticipated harvest date neared, a small sample of carrots was taken to check the percentage meeting the marketable length and width standards, confirming the harvest timing. The remaining crop areas were then harvested with appropriate machinery: combine harvesters for maize, root crop harvesters for carrots, and peanut diggers for peanuts. The yield samples were adjusted at 15.5% and 10.5% standard moisture content for maize and peanuts, respectively.
Statistical analysis was conducted using one-way Analysis of Variance (ANOVA) via the ‘aov’ function in Rstudio Version 2023.12.1 to identify significant differences among rotational productions at a 0.05 significance level. Significant findings from ANOVA were further explored using Tukey’s Honest Significant Difference (Tukey HSD) test, implemented through the ‘agricolae’ package in R. The fitness of soil water retention models was evaluated root mean square error (RMSE, Equation 10) normalized root means square error (nRMSE, Equation 11) and Nash Sutcliffe model efficiency coefficient (NSE, Equation 12) where, n is number of observations, is the observed values, is the average of observed values, and x′ is the fitted values.
Table 3 provides climatic data across various crop rotation from 2019-2022 providing insights into environmental influences on crop growth and management. Four growing seasons had contrasting climatic conditions. Throughout the crop growing seasons (March to September) during the study, minimum air temperatures ranged from a slight sub-freezing -0.4°C to 2.6°C, while maximum temperatures varied between a warm 35.2°C and an occasional high of 38.3°C. Mean air temperatures remained stable, ranging from 23.6°C to 24.3°C. Growing degree days (GDD) also displayed notable variability. Over the four years, maize accumulated GDD values from 1986°C in the 2021 growing season to 2172°C in 2022, with an average of 2084°C and a standard deviation of 89°C. The highest recorded temperature of 38.3°C in 2022 coincided with maize’s peak GDD. For peanuts, GDD ranged from 1720°C in the 2020 season to 1789°C in 2021, averaging 1754°C with a standard deviation of 29°C. For carrots, GDD values ranged from 2281°C in the 2019/20 season to 2350°C in 2021/22.
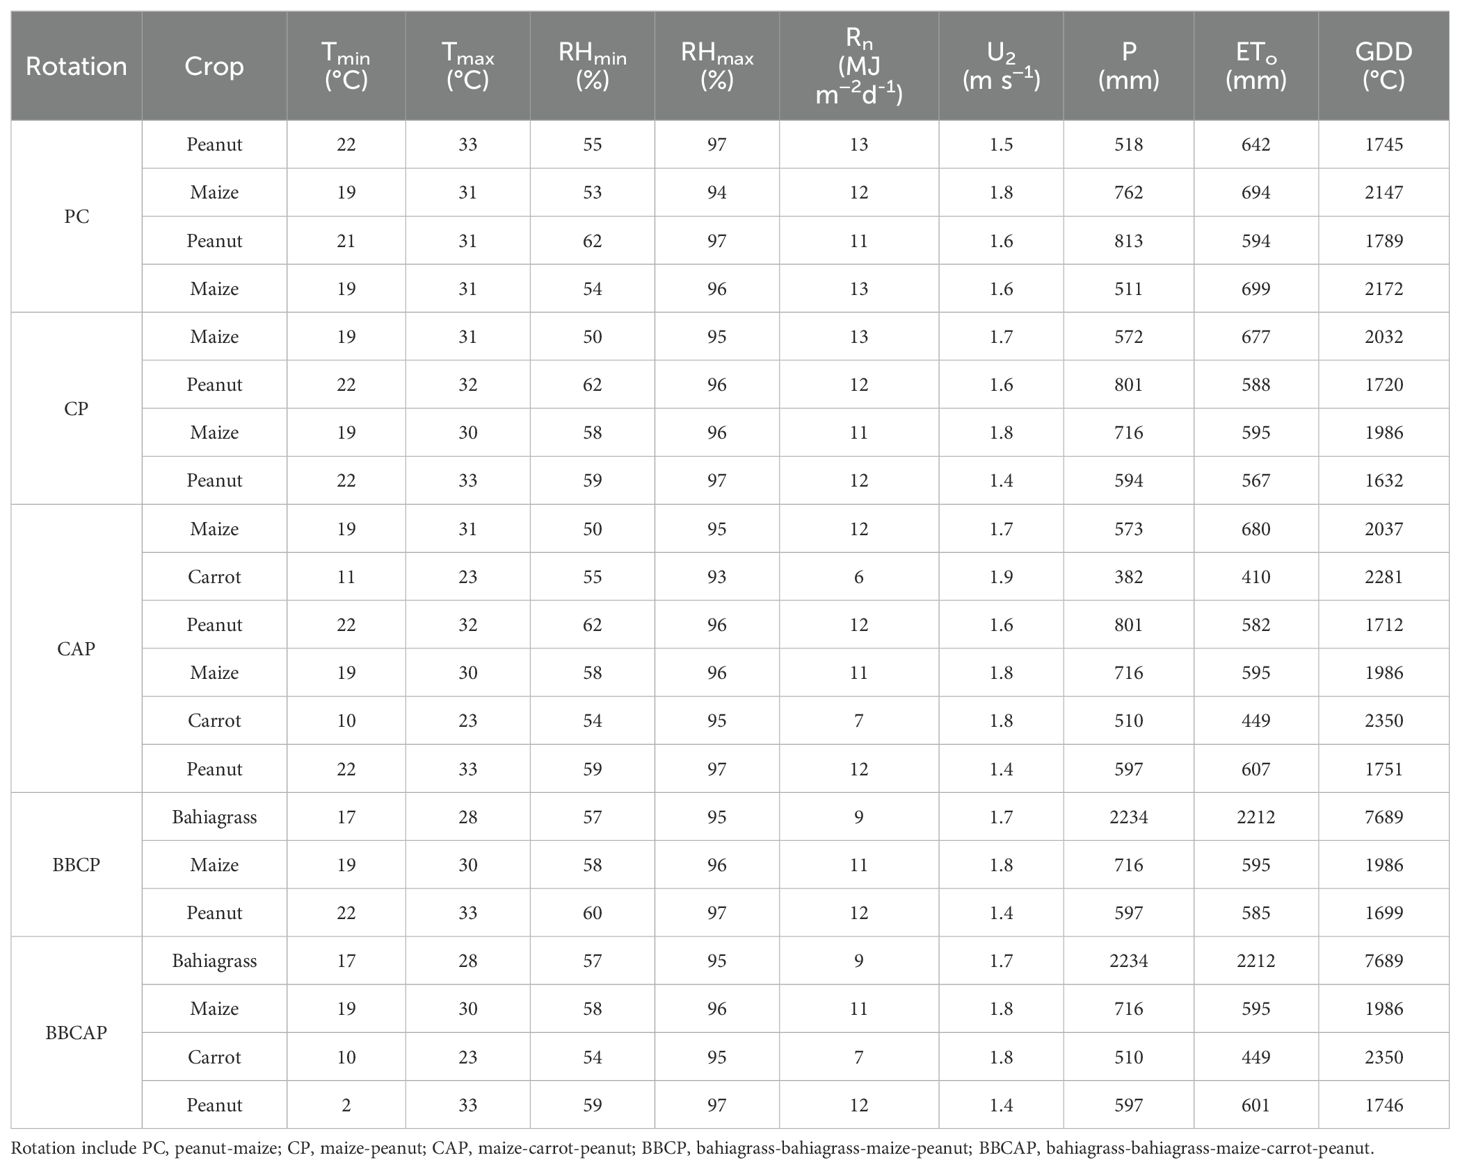
Table 3. Average weather conditions and crop management practices across rotation.
Additionally, over the study years wind speed (U2) varied from 1.4 to 1.9ms-1, solar radiation (Rs) spanned from 6 to 13 MJ m−2d-1, and relative humidity fluctuated with minimums from 50% to 62% and maximums from 93% to 97%. The year 2021 experienced the most rainfall, with a total of 1417 mm, while 2020 followed with 1365 mm—both years surpassing the historical annual average of 1243 mm, calculated from 2003 to 2022 (Figure 2A). The years 2019 and 2022 received less, with totals of 1091 mm and 1130 mm, respectively. Notably, the peak daily rainfall occurred on 7 June 2020, with a record 205.2 mm.
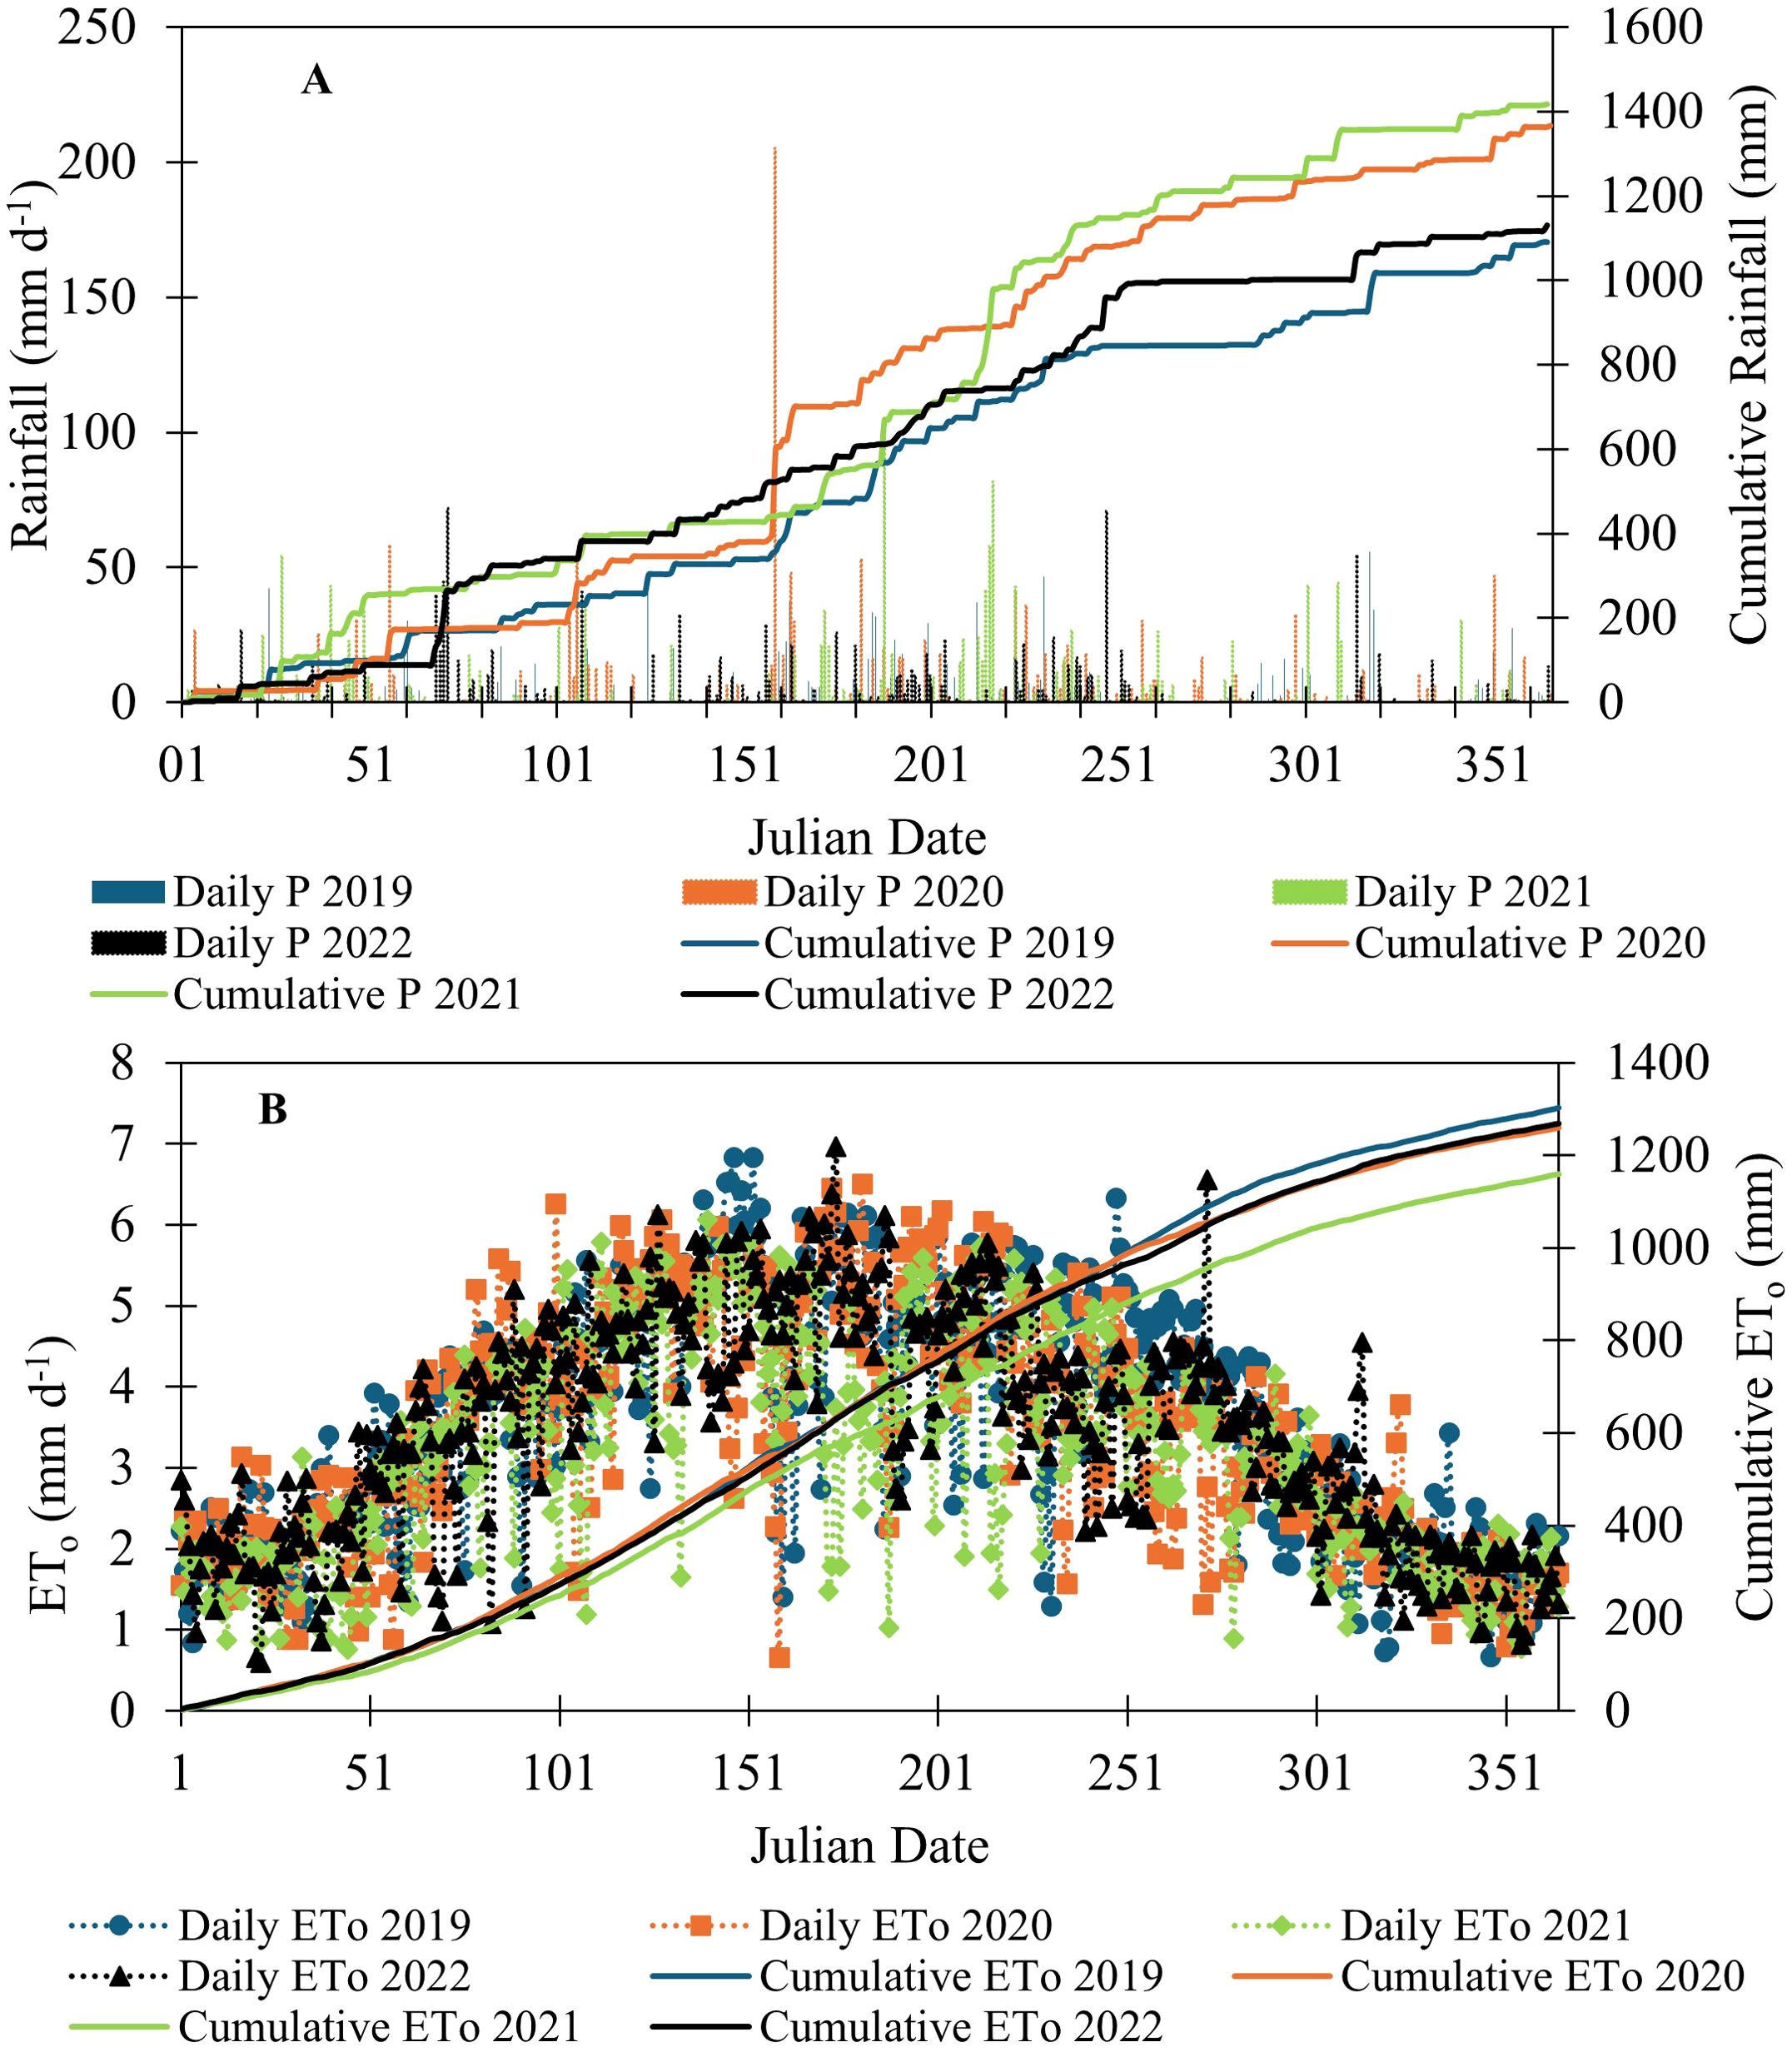
Figure 2. Daily and seasonal variation of (A) precipitation and (B) reference evapotranspiration (ETo) during 2019, 2020, 2021 and 2022 at NFREC, Live Oak, FL.
The grass-based reference evapotranspiration (ET0) graph (Figure 2B) for the years 2019 to 2022, calculated using the FAO-56 Penman-Monteith equation, illustrates the daily fluctuations and cumulative trends of ET0. ET0 values were typically lower in the early and late parts of the season (i.e., winter) and higher in mid-season. While the maximum and minimum ETo values varied across the three growing seasons, the seasonal average values remained consistent. In 2019, the total ET0 reached 1303 mm, which was the highest among the four years, suggesting a greater demand for water due to atmospheric conditions conducive to evapotranspiration. The year 2021 had the lowest ET0, totaling 1160 mm, indicating lower evaporative demand. The years 2020 and 2022 had total ET0 values of 1262 mm and 1269 mm, respectively, reflecting moderate evaporative demands. The average ETo (across four years) of 641 mm (SD = 50 mm), 596 mm (SD = 22 mm) and 436 m (SD = 23 mm) was observed in maize, peanut, and carrot growing season.
Volumetric soil aggregate stability measurements taken on 17 May 2022 at 0-90 cm soil depths is presented in Figure 3A. In this study, the average soil aggregate stability was 4% (SD = 2%) for the PC rotation, 4% (SD = 2%) for the CP rotation, 5% (SD = 3%) for the CAP rotation, 9% (SD = 3%) for the BBCP rotation, and 8% (SD = 4%) for the BBCAP rotation. On average, the BBCP rotation had 125% higher soil aggregate stability compared to the maize-peanut (CP) rotation, and the BBCAP rotation had 60% higher soil aggregate stability compared to the maize-carrot-peanut (CAP) rotation. However, it is important to note that adding two years of bahiagrass to the conventional rotation did not change the soil aggregate stability category from the very low category (<15%) (Jemison et al., 2019). The aggregate stability generally increased at greater depths, particularly in the BBCP and BBCAP rotation. For instance, at 15 cm, the measurements are relatively low and consistent, but by 90 cm, the BBCP frequently shows higher values, indicating stable soil aggregates. The BBCP rotation consistently shows high stability, peaking in the 60 cm depth range with a value of 12.25%, while the BBCAP rotation also indicates high stability, particularly at the 45 cm range with a value of 10%. The one-way anova and subsequent post hoc test results for the aggregate stability are represented in alphabetical letters in Figure 3A. The p-value (ranging from 0.0027 to 0.0411) was significant in all but the 75-90 cm depth range, suggesting that at the end of 4-year cycle of conventional vs sod-based rotation a statistical distinction was noticed in aggregate stability. This distinction might be due to the fact that perennial grasses such as bahiagrass can develop a deep rooting system. As roots decompose, they create channels in the soil, which contribute beneficially to soil structure and overall health (Elkins et al., 1977; Wright et al., 2004). Degens et al. (1996) reported an increase in water stable aggregates in sandy soil with increasing length of saprophytic and mycorrhizal hyphae in a glasshouse experiment. Iheshiulo et al. (2024a) evaluated six crop rotation and their impact on aggregate stability across three sites in the Canadian prairies over four years. Significant improvements in aggregate stability were observed at Lethbridge and Swift Current. At Lethbridge, the soil health-enhanced rotation achieved an aggregate stability of 78%, notably higher than other rotation. In contrast, at Swift Current, the high-risk and high-reward rotation led with an aggregate stability of 39%, surpassing the pulse/oilseed intensified and market-driven rotation. No significant differences in aggregate stability were noted at Scott, indicating that soil texture and climate heavily influence aggregate stability responses. These results emphasize the beneficial effects of including diverse pulse crops (legumes) in rotation to enhance soil stability.
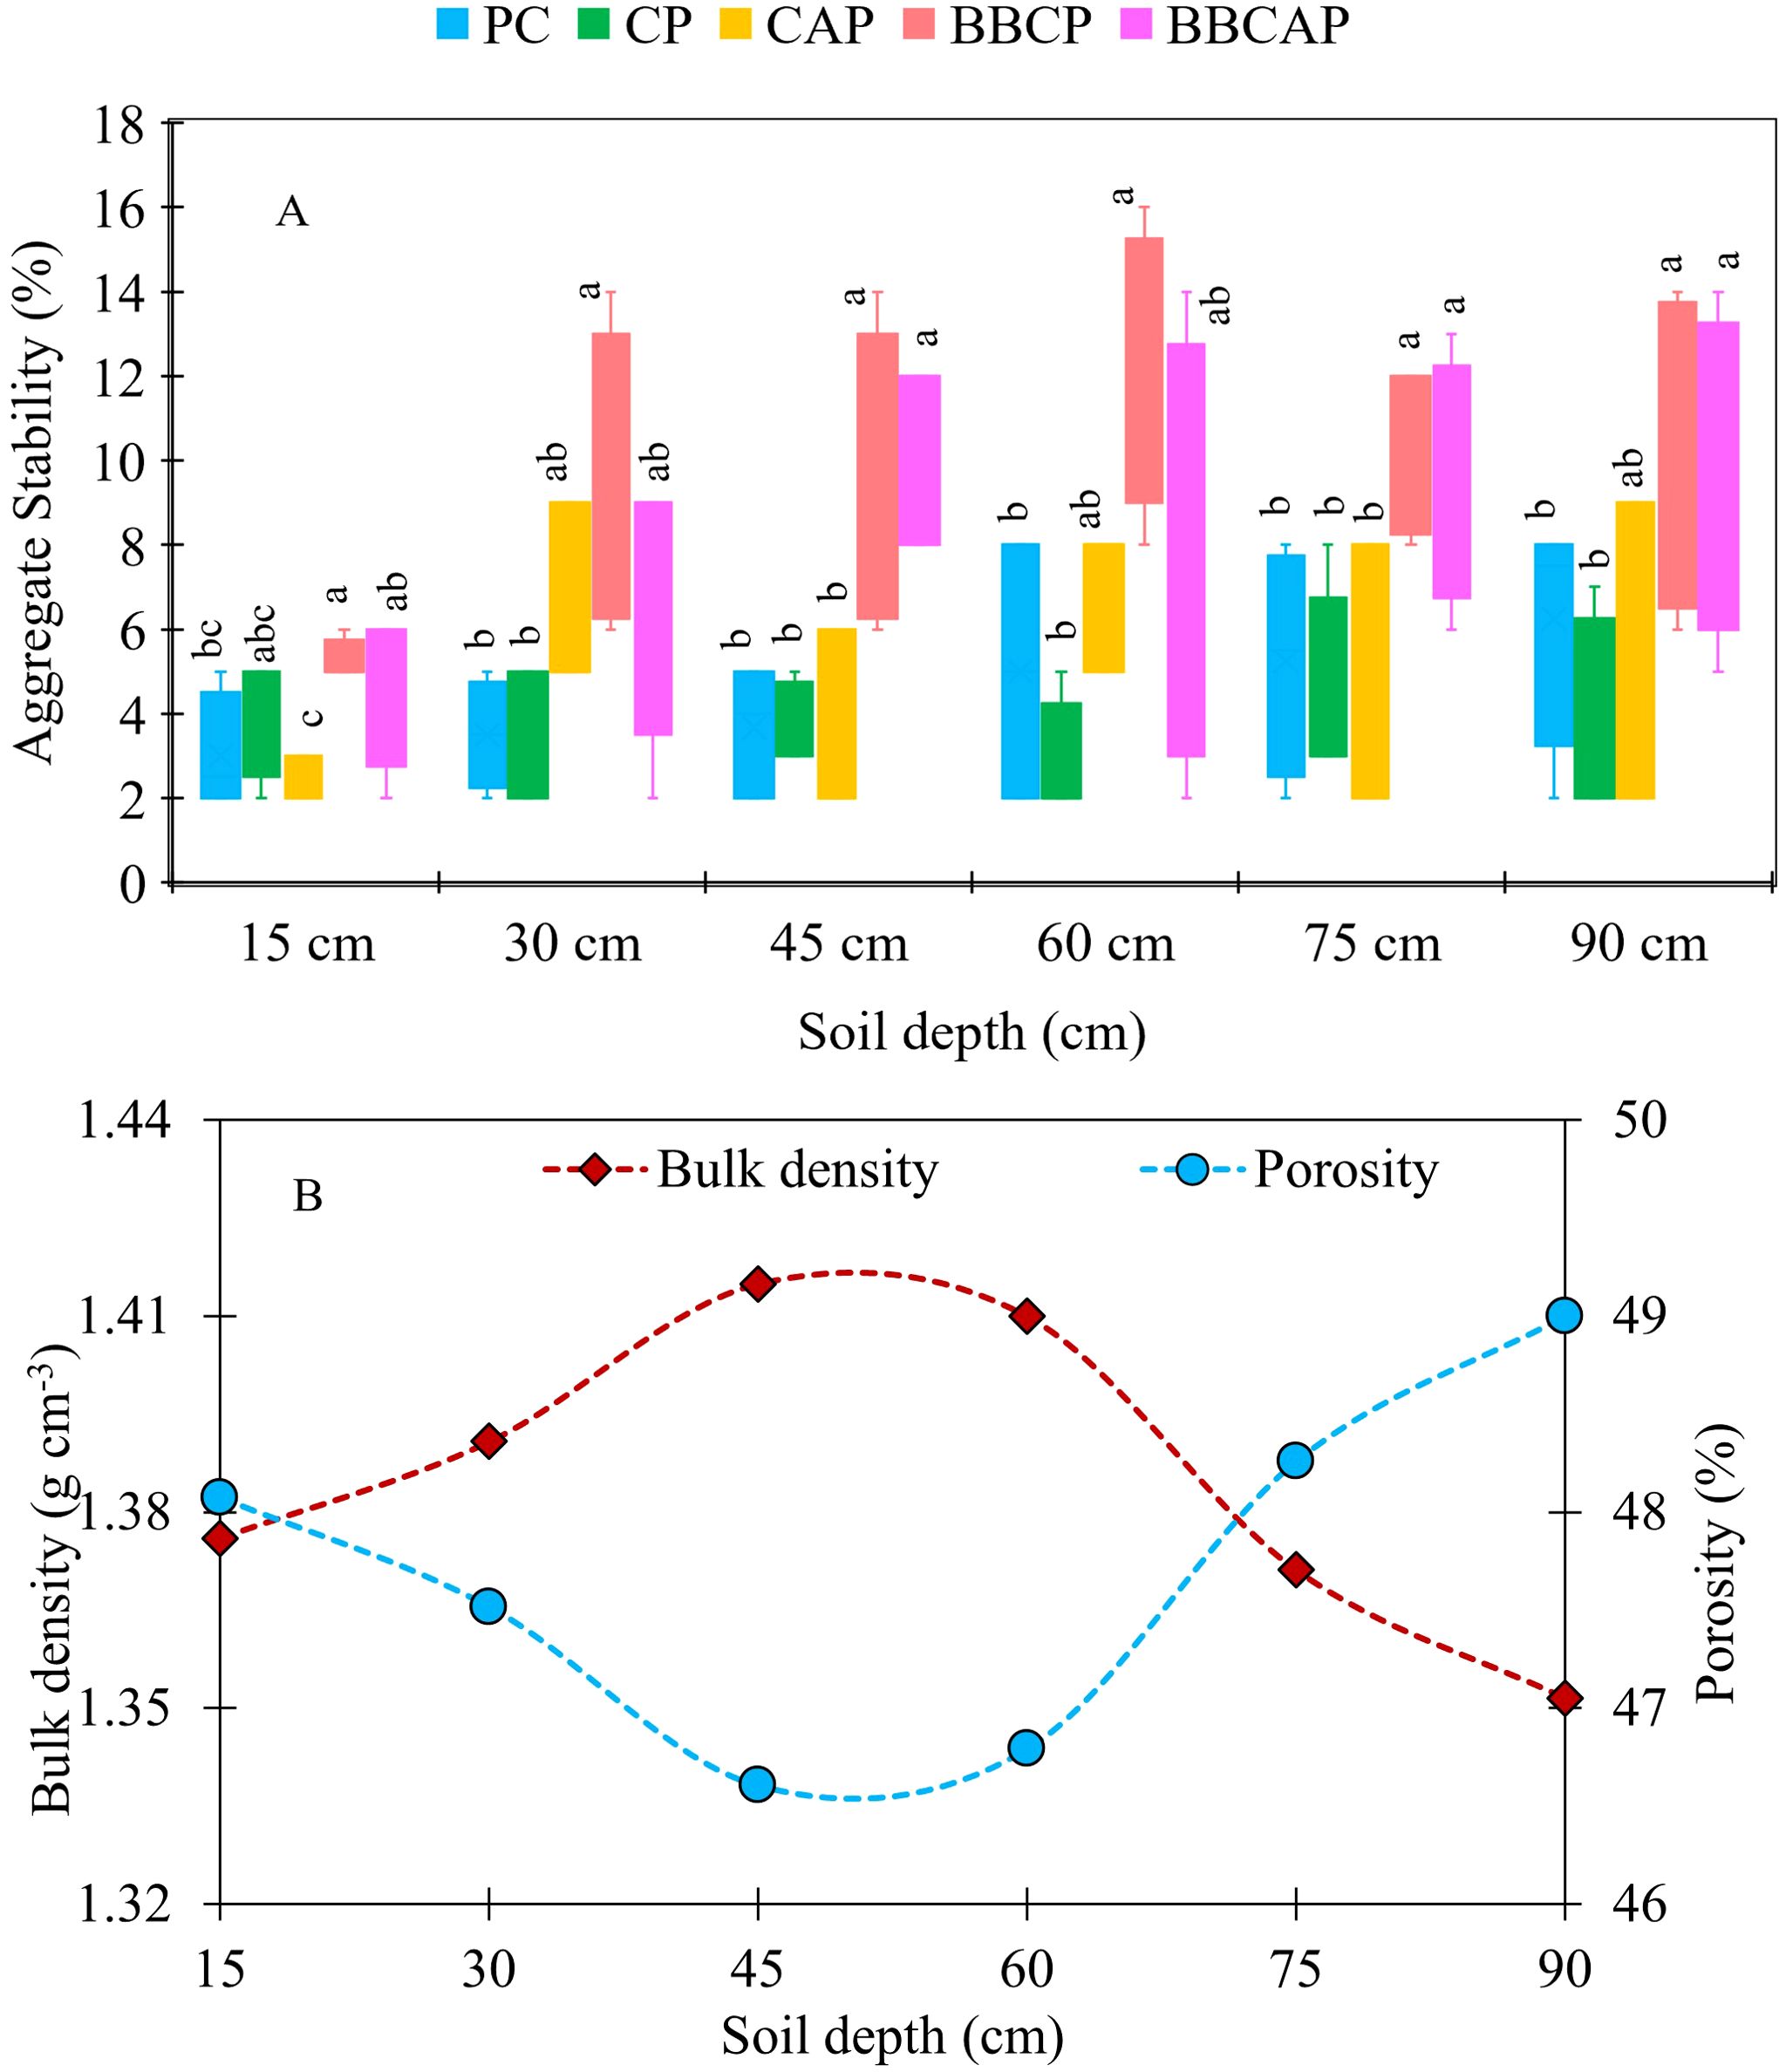
Figure 3. Soil properties variation with depths from 0 to 90 cm across rotational production. (A) Volumetric soil aggregate stability (%) [soil was sampled on 17/05/2022] and (B) average soil bulk density (g cm-3), and average total porosity (%) [soil was sampled on 23/08/2022]. Rotation include: PC, peanut-maize; CP, maize-peanut; CAP, maize-carrot-peanut; BBCP, bahiagrass-bahiagrass-maize-peanut; BBCAP, bahiagrass-bahiagrass-maize-carrot-peanut.
Soil bulk density varied from 1.29 g cm-3 (at 75 – 90 cm depth interval) to 1.47 g cm-3 (at 45 – 60 cm depth interval). Likewise, porosity varied from 44.4% (at 45 – 60 cm depth interval) to 51% (at 75 – 90 cm depth interval). Average soil bulk density and average total porosity from 0 to 90 cm depth across rotational production varied from 1.35 to 1.41 g cm-3 and 46.6 to 48.9%, respectively (Figure 3B) with no significant differences (F-value = 1.65; and p-value = 0.185). Likewise, no significant differences were detected in bulk density (1.4 g cm-3) and total porosity (48%) between conventional and sod-based rotation (all depths combined). NRCS (2024) reported bulk density values are 1.5 g cm-3 for Hurricane, Albany, and Chipley soils, primarily linked to the CAP, BBCP, and BBCAP rotation, and 1.45 g cm-3 for the Blanton-Foxworth-Alpin complex, associated with the PC and CP rotation. These values, which are same across all depths, on an average were 7.1% and 3.6% higher, respectively, than the field-measured bulk density values for the corresponding soil types.
Table 1 presents variation of soil texture, bulk density and SOC among various soil types involved in the study. The Blanton, Foxworth-Alpin soil under maize-peanut (CP) rotation is composed of 94.8% sand with a bulk density of 1.4 g cm-³, porosity of 47.9%, and SOC of 0.5%. Meanwhile, the Hurricane, Albany, and Chipley soils under maize-carrot-peanut (CAP) rotation maintain similar bulk density and slightly higher porosity of 48.7%, with SOC at 0.55%. The Hurricane, Albany, and Chipley soils in bahiagrass-bahiagrass-maize-peanut (BBCP) rotation had 94.6% sand, 3% silt and 2.4% clay leading to porosity of 49.8% and bulk density of 1.4 g cm-3. The SOC slightly increased to 0.56%. For the bahiagrass-bahiagrass-maize-carrot-peanut (BBCAP) rotation under the Hurricane, Albany and Chipley soils, SOC was reported to be 0.83% while porosity was 47.1%. Iheshiulo et al. (2024b) reported non-significant differences for bulk density and total porosity from 5 to 20 cm soil depths among seven different crop rotation across three sites. In contrast to this study, Long and Elkins (1983) observed a seven-fold increase in pore volume for pores larger than 1.0 mm in the dense soil layers below the plow depth when comparing cotton grown after three years of continuous bahiagrass sod to continuous cotton. They attributed the increase in pore volume to the ability of bahiagrass roots to penetrate the dense soil layer; as these roots decayed, they left behind pores large enough to facilitate cotton root growth.
In southeast US, soil is generally low in the SOC. Continuous row cropping for many years has further degraded these soils. SOC influences various aspects of soil quality, including enhancing soil aggregation, increasing water infiltration, serving as a reservoir for slow nutrient release, and supplying substrates for soil organisms such as microbes and earthworms. The findings indicate that concentrations of SOC are typically greater in the upper soil layers and tend to decrease with increasing soil depth (Figure 4). During the course of this study, no significant differences in the percentage of SOC was observed between conventional and sod-based crop rotation, with one exception. In the final sampling (17 May 2022), at the topmost 15 cm of the soil layer, the BBCAP rotation showed a notably higher percentage of SOC at 0.83%, which was statistically significant (p = 0.0476) compared to the other rotation systems (Figure 4B). Furthermore, by the end of the study, the percentage of SOC in the soil profile had increased by 42% (significantly higher) in BBCAP, 22% in BBCP, 16% in CAP, while it had decreased by 27% in the PC/CP rotation (Figures 4A, B). Wick et al. (2017) mentioned increase in aggregate stability and SOC when perennial grass is used as cover crops. It is important to note that building up the SOC content is a long-term process. Even with the adoption of the best conservative practices, SOC content increases at a slow rate of 0.1-0.2% only per year (Martin, 2003). Iheshiulo et al. (2024a) examined the impact of alternative versus conventional cereal-fallow or cereal-dominated rotation and reported no significant changes in soil organic carbon concentrations despite integrating pulses into rotation with reduced N fertilizer application. West and Post (2002) observed that significant shifts in soil organic carbon and N typically appear within 5 to 10 years and stabilize into a new equilibrium over 15 to 20 years. Conversely, 20 years no till study by Lemke et al. (2012) reported no significant increases.
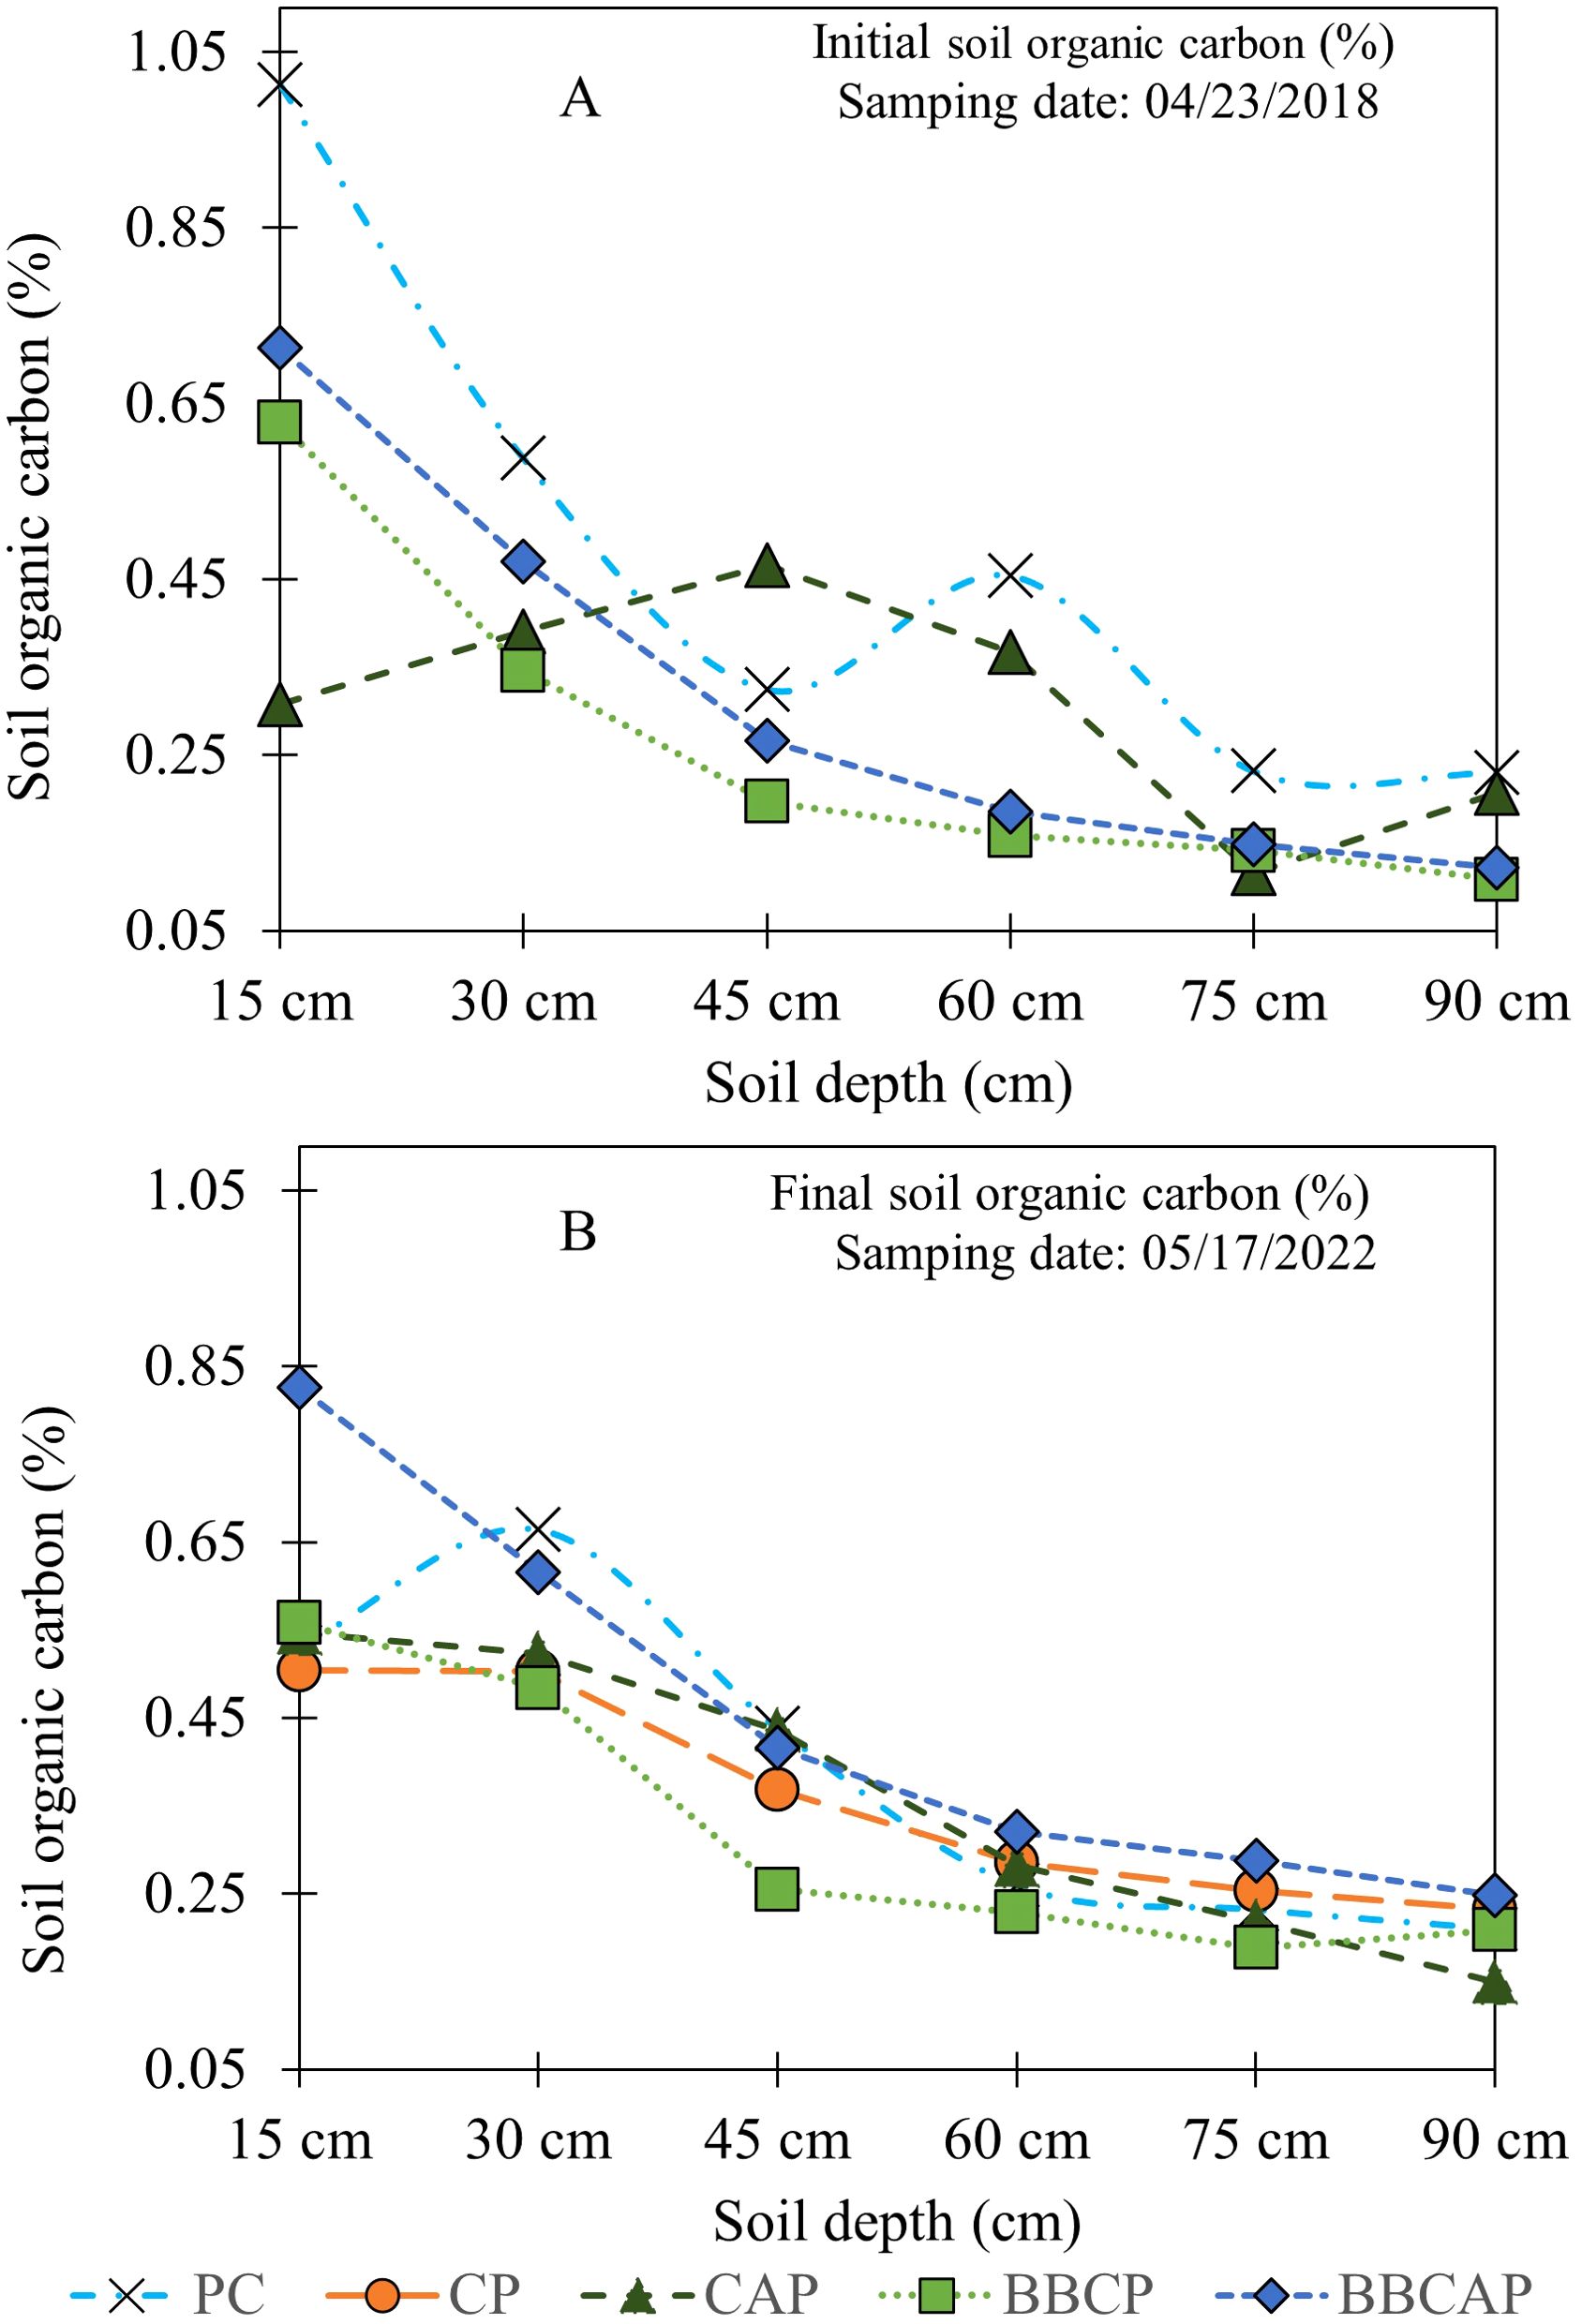
Figure 4. Soil organic carbon (SOC) variation with depths from 0 to 90 cm across rotational production [Soil was sampled on 23/04/2018 initially and final sampling was done on 17/05/2022]. (A) Initial and (B) final SOC (%). Rotation include: PC, peanut-maize; CP, maize-peanut; CAP, maize-carrot-peanut; BBCP, bahiagrass-bahiagrass-maize-peanut; BBCAP, bahiagrass-bahiagrass-maize-carrot-peanut.
An overview of soil water retention parameters for various soil types measured on 23 August 2022, from top 15 cm of soil surface across four different rotational production is presented in Figure 5, Tables 4, 5. Field capacity (FC) values (Figure 5) varied across different crop rotation and soil types, reflecting how agricultural practices influence soil water retention. For the maize-peanut rotation in the Blanton, Foxworth-Alpin soil, the Van Genuchten model estimated FC at 7.9%, while the Brooks and Corey model estimated at 7.6%. The maize-carrot-peanut rotation in the Hurricane, Albany and Chipley FC values estimated at 10.7% and 10.1% for the Van Genuchten and Brooks and Corey models, respectively. The precision of these models is evidenced by the fit metrics provided in Tables 4, 5, including RMSE, NRMSE, and NSE, all of which confirm the robustness of the models with NSE values very close to 1. When compared with the Natural Resources Conservation Service (NRCS) web soil survey values, the FC values for Blanton, Foxworth-Alpin soil and Hurricane, Albany and Chipley FC values were approximately 34% and 41% higher. An increase in FC was observed in the bahiagrass-bahiagrass-maize-peanut rotation with 13.4% for Van Genuchten and 13.3% for Brooks and Corey, which can be attributed to changes in soil structure and organic matter content. Lastly, the bahiagrass-bahiagrass-maize-carrot-peanut rotation’s FC was measured at 11.1% and 11.2% for Van Genuchten and Brooks and Corey, respectively, indicating a moderately high water retention capability.
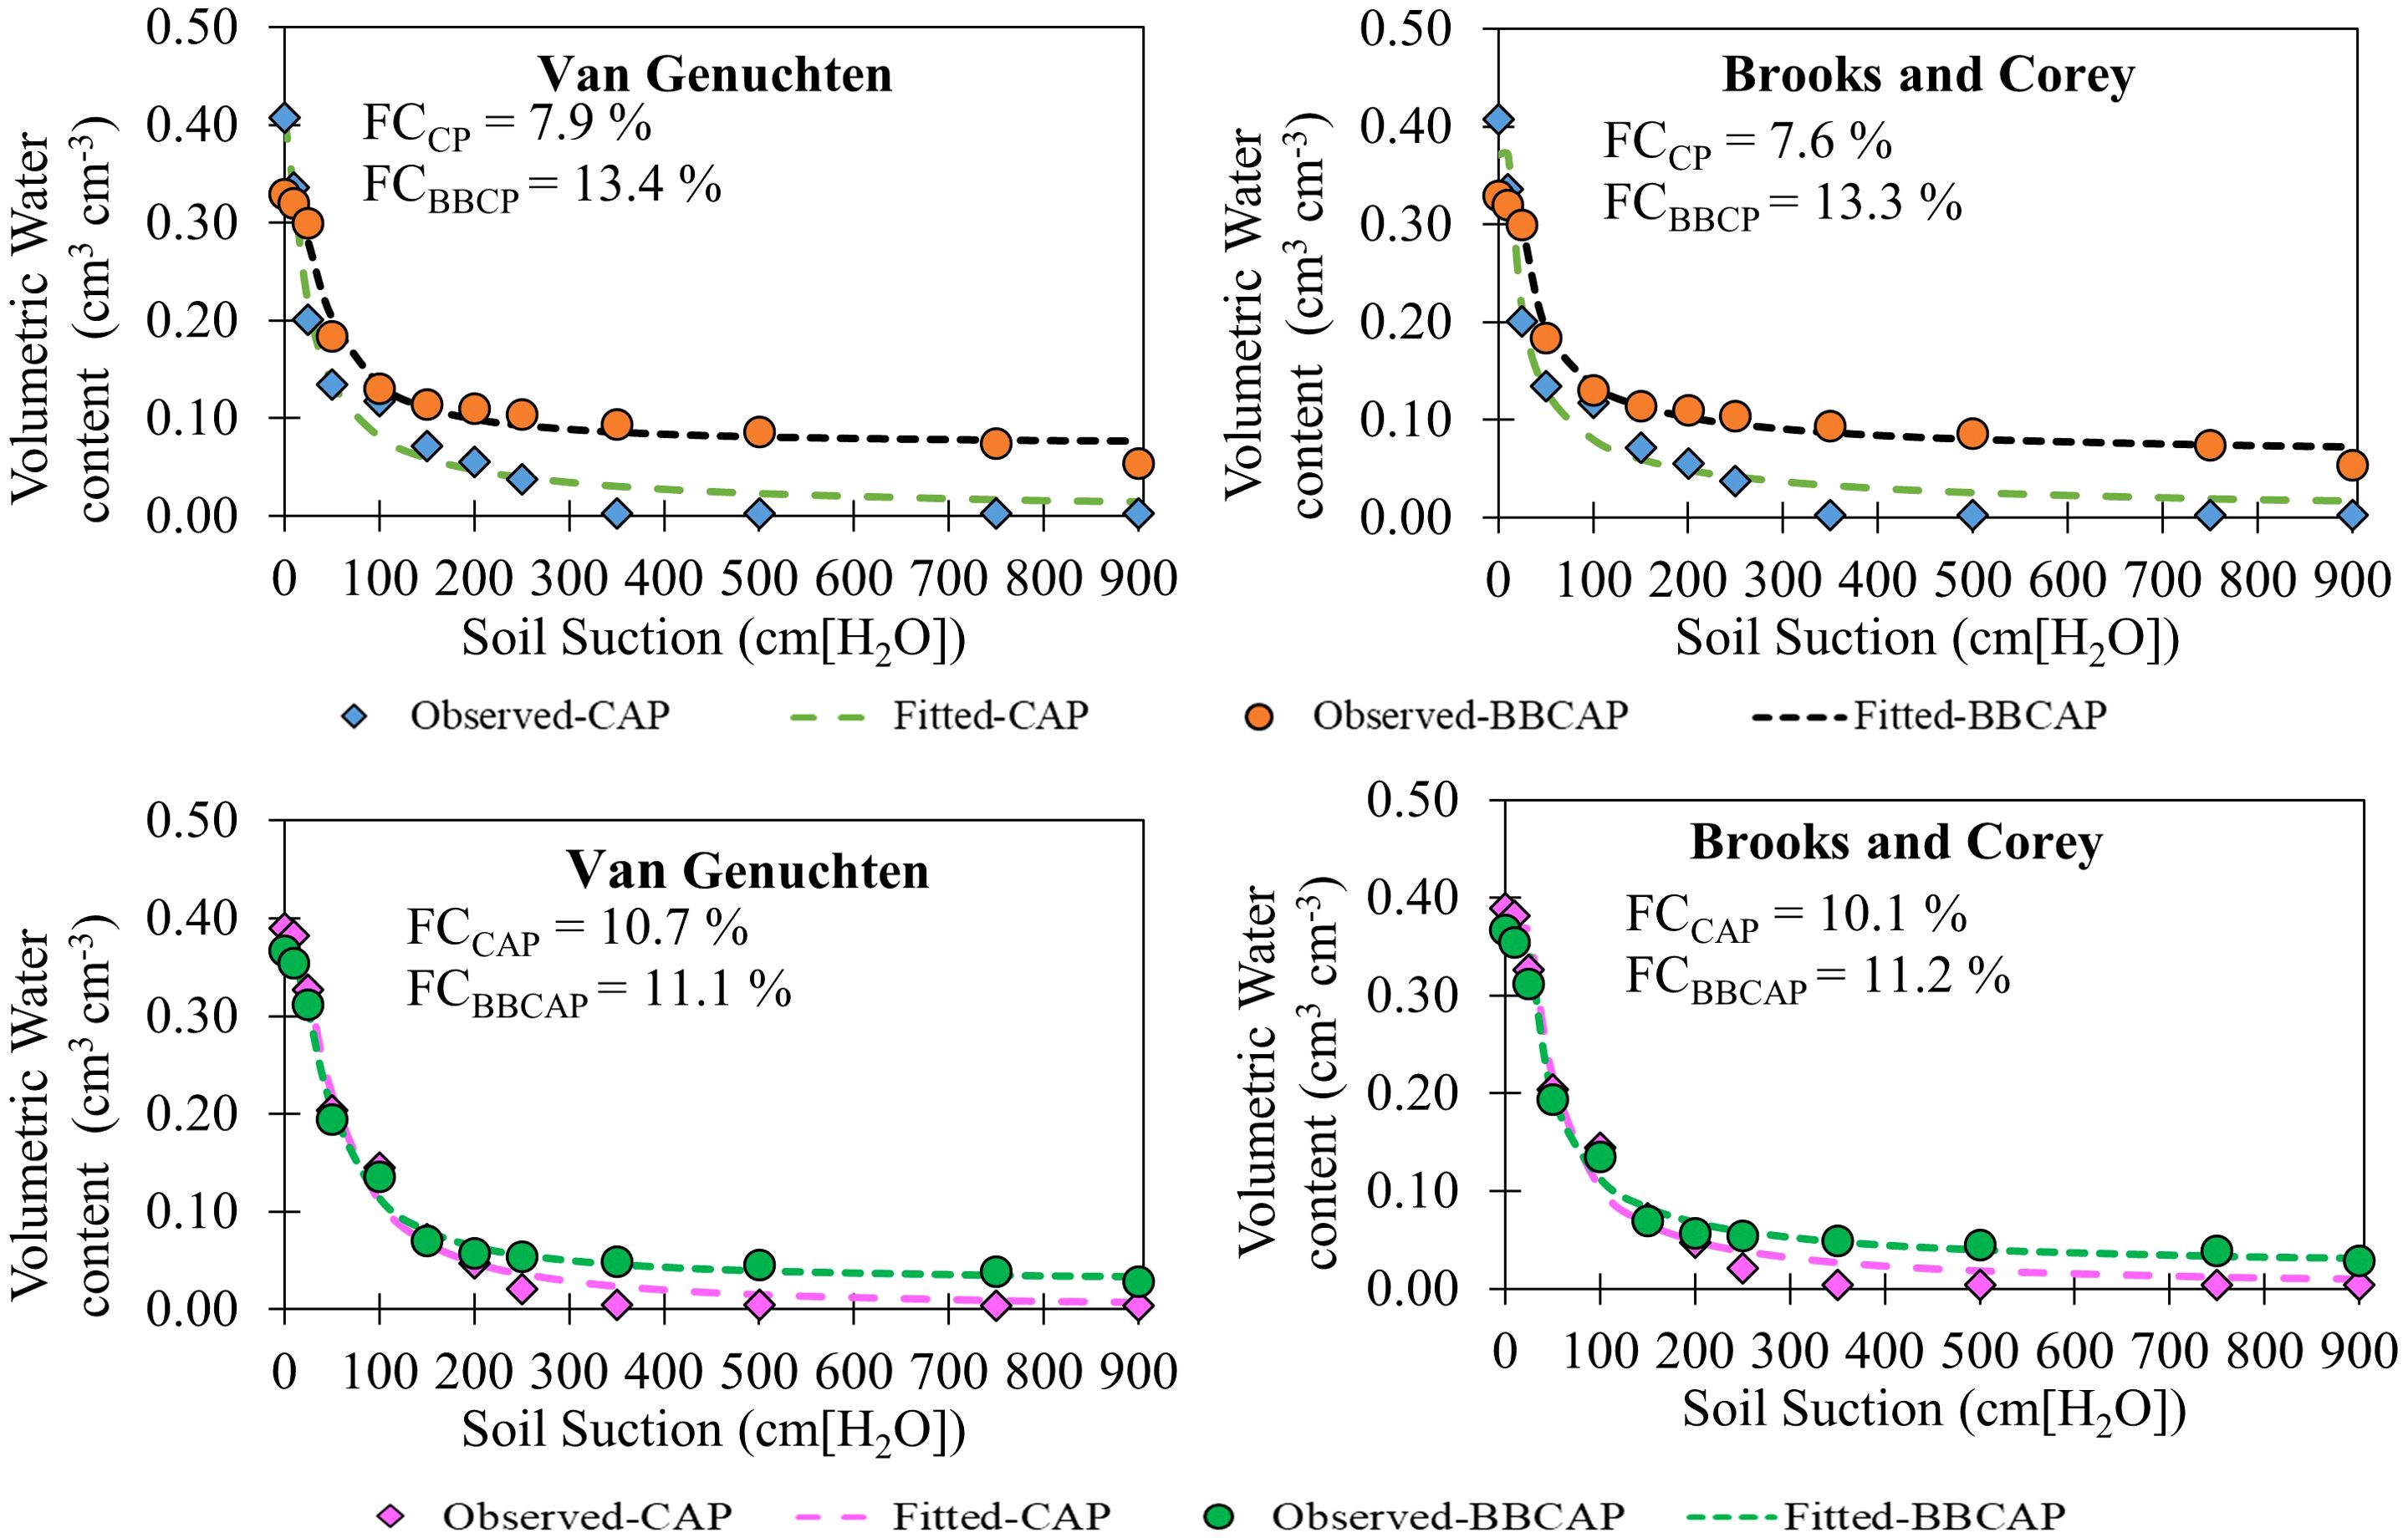
Figure 5. Soil moisture characteristic curve measured on 23/08/2022 for top 15 cm of soil surface on various rotational production using Van Genuchten and Brooks and Corey fitting. Rotation include: CP, maize-peanut; CAP, maize-carrot-peanut; BBCP, bahiagrass-bahiagrass-maize-peanut; BBCAP, bahiagrass-bahiagrass-maize-carrot-peanut; FC, denotes the field capacity.
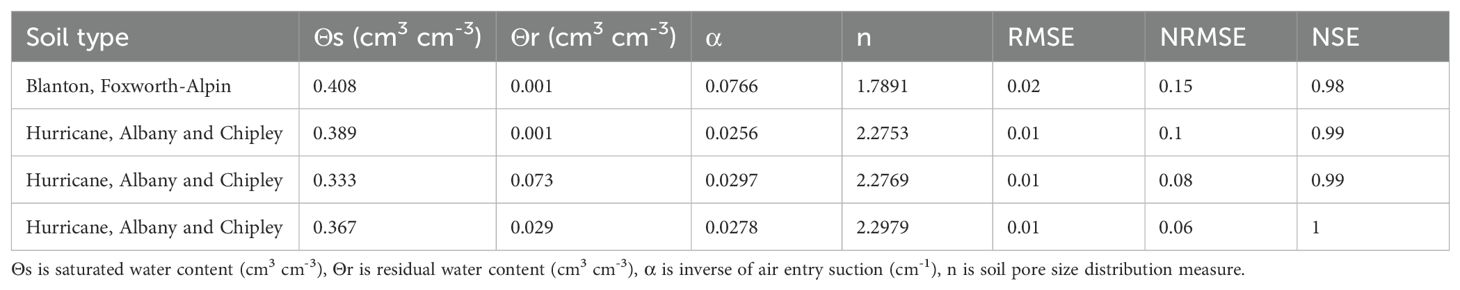
Table 4. Water retention parameters for Van Genuchten of various soil types across rotational production for top 15 cm of soil surface measured on 23 August 2022.
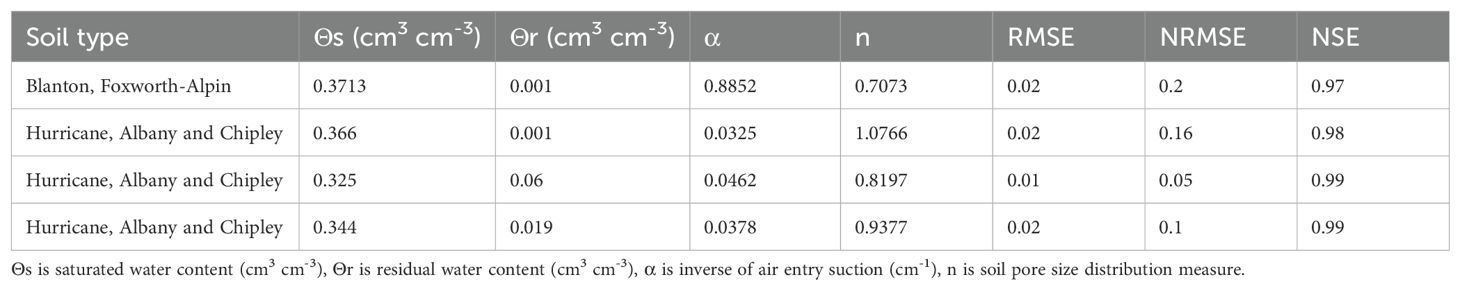
Table 5. Water retention parameters for Brooks and Corey of various soil types across rotational production for top 15 cm of soil surface measured on 23 August 2022.
On average, including two years of bahiagrass in a maize-peanut rotation led to a 72% increase in field capacity (FC) compared to the conventional rotation. However, when carrots are added to the standard maize-peanut system, the influence of bahiagrass on FC diminishes, showing only a 7% increase. Carrot planting typically involves chisel plowing, keyline plowing, or broad forking to a depth of 12–20 inches, which helps create deep channels for root development. Establishing a fine seedbed is essential, as the small carrot seeds require good soil contact and moisture absorption for optimal germination. Many growers use a rototiller to prepare the seedbed, while others opt for a field cultivator equipped with a crumbling roller to achieve the necessary fine soil texture for seeding. In addition, when harvesting, carrots were loosened from the soil by undercutting the beds with a metal undercutter, which further disturbs the soil. Some variability in FC and PWP within the same production system may stem from differences in soil properties and/or experimental and measurement errors. However, this study provides a short-term perspective on the potential effects of sod-based rotation on soil physical properties. A longer timeframe (e.g., six to seven years) may be required for sufficient incorporation of dry matter into the soil profile, which could enhance organic matter content and subsequently increase FC and PWP. These FC and PWP values are crucial for understanding soil-water relations and for effective irrigation management. The study by Iheshiulo et al. (2024b) on the Canadian prairies assessed the effects of six different crop rotation on soil hydraulic properties over four years under no-till management. The results for field capacity (FC) varied by location and crop rotation. At Lethbridge, conventional and high-risk, high-reward rotations increased FC by 12–14% in the 5–10 cm soil depth compared to soil health-enhanced rotations. At Scott, the pulse/oilseed intensified rotation showed a significant increase in FC by 22% in the 15-20 cm depth compared to the market-driven rotation. However, no significant changes in FC were observed at Swift Current. These findings highlight the influence of crop rotation on soil water retention, suggesting that certain rotation can enhance FC, though the effects are site-specific.
This study evaluated the performance of a capacitance soil moisture sensor, demonstrating its capability to estimate soil moisture levels across a range of conditions (Figure 6). Before the start of the experiment, the soil moisture sensors were calibrated against gravimetric soil moisture samples taken at the research site. The measured gravimetric soil moisture data were divided into training (67% of the total data: for developing the calibration curve) and testing (33% of the total data: for model validation) dataset. Calibration curve was developed using the training dataset, which was then applied to the testing dataset to predict soil moisture. The coefficient of determination (R2), Root Mean Square Difference (RMSD), and Nash-Sutcliffe (NSE) values between predicted and measured gravimetric soil moisture data were evaluated. The calibration analysis revealed a linear relationship between uncalibrated sensor readings (m³ m-3) and gravimetric soil moisture (m³ m-3), encompassing both dry and wet soil states. The gravimetric method measures volumetric soil water content by extracting a known volume of soil, drying it at 105°C until reaching a constant weight, and then calculating the water volume lost. This method serves as the standard for comparison with other methods; however, due to its destructive, time-intensive, and non-continuous nature, alternative technologies have been developed for soil water measurement (Rudnick et al., 2015). Although the soil moisture sensor captured the trend of dynamic changes in soil moisture levels at different depths, the calibration results showed that the sensor overestimated soil moisture compared to gravimetric readings. The linear calibration showed an R² of 0.94, and RMSE of 0.08 m³ m-3. These findings align with Hrisko (2020), who reported an RMSE of 0.044 m³ m-3 between inverse voltage readings from a capacitance probe and gravimetric measurements. Furthermore, this study results resonate with Ventura et al. (2010), who demonstrated that capacitive sensors can be used across various soil types and depths using the same calibration equation, with an RMSE range between 2.5% and 3.6%. In this study, testing analysis revealed a strong correlation between measured and calibrated values with R2 of 0.97, RMSD of 0.002, and NSE of 0.96 indicate that the calibration equation satisfactorily estimates soil moisture within the observed spectrum.
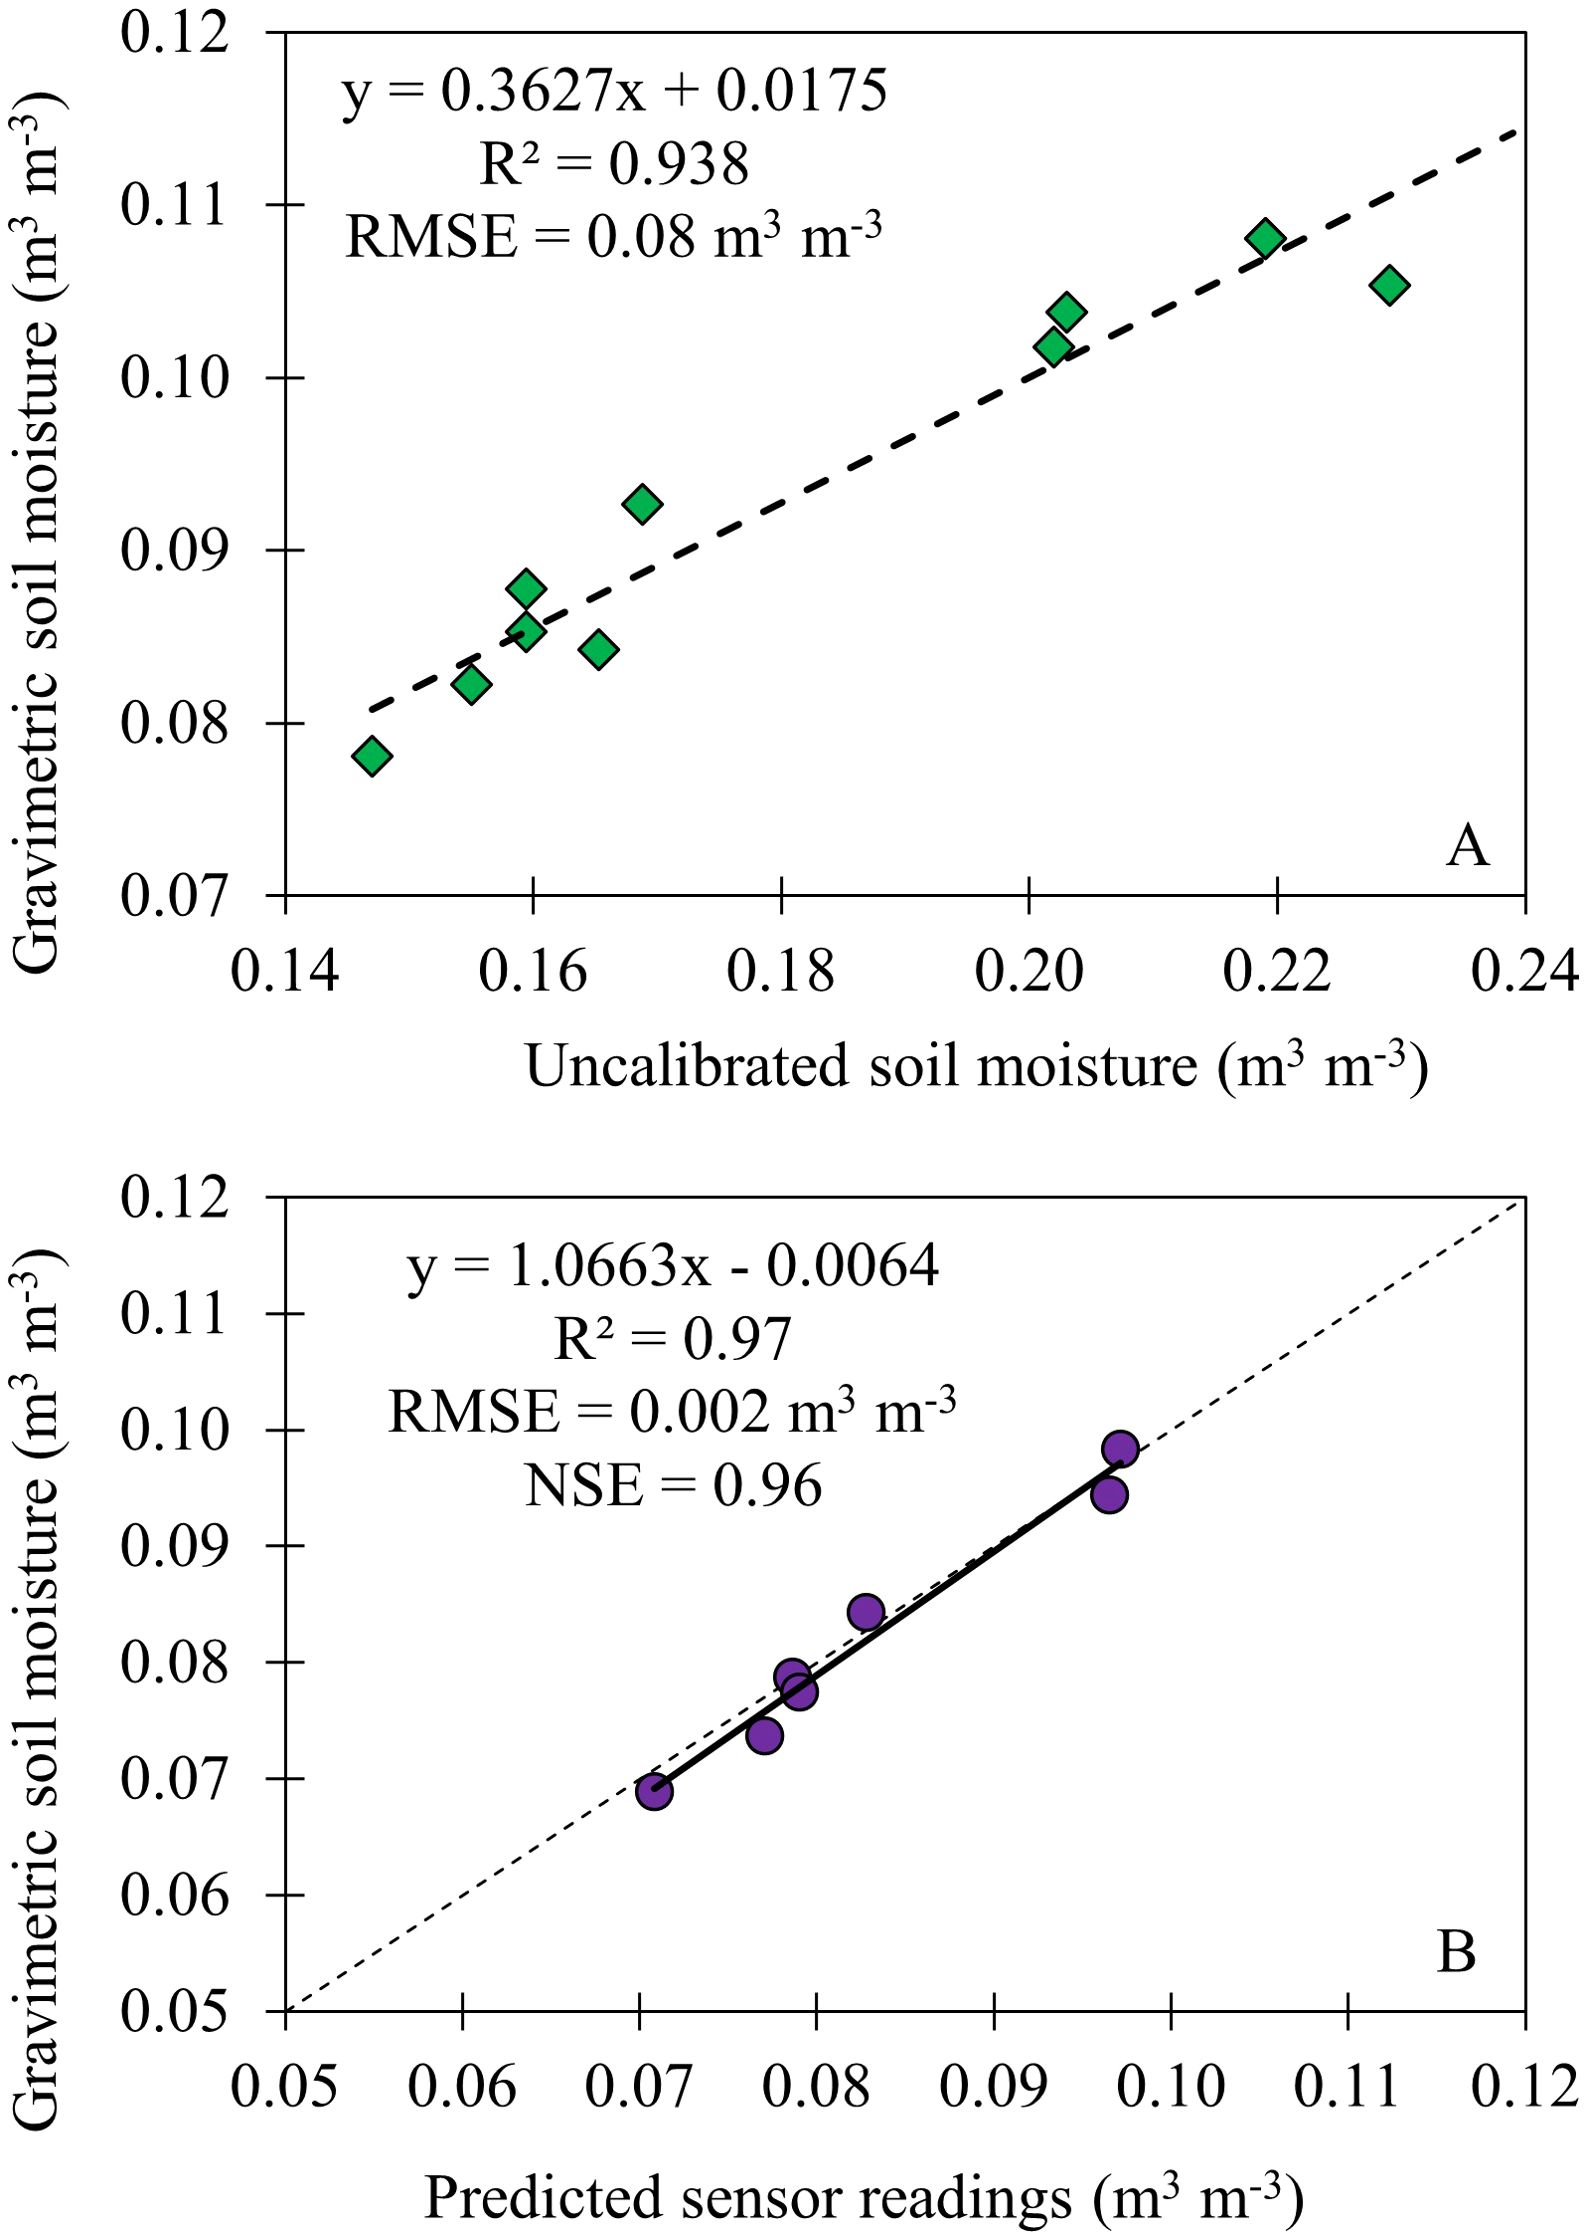
Figure 6. A comparison between (A) uncalibrated soil moisture sensor readings and gravimetric soil moisture content across dry and wet soil conditions (B) predicted soil moisture readings and gravimetric soil moisture content.
Soil water refers to the total amount of water temporarily held within the soil profile at a specific depth and time. The seasonal distribution of measured soil water present at 15 cm, 30 cm and 45 cm depth for each production system is presented in Figure 7. The dataset is available for each growing season, but for comparison purposes, the soil water data for 2021 maize growing season, 2022 peanut growing season and 2021/22 carrot growing season is presented in Figure 7. For these years, maize, peanut, and carrot crops were grown in both conventional and sod-based rotation at same time. As expected, the availability of soil moisture in the soil profile at different depths and cropping systems was affected by the magnitude amount of irrigation applied, precipitation, and management practices during different growing seasons. For example, the sudden increase in soil water levels in both conventional and sod-based rotation maize growing season in 2021 and carrot growing season in 2022 is attributed to the precipitation events occurring on 18 April 2021 (59 mm), 8 July 2021 (126 mm) and 9 March 2022 (175 mm). Sod-based rotation, particularly the BBCP, reports the highest average soil moisture content for maize (2021 growing season) at 18 mm and for peanuts (2022 growing season) at 14 mm, implying higher moisture retention capabilities when compared to conventional practices. Likewise, for BBCAP, there’s a notable average moisture content of 15 mm for maize (2021 growing season) and 14 mm for peanuts (2022 growing season). In contrast, conventional rotation (CP and CAP) showed lower moisture levels for both crops, with CP recording average of 14 mm for 2021 maize growing season and 13 mm for 2022 peanuts, and CAP showing a slight increase to an average 16 mm for 2021 maize growing season and 13 mm for 2022 peanuts. Wright et al. (2020) conducted a study on a four-year crop rotation cycle that included bahiagrass, peanuts, and cotton. The study reported moisture percentages from the bahiagrass rotation as 9.3%, 11.2%, and 20%, which corresponded to organic matter contents of 0.46, 0.75, and 1.68, respectively. Over the study period, the conservation of soil moisture remains notably consistent throughout the soil profile in sod-based rotation, attributed to the substantial benefits of perennial grass cover. The grass’s root system contributes to a uniform distribution and retention of moisture, curbing the swift downward movement seen in conventional tilling practices. Conversely, conventional rotation exhibited higher fluctuations in soil moisture. The inclusion of perennial grass fosters a stable supply of moisture, which is especially advantageous during sparse rainfall or in the intervals between irrigation. Such stability bolsters the crop’s resilience to drought conditions and helps to secure uniform crop yields (Wright et al., 2005; Bergtold and Sailus, 2020).
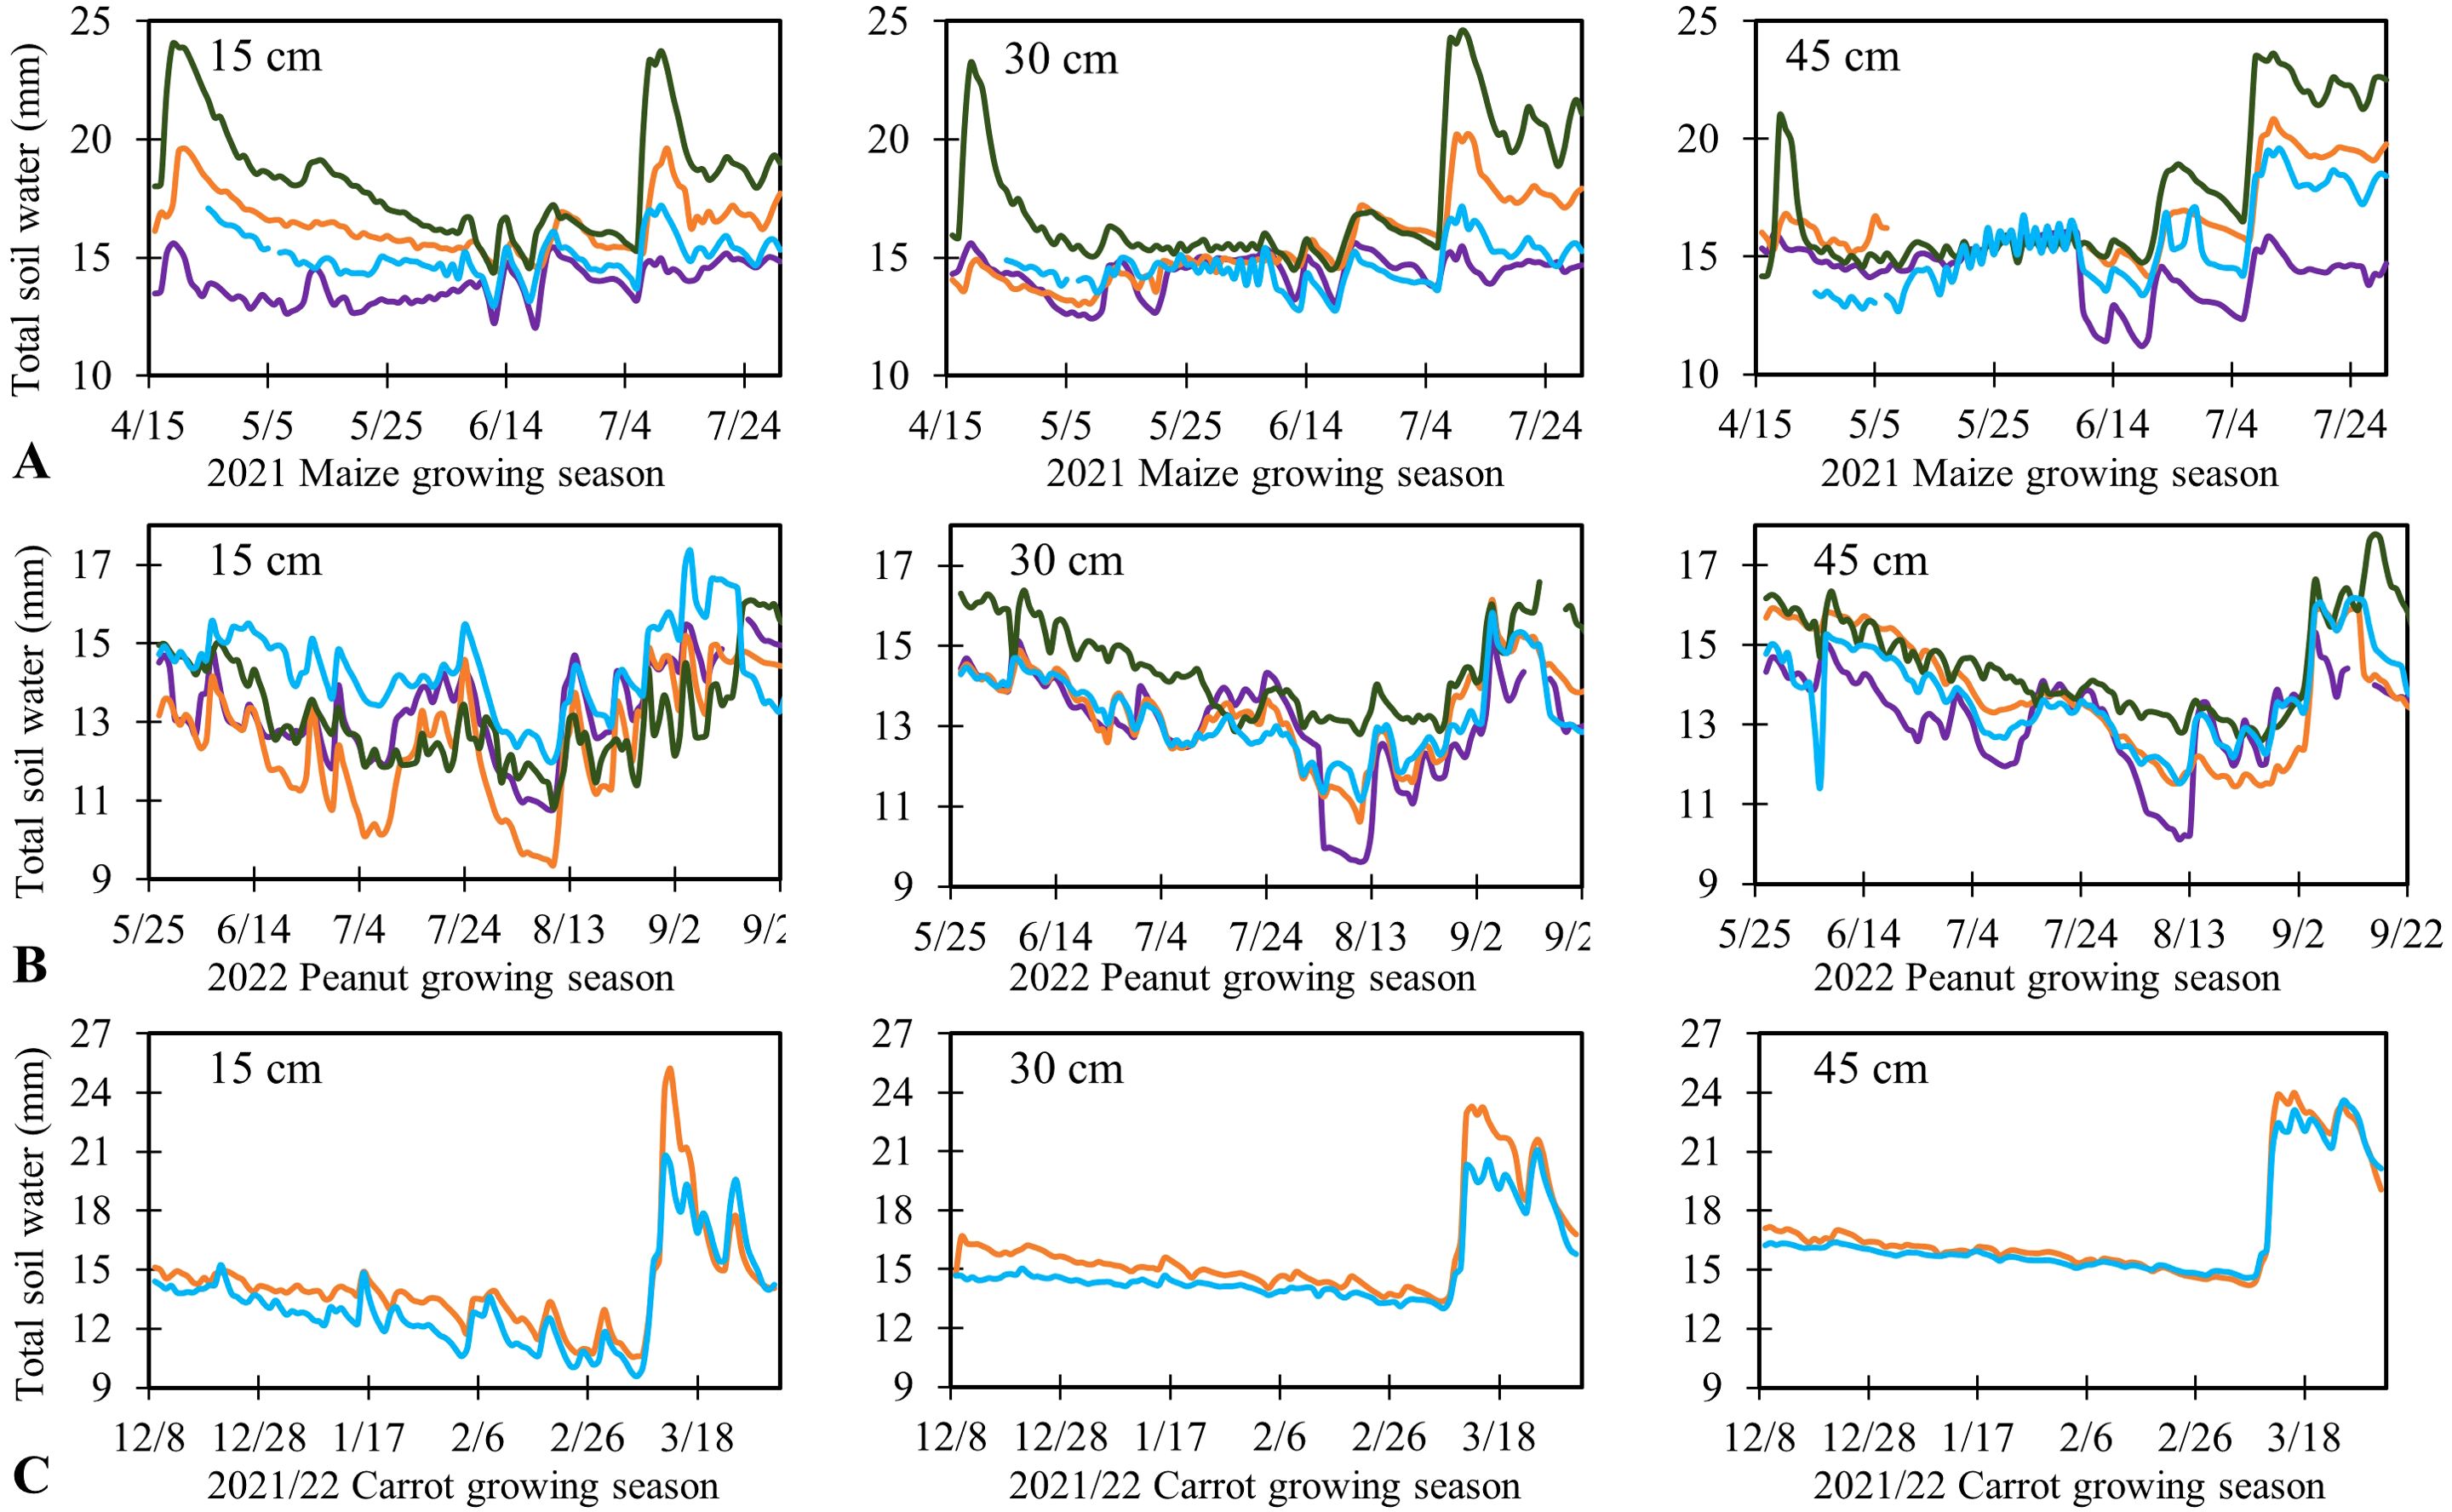
Figure 7. Total soil water (mm) across three different depths (15 cm, 30 cm and 45 cm). (A) maize in 2021 growing season, (B) peanut in 2022 growing season, (C) carrot in 2022 season.
The effect of rotational production on soil water balance components, i.e., ETc, ΔS, runoff, and DP along with WPC-ETc and WPC-TWU, is presented in Table 6. The distribution of cumulative ETc for maize, peanut and carrot, estimated using soil water balance approach is also illustrated in Figures 8A–C. Temporal trend of maize, peanut, and carrot ETc managed under conventional and sod-based rotation was similar. For maize, peanut, and carrot crops, ETc values were lower in the early season—March, May, and October, respectively—and at the end of the season—August, October, and March, respectively. This aligns with the peak growth period for maize, peanut and carrot in the research area, when water demand typically increases (Data not shown). ETc values were higher across all treatments in 2020 and 2021, driven by increased seasonal rainfall, particularly in the early season, which led to greater evaporative losses. For maize, the average ETc was 583 mm with a standard deviation (SD) of 57 mm for conventional rotation and 539 mm for sod-based rotation, a moderate decline of 8%. For peanuts, the average ETc was 482 mm (SD = 77 mm) for conventional rotation and 569 mm (SD = 16 mm) for sod-based rotation. For carrots, the ETc was nearly identical in both conventional and sod-based rotation. Carrot cumulative ETc ranged from 310 and 301 mm for 2021/22 CAP and BBCAP rotation, respectively. Across all rotation and years, the average deep percolation accounted for 31% (SD = 13%) of the total water input (rainfall + irrigation) and the average runoff was 5% (SD = 4%) of the total water applied. Hussain et al. (2019) reported drainage rates of 31 to 37% of mean annual rainfall during seven cropping years in southwestern Michigan. Rath et al. (2021) reported 0.77% runoff, 54% evapotranspiration (ET) and 46% deep percolation of the total water applied (rainfall and irrigation) using the calibrated Soil Conservation Service Curve Number (SCS-CN) model in Live Oak FL. These findings underscore the substantial amount of water that moves beyond the root zone (deep percolation) and the minor portion that results in surface runoff, particularly due to the sandy soil’s high infiltration rates, which stress the necessity for adopting efficient water management practices in agriculture to enhance sustainability (Linderman et al., 1976; Dourte et al., 2015).
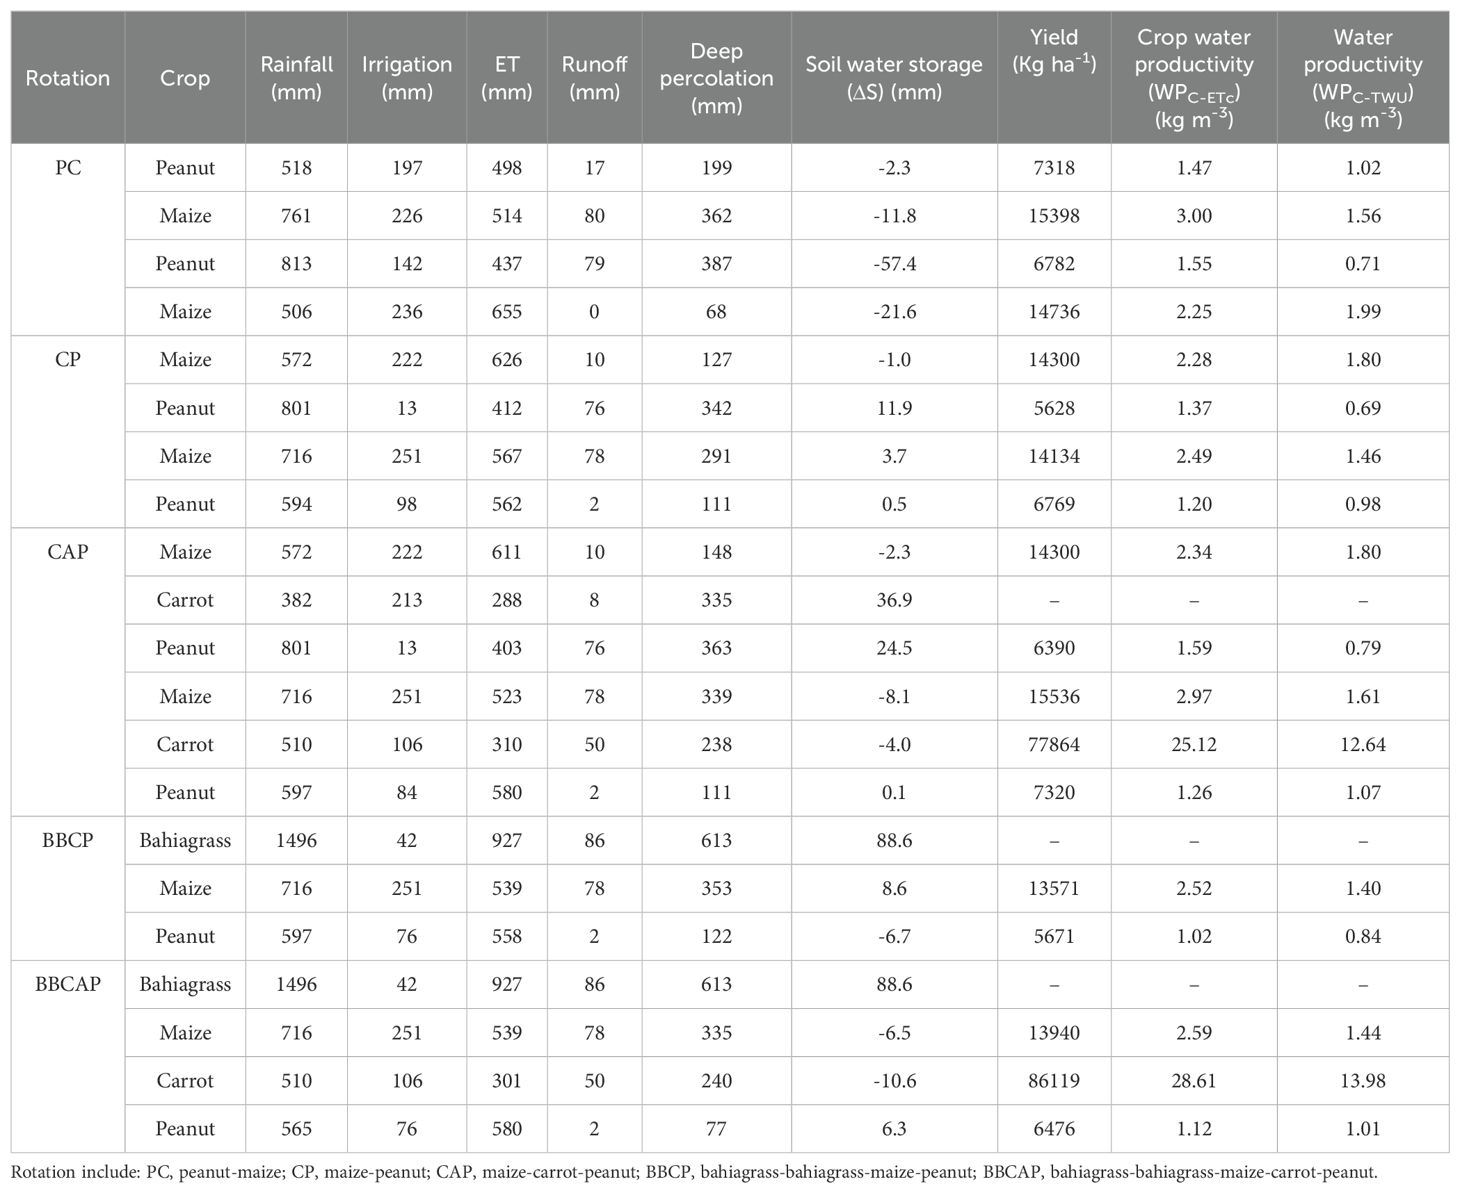
Table 6. Soil water balance in conventional vs. sod based rotational productions during 2019-2022 growing season.
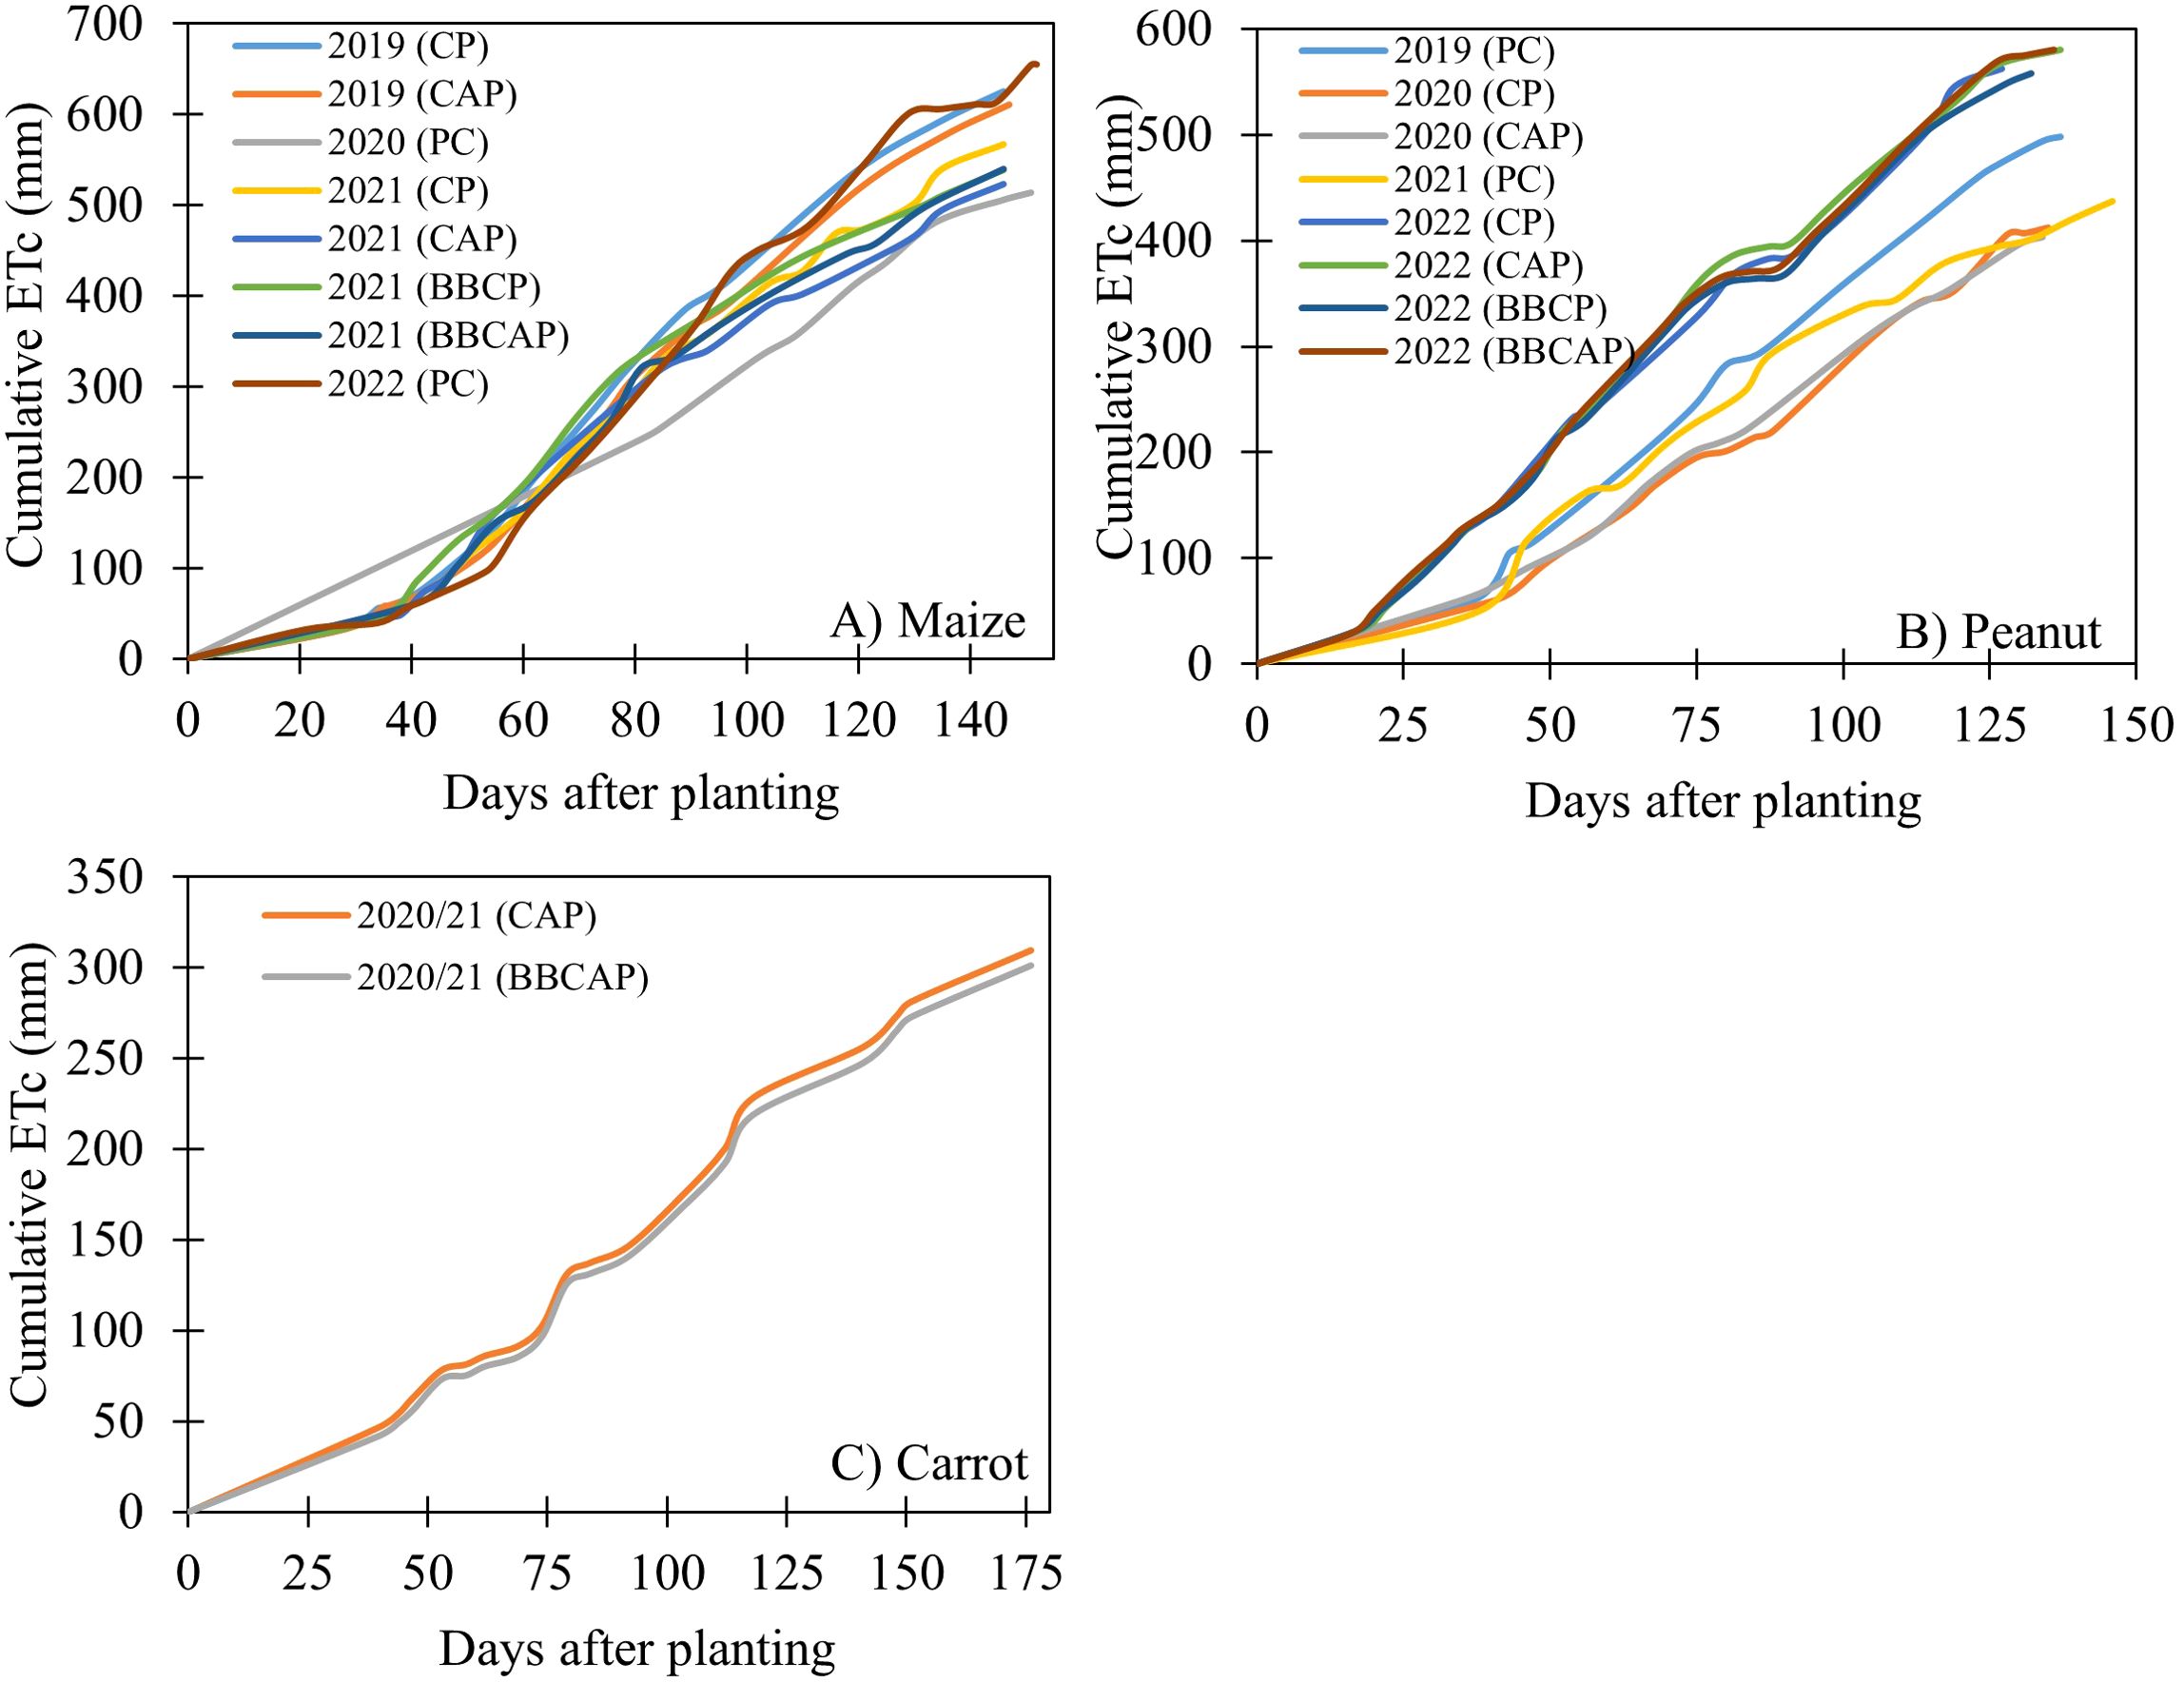
Figure 8. Cumulative crop ET (mm) estimated using soil water balance approach during 2019 to 2022 growing season. (A) maize cumulative ETc, (B) peanut cumulative ETc and (C) carrot cumulative ETc.
The impact of crop rotation systems on maize, peanuts, and carrots yields in 2021 and 2022 crop growing season is presented in Figure 9. In 2021, maize yields varied significantly between the conventional and sod-based rotations, with a p-value of 0.048 and a least significant difference of 1408 kg ha-1, indicating that conventional rotation may offer short-term benefits within a four-year cycle (Bullock, 1992; Porter et al., 2003). In contrast, yields from the 2022 peanut and carrot growing seasons showed no significant differences between rotations, with p-values of 0.057 and 0.08, respectively, suggesting that rotational effects could be crop-specific (Smith et al., 2008). Throughout the 2021 maize and 2022 peanut and carrot growing periods, irrigation and fertilizer inputs remained consistent across all rotations, emphasizing that yield differences were likely due to rotational practices rather than external inputs (Doucet et al., 1999).
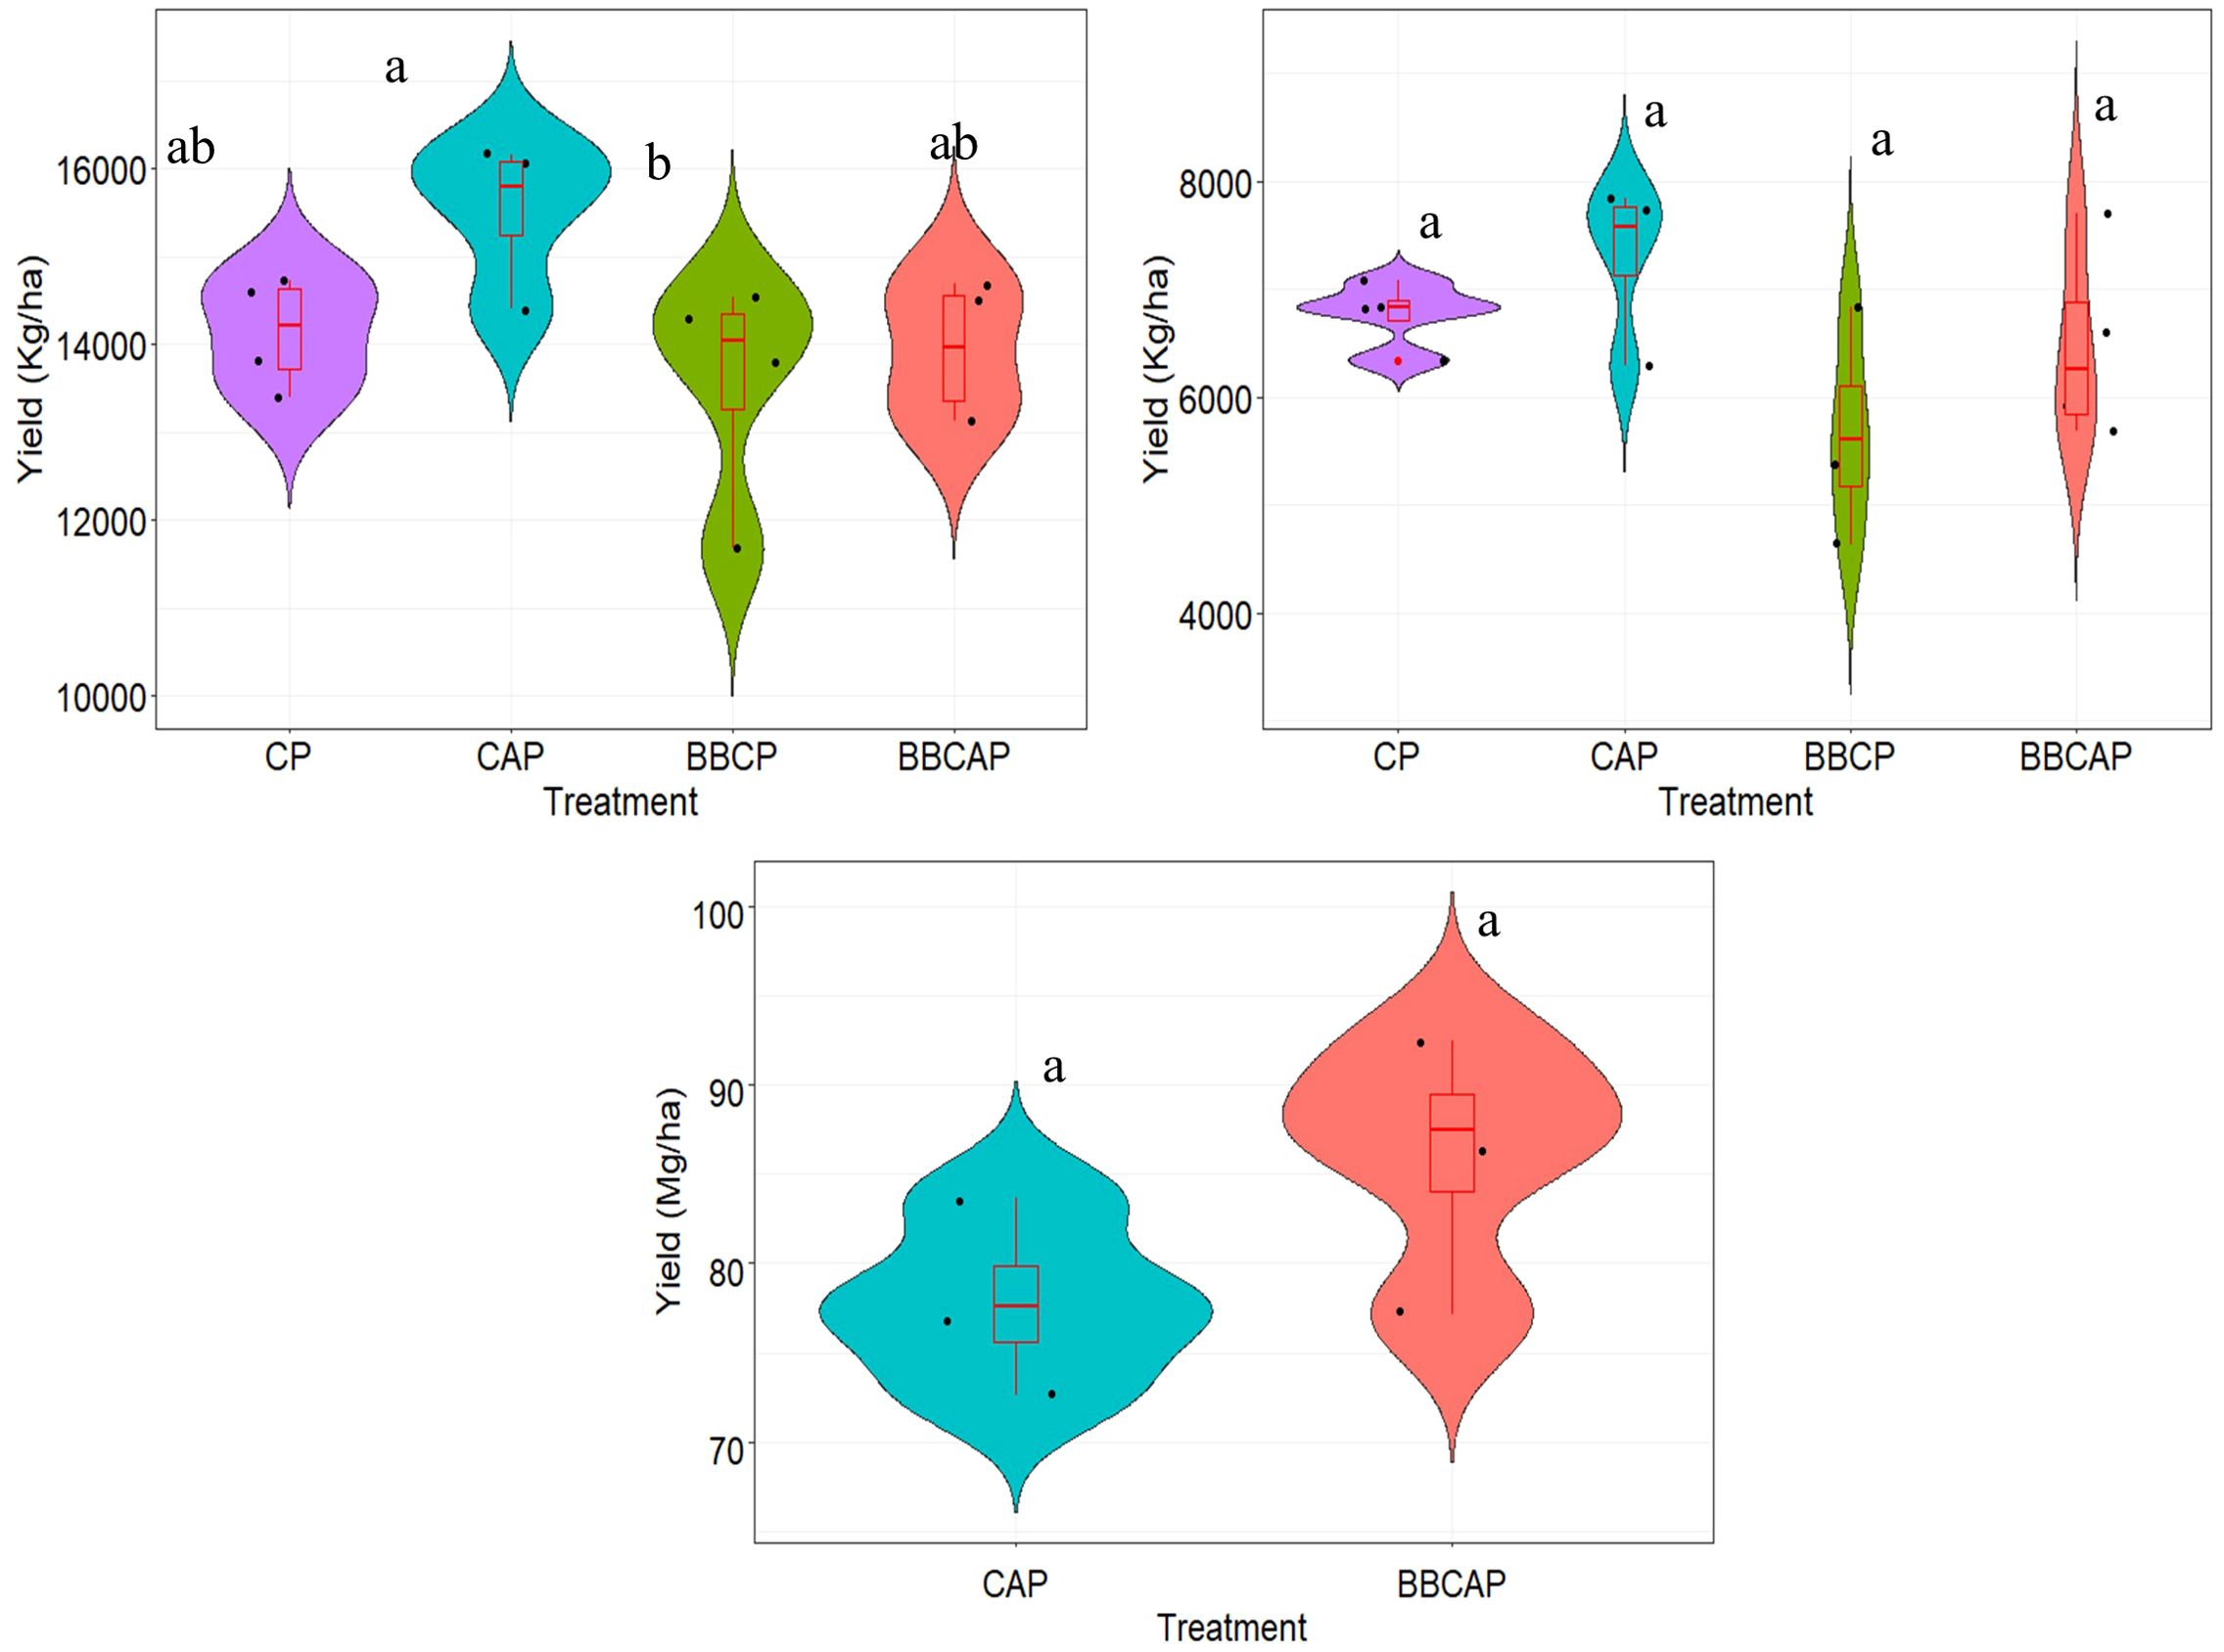
Figure 9. Harvest yield from conventional and sod-based rotation at NFREC, Live Oak, FL. (A) maize (kg ha-1) in 2021, (B) peanut (kg ha-1) in 2022, and (C) carrot (Mg ha-1) in 2022. Rotation include: CP, maize-peanut; CAP, maize-carrot-peanut; BBCP, bahiagrass-bahiagrass-maize-peanut; BBCAP, bahiagrass-bahiagrass-maize-carrot-peanut.
Throughout the study, average yields were documented for each crop type under both conventional and sod-based rotations. For maize, the average yield in conventional rotations (PC, CP, and CAP) was 14,879 kg ha-1 with a standard deviation (SD) of 809 kg ha-1, while yields in sod-based rotations (BBCP and BBCAP) averaged 13,755 kg ha-1 (SD: 1,010 kg ha-1). Peanut yields were 6,651 kg ha-1 (SD: 985 kg ha-1) under conventional rotation and 6,073 kg ha-1 (SD: 951 kg ha-1) in sod-based rotation. For carrots, the average yield was 77.9 Mg ha-1 (SD: 4.6 Mg ha-1) in conventional rotation (CAP) and 86.1 Mg ha-1 (SD: 6.5 Mg ha-1) in sod-based rotation (BBCAP). Findings indicate that adding a two-year bahiagrass phase to conventional rotations did not increase maize and peanut yields, suggesting a nuanced relationship between sod-based rotations and crop productivity. These results highlight the need for further research extending beyond the four-year study to better understand the long-term effects on sustainable farming (Porter et al., 2003).
This study also investigated the maize and peanut yield responses to water balance estimated ETc, total water application (irrigation + rainfall), WPC-ETc, and WPC-TWU (Table 6; Figure 10). To minimize yield variations due to soil physical and chemical property differences across the research area, average values for grain yield and ETc were calculated from various crop production systems. Numerous studies have demonstrated the linear relationship of crop water production functions, highlighting how crop water productivity varies under different environmental conditions. These studies suggest that the slopes of these functions offer a precise assessment of a plant’s water use efficiency compared to traditional irrigation-based WUE metrics (Stewart et al., 1975; Djaman and Irmak, 2012; Djaman et al., 2013). However, in this study a weak correlation between yields and ETc was observed, with R² values of 0.28 for maize and 0.09 for peanuts. This may be attributed to the irrigation scheduling for both crops in the study, which followed typical growers’ practices in the North Florida region, leading to the application of more water than necessary. The crop yield response to ETc defines the boundaries of crop yield under water constraints where the efficiency of seasonal transpiration is represented by the slope and the baseline ETc level (ETc losses before any seed yield is produced) is denoted by the x-intercept (Sinclair et al., 1984). A baseline ETc of approximately 300 mm for maize and approximately 100 mm for peanuts was observed. Likewise, the efficiency of seasonal transpiration was found to be 8.4 kg ha-1 mm-1 of ETc for maize and 6.3 kg ha-1 mm-1 of ETc for peanuts. Irmak and Sharma (2015) reported the use of genetically improved crop variety for poor correlation between yield and ETc. They reported a weak correlation between irrigated maize yield and ETc [pooled data R2 of 0.004 (range between 0.002 to 0.54)] and soybean yield and ETc [pooled data R2 of 0.0005 (range between 0.001 to 0.12)] in semi-arid to sub-humid climate. In this research, for maize, irrigation ranged from 222 to 251 mm with total water application between 747 to 988 mm, showing negligible correlations with total water applied (R² = 0.004) and water productivity (R² = 0.12), but a slightly stronger, yet still weak, relationship with WPC-ETc (R² = 0.42). Peanuts, receiving 13 to 197 mm of irrigation and total water application between 673 to 955 mm, exhibited a negative correlation with total water applied (R² = 0.015), a weak positive correlation with WPC-ETc (R² = 0.15), and a moderate positive correlation with water productivity (R² = 0.33), indicating a pronounced response to water efficiency improvements compared to maize. Excessive irrigation has been shown to reduce yields in other studies like Sharma and Rai (2022) for dry beans. Igbadun et al. (2007) conducted a study on irrigated maize and developed relationships between grain yield and seasonal evapotranspiration, as well as between grain yield and seasonal water applied. They combined data from two growing seasons to establish these relationships. Both were best modeled using a linear function. The relationship between grain yield and seasonal evapotranspiration was characterized by an R2 value of 0.72 and a slope of 15.4. Meanwhile, the relationship between grain yield and seasonal water applied demonstrated an R2 value of 0.86 and a slope of 7.4. These findings underline the nuanced impacts of water use and efficiency on crop yields, emphasizing the importance of tailored irrigation practices for different crops.
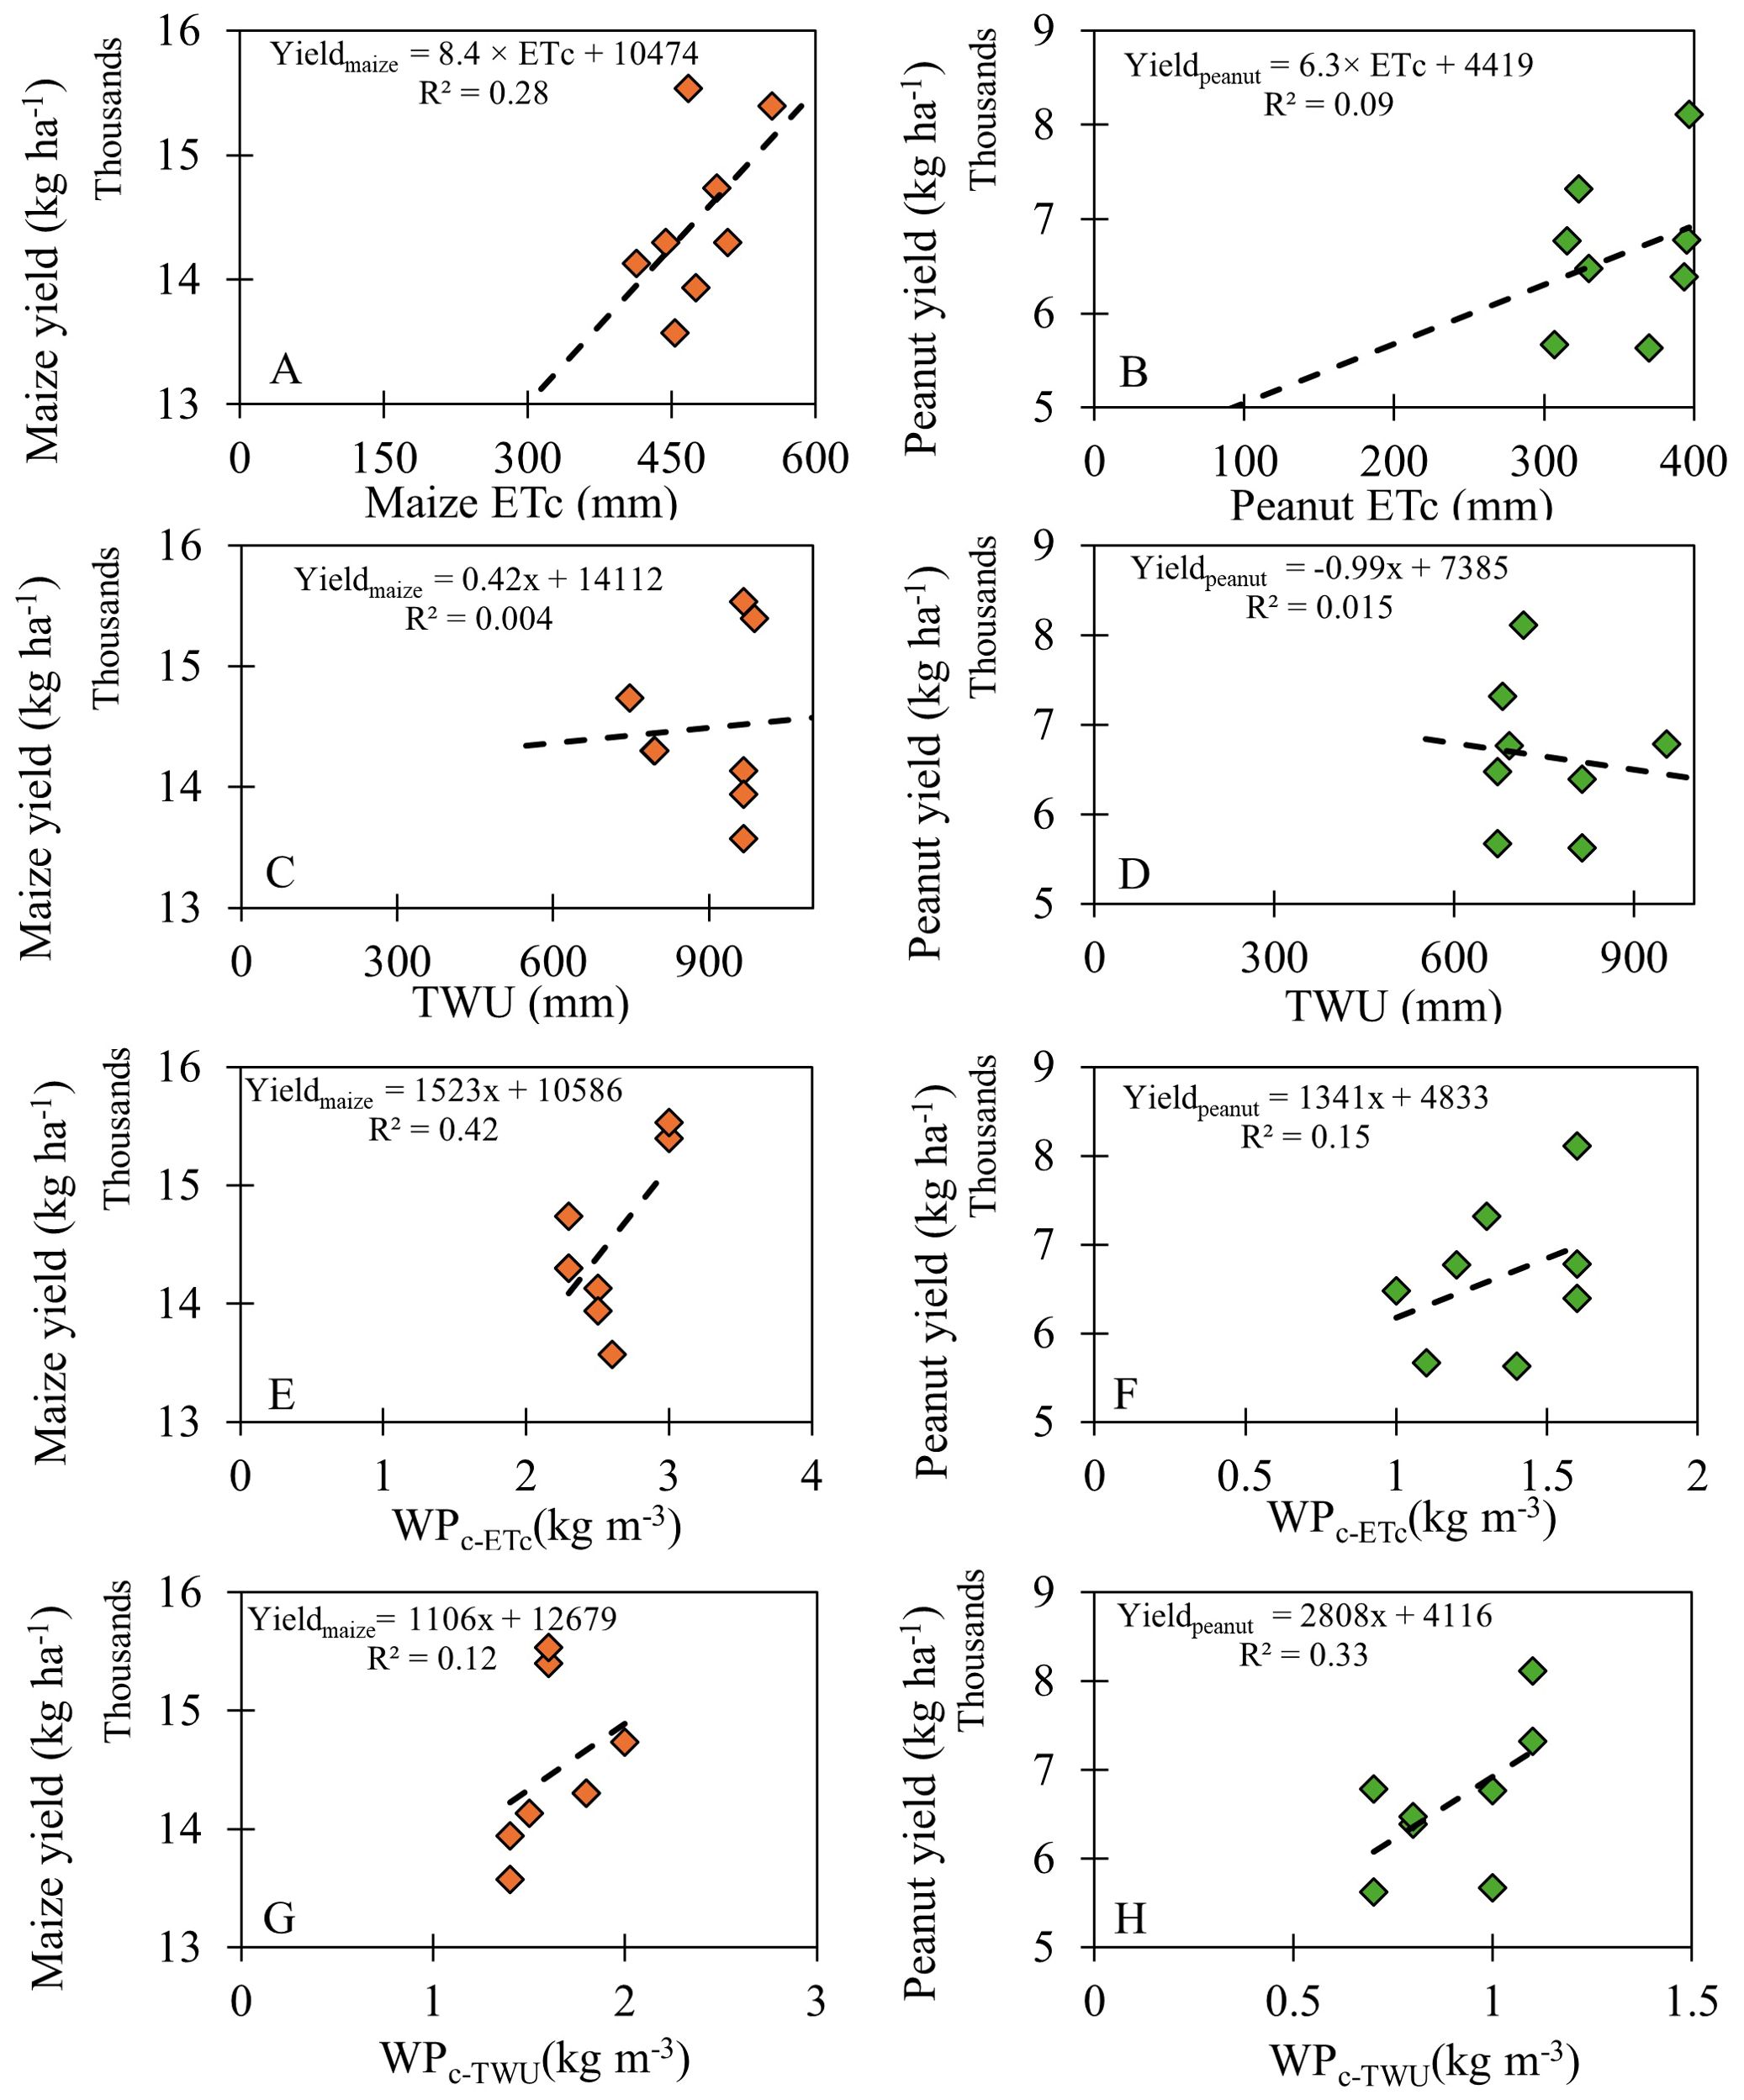
Figure 10. Maize and peanut yield response to crop ETc, total water applied (rainfall + irrigation), crop water productivity (WPc-ETc) and water productivity (WPc-TWU). (A) maize yield vs maize ETc, (B) peanut yield vs peanut ETc, (C) maize yield vs total water applied (TWU), (D) peanut yield vs total water applied (TWU), (E) maize yield vs crop water productivity (WPc-ETc), (F) peanut yield vs crop water productivity (WPc-ETc), (G) maize yield vs crop water productivity (WPc-TWU), (H) peanut yield vs crop water productivity (WPc-TWU).
The average WPC-ETc for maize was 2.6 kg m-3 in both rotation types, while water productivity (WPC-TWU) was 1.7 kg m-3 for conventional rotation and 1.4 kg m-3 for sod-based rotation (Table 6). Zamora Re et al. (2020) reported a WPC-ETc range of 2.96 to 3.33 kg m-3 and WPC-TWU between 1.19 to 1.67 kg m-3 across various irrigation and N fertility treatments on their study conducted from 2015-2017 in Live Oak, FL. Global WPC-ETc values for maize stands at 1.8 kg m-3 while Zwart and Bastiaanssen (2004) reported a WPC-ETc range of 1.1 – 2.7 kg m-3 for maize. Djaman et al. (2018) reported WPC-TWU for maize to be in the range of 1.3 to 1.9 kg m-3 and WPC-ETc between 2.0 and 2.3 kg m-3 under semiarid climate. Irmak and Sharma (2015) reported average irrigated maize WPC-ETc of 1.74 kg m-3 (SD = 0.37 kg m-3) (range of 1.33 kg m-3 to 2.07 kg m-3) and average irrigated soybean WPC-ETc of 0.64 kg m-3 (SD = 0.14 kg m-3) (range of 0.54 kg m-3 to 0.81 kg m-3) in semi-arid to sub humid climate. In this study, the WPC-ETc for peanuts was 1.4 kg m-3 for conventional rotation and 1.1 kg m-3 for sod-based, while WPC-TWU was 0.9 kg m-3 for both types of rotation. Notably, carrot WPC-ETc was 25.1 kg m-3 for conventional and 28.6 kg m-3 for sod-based rotation, and WPC-TWU was 12.6 kg m-3 for conventional and 14.0 kg m-3 for sod-based rotation (Table 6). Quezada et al. (2011) reported WPC-ETc for carrot in the range between 19.4 to 28.3 kg m-3 across different water treatments under drip irrigation.
Thus, sod-based rotations enhance soil physical properties, water-holding capacity, and beneficial root microbiomes, which collectively boost crop resilience to environmental fluctuations. Integrating sod crops like bahiagrass within crop rotations increases root biomass, promoting soil aggregation, reducing compaction, and fostering a diverse, stable microbial and root fungal community that strengthens soil structure and resists erosion (Zhang et al., 2022a). Additionally, the buildup of organic matter improves soil porosity and water retention, providing better moisture availability during dry spells and reducing irrigation needs. Enhanced infiltration also minimizes surface runoff and nutrient leaching, benefiting long-term soil productivity (Franzluebbers, 2002; Wright et al., 2012). To further understand these cumulative benefits, future studies should examine sod-based systems over extended periods, focusing on crop-specific rotation schedules, soil and water dynamics, nitrogen dynamics, cost-benefit evaluations of different BMPs and predictive modeling for diverse climate regions.
This study offers valuable insights into the comparative effects of conventional and sod-based crop rotation on soil properties, moisture dynamics, soil water balance components, and water use efficiency within the unique environmental context of the Suwannee River Basin in Northern Florida. Spanning from 2019 to 2022, the study accounted for one cycle of sod-based crop rotation and two cycles of conventional rotation, offering a comprehensive comparison of their impacts on soil and water dynamics. Four research years differed substantially in terms of precipitation amount and distribution as well as other climatic variables. In 2021, the study area experienced the highest rainfall out of the study period, totaling 1417 mm, followed by 1365 mm in 2020—both exceeding the historical annual average of 1243 mm. Conversely, 2019 and 2022 received the lowest totals of 1091 mm and 1130 mm, respectively. The results demonstrate that although both conventional and sod-based rotation share comparable bulk densities (1.4 g cm-3) and total porosities (48%), sod-based rotation are characterized by on an average, a 72% average increase in field capacity in top 15 cm of soil profile, a 31% enhancement in SOC in top 15 cm of soil profile, and 101% higher soil aggregate stability across soil profile (0 to 90 cm). These positive changes suggest improved soil structure and functionality, leading to better moisture retention. For example, sod-based rotation, particularly the BBCP, reports the highest average soil moisture content for maize (2021 growing season) at 18 mm and for peanuts (2022 growing season) at 14 mm, implying higher moisture retention capabilities when compared to conventional practices. The research emphasizes the importance of effective water management, particularly due to the significant volume of water subject to deep percolation. Given the basin’s sandy soils, which are prone to rapid water infiltration, this finding highlights the need for precise irrigation strategies to conserve water and prevent loss. The sod-based rotation showed potential for improved water retention and use efficiency without significantly compromising crop yield, suggesting it as a promising approach for enhancing agricultural sustainability in water-limited environments.
The datasets presented in this study can be found in online repositories. The names of the repository/repositories and accession number(s) can be found in the article/Supplementary Material.
BA: Formal analysis, Investigation, Methodology, Validation, Visualization, Writing – original draft. VS: Conceptualization, Formal analysis, Funding acquisition, Investigation, Methodology, Project administration, Resources, Supervision, Validation, Visualization, Writing – original draft, Writing – review & editing.
The author(s) declare financial support was received for the research, authorship, and/or publication of this article. The research group warmly thanks the Florida Department of Agriculture and Consumer Services – Office of Agricultural Water Policy for their significant support and funding, which were essential in facilitating this study (Award # AWD03374). We also want to convey our gratitude to the committed team at the North Florida Research and Extension Center for their support and teamwork throughout this project’s entirety.
The authors declare that the research was conducted in the absence of any commercial or financial relationships that could be construed as a potential conflict of interest.
The author(s) declare that no Generative AI was used in the creation of this manuscript.
All claims expressed in this article are solely those of the authors and do not necessarily represent those of their affiliated organizations, or those of the publisher, the editors and the reviewers. Any product that may be evaluated in this article, or claim that may be made by its manufacturer, is not guaranteed or endorsed by the publisher.
The Supplementary Material for this article can be found online at: https://www.frontiersin.org/articles/10.3389/fagro.2025.1552425/full#supplementary-material
Aguilar J., Gramig G. G., Hendrickson J. R., Archer D. W., Forcella F., Liebig M. A. (2015). Crop species diversity changes in the United States: 1978–2012. PloS One 10, e0136580. doi: 10.1371/journal.pone.0136580
Allen R. G., Pereira L. S., Raes D., Smith M. (1998). Crop evapotranspiration (FAO irrigation and drainage paper no. 56) (Rome, Italy: Food and Agriculture Organization of the United Nations).
Alva A. K., Paramasivam S., Fares A., Delgado J. A., Mattos D., Sajwan K. (2006). Nitrogen and irrigation management practices to improve nitrogen uptake efficiency and minimize leaching losses. J. Crop Improve. 15, 369–420. doi: 10.1300/J411v15n02_11
Bergtold J., Sailus M. (Eds.) (2020). Conservation tillage systems in the Southeast: Production, profitability, and stewardship. (USA: Sustainable Agriculture Research and Education (SARE) Program), Vol. 15.
Bouyoucos G. J. (1936). Directions for making mechanical analyses of soils by the hydrometer method. Soil Sci. 42, 225–230. doi: 10.1097/00010694-193609000-00007
Brenneman T. B., Sumner D. R., Baird R. E., Burton G. W., Minton N. A. (1995). Suppression of foliar and soilborne peanut diseases in bahiagrass rotations. Phytopathology 85, 948–952. doi: 10.1094/Phyto-85-948
Brooks R. H., Corey A. T. (1964). Hydraulic properties of porous media. Hydrological Paper 3 (Fort Collins, Colorado: Colorado State University), 22–27.
Bryant K. J., Benson V. W., Kiniry J. R., Williams J. R., Lacewell R. D. (1992). Simulating corn yield response to irrigation timings: Validation of the EPIC model. J. Product. Agric. 5, 237–242. doi: 10.2134/jpa1992.0237
Bullock D. G. (1992). Crop rotation. Crit. Rev. Plant Sci. 11, 309–326. doi: 10.1080/07352689209382349
Crookston R. K. (1995). The rotation effect in maize: A summary of fifteen years of field research in Minnesota (St. Paul, MN: Minnesota Agric. Exp. Stn. no. 22-180. Univ. of Minnesota).
Day P. R. (1965). “Particle fractionation and particle-size analysis,” in Methods of soil analysis, vol. 9 . Ed. Black C. A. (USA: American Society of Agronomy, Inc). doi: 10.2134/agronmonogr9.1.c43
Degens B. P., Sparling G. P., Abbott L. K. (1996). Increasing the length of hyphae in a sandy soil increases the amount of water-stable aggregates. Appl. Soil Ecol. 3, 149–159. doi: 10.1016/0929-1393(95)00074-7
Dickson D. W., Hewlett T. E. (1989). Effects of bahiagrass and nematicides on Meloidogyne arenaria on peanut. J. Nematol. 21, 671–676.
Djaman K., Irmak S. (2012). Soil water extraction patterns and crop, irrigation, and evapotranspiration water use efficiency of maize under full and limited irrigation and rainfed settings. Trans. ASABE 55, 1223–1238. doi: 10.13031/2013.42262
Djaman K., Irmak S., Rathje W. R., Martin D. L., Eisenhauer D. E. (2013). Maize evapotranspiration, yield production functions, biomass, grain yield, harvest index, and yield response factors under full and limited irrigation. Trans. ASABE 56, 273–293. doi: 10.13031/2013.42676
Djaman K., O’Neill M., Owen C. K., Smeal D., Koudahe K., West M., et al. (2018). Crop ET, irrigation water requirement and water productivity of maize from meteorological data under semiarid climate. Water 10, 405. doi: 10.3390/w10040405
Doucet C., Weaver S. E., Hamill A. S., Zhang J. H. (1999). Separating the effects of crop rotation from weed management on weed density and diversity. Weed Sci. 47, 729–735. doi: 10.1017/S0043174500091402
Dourte D., Bartel R. L., George S., Marois J. J., Wright D. L. (2015). A sod-based cropping system for irrigation reductions. Renewable Agric. Food Syst. 31, 485–494. doi: 10.1017/S1742170515000393
Elkins C. B., Haaland R. L., Hoveland C. S. (1977). “Grass roots as a tool for penetrating soil hardpans and increasing crop yields,” in Proceedings of the 34th southern pasture and forage crop improvement conference. (USA: US Agriculture Research Service), 21–26.
Evans R. G., Sadler E. J. (2008). Methods and technologies to improve efficiency of water use. Water Resour. Res. 44, W00E04. doi: 10.1029/2007WR006200
FAO (2008). Investing in sustainable agricultural intensification: The role of conservation agriculture - A framework for action (Rome, Italy: Food and Agriculture Organization of the United Nations).
FAWN (2022). Florida automated weather network: Data access. Available online at: https://fawn.ifas.ufl.edu/data/reports/ (Accessed January 10, 2022).
Fernández J. E., Alcon F., Diaz-Espejo A., Hernandez-Santana V., Cuevas M. V. (2020). Water use indicators and economic analysis for on-farm irrigation decision: A case study of a super high density olive tree orchard. Agric. Water Manage. 237, 106074. doi: 10.1016/j.agwat.2020.106074
Field T. G., Taylor R. E. (2002). Beef production management decisions (Upper Saddle River, NJ: Pearson Education. Prentice Hall).
Fraisse C. W., Paula-Moraes S. V. (2018). Degree-days: Growing, heating, and cooling: ABE381/AE428, rev. 4/2018. EDIS 2. doi: 10.32473/edis-ae428-2018
Franzluebbers A. J. (2002). Water infiltration and soil structure related to organic matter and its stratification with depth. Soil Tillage Res. 66, 197–205. doi: 10.1016/S0167-1987(02)00027-2
Franzluebbers A. J., Triplet G. B. Jr. (2006). Integrated crop-livestock systems to conserve water resources in the southeastern USA. in Schwartz R.C., Baumhardt R.L., Bell J.M.. (eds.) Proceedings of the 28th Annual Southern Conservation Systems Conference (pp. 2-12). Amarillo, Texas. June 26-28, 2006, USDA–ARS Conservation and Production Research Laboratory, Report No. 06-1, Bushland, TX. Available at: http://www.ag.auburn.edu/auxiliary/nsdl/scasc/ (Accessed 06/10/2024)
Gamble A. V., Howe J. A., Wood C. W., Watts D. B., van Santen E. (2014). Soil organic carbon dynamics in a sod-based rotation on coastal plain soils. Soil Sci. Soc. America J. 78, 1997–2008. doi: 10.2136/sssaj2014.05.0217
George S., Wright D. L., Marois J. J. (2013). Impact of grazing on soil properties and cotton yield in an integrated crop-livestock system. Soil Tillage Res. 132, 47–55. doi: 10.1016/j.still.2013.05.004
Google Google map of study area located in NFREC, Live Oak. Available online at: https://www.google.com/maps/search/NFREC,+LIVE+OAK/@30.3047217,-82.9072913,418m/data=!3m1!1e3?entry=ttu (Accessed March 10, 2024).
Gupta V. V. S. R., Yeates G. W. (1997). “Soil microfauna as bioindicators of soil quality,” in Biological indicators of soil quality. Ed. Pankhurst C. E. (Oxon, UK: CAB International), 201–233.
Ham L. K., Hatzell H. H. (1996). Analysis of nutrients in the surface waters of the Georgia-Florida Coastal Plain Study Unit 1970-91 (U.S. Geological Survey Water-Resources Investigations Report 96-4037 (U.S: Geological Survey), 67.
Hochmuth R. C., Burani-Arouca M., Barrett C. E. (2021). Yield and quality of carrot cultivars with eight nitrogen rates and best management practices. HortScience 56, 1199–1205. doi: 10.21273/HORTSCI15983-21
Howell T. A., Yazar A., Schneider A. D., Dusek D. A., Copeland K. S. (1995). Yield and water use efficiency of corn in response to LEPA irrigation. Trans. ASAE 38, 1737–1747. doi: 10.13031/2013.28001
Hrisko J. (2020). Capacitive soil moisture sensor theory, calibration, and testing. (New York, USA: Maker Portal LLC). doi: 10.13140/RG.2.2.36214.83522
Hussain M. Z., Bhardwaj A. K., Basso B., Robertson G. P., Hamilton S. K. (2019). Nitrate leaching from continuous maize, perennial grasses, and poplar in the US Midwest. J. Environ. Qual. 48, 1849–1855. doi: 10.2134/jeq2019.04.0156
Igbadun H. E., Tarimo A. K. P. R., Salim B. A., Mahoo H. F. (2007). Evaluation of selected crop water production functions for an irrigated maize crop. Agric. Water Manage. 94, 1–10. doi: 10.1016/j.agwat.2007.07.006
Iheshiulo E. M. A., Larney F. J., Hernandez-Ramirez G., St. Luce M., Chau H. W., Liu K. (2024a). Soil organic matter and aggregate stability dynamics under major no-till crop rotations on the Canadian prairies. Geoderma 442, 116777. doi: 10.1016/j.geoderma.2024.116777
Iheshiulo E. M.-A., Larney F. J., Hernandez-Ramirez G., St. Luce M., Chau H. W., Liu K. (2024b). Crop rotations influence soil hydraulic and physical quality under no-till on the Canadian prairies. Agricult. Ecosyst. Environ. 361, 108820. doi: 10.1016/j.agee.2023.108820
Irmak S., Sharma V. (2015). Large-scale and long-term trends and magnitudes in irrigated and rainfed maize and soybean water productivity: Grain yield and evapotranspiration frequency, crop water use efficiency, and production functions. Trans. ASABE 58, 103–120. doi: 10.13031/trans.58.10784
Jemison J. M., Kersbergen R., Majewski C., Brinton W. (2019). Soil health of recently converted no-till corn fields in Maine. Commun. Soil Sci. Plant Anal. 50, 2384–2396. doi: 10.1080/00103624.2019.1659302
Johnson A. W., Minton N. A., Brenneman T. B., Burton G. W., Culbreath A. K., Gascho G. J., et al. (1999). Bahiagrass, corn, cotton rotations, and pesticides for managing nematodes, diseases, and insects on peanut. J. Nematol. 31, 191–200.
Katsvairo T. W., Wright D. L., Marois J. J., Hartzog D. L., Balkcom K. B., Wiatrak P. J., et al. (2007a). Performance of peanut and cotton in a bahiagrass cropping system. Agron. J. 99, 1245–1251. doi: 10.2134/agronj2006.0346
Katsvairo T. W., Wright D. L., Marois J. J., Hartzog D. L., Rich J. R., Wiatrak P. J. (2006). Sod-livestock integration into the peanut-cotton rotation: A systems farming approach. Agron. J. 98, 1156–1171. doi: 10.2134/agronj2005.0088
Katsvairo T. W., Wright D. L., Marois J. J., Hartzog D. L., Rich J. R., Wiatrak P. J. (2007b). Cotton roots, earthworms, and infiltration characteristics in sod/livestock peanut/cotton cropping systems. Agron. J. 99, 390–398. doi: 10.2134/agronj2005.0330
Katz B. G., Griffin D. W., McMahon P. B., Harden H. S., Wade E., Hicks R. W., et al. (2010). Fate of effluent-borne contaminants beneath septic tank drainfields overlying a karst aquifer. J. Environ. Qual. 39, 1181–1195. doi: 10.2134/jeq2009.0244
Latimer G. W. Jr. (2023). “Official methods of analysis: 22nd edition,” in Official methods of analysis of AOAC INTERNATIONAL, 22nd ed. Ed. Latimer G. W. Jr. (New York, USA: AOAC Publications). doi: 10.1093/9780197610145.002.001
Lemke R. L., VandenBygaart A. J., Campbell C. A., Lafond G. P., McConkey B. G., Grant B. (2012). Long-term effects of crop rotations and fertilization on soil C and N in a thin Black Chernozem in southeastern Saskatchewan. Can. J. Soil Sci. 92, 449–461. doi: 10.4141/CJSS2010-047
Linderman C. L., Mielke L. N., Schuman G. E. (1976). Deep percolation in a furrow-irrigated sandy soil. Trans. ASABE 19, 250–253. doi: 10.13031/2013.36006
Long F. L., Elkins C. B. (1983). “The influence of roots on nutrient leaching and uptake,” in Special Publication (No. 23) (Georgia, USA: College of Agriculture Experiment Stations, University of Georgia), 335–352.
Marella R. L. (2020). Water withdrawals, uses, and trends in Florida 2015. U.S. Geological Survey Scientific Investigations Report 2019-5147. (Reston, Virginia, USA: U.S. Geological Survey), 52. doi: 10.3133/sir20195147
Martin H. (2003). Transition to organic farming (Ontario, Canada: Ontario Ministry of Food, Agriculture and Rural Affairs (OMAFRA)). Available at: http://www.omafra.gov.on.ca/english/crops/organic/transition.htm (Accessed November 01, 2024).
Minasny B., McBratney A. B. (2018). Limited effect of organic matter on soil available water capacity. Eur. J. Soil Sci. 69, 39–47. doi: 10.1111/ejss.12475
Nicholls C. I., Altieri M. A. (2004). “Designing species-rich, pest-suppressive agroecosystems through habitat management,” in Agroecosystems analysis, vol. 43 . Eds. Rickerl D., Francis C. (ASA, Madison, WI), 49–61.
NRCS (1985). Urban hydrology for small watersheds, Technical Release 55 (TR-55) (United States Department of Agriculture: Natural Resources Conservation Service).
NRCS (2024). Web soil survey. Available online at: https://websoilsurvey.nrcs.usda.gov/app/WebSoilSurvey.aspx (Accessed February 10, 2024).
Porter P. M., Huggins D. R., Perillo C. A., Quiring S. R., Crookston R. K. (2003). Organic and other management strategies with two- and four-year crop rotations in Minnesota. Agron. J. 95, 233–244. doi: 10.2134/agronj2003.2330
Quezada C., Fischer S., Campos J., Ardiles D. (2011). Water requirements and water use efficiency of carrot under drip irrigation in a Haploxerand soil. J. Soil Sci. Plant Nutr. 11, 16–28. doi: 10.4067/S0718-95162011000100002
Rath S., Zamora-Re M., Graham W., Dukes M. D., Kaplan D. (2021). Quantifying nitrate leaching to groundwater from a corn-peanut rotation under a variety of irrigation and nutrient management practices in the Suwannee River Basin, Florida. Agric. Water Manage. 246, 106634. doi: 10.1016/j.agwat.2020.106634
Rudnick D. R., Djaman K., Irmak S. (2015). Performance analysis of capacitance and electrical resistance-type soil moisture sensors in a silt loam soil. Trans. ASABE 58, 649–665. doi: 10.13031/trans.58.10761
Santos P. F., Whitford W. G. (1981). The effects of microarthropods in litter decomposition in a Chihuahuan desert ecosystem. Ecology 62, 654–669. doi: 10.2307/1937733
Sassenrath G. F., Hanson J. D., Hendrickson J. R., Archer D. W., Halloran J. M., Steiner J. J. (2009). “Principles of dynamic integrated agricultural systems: Lessons learned from an examination of southeast production systems,” in Agroecosystem management for ecological, social, and economic sustainability (Advances in Agroecology Series). (Boca Raton, Florida, USA: Taylor and Francis/CRC Press), 259–269.
Scanlon B. R., Fakhreddine S., Rateb A., de Graaf I., Famiglietti J., Gleeson T., et al. (2023). Global water resources and the role of groundwater in a resilient water future. Nat. Rev. Earth Environ. 4, 87–101. doi: 10.1038/s43017-022-00378-6
Schaap M. G., Leij F. J., van Genuchten M. T. (2001). ROSETTA: A computer program for estimating soil hydraulic parameters with hierarchical pedotransfer functions. J. Hydrol. 251, 163–176. doi: 10.1016/S0022-1694(01)00466-8
Sexton B. T., Moncrief J. F., Rosen C. J., Gupta S. C., Cheng H. H. (1996). Optimizing nitrogen and irrigation inputs for corn based on nitrate leaching and yield on a coarse-textured soil. J. Environ. Qual. 25, 982–992. doi: 10.2134/jeq1996.00472425002500050009x
Sharma V., Bhambota S. (2022). “Strategies to improve crop-water productivity,” in Food, energy, and water nexus. Eds. Ray C., Muddu S., Sharma S. (Springer, Cham), 1–20. doi: 10.1007/978-3-030-85728-8_8
Sharma V., Rai A. (2022). Dry bean (Phaseolus vulgaris L.) crop water production functions and yield response factors in an arid to semi-arid climate. J. ASABE 65, 51–65. doi: 10.13031/ja.14582
Sinclair T. R., Tanner C. B., Bennett J. M. (1984). Water-use efficiency in crop production. BioScience 34, 36–40. doi: 10.2307/1309424
Smith R. G., Gross K. L., Robertson G. P. (2008). Effects of crop diversity on agroecosystem function: Crop yield response. Ecosystems 11, 355–366. doi: 10.1007/s10021-008-9124-5
Stewart J. I., Misra R. D., Pruitt W. O., Hagan R. M. (1975). Irrigating corn and grain sorghum with a deficient water supply. Trans. ASAE 18, 270–280. doi: 10.13031/2013.36570
Sudini H., Liles M. R., Arias C. R., Bowen K. L., Huettel R. N. (2011). Exploring soil bacterial communities in different peanut-cropping sequences using multiple molecular approaches. Phytopathology 101, 819–827. doi: 10.1094/PHYTO-11-10-0310
Tanaka D. L., Krupinsky J. M., Liebig M. A., Merrill S. D., Ries R. E., Hendrickson J. R., et al. (2002). Dynamic cropping systems: An adaptable approach to crop production in the Great Plains. Agron. J. 94, 957–961. doi: 10.2134/agronj2002.0957
Thompson R. (2023). Editorial note on terms for soil analyses, nutrient content of fertilizers and nitrogen use efficiency. Agric. Water Manage. 289, 108547. doi: 10.1016/j.agwat.2023.108547
USDA (2022). State agriculture overview. Available online at: https://www.nass.usda.gov/Quick_Stats/Ag_Overview/stateOverview.php?state=FLORIDA (Accessed 2 March 2023).
Vadez V., Pilloni R., Grondin A., Hajjarpoor A., Belhouchette H., Brouziyne Y., et al. (2023). Water use efficiency across scales: From genes to landscapes. J. Exp. Bot. 74, 4770–4788. doi: 10.1093/jxb/erad052
Van Genuchten M. T. (1980). A closed-form equation for predicting the hydraulic conductivity of unsaturated soils. Soil Sci. Soc. Am. J. 44 (5), 892–898. doi: 10.2136/sssaj1980.03615995004400050002x
Van Genuchten M., Leij F. J., Yates S. R. (1991). The RETC code for quantifying the hydraulic functions of unsaturated soils, Version 1.0 (EPA Report No. 600/2-91/065) (Riverside, California, USA: U.S. Salinity Laboratory, USDA, ARS).
Ventura F., Facini O., Piana S., Rossi Pisa P. (2010). Soil moisture measurements: Comparison of instrumentation performances. J. Irrig. Drain. Eng. 136, 81–89. doi: 10.1061/(ASCE)0733-9437(2010)136:2(81
Viets F. G. (1962). Fertilizers and the efficient use of water. Adv. Agron. 14, 223–264. doi: 10.1016/S0065-2113(08)60439-3
West T. O., Post W. M. (2002). Soil organic carbon sequestration rates by tillage and crop rotation: A global data analysis. Soil Sci. Soc. America J. 66, 1930–1946. doi: 10.2136/sssaj2002.1930
Wick A., Berti M., Lawley Y., Liebig M. (2017). “Integration of annual and perennial cover crops for improving soil health,” in Soil health and intensification of agroecosystems (Cambridge, Massachusetts, USA: Elsevier Inc), 127–150. doi: 10.1016/B978-0-12-805317-1.00006-3
Wright D. L., Katsvairo T. W., Marois J. J., Wiatrak P. J. (2004). Introducing bahiagrass in peanut/cotton cropping systems: Effects on soil physical characteristics. ASA. Agron. Abstr. 2004, 330.
Wright D., Marois J., Anguelov G., Mackowiak C. (2010). Enhanced Crop, Soil, Economic, and Environmental Benefits with Sod Based Rotations. [Abstract]. 2010 Annual Meeting (Oct. 31 - Nov. 3, 2010), Long Beach, CA. Available online at: https://scisoc.confex.com/scisoc/2010am/meetingapp.cgi/Paper/57428
Wright D., Marois J., Fraisse C., Dourte D. (2012). Agricultural management options for climate variability and change: Sod-based rotation: AE492/AE492, 8/2012 (2012(8: EDIS). doi: 10.32473/edis-ae492-2012
Wright D., Marois J., Katsvairo T., Wiatrak P., Rich J. (2005). Sod-based rotations - the next step after conservation tillage. in Busscher W., Frederick J., Robinson S. (Eds.), Proceedings of 27th Southern Conservation Tillage Systems Conference, Florence, S. Carolina. June 27–29, 2005, Clemson University Pee Dee Research and Education Center, Florence, SC. (pp. 5-12). Available at: http://www.ag.auburn.edu/auxiliary/nsdl/scasc/ (Accessed on 06/10/2024)
Wright D. L., Marois J. J., Mackowiak C. L., Zhao D., George S., Lamb C. (2020). “Sod, grazing and row-crop rotation: Enhancing conservation tillage,” in Conservation tillage systems in the Southeast: Production, profitability and stewardship (SARE handbook series 15. Eds. Bergtold J., Sailus M. (USA: Sustainable Agriculture Research and Education (SARE) program), 103–118.
Wright D., Small I., Mackowiak C., Grabau Z., Devkota P., Paula-Moraes S. (2022). Field corn production guide: SS-AGR-85/AG202, rev. 8/2022. (Florida, USA: EDIS). doi: 10.32473/edis-ag202-2022
Yang T., Siddique K. H. M., Liu K. (2020). Cropping systems in agriculture and their impact on soil health—A review. Global Ecol. Conserv. 23, e01118. doi: 10.1016/j.gecco.2020.e01118
Zamora Re M. I., Rath S., Dukes M. D., Graham W. (2020). Water and nitrogen budget dynamics for a maize-peanut rotation in Florida. Trans. ASABE 63, 2003–2020. doi: 10.13031/trans.13916
Zhang K., Maltais-Landry G., George S., Grabau Z. J., Small I. M., Wright D., et al. (2022a). Long-term sod-based rotation promotes beneficial root microbiomes and increases crop productivity. Biol. Fertil. Soils 58, 403–419. doi: 10.1007/s00374-022-01626-z
Zhang K., Schumacher L. A., Maltais-Landry G., Grabau Z. J., George S., Wright D. L., et al. (2022b). Integrating perennial bahiagrass into the conventional rotation of cotton and peanut enhances interactions between microbial and nematode communities. Appl. Soil Ecol. 170, 104254. doi: 10.1016/j.apsoil.2021.104254
Zhao D., Wright D. L., Marois J. J., Mackowiak C. L., Katsvairo T. (2008). Yield and water use efficiency of cotton and peanut in conventional and sod-based cropping systems. in Endale D. M. (ed.) Proceedings of 30th Southern Conservation Agricultural Systems Conference and 8th Annual Georgia Conservation Production System Training Conference (pp. 53-60). Tifton, Georgia, July 29-31, 2008. Available at: http://www.ag.auburn.edu/auxiliary/nsdl/scasc/. (Accessed on 06/10/2024)
Keywords: evapotranspiration, soil moisture, soil water balance, soil water retention, crop water productivity
Citation: Acharya B and Sharma V (2025) Comparative analysis of soil and water dynamics in conventional and sod-based crop rotation in Florida. Front. Agron. 7:1552425. doi: 10.3389/fagro.2025.1552425
Received: 28 December 2024; Accepted: 31 January 2025;
Published: 21 February 2025.
Edited by:
Desouza Blaise, Central Institute for Cotton Research (ICAR), IndiaReviewed by:
Boris Boincean, Selectia Research Institute of Field Crops, MoldovaCopyright © 2025 Acharya and Sharma. This is an open-access article distributed under the terms of the Creative Commons Attribution License (CC BY). The use, distribution or reproduction in other forums is permitted, provided the original author(s) and the copyright owner(s) are credited and that the original publication in this journal is cited, in accordance with accepted academic practice. No use, distribution or reproduction is permitted which does not comply with these terms.
*Correspondence: Vivek Sharma, dnNoYXJtYTFAdWZsLmVkdQ==
Disclaimer: All claims expressed in this article are solely those of the authors and do not necessarily represent those of their affiliated organizations, or those of the publisher, the editors and the reviewers. Any product that may be evaluated in this article or claim that may be made by its manufacturer is not guaranteed or endorsed by the publisher.
Research integrity at Frontiers
Learn more about the work of our research integrity team to safeguard the quality of each article we publish.