 Ramesh Arvind Naagarajan
 Kiran Kumar Sathyanarayanan
 Nadja Bauer2
 Stefan Streif
94% of researchers rate our articles as excellent or good
Learn more about the work of our research integrity team to safeguard the quality of each article we publish.
Find out more
ORIGINAL RESEARCH article
Front. Agron. , 25 March 2025
Sec. Climate-Smart Agronomy
Volume 7 - 2025 | https://doi.org/10.3389/fagro.2025.1536998
This article is part of the Research Topic Advancing Agronomy: Robotics and AI in Crop Management and Sustainability View all articles
The growing need for energy-efficient and sustainable crop production has made advanced control systems, such as Model Predictive Control (MPC), essential in greenhouse farming. MPC is an optimization-based control strategy that uses mathematical models and weather forecast data to regulate greenhouse climates effectively. This technique generates time-varying climate reference trajectories, which are sent to the local process computer to control the corresponding climate parameter or equipment. While MPC and artificial intelligence-based techniques are becoming more common in advanced agricultural setups, their widespread adoption remains limited. Potential reasons are the lack of transparency and the understandability of the control algorithms. This study introduces a language-based support system to improve the usability of advanced control strategies like MPC. The system segments time-series data using the change point detection method to identify significant changes. The identified trend information is converted into detailed textual descriptions using the natural language generation technique. These descriptions are refined into user-friendly summaries with the assistance of a pretrained large language model. The results demonstrate that this support system can improve the accessibility and usability of advanced control strategies like MPC, making them more practical for greenhouse growers.
The global population, which stood at 7 billion in 2010, is projected to increase to an estimated 9.8 billion by 2050, leading to a significant 50% rise in food demand (Searchinger et al., 2014). However, the necessary boosting of food production encounters substantial obstacles, as the expansion of agricultural land remains constrained by rapid urbanization and the adverse effects of climate change. Consequently, the adoption of sustainable agricultural techniques has become increasingly crucial. Greenhouse farms are gaining popularity owing to their ability to maintain optimal climates and produce high yields in limited spaces. The efficient and sustainable operation of greenhouse farms relies heavily on automatic climate control to optimize crop growth.
In greenhouses, classical control methods, such as on/off and Proportional-Integral-Derivative (PID) control, are employed to regulate temperature and humidity (Iddio et al., 2020). The on/off method is straightforward to implement, but its lack of precise control may result in energy inefficiencies. PID control improves on/off control by adjusting the system based on the difference between the current and desired state (i.e., the error), the rate at which this error changes, and the accumulated error over time. This results in smoother adjustments.
However, while effective for simpler systems, PID control struggles to handle the complexity of interactions between variables in dynamic systems like greenhouses (Iddio et al., 2020). In contrast, advanced control methodologies like Model Predictive Control (MPC) have already demonstrated their ability to achieve fine control and energy-efficient operations economically (Van Beveren et al., 2015; Padmanabha et al., 2020). The ability of MPC to handle multivariable systems, respect system constraints, and incorporate future predictions makes it particularly effective for managing dynamic and interconnected processes (Rawlings et al., 2017).
Building on these advancements, machine learning techniques are increasingly gaining traction in agricultural applications. They offer new possibilities, such as automating the control of greenhouse climates and irrigation systems (Chen and You, 2022; Kamilaris and Prenafeta-Boldú, 2018). Reinforcement learning (RL), a subset of machine learning, is particularly promising for modern agricultural practices (Morcego et al., 2023), as it excels in managing complex environments without relying on predefined models (Buşoniu et al., 2018).
MPC and Artificial Intelligence (AI)-based techniques are increasingly used in greenhouses, particularly in advanced, technology-driven agricultural setups. The ability of MPC to provide precise climate regulation while optimizing energy use and crop yield has led to its adoption in modern greenhouse systems (Hemming et al., 2020). Climate control system vendors, especially in regions with cutting-edge agricultural practices, are beginning to incorporate MPC and AI into their products (Parliament et al., 2023).
However, its widespread adoption remains a work in progress. Factors such as high implementation costs, the complexity of developing accurate system models, and the need for specialized expertise pose significant barriers, particularly for smaller or traditional growers (Van Straten et al., 2010; Parliament et al., 2023). As advancements in user-friendliness and affordability continue, advanced control methodologies can potentially transform greenhouse management on a broader scale, bridging the gap between innovation and accessibility.
This study mainly focuses on developing an AI-based language support architecture to increase user-friendliness with advanced control techniques. The advanced control techniques commonly determine the time-varying climate setpoints or reference trajectories based on the respective algorithms. These setpoints are sent via a digital interface to the process computer, and then the individual piece of equipment is operated accordingly (Hemming et al., 2020). Understanding these reference trajectories of individual parameters or equipment is challenging when performed from a remote location or through a user interface on digital devices like mobile phones and tablets. Additionally, the greenhouse control reference trajectories involve more variables, resulting in high-dimensional data that are difficult for humans to comprehend.
Visualization tools have emerged as a practical solution for simplifying the interpretation of complex data in dynamic environments (Devineni, 2024). They provide stakeholders with actionable insights by presenting an overview of complex trajectory data. However, their effectiveness is limited when users face high-dimensional information, particularly for non-specialist users, or during time-sensitive decision-making (Wang et al., 2022). In these contexts, relying entirely on visuals can lead to misinterpretation or incomplete understanding (Angeli, 2004).
To address these limitations, textual descriptions play a critical role by complementing visual data with precise and detailed explanations. Text aids in articulating complex concepts, uncovering underlying dynamics, and contextualizing information that visuals may overlook (Hearst, 2023). This interplay between text and visuals enhances comprehension by combining the intuitive appeal of graphical data with the depth and clarity of written narratives.
Moreover, text engages cognitive processes distinct from those involved in interpreting visuals. While visuals attract attention and provide quick insights, textual explanations promote deeper cognitive engagement, enabling users to retain and process complex information more effectively (Angeli, 2004). This makes text especially valuable in educational and operational settings where clarity and retention are crucial.
Integrating textual explanations with visual representations enables greenhouse control systems to effectively communicate the intricacies of reference trajectories. This balanced approach not only makes advanced algorithms like MPC more accessible but also empowers growers to make informed decisions with confidence. This study proposes providing textual descriptions of the reference trajectories of a greenhouse generated within an MPC framework using Natural Language Generation (NLG) as a first step toward the solution.
NLG, a branch of artificial intelligence and computational linguistics, focuses on developing computer systems capable of generating understandable texts in human languages from nonlinguistic data (Gatt and Krahmer (2018). The technology has demonstrated remarkable success across diverse domains, including generating weather forecasts (Goldberg et al., 1994), financial reports (Plachouras et al., 2016), and clinical summaries (Scott et al., 2013). In these applications, NLG systems transform complex numerical and time-series information into clear, contextual narratives that aid decision-making.
Two fundamental approaches stand out for NLG text generation: rule-based and template-based systems. Rule-based NLG relies on complex linguistic rules and deep language understanding to generate text, offering high flexibility but requiring extensive linguistic expertise to implement and maintain. In contrast, template-based NLG uses predefined text structures with variable slots, offering more controlled and predictable output. Template-based systems also allow for easier validation of outputs and modifications to meet specific domain requirements, making them particularly suitable for mission-critical applications where accuracy and clarity are important (Tripathi and Tamrakar, 2018).
While recent work by Sharma et al. (2021) introduced the framework using pretrained Large Language Models (LLMs) trained on WebNLG and DART datasets, such generic models may not effectively capture the specialized nature of greenhouse control systems. The dynamics of greenhouse environments, with changing climate variables and strong interdependencies, require more domain-specific solutions. To address these challenges, we adapted the data-to-text generation approach to better align with greenhouse climate control requirements, ensuring accurate and context-sensitive summaries through carefully crafted templates that incorporate domain expertise and technical precision.
Our methodology first identifies critical points in time-series data through change point detection. The NLG algorithm then processes this information to generate detailed reports on the reference trajectories and their transitions. Finally, we leverage an LLM with a predefined prompt to summarize these reports into concise insights. This language-based support system helps growers understand their planned greenhouse operations for the following day by translating reference trajectories into clear descriptions of anticipated conditions.
MPC is an optimization-based control strategy that determines the control inputs by solving an optimization problem over a finite time horizon. It uses a dynamic mathematical model of the system to predict future behavior and optimize a performance criterion, such as an economic objective, while satisfying system constraints (Rawlings et al., 2017). At each time step, MPC applies only the first control input of the optimized sequence and repeats the process as new data becomes available, operating in a receding horizon fashion. This iterative approach allows MPC to continuously update its decisions in response to real-time changes and disturbances. It is particularly robust for dynamic and uncertain environments like greenhouses, where future conditions can change unpredictably (Van Straten et al., 2010).
A Venlo-type semi-closed greenhouse growing tomato crop was considered in this work. The greenhouse climate was characterized by temperature (T), CO2 concentration (C), and relative humidity (H) of the air inside the greenhouse. Crop growth was defined as the fresh weight of biomass (B), estimated using an observer. Control inputs like ventilation, CO2 injection, heating, and cooling influence the greenhouse climate. External factors such as outdoor temperature, CO2 levels, relative humidity, and solar radiation also affect the greenhouse climate.
This study used a mathematical model of the greenhouse adapted to the parameters of a greenhouse facility at Humboldt University of Berlin. For a detailed mathematical model describing the greenhouse climate dynamics and crop growth, refer to Sathyanarayanan et al. (2024). The greenhouse climate directly affects crop growth and health, making it essential to maintain within specific limits to ensure optimal conditions, as mentioned in Sánchez-Guerrero et al. (2005) and Zarnescu et al. (2019). The constraint-satisfying ability of the MPC control makes it more desirable for greenhouse climate control.
The greenhouse MPC controller aimed to maximize yield and minimize production costs while maintaining the climate variables within a predefined bound. As shown in Figure 1, the MPC controller solved an optimization problem with the economic objective using the forecast weather data and energy price. The reference trajectories for temperature, CO2 concentration, and relative humidity were generated and sent to the local climate controller of the greenhouse. Typically, the local climate controller is provided with static reference values for temperature or relative humidity, whereas using MPC or any other advanced control method, time-varying reference trajectories are provided as depicted in Figure 1. For more details on the mathematical formulation of the implemented framework, please refer to Sathyanarayanan et al. (2024). The MPC problems were solved using real-time weather data collected in 2011 from the greenhouse facility weather station in Berlin.
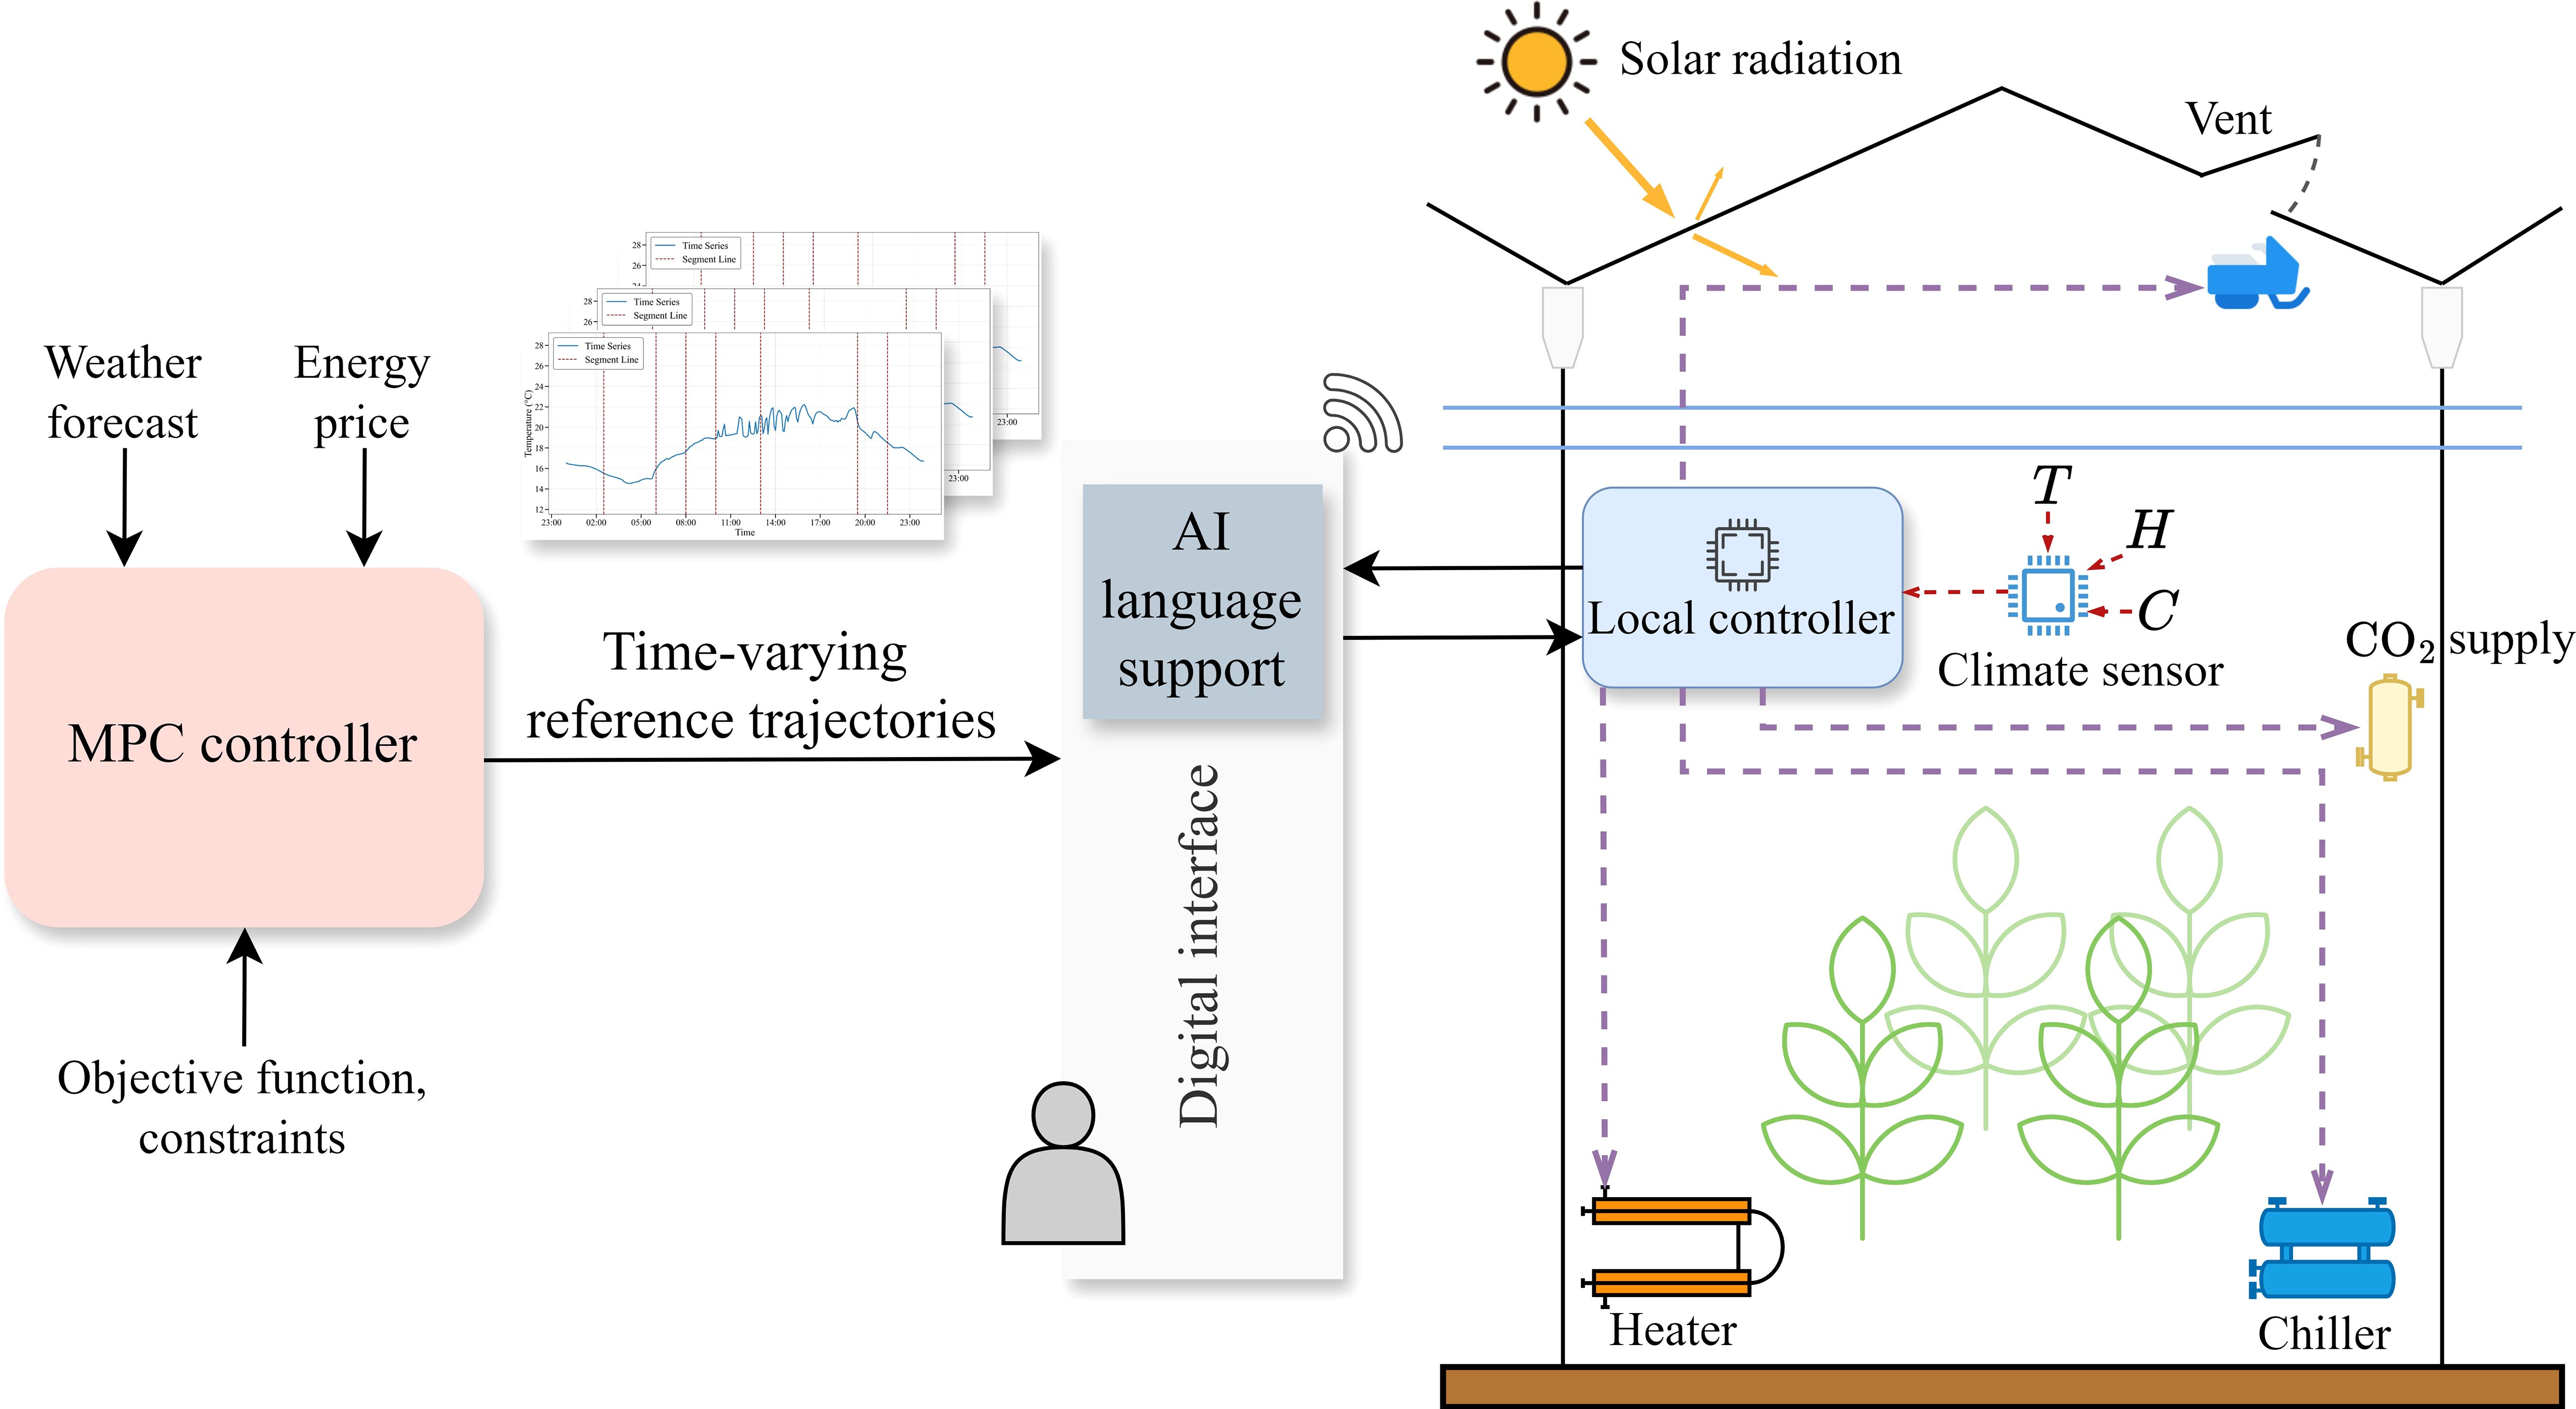
Figure 1. Model predictive control and AI-based language support system of the greenhouse: The reference trajectories generated by MPC were sent through a digital interface to the local controller. The AI-based language support system in the digital interface provides quick insights into the trajectories.
The proposed AI language support framework is based on climate reference trajectories generated from the MPC controller to the greenhouse as shown in Figure 1. The framework was developed based on insights from Section 2.1, with these reference trajectories as input to the language support system (cf. Figure 2). Each climate reference trajectory data point was generated at 5-minute intervals, covering a complete day from 00:00 to 24:00. This simulated dataset, generated by the MPC, spanned from March to October 2011, providing a robust foundation for tracking and responding to daily and seasonal variations in greenhouse conditions.
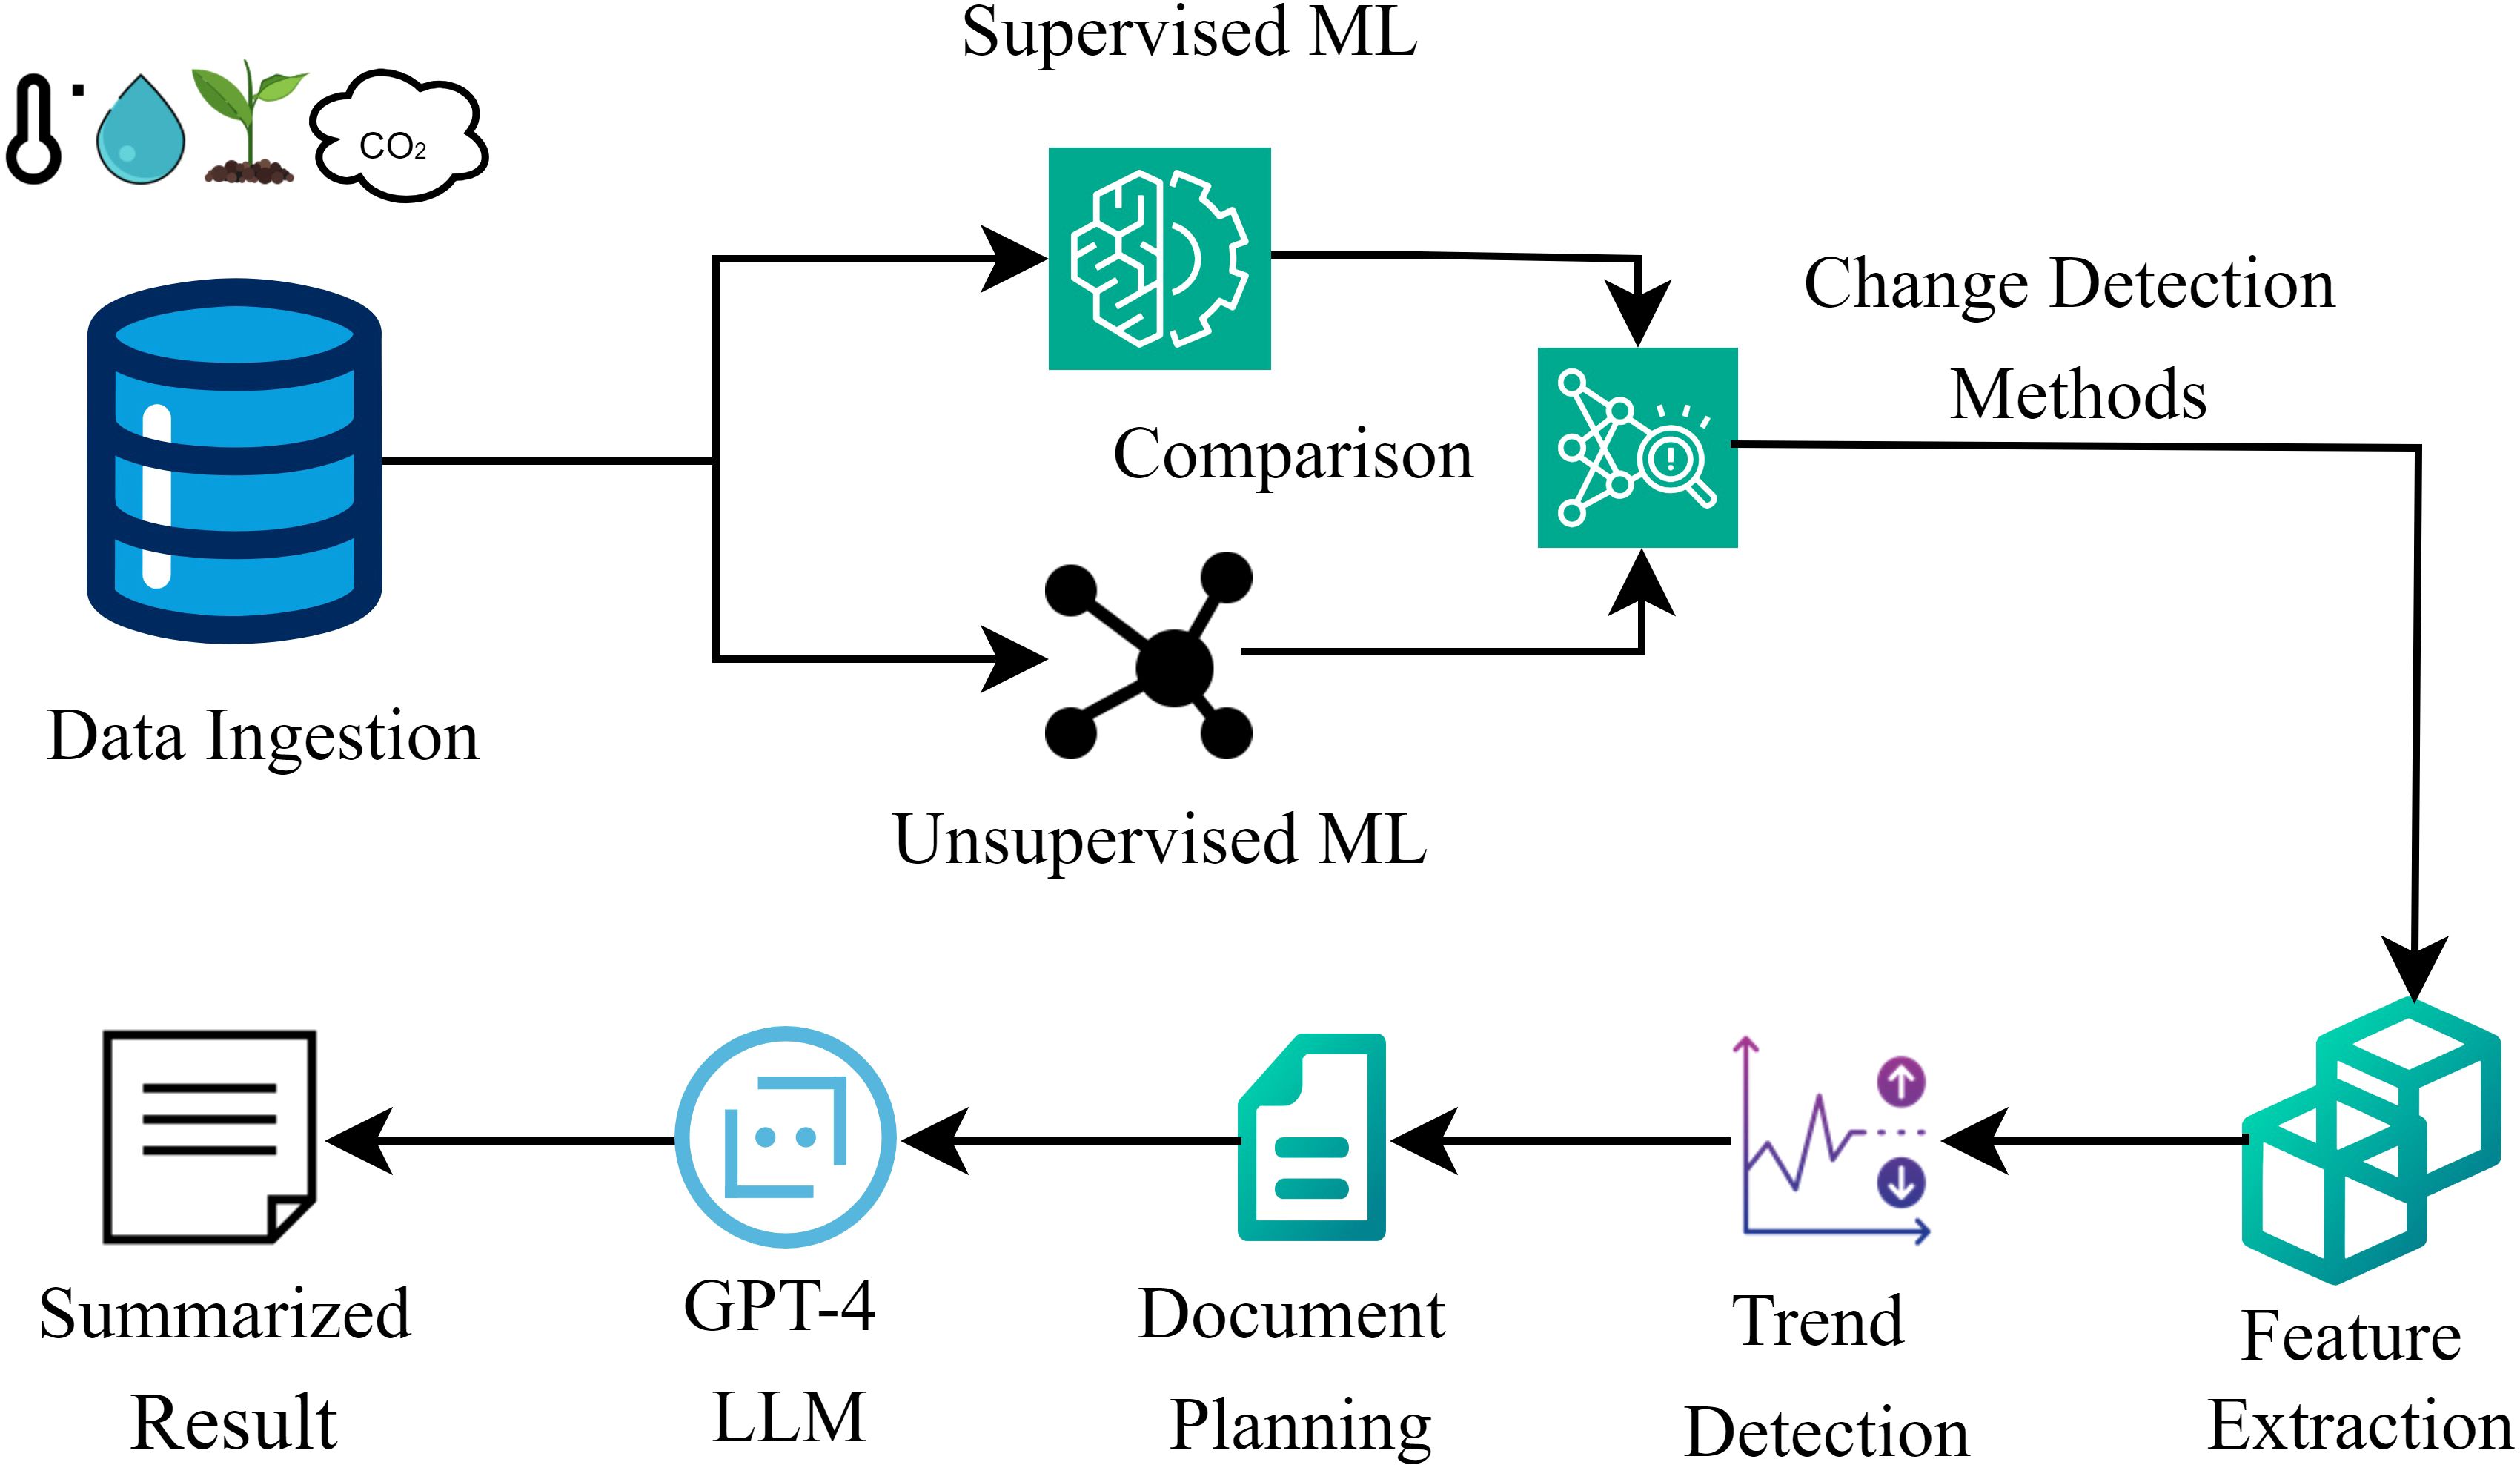
Figure 2. AI-based language support architecture.
Change point detection involved identifying points in a time series where statistical properties changed abruptly. This process was essential for detecting shifts in behavior or structure within data, which indicated significant events or transitions (Kawahara and Sugiyama, 2011).
Supervised change point detection refers to identifying points in time series data where the underlying statistical properties shifted, using labeled data to inform the detection process (Aminikhanghahi and Cook, 2017). Based on the dynamic changes in the reference trajectories, we employed a supervised change point detection and compared three different approaches to evaluate their effectiveness. These methods were implemented using the ruptures package, which provides efficient tools for time series segmentation and change point detection (Truong et al., 2020).
Pruned Exact Linear Time (PELT) algorithm segments the time series by optimally partitioning the data into regions with distinct statistical properties, using a cost function to determine the most efficient segmentation lines while maintaining computational efficiency (Killick et al., 2012).
Cumulative Summation (CUMSUM) algorithm detects changes by tracking the cumulative sum of deviations from a target value, drawing segmentation lines at points where this sum exceeds a threshold, indicating significant shifts in the underlying process (Wei and Xie, 2023).
Exponentially Weighted Moving Average (EWMA) algorithm identifies change points by comparing weighted averages of recent data points against historical trends, establishing segmentation lines where the weighted average deviates significantly from expected values (Raza et al., 2015). A detailed evaluation and comparative analysis of these three approaches is presented in Section 3.1.
Exploring unsupervised algorithms presents an opportunity to gain deeper insights, especially when working with complex, multidimensional data where predefined labels or manual annotations are impractical or unavailable. The K-means clustering algorithm is a widely used method for unsupervised learning that organizes data points into k clusters based on similarity (Jain, 2010). Its simplicity and efficiency make it suitable for various applications, including time series analysis (Warren Liao, 2005).
The K-means algorithm works by partitioning a set of observations into a predefined number of clusters, with each data point assigned to the cluster whose centroid is closest. The algorithm iteratively adjusts the centroids to minimize the Within-Cluster Sum of Squares (WCSS), defined as
The key components of the K-means algorithm are cluster, cluster centroid, and minimization objective.
Clusters S = S1,S2,…,Sk: Each cluster Sicontains data points closer to its centroid than to any other centroid.
Cluster Centroid µi: The centroid µi is the mean of all data points in cluster Si, representing the cluster’s center.
Minimization Objective: The expression represents the total within-cluster variation, which the K-means algorithm seeks to minimize.
The term in equation (1) indicates the squared Euclidean distance between a data point x and its cluster centroid µi. The process continues until convergence, effectively grouping data into clusters that reveal inherent patterns within the dataset.
For the K-means clustering implementation, the Python library scikit-learn (Pedregosa et al., 2011) was used. The optimal number of clusters (k) was determined using the silhouette score, which evaluated cluster quality by measuring how similar a data point is to its own cluster compared to other clusters. This ensured that the clustering results were both meaningful and well-suited to the greenhouse dataset.
Extreme Value Theorem (EVT) provides a robust statistical framework for analyzing extreme values within a dataset, often indicative of significant changes or anomalies in the underlying process (Coles, 2001). Time-series analysis leveraging EVT allows for the identification of potential change points without predefined thresholds or labeled data (Chavez-Demoulin and Davison, 2012).
The theoretical foundation of EVT states that the maximum of a sample of independent and identically distributed (i.i.d.) random variables, drawn from the same probability distribution, converged in distribution to one of three possible distributions: the Gumbel, Fréchet, or Weibull distribution. These distributions are collectively known as the Generalized Extreme Value (GEV) distribution (Hansen, 2020).
In this paper, we adapted and developed a systematic approach to detect change points in timeseries data using EVT. The methodology identified local maxima and minima as potential indicators of change points through a three-stage process: (1) Gaussian smoothing to reduce noise and minor fluctuations in the data, (2) detection of extreme points using EVT principles, and (3) clustering of the identified extreme points to determine significant change points. Each stage was designed to progressively refine the analysis, ensuring that the detected change points represented meaningful shifts in the time series rather than temporary fluctuations.
The Gaussian filter is defined by its kernel, which forms a bell-shaped curve given by
where σ in Equation (2) is the standard deviation determining the Gaussian kernel width. The filter application in this study involved convolving this kernel with time-series data, resulting in a smoothed version of the series as follows
The smoothed data Xsmoothed in Equation (3) enabled the detection of extreme points, ensuring that only significant trends were captured while minor noisy fluctuations were suppressed. Gaussian filtering was selected because of its effectiveness in preserving the essential shape of data while mitigating noise (Perona and Malik, 1990).
The next step involved identifying potential change points by detecting extreme locations where the time series exhibited a significant directional change. The analysis used in Equation (4) X = {x1,x2,…,xn} to represent a time series. An extreme point was where the trend reversed direction, reaching a local maximum or minimum. This was mathematically captured as
In this stage, the extreme points were clustered to distinguish between significant and minor fluctuations. The K-means algorithm efficiently partitioned extreme points into k clusters. Then, the silhouette score method was used to determine the optimal number of clusters. Finally, the optimal number of clusters, as shown in Equation (5), denoted as kopt, was obtained by maximizing the average silhouette score across all points
where a(i) represents the average distance between point i and all other points within its cluster (measuring cluster cohesion), and b(i) represents the average distance between point i and all points in the nearest neighboring cluster (measuring cluster separation). The kopt value that maximized the average silhouette score provided the best balance between cluster cohesion and separation.
The unsupervised change point detection approach combining EVT and K-means clustering was formulated to extract the peak points with optimal clusters. Like the EVT method, the combination approach started with the time series X = x1,x2,…,xn. Then, the Gaussian smoothing step discussed in section 2.3.3 was applied, resulting in a smoothed dataset XG. From XG, local maxima and minima were captured using (4).
The hybrid approach identified meaningful clusters by comparing the outputs of these two preprocessing methods. This integration was achieved through a modified K-means clustering objective function shown in the below Equation (6)
where the weight function in Equation (7) intelligently combined information from both methods was given as
Here, γ and δ were weighting parameters where 1 > γ > δ > 0, ensuring that points identified as significant by both smoothing approaches had the most substantial influence on cluster formation. This weighting scheme naturally integrated with EVT principles by emphasizing genuine extreme points while suppressing noise-induced variations. The K-means clustering algorithm was modified to incorporate a weight function w(x) that intelligently combined information from both the Gaussian-smoothed and non-Gaussian extreme point approaches. This hybrid approach identified meaningful clusters representing significant change points in the time series.
Identifying critical trends in the greenhouse time series data employed distinct approaches for the PELT algorithm and the K-means clustering method, each tailored to capture specific patterns in the data. A slope-based segmentation approach was implemented for the PELT algorithm. This method calculated the slope between consecutive data points for each environmental feature.
The slope represents the rate of change between these points, which is critical for identifying trends. Slope calculations were used to determine the trends between the two segments of the dataset. The implemented slope calculation function assigned descriptive labels based on magnitude thresholds, as shown in Table 1. While these threshold values were optimized for greenhouse reference trajectory data, they could be adjusted to accommodate different systems and sensitivity requirements. This categorization system provided valuable insights into the behavior of the dataset, as exemplified by the CO2 trend illustrated in Figure 3.
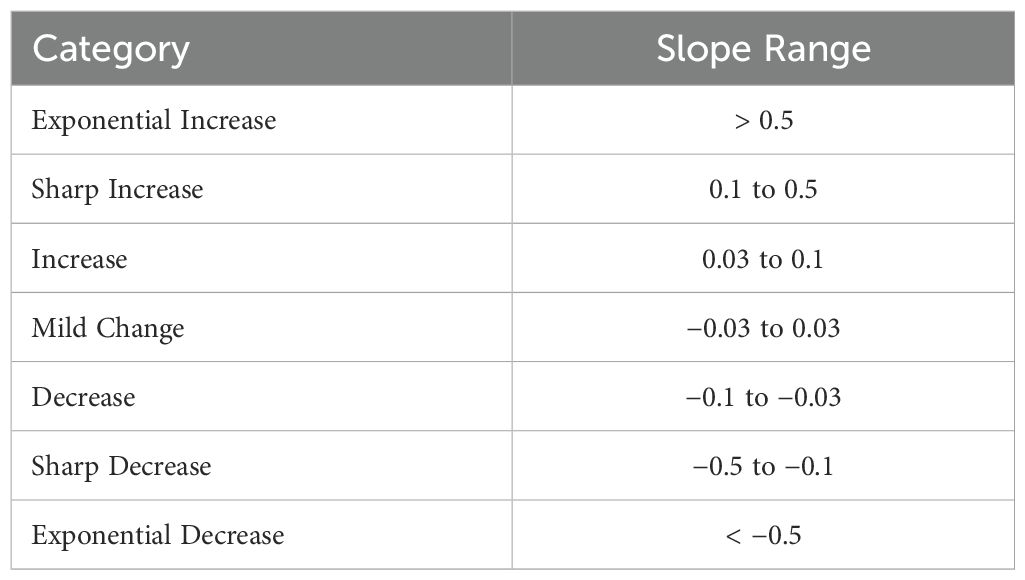
Table 1. Slope categories and their corresponding thresholds.

Figure 3. -PELT Algorithm based segmentation and trend detection of the CO2 reference trajectory.
The K-means clustering method enhanced trend detection by analyzing patterns between consecutive extreme points. This complementary approach calculated absolute differences and percentage changes to provide a more nuanced understanding of data behavior. The method used the same categories as the PELT algorithm (shown in Table 1), ensuring consistency in trend interpretation across both methods. Trend detection bridged the gap between raw time series data and interpretable insights.
The role of NLG in data interpretation is significant, as it can transform structured greenhouse monitoring data into comprehensible textual explanations through a systematic process. NLG encompasses several approaches, including rule-based, statistical, and machine learning-based techniques with distinct characteristics and applications. For our implementation, we specifically employed a template-based NLG approach, which falls under rule-based techniques. This approach was chosen because it maintains precise numerical reporting and consistent terminology in greenhouse monitoring reports. While modern NLG systems often employ advanced techniques like LLM’s, we opted for a rule-based template system due to its deterministic nature and guaranteed consistency in representing reference climate trajectories. This choice ensured accurate representation of sensor measurements and maintained standardized formatting, which is essential for greenhouse monitoring reports.
NLG document planning was a critical intermediary for converting time-series data into a human readable format. Our template-based approach implemented a three-stage NLG pipeline: comprising content determination for selecting relevant environmental parameters, document planning for organizing information structure, and surface realization for generating the final text with appropriate formatting. We employed predefined text templates with variable slots, offering controlled and predictable output while maintaining flexibility through parameter substitution. This structured approach ensured consistent reporting of environmental variables while preserving numerical precision and temporal clarity in the generated explanations.
The illustration of the document planning process below shown in Figure 4 demonstrates this template structure and shows the link between raw data interpretation and final text generation. Here, mapped feature name corresponded to one of the state variables like temperature or humidity under trend detection, with startvalue:.2f and unit being the respective value and unit of the variable in the dataset. The formatting specifiers.2f and.02d were employed to standardize numerical representation; the.2f specifier consistently formatted floating-point values to two decimal places (e.g., 25.60), while the.02d specifier ensured a two-digit integer display with leading zeros when necessary (e.g., 05), thereby maintaining numerical precision and text-based representational consistency.
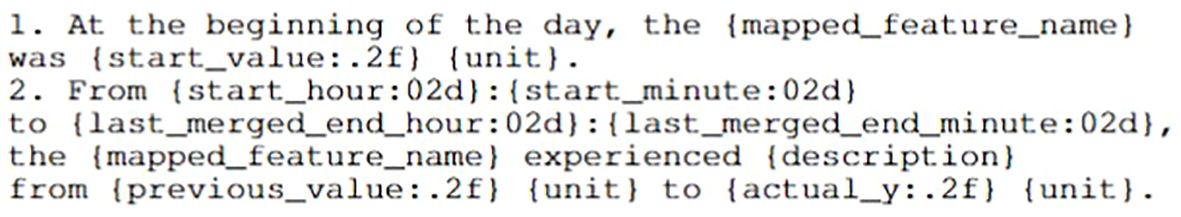
Figure 4. Template for generating daily summary reports of greenhouse environmental variables.
Prompt engineering systematically designs and optimizes input prompts to guide LLMs in generating accurate, relevant, and coherent outputs. This process is crucial for fully unlocking the capabilities of LLMs, making them applicable across diverse fields. Techniques in prompt engineering range from foundational approaches like role-prompting (Shanahan et al., 2023) to more sophisticated methods such as “chain of thought” prompting (Wei et al., 2022).
The GPT-4 language model, accessed through the OpenAI API, was leveraged to address this challenge. Instead of fine-tuning the pre-trained model, the research directly interfaced with the OpenAI API to generate climate condition reports by sending carefully crafted input prompts (OpenAI, 2023). For text generation, we used the OpenAI API with a temperature of 0.2. In the context of language models, the temperature parameter controls the randomness of token predictions: a lower value (closer to 0) makes the output more deterministic and focused, while a higher value (approaching 1) introduces more diversity and creativity. A temperature of 0.2 was selected to minimize stochastic variations and maintain consistent, precise output generation. The prompt engineering process guided the GPT-4 model to produce accurate and context-specific summaries.
Prompts were carefully constructed to provide comprehensive context about the greenhouse domain, time-series data, and desired output format as detailed in Section 3.3. This promptbased approach enabled the GPT-4 model to generate detailed textual summaries describing reference trajectories and predicted greenhouse climate conditions in alignment with the grower’s requirements.
This section outlines the techniques and evaluation metrics for change point detection and trend analysis in greenhouse time series data. The performance of these methods was evaluated through a combination of manual labeling, supervised algorithms, and an unsupervised hybrid approach, with metrics such as the F1 score and R2 values. The data analysis was conducted in Python, leveraging specialized libraries such as pandas and numpy for data manipulation. Visualizations were generated using matplotlib, and summarizations were performed using the GPT-4 API.
First, for each greenhouse climate variable, potential change points were manually labeled through visual inspection of the data. This manual labeling served as the ground truth for evaluating the performance of the change point detection algorithms.
The performance of each method was evaluated using the F1 score, which provides a balanced measure of precision and recall (Chinchor, 1992). The F1 score was calculated for each state variable, and the average F1 score (F1,avg) was computed across all three variables:
where N represents the total number of state variables (in this case, N = 3), i is the index representing the individual state variable, and F1,i is the F1 score for the ith state variable. The supervised change point detection methods also evaluated the detected change points using piecewise linear regression between segments. For each set of detected change points, a piecewise linear regression model was fitted to the data, and the corresponding R2 values were calculated across the various state variables. The R2 formula is given by:
where yi represents the actual observed values of the dependent variable at each data point i, and represents the predicted values of the dependent variable at each data point i, estimated by the piecewise linear regression model.
The performance metrics, including the F1 score and the R2 values, were analyzed to assess the effectiveness of the change point detection and trend analysis methods in accurately identifying significant transitions and patterns within the greenhouse time series data. Table 2 shows the result of this evaluation. The specific threshold values used for the slope categories in the trend detection (see Table 1) were optimized for the greenhouse environmental data in this study. These threshold values may need to be adjusted to accommodate different systems and sensitivity requirements.
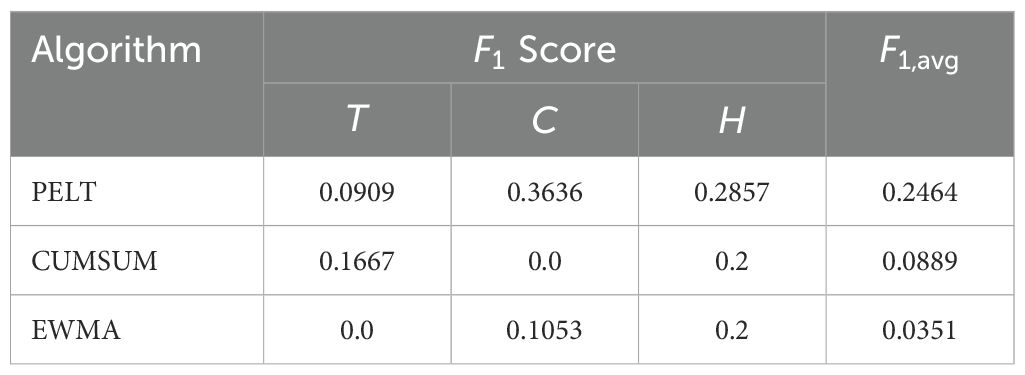
Table 2. Comparison of supervised algorithm F1 and F1,avg score.
To validate the summarization quality, a random sample of 50 pairs of detailed explanations and their corresponding summaries was evaluated using the state-of-the-art BERTScore metric (Zhang et al., 2019). BERTScore utilizes BERT (Bidirectional Encoder Representations from Transformers), a deep learning model pre-trained on massive text corpora, to compute semantic similarity scores by analyzing the contextual relationships between candidate and reference sentences (Celikyilmaz et al., 2020). This approach was convenient for evaluating abstractive summaries, as it could capture meaning beyond simple lexical overlap. Following this comprehensive evaluation and validation approach, the proposed methods could be thoroughly assessed for their ability to extract meaningful insights from greenhouse time series data. The results of this summarization are presented in Section 3.4.
This study utilized accurate change point detection as a critical tool for identifying trends in the reference trajectories for tomato greenhouse cultivation. The PELT algorithm analyzed temporal variations by identifying significant transitions in variables such as temperature, CO2 concentration, and relative humidity. This facilitated precise adjustments to ensure the maintenance of optimal growing conditions for tomato crops.
Following the procedure established for the PELT algorithm, 20 dates were randomly selected from the dataset for evaluation. The PELT algorithm’s performance is influenced by two key parameters: the penalty value, which controls the trade-off between model complexity and fit by regulating the number of change points detected, and the jump value, which determines the minimum number of observations between detected change points (Aminikhanghahi and Cook, 2017). Through experimentation, a penalty value of 10 and a jump value of 6 were chosen because they yielded the best fit for the dataset.
Figures 5–7 show the climate reference trajectories obtained from solving the MPC problem for a single day. Figure 5 depicts the time series and segmentation line for temperature (T). The time series exhibited significant fluctuations, ranging from around 15°C to 24°C. Several distinct trends or change points in the data were identified through the segmentation lines. Figure 6 shows the time series and segmentation line for CO2. The time series data varied, ranging from around 920 ppm to over 970 ppm. The segmentation line highlights multiple key change points where the variable shifted up or down notably. Figure 7 presents the time series and segmentation line for relative humidity. This variable showed less variability, staying mostly between 60-90%. The segmentation line identified a few distinct changes in the humidity-related variable around the end of the day.
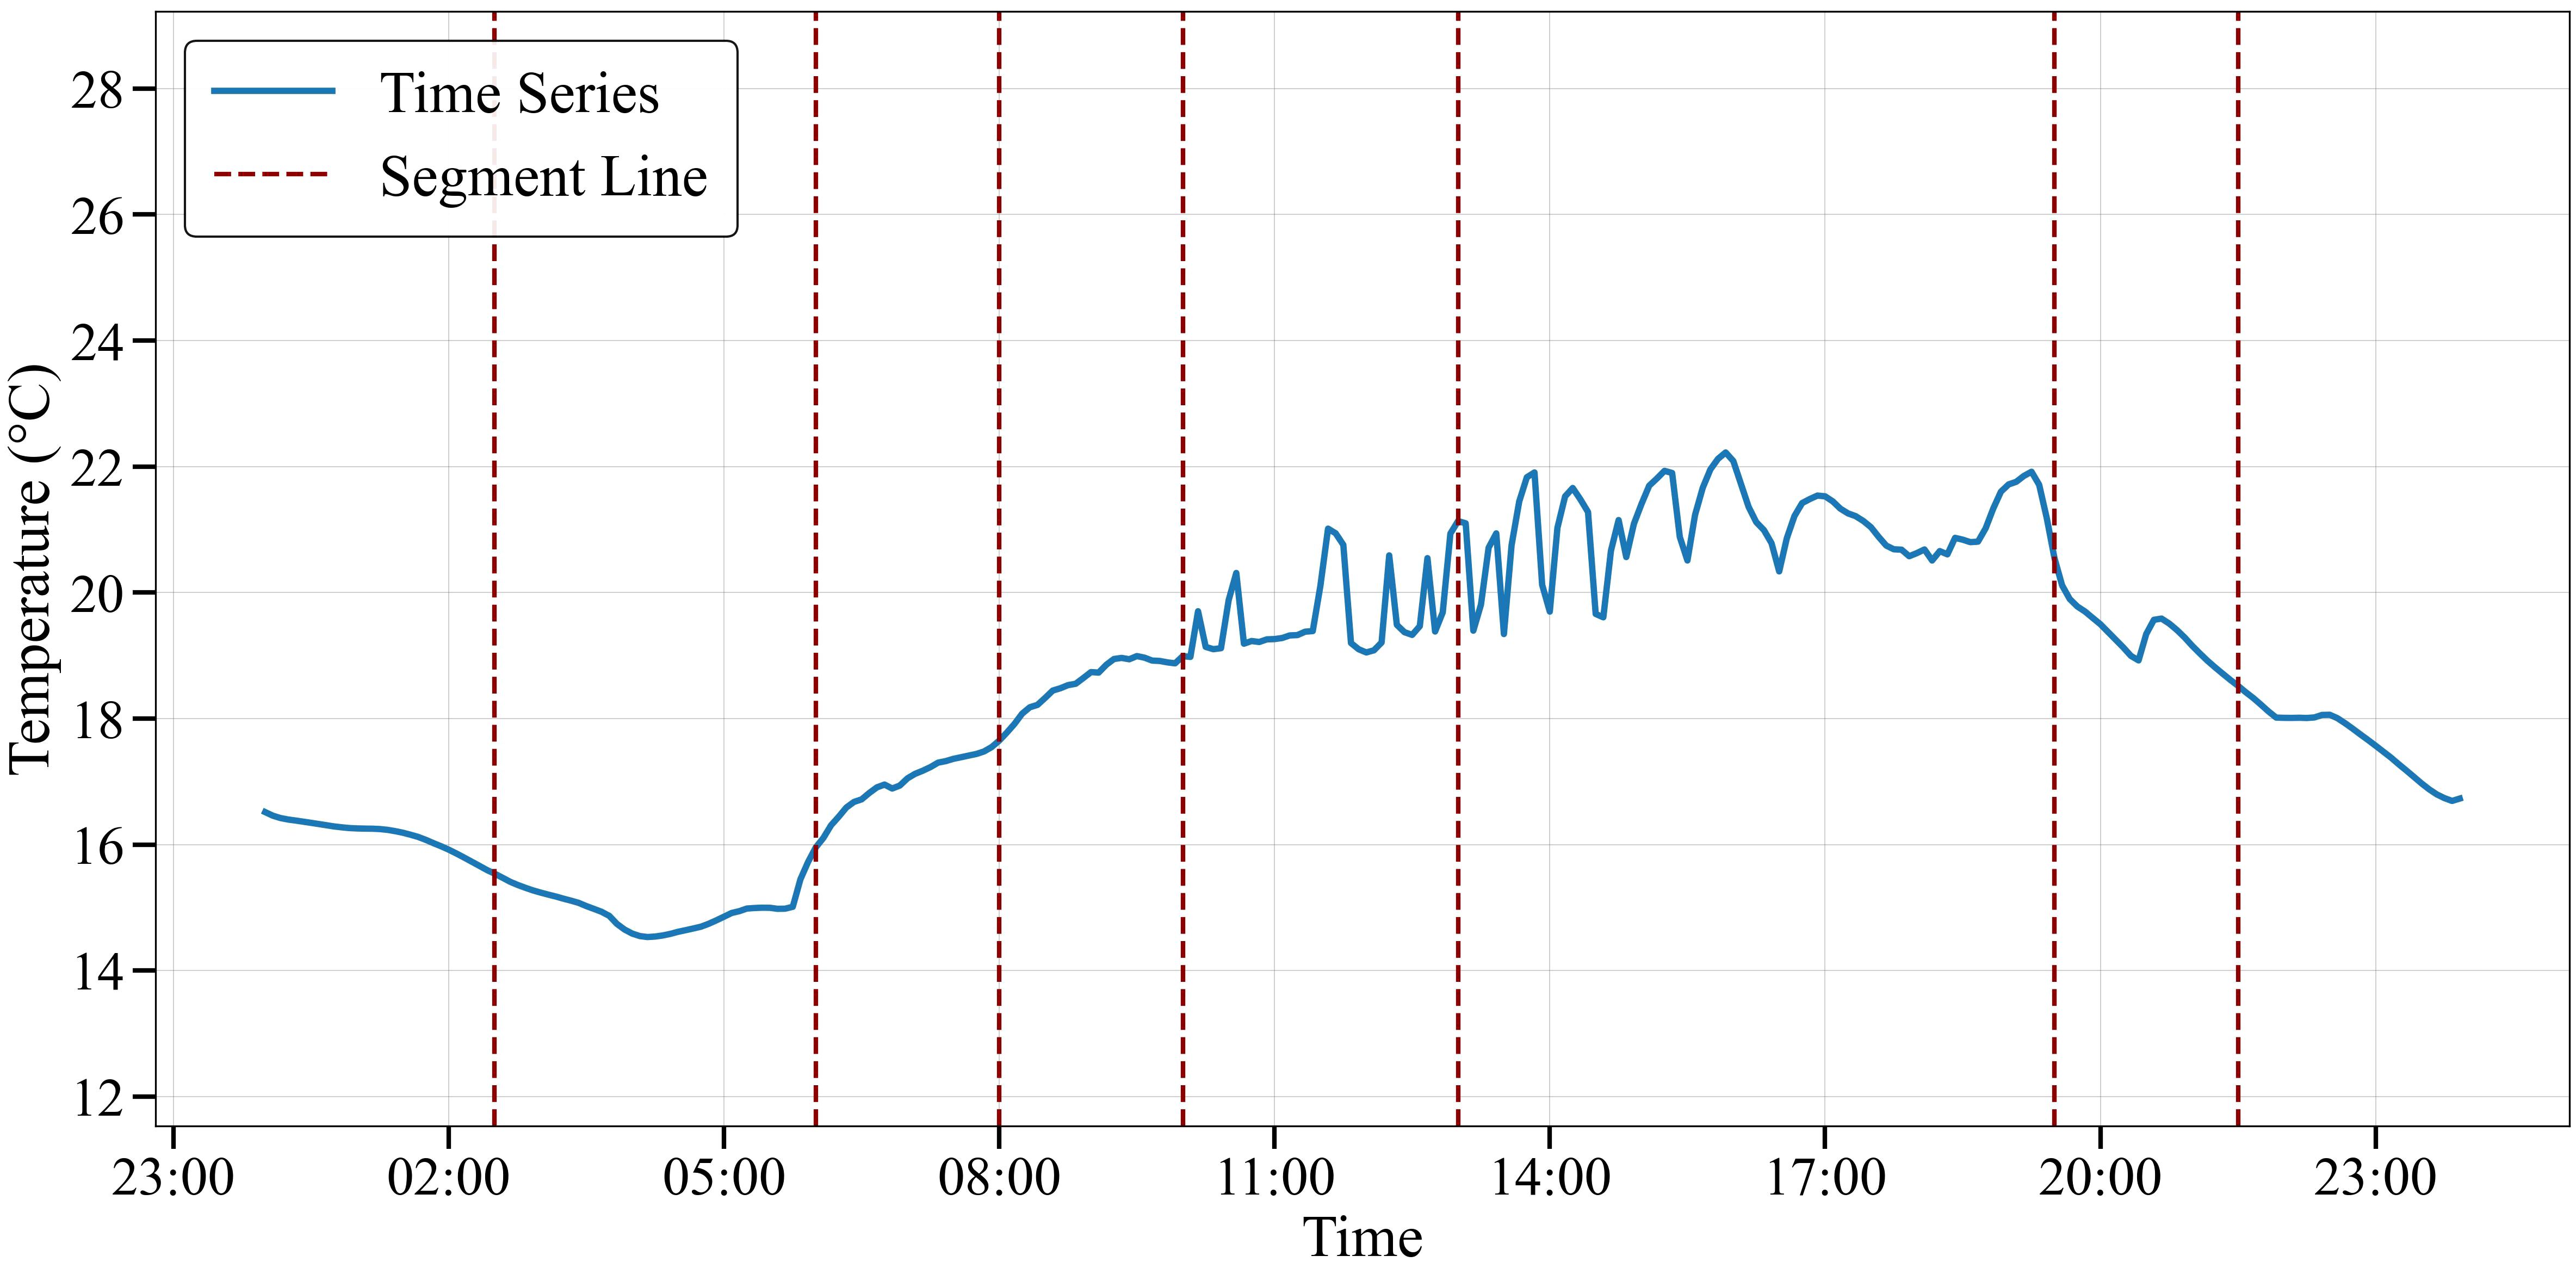
Figure 5. Temperature reference trajectory segmentation based on PELT algorithm.
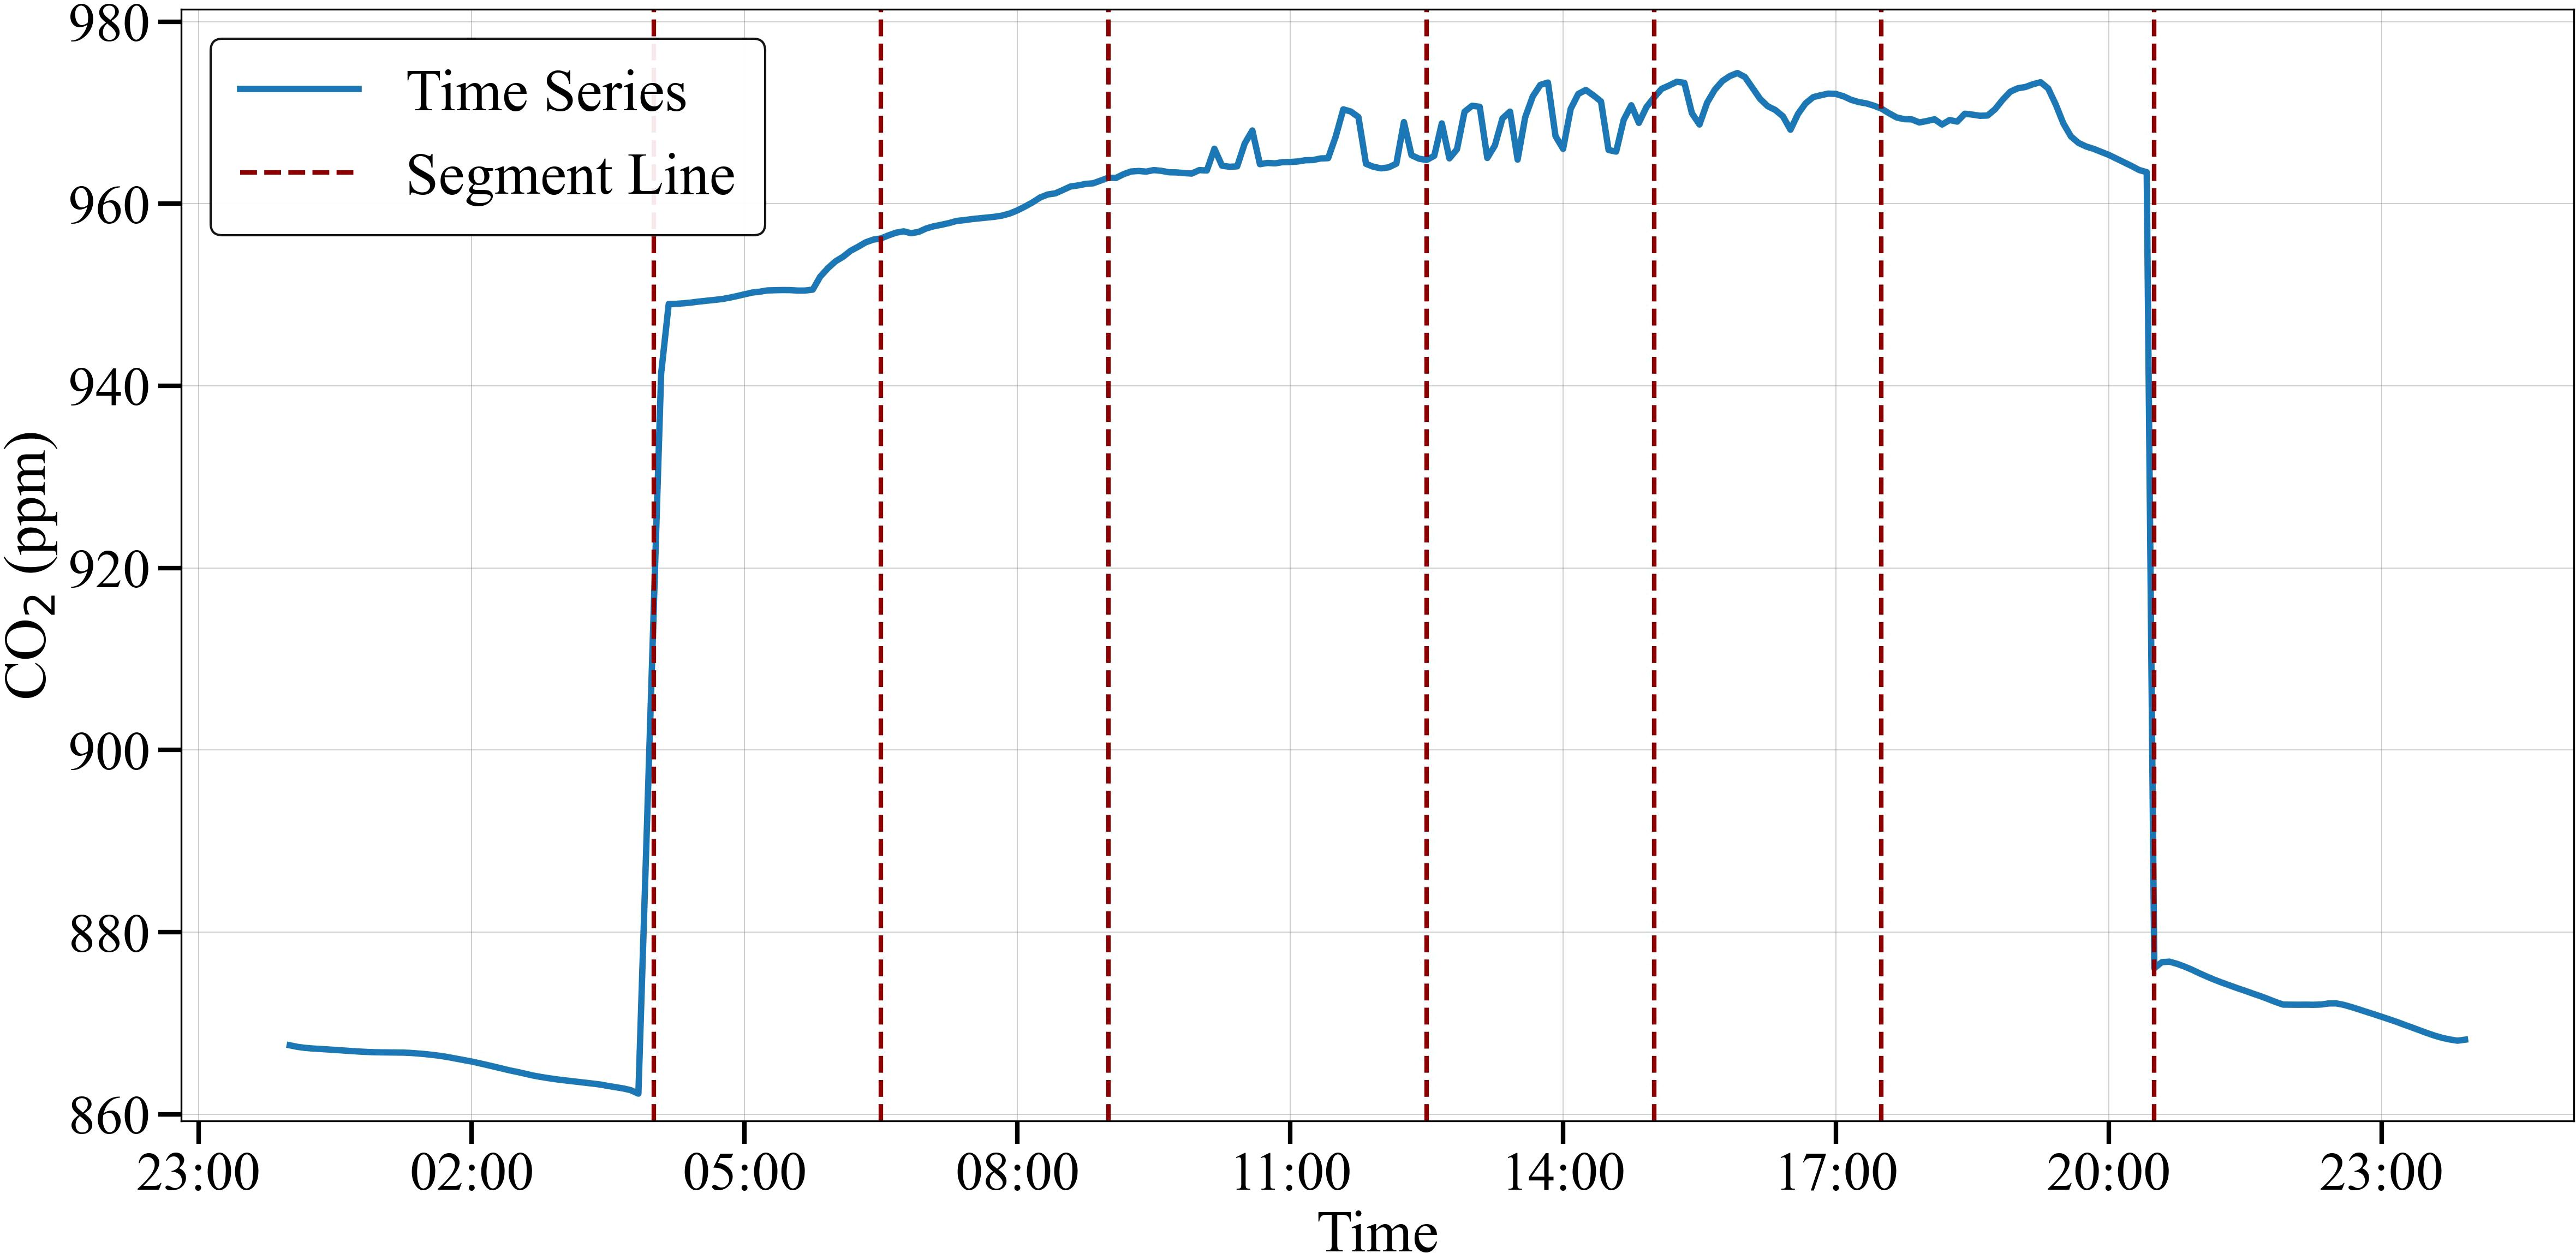
Figure 6. CO2 reference trajectory segmentation based on PELT algorithm.
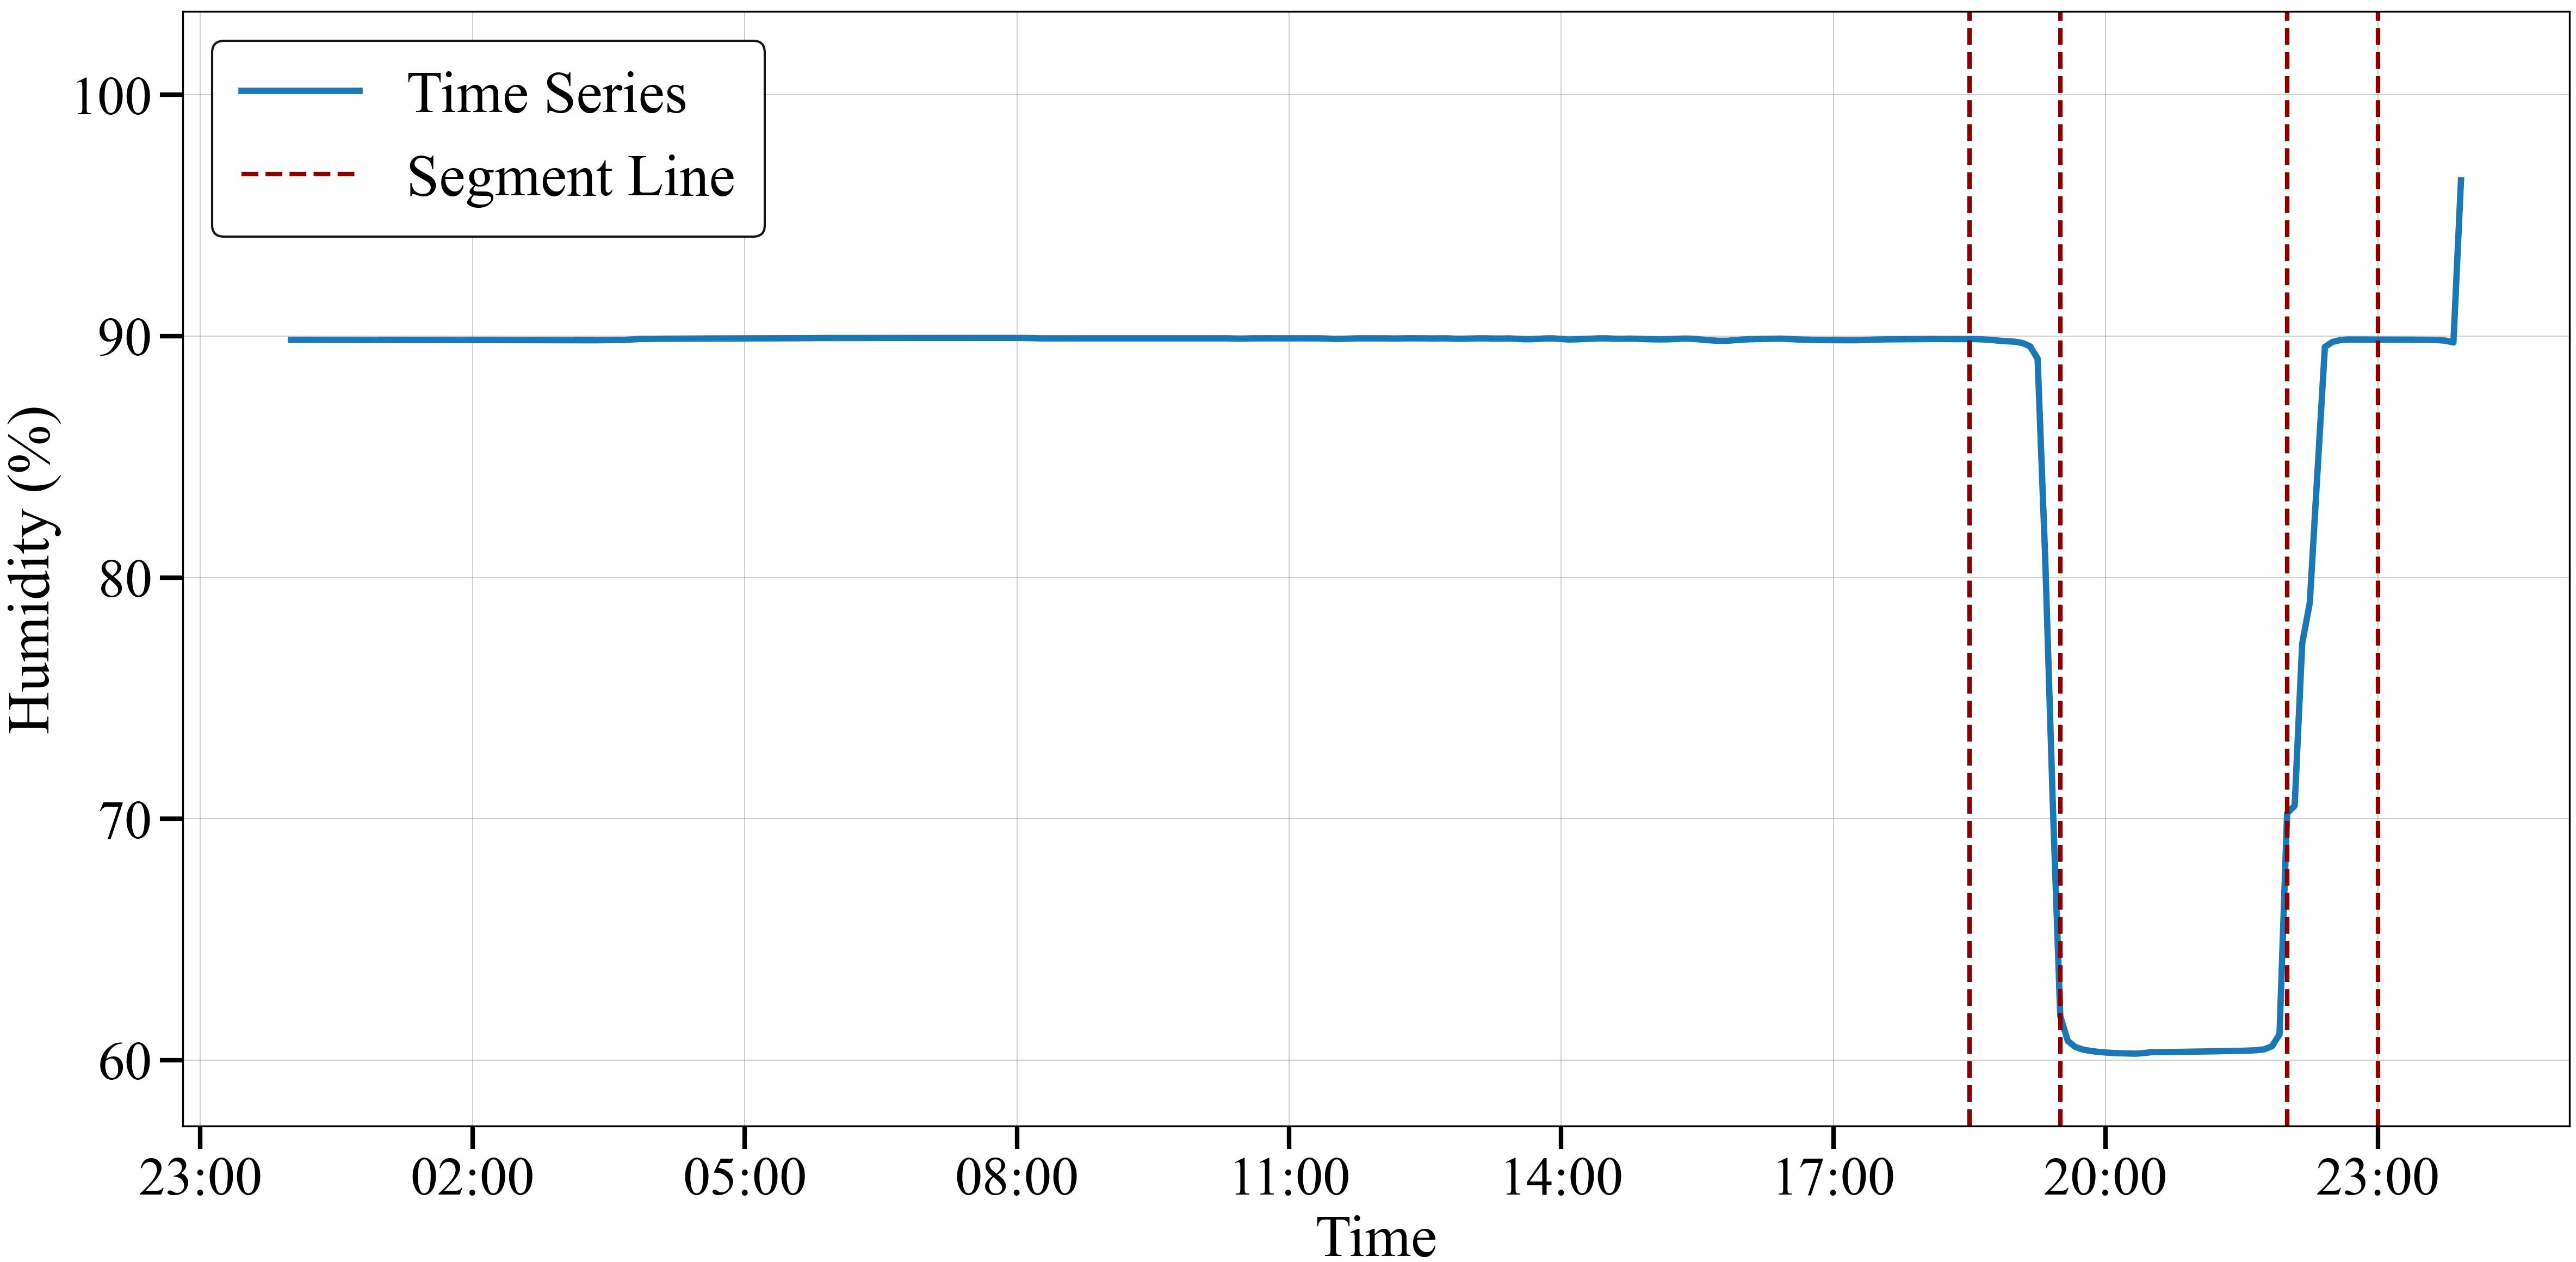
Figure 7. Relative humidity reference trajectory segmentation based on PELT Algorithm.
Table 3 compares the three supervised learning CPD algorithms using R2 values. Also, the output of the CPD algorithms were compared with the manually labeled change points for further validation. These potential change points were determined through visual inspection of the data, and the F1 score was computed for each state variable, as presented in Table 2.
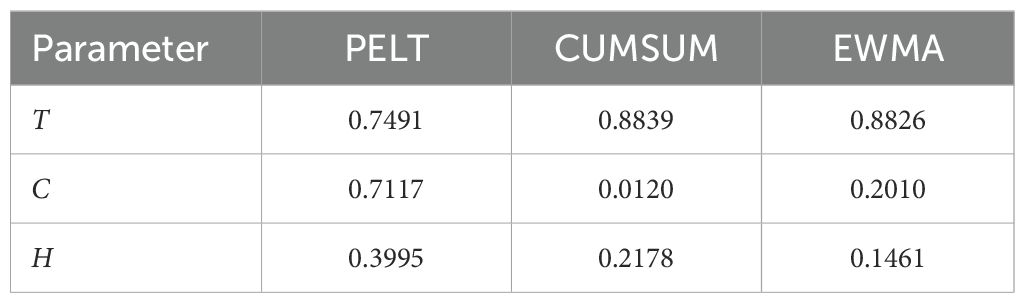
Table 3. Evaluation of supervised learning algorithms using R2 values.
Based on the analysis of both Table 3 and Table 2, the PELT algorithm demonstrated good performance in detecting change points within the dataset. Its efficiency lies in its computational approach, which employs an exact linear time segmentation method, making it highly effective for large datasets. This iterative process carefully considers all potential change points and selects optimal ones at each step (Killick et al., 2012).
The capability to identify potential change points is particularly significant for tomato cultivation, as tomatoes are sensitive to sudden environmental changes. The temperature range observed (15°C to 24°C) aligns with optimal conditions for tomato growth, where maintaining temperatures between 18-24°C during the day is crucial for proper fruit development (Rangaswamy et al., 2021; Mamatha et al., 2014). The CO2 concentrations detected (920-970 ppm) fall within the beneficial range for tomato photosynthesis, as tomatoes show enhanced growth and yield at elevated CO2 levels between 800-1000 ppm (Rangaswamy et al., 2021; Moratiel et al., 2023). The algorithm’s relative humidity range (60-90%) captures the ideal humidity levels (65-75%) for tomato pollination and fruit set while helping prevent common tomato diseases like leaf mold that thrive in consistently high humidity conditions (Mamatha et al., 2014).
Figure 3 is similar to Figure 6, with the slope line, shown in red, tracking the general upward and downward movements of the time series. Figure 3 maps the overall trend indicator, capturing broader increases and decreases in the time series data, as outlined in Table 1. The features extracted using the PELT algorithm were subsequently processed through the document planning framework introduced in Section 2.5.1.
The unsupervised CPD techniques K-means clustering, EVT, and a hybrid approach were evaluated and compared using the same dataset as the supervised method. Firstly, K-means clustering applied to CO2 data demonstrated the ability to detect local variations and global patterns. Figure 8 shows the clustering of CO2 levels without any smoothing applied, which highlights dense segmentation due to the algorithm’s sensitivity to temporal variations. However, such sensitivity can amplify fast varying fluctuations considered as noise and lead to over-segmentation.

Figure 8. K-means clustering of CO2 reference trajectory.
To address this challenge, Gaussian smoothing was introduced as part of the EVT-based approach. Unlike simple moving averages, which can obscure critical peaks and valleys in the data, Gaussian filters provide smoother transitions and better preserve meaningful patterns (Sharifi et al., 2022). This property was instrumental in mitigating the over-segmentation observed in the initial K-means clustering. Additionally, Gaussian smoothing offered computational efficiency, making it well-suited for real-time analysis in dynamic greenhouse environments where rapid decision-making is crucial for optimal crop management.
Figure 9 demonstrates how Gaussian smoothing reduced the impact of external disturbances and allowed for more meaningful clustering patterns to emerge. Figure 10 represents clustering results without Gaussian smoothing, highlighting the noise amplification due to the absence of smoothing techniques.
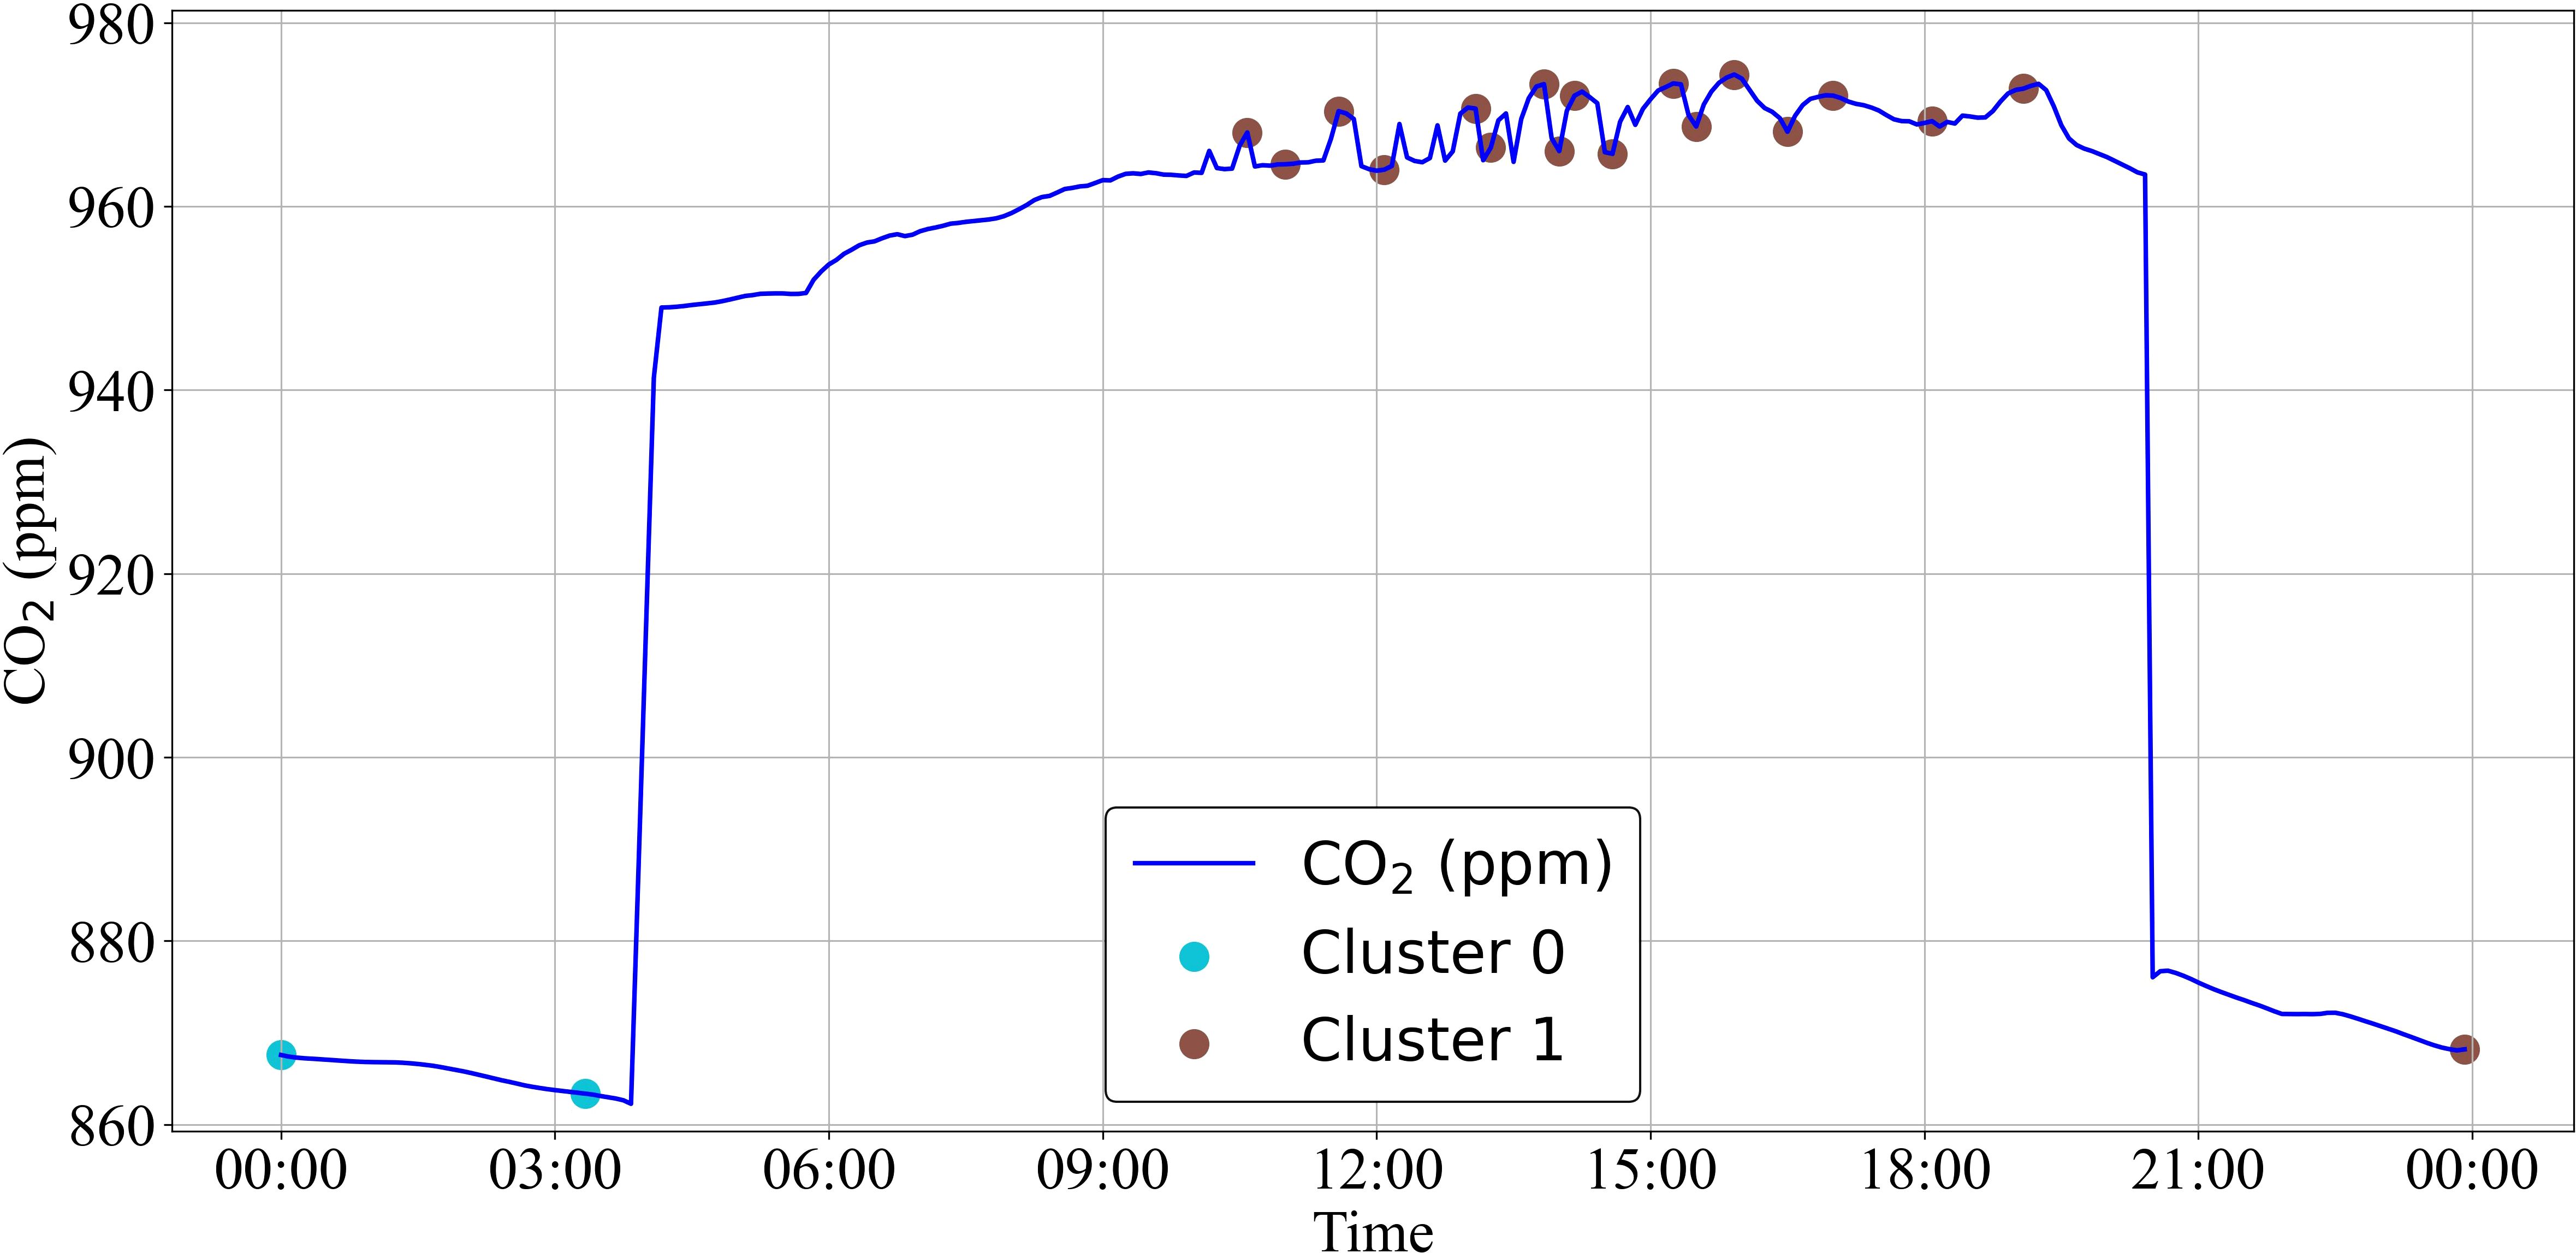
Figure 9. K-means clustering of CO2 reference trajectory with Gaussian smoothing from EVT.
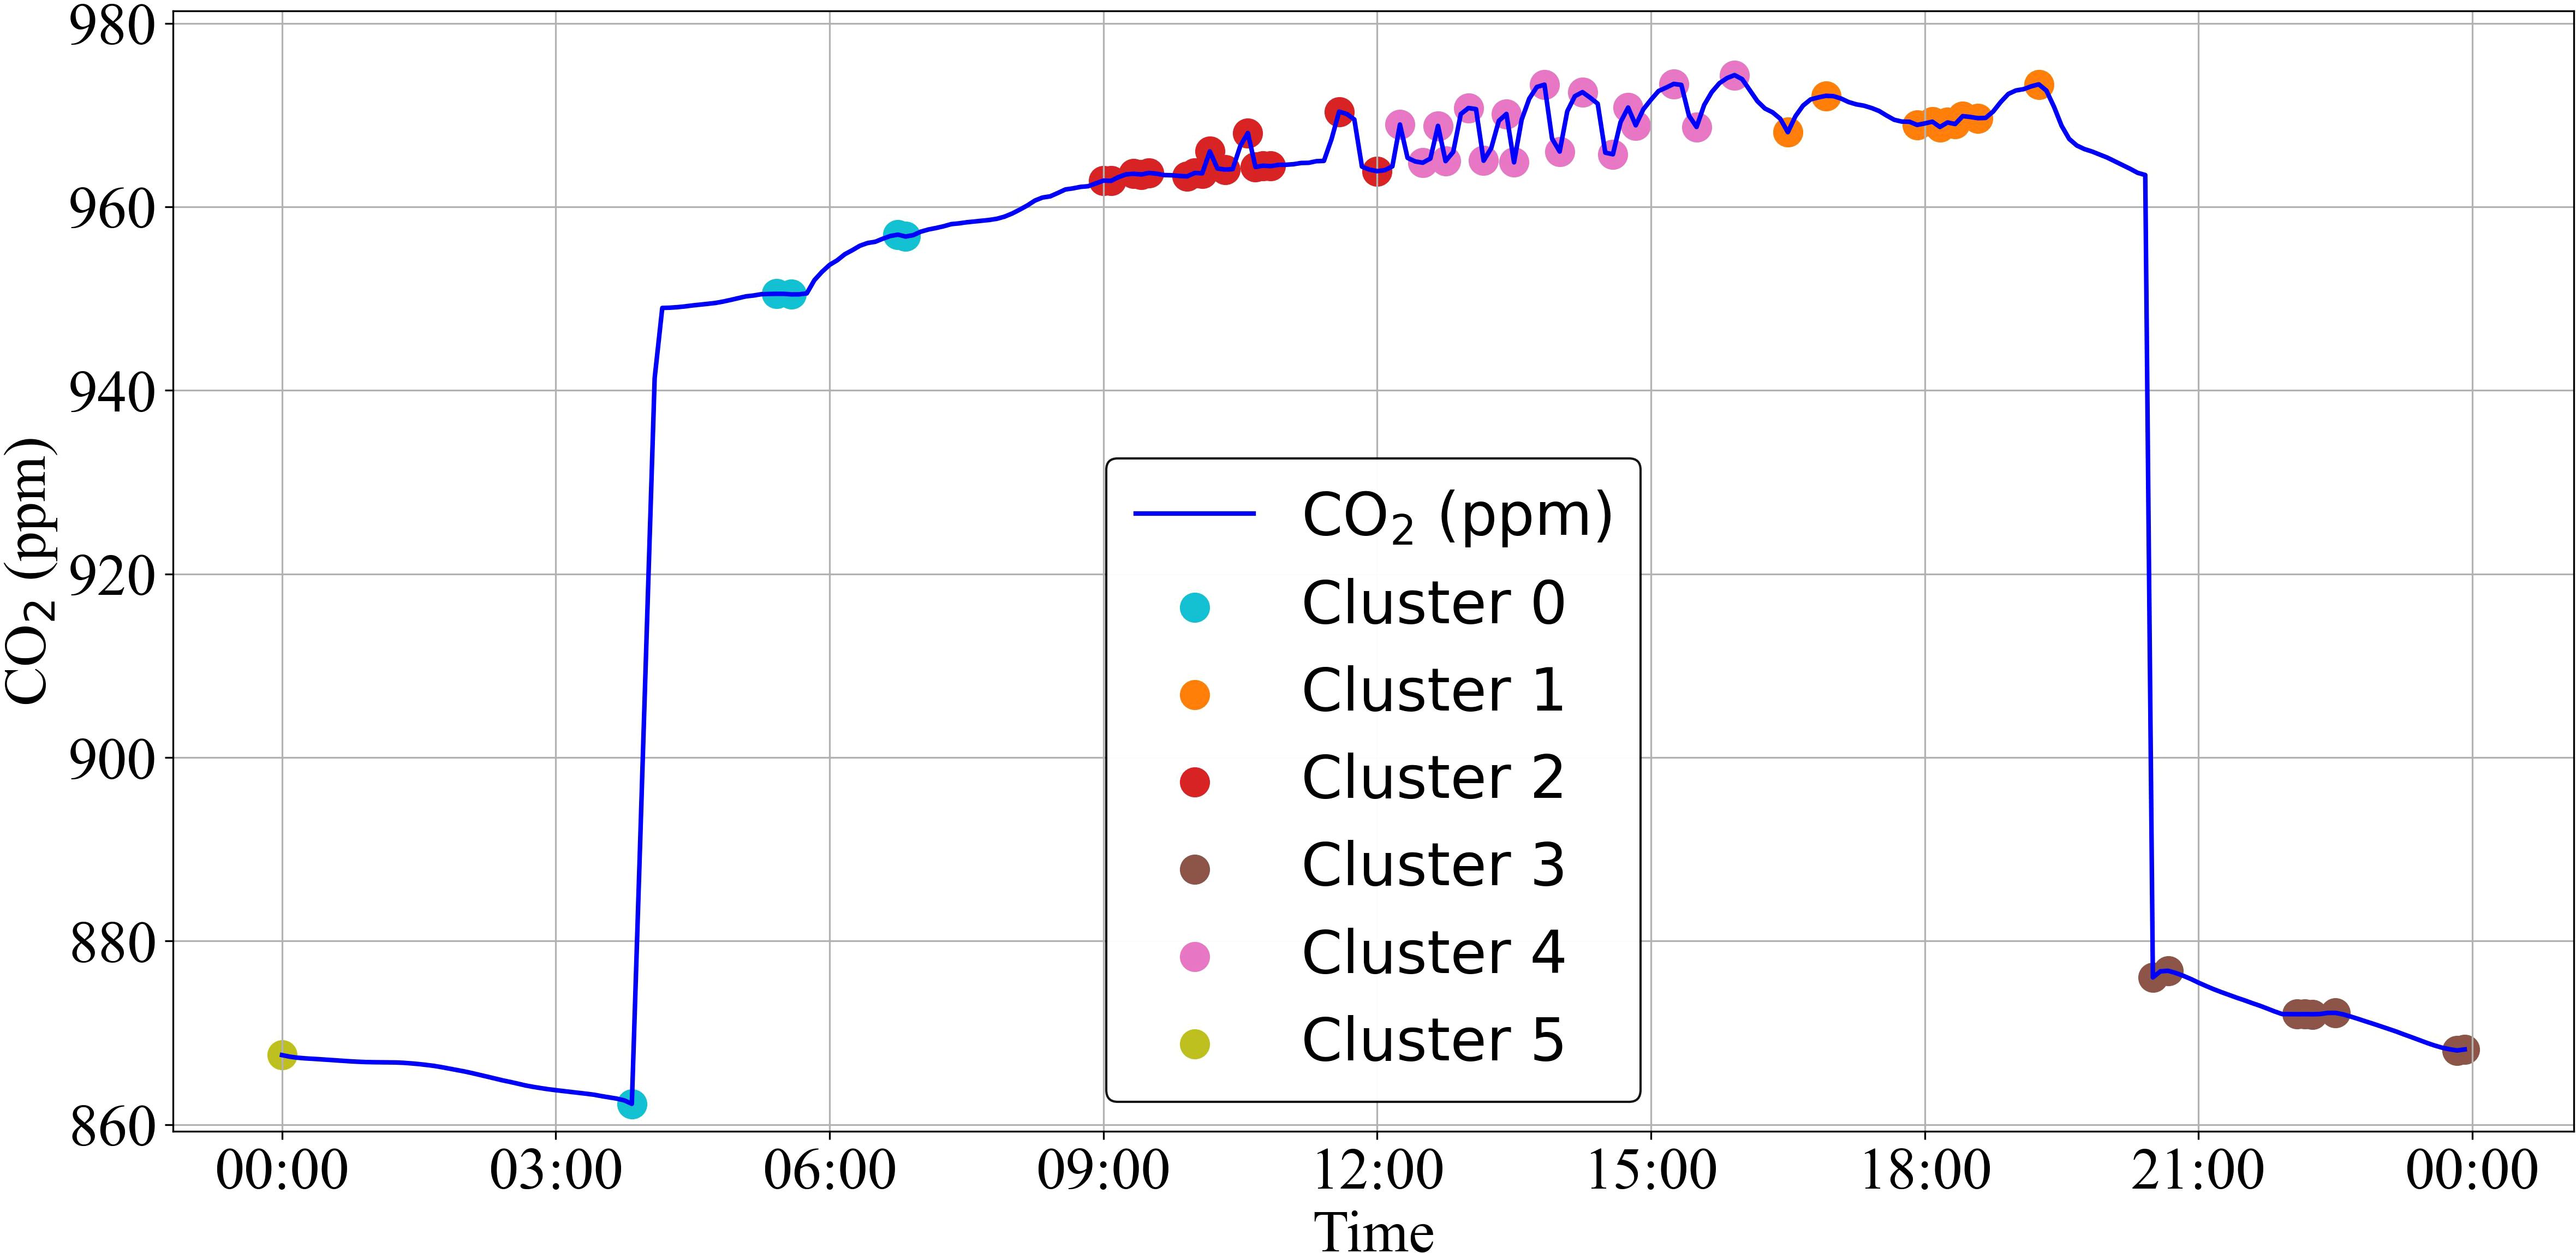
Figure 10. K-means clustering of CO2 reference trajectory without Gaussian smoothing from EVT.
The implementation of Gaussian smoothing led to a significant reduction in detected clusters. Quantitative analysis revealed that the filtered data using Gaussian smoothing decreased from 63 to 21 clusters in CO2 data, with temperature and relative humidity data exhibiting similar reductions in cluster numbers.
Finally, a combination approach of EVT with K-means clustering through an effective hybrid smoothing approach was developed to optimize the change point detection process, leveraging both Gaussian and non-Gaussian smoothing techniques (Figure 11). This hybrid approach maintained essential data characteristics while reducing noise, referred to here as fluctuations.
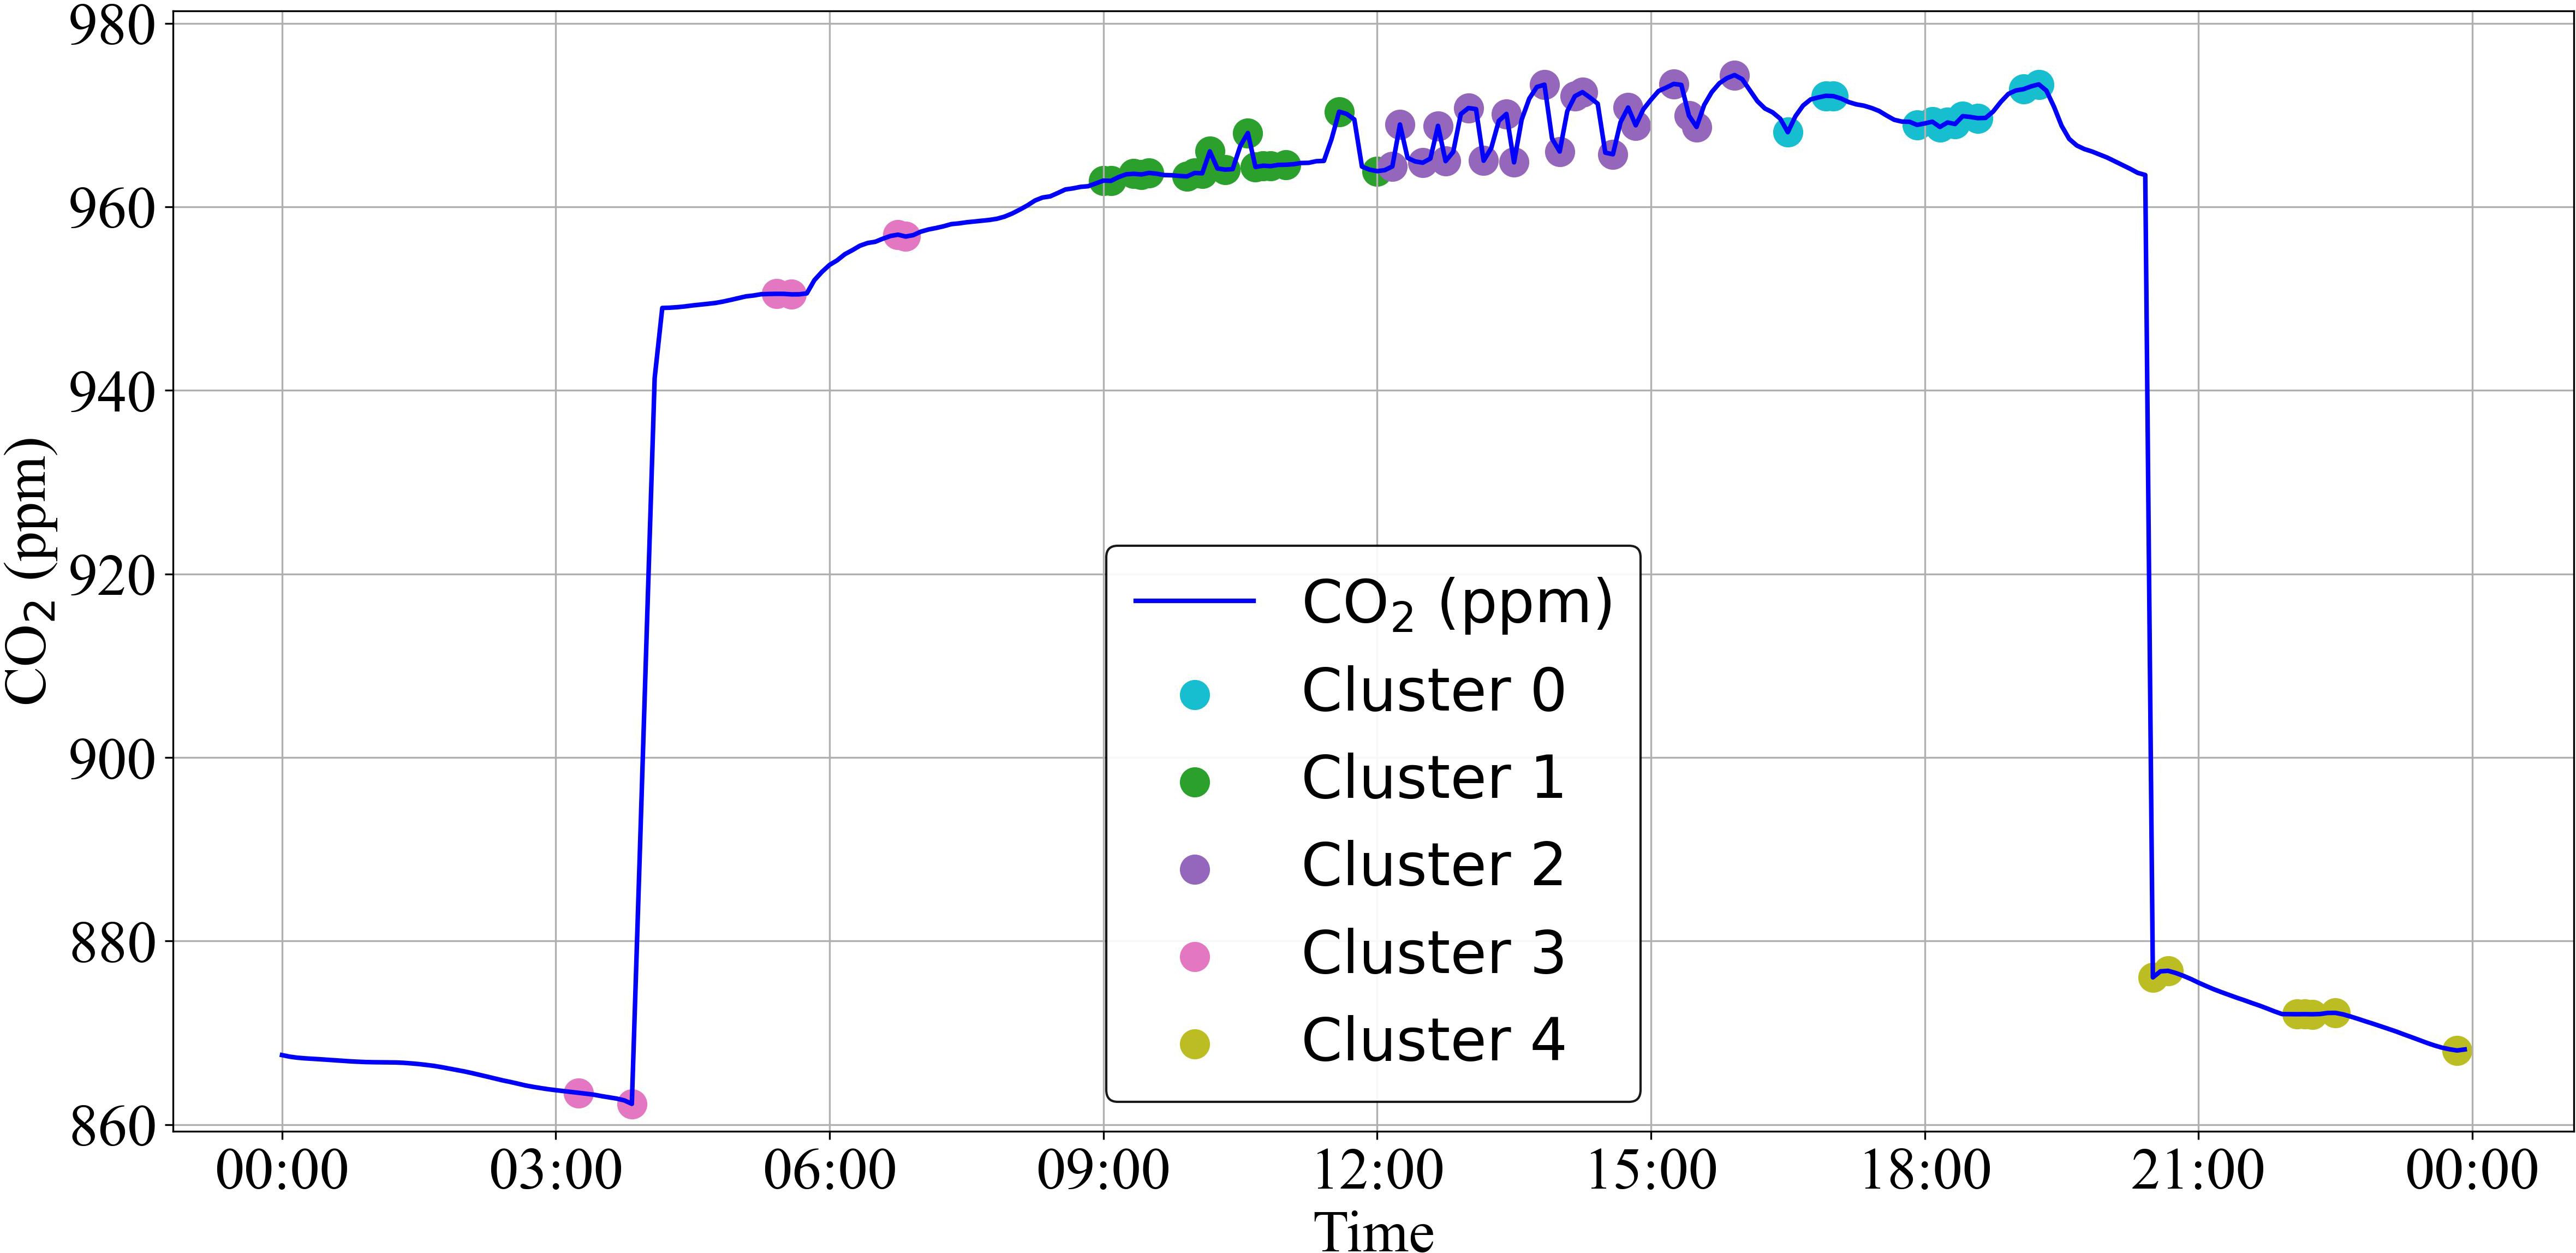
Figure 11. K-means clustering of CO2 reference trajectory with Gaussian and Non-gaussian smoothing.
The implementation process involved several key steps. First, K-means clustering was performed on the consolidated set of extreme points to identify multiple clusters representing different patterns and behaviors within the CO2 time series data. To refine these clustering results and eliminate redundant patterns, an additional optimization step was implemented: the pairwise Euclidean distance between all clusters was calculated, and clusters within 10% of the distance to their nearest neighbor were removed. This refinement process was crucial for obtaining a more concise and informative set of cluster representations while maintaining the integrity of distinct patterns.
The integration of the strengths of both smoothing methods resulted in an optimal balance being achieved in the identification of meaningful change points. This hybrid approach has been demonstrated to be particularly valuable for the management of tomato crops, where the detection sensitivity to different types of environmental changes is required. The filtered approach effectively captured major transitions crucial for overall tomato growth phases, such as day-night temperature shifts, while the unfiltered component preserved the detection of rapid fluctuations during peak photosynthetic periods and short-term humidity changes that could affect flower development and fruit set. This comprehensive detection capability was essential as tomatoes require precise environmental control during critical growth stages, where even brief environmental fluctuations can impact crop yield and quality.
The proposed hybrid approach enhanced the robustness of the clustering process and demonstrated potential adaptability to other greenhouse crops. The capacity to modify smoothing parameters and cluster thresholds renders it suitable for crops with divergent environmental sensitivities, such as lettuce or cucumbers, which exhibit distinct temperature and humidity requirements. This versatility in detection sensitivity could prove to be of particular value for greenhouse operations engaged in the cultivation of multiple crop varieties.
To evaluate the effectiveness of the different approaches, the supervised method PELT algorithm was compared with the combinational EVT and K-means clustering unsupervised method using F1 score. As shown in Table 4, the unsupervised combination approach performed better in capturing the peak trends across all the reference climate trajectories.
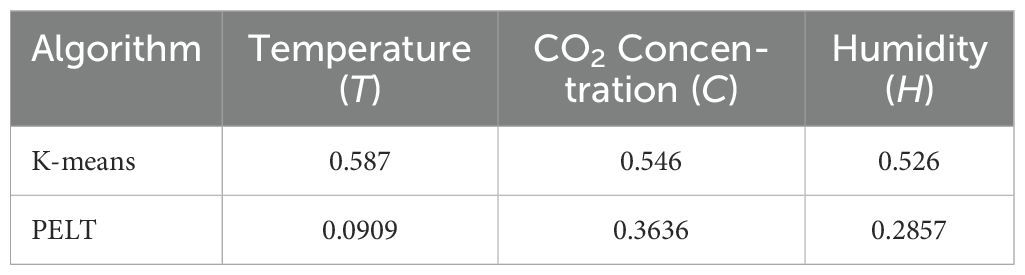
Table 4. F1 scores based on K-means clustering and PELT algorithm.
The features from the change point detection method were then mapped to our document planning framework and structured into coherent narratives. For CO2 data, the template included sections highlighting daily CO2 ranges and significant CO2 spikes or drops shown in Figure 12 and Box 1. Similarly, humidity and temperature level templates captured fluctuations using mappedfeaturename, and the second approach entailed adding annotated slope values to the document.
Box 1. NLG long narrative document for CO2 reference trajectory feature using unsupervised hybrid approach.
At the beginning of the day, the CO2 is 867.58 ppm.
From 00:00 to 03:10, the CO2 experiences a sharp decrease from 867.58 ppm to 863.57 ppm.
From 03:10 to 10:35, the CO2 experiences an exponential increase from 863.57 ppm to 968.04 ppm.
From 10:35 to 10:55, the CO2 experiences a sharp decrease from 968.04 ppm to 964.56 ppm.
From 10:55 to 11:35, the CO2 experiences a sharp increase from 964.56 ppm to 970.36 ppm.
From 11:35 to 12:10, the CO2 experiences a sharp decrease from 970.36 ppm to 964.40 ppm.
From 12:10 to 14:05, the CO2 experiences a sharp increase from 964.40 ppm to 970.41 ppm.
From 14:05 to 14:35, the CO2 experiences a sharp decrease from 970.41 ppm to 965.72 ppm.
From 14:35 to 15:55, the CO2 experiences a sharp increase from 965.72 ppm to 974.35 ppm.
From 15:55 to 16:30, the CO2 experiences a sharp decrease from 974.35 ppm to 968.12 ppm.
From 16:30 to 17:00, the CO2 experiences a sharp increase from 968.12 ppm to 972.05 ppm.
From 17:00 to 18:05, the CO2 experiences a sharp decrease from 972.05 ppm to 969.27 ppm.
From 18:05 to 19:05, the CO2 experiences a sharp increase from 969.27 ppm to 972.81 ppm.
From 19:05 to 23:55, the CO2 experiences an exponential decrease from 972.81 ppm to 868.19 ppm.
By the end of the day at 23:55, the CO2 will be 868.19 ppm, reflecting the last planned value.
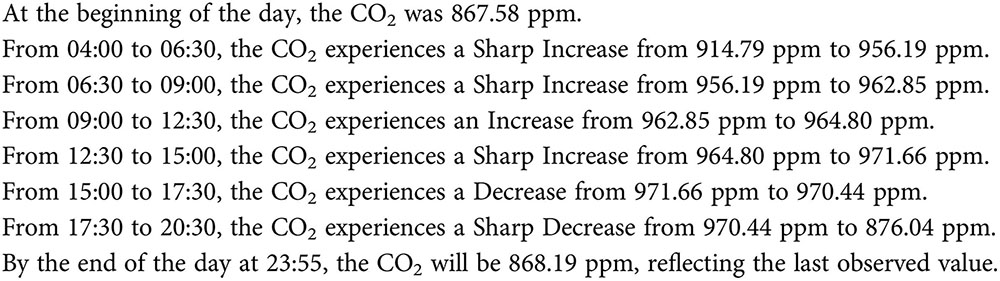
Figure 12. NLG long narrative document for CO2 reference trajectory feature using PELT algorithm.
Systematic analysis of each feature and data segmentation provided a comprehensive overview of greenhouse conditions, facilitating better understanding and decision-making. Due to space constraints, the detailed report focused on a single variable, CO2. However, the comprehensive report accommodated all features needed for summarizing results. The long narrative document was compared using the features and annotation values obtained from supervised and unsupervised methods.
A comparative analysis of the June 13, 2011 data revealed distinct differences between PELT and K-means detection capabilities. The PELT algorithm identified a CO2 peak at 971 ppm occurring from 12:30 to 15:00, while the K-means approach detected a peak at 974 ppm between 14:35 and 15:55. This variation in peak detection demonstrates the subtle differences in sensitivity between the two methodological approaches.
The function summarized the greenhouse conditions at each time of day, as shown in Boxes 2, 3. This summary highlights significant trends and variations in temperature, humidity, CO2 concentration, and estimated biomass levels.
Box 2. Summary results in GPT-4 using PELT algorithm.
On April 21, 2011, the greenhouse conditions varies throughout the day. The temperature rises from 14°C to 19°C between the start of the day and 18:30, after which it decreases to 16°C by 20:30 and further drop to 14°C by 23:55. CO2 levels experience an overall increase from 858 ppm to 966 ppm until 16:00, followed by a decrease to 859 ppm by the end of the day. Relative humidity decreases from 89% to 61% by 18:30, then sharply increases to 96% by 23:55. The biomass growth for the day is observed to be from 5 kg/m² to 6 kg/m².
On June 13, 2011, greenhouse conditions varies throughout the day. The temperature starts at 16°C, fluctuates mildly in the early hours, and then increases steadily until 13:00, reaching a peak of 21°C. It then decreases to 18°C by 21:30 and concludes the day at 16°C. CO2 levels begin at 867 ppm, experience sharp increases until 15:00, peaking at 971 ppm, then decrease sharply to 876 ppm by 20:30, ending the day at 868 ppm. Relative Humidity starts at 89%, exponentially decreases to 61% by 19:30, mildly increases to 70% by 22:00, and then exponentially increases to end the day at 96%. Biomass growth will be observed from 20 kg/m² to 21 kg/m² under these conditions.
Box 3. Summary results in GPT-4 using K-means clustering.
On May 24, 2011, the greenhouse conditions show significant fluctuations throughout the day. The temperature starts at 14°C and experiences various sharp and exponential increases and decreases, peaking at 19°C around midday before dropping back to 14°C by evening. CO2 levels begin at 786 ppm, see an initial sharp increase, and later fluctuate with several sharp increases and decreases, peaking at 965 ppm before declining to 859 ppm by nighttime. Relative humidity starts at 89%, with minor fluctuations, mostly maintaining around 89% to 89% throughout the day, making a final increase to 89% by night. Biomass shows a steady increase from 14 kg/m² to 14 kg/m², primarily rising between 04:20 and 19:40. These changes highlight the dynamic environmental conditions within the greenhouse, affecting plant growth and resource utilization.
On June 13, 2011, greenhouse conditions show significant fluctuations throughout the day. The temperature begins at 14°C and generally increases with sharp oscillations, peaking at 22°C before gradually declining to 16°C by late evening. CO2 levels start at 867 ppm, with peaks reaching 974 ppm and experiencing sharp increases and decreases throughout the day, ultimately decreasing to 868 ppm by the end of the day. Relative humidity shows minor fluctuations early on but saw a sharp drop from 89% to 60% between 18:30 and 20:20, then a recovery to 89% by late evening. Biomass will be initially stable at 20 kg/m², with a marked increase to 21 kg/m² by 20:05, indicating active growth during the day. These variations suggest dynamic climate control conditions impacting greenhouse plant growth.
The evaluation yielded promising results, with an average BERTScore of 0.82 across 50 randomly selected samples. The reported score reflects a high degree of semantic similarity between the detailed explanations and their corresponding summaries, indicating that the GPT-4 model effectively captures and condenses the essential information from the original text (OpenAI, 2023). The decimal points in the score were rounded off to enhance clarity and consistency in reporting.
The dynamic and interdependent nature of the greenhouse environment requires precise monitoring and analysis of variables to ensure optimal conditions for tomato crop growth. The reference trajectories generated using real-time weather data in the optimization problem revealed momentary spikes or fluctuations that cannot be dismissed as data noise, particularly given tomatoes’ sensitivity to environmental changes. These variations are critical, as they directly correspond to specific control actions and external weather conditions that affect crop development.
The comprehensive data ingestion process employed in this study enhanced the framework’s capability to conduct detailed analysis and generate language-based reports across multiple months, ensuring consistent and reliable input for the AI-supported climate monitoring system. CPD and trend analysis were crucial in identifying shifts in greenhouse climate trajectories, enabling timely interventions. Our research evaluated the performance of the CPD methods hybrid approach and the PELT algorithm in detecting significant changes across temperature, CO2, and relative humidity reference trajectories.
In the PELT algorithm, we considered the segmentation based on the F1 score, utilizing a penalty value of 10 and a jump value of 6. These parameters were selected through careful visualization of the data. As demonstrated in Figures 5, 6, and 7, this combination of parameters provides the most appropriate segmentation across temperature, CO2, and relative humidity reference trajectories. Our approach avoids overfitting by applying consistent parameters across these three climate variables.
In addition to the PELT algorithm, which demonstrated limitations in peak detection precision, we also explored unsupervised change point detection methods, K-means clustering, and EVT. The selection of EVT for our methodology was driven by its unique advantages in handling greenhouse planned reference trajectories. Unlike traditional CPD methods, EVT provides a theoretical framework for analyzing extreme values, which is particularly critical in greenhouse environments where sudden changes often represent meaningful events rather than disturbances.
Here, PELT overlooks these crucial short-term variations due to its focus on broader trends, while standard unsupervised clustering methods alone may be oversensitive to environmental noise. EVT’s mathematical framework distinguishes between meaningful environmental extremes (such as rapid ventilation changes or sudden CO2 fluctuations) and random variations. This distinction is particularly valuable for tomato greenhouse monitoring, where missing extreme events could compromise critical growth stages and overall crop management decisions. This capability of EVT becomes powerful when combined with K-means clustering in our hybrid approach.
While both individual methods showed distinct strengths, the hybrid approach combining K-means and EVT demonstrated better performance in comprehensive peak detection. This hybrid method successfully identified all peaks and lows, making it particularly appealing for robust environmental monitoring. However, the effectiveness of this approach varies depending on the data preprocessing techniques employed.
Our analysis of filtered (Figure 9) versus unfiltered data (Figure 10) approaches revealed important trade-offs in environmental monitoring. While Gaussian filtering improved computational efficiency through cluster reduction, it came with notable limitations. The filtered data frequently missed crucial short-term environmental fluctuations, particularly during rapid transitions in greenhouse conditions. Critical events such as momentary CO2 spikes due to ventilation, which are essential for greenhouse management, were often smoothed out in the filtered data.
Conversely, the unfiltered data analysis preserved these rapid transitions and short-term fluctuations, capturing the full range of environmental dynamics within the greenhouse. However, this approach resulted in more detected clusters, potentially including fluctuations and making pattern interpretation more challenging. We developed a combined strategy to leverage the advantages of filtered and unfiltered approaches while mitigating their limitations. The hybrid method integrated the baseline detection capabilities of filtered data with the sensitivity to rapid changes provided by unfiltered data.
Building on this combined technique, we performed K-means clustering on the consolidated set of extreme points, as shown in Figure 11. This approach allowed us to identify multiple clusters representing different patterns and behaviors within the CO2 time series data. The final clustering results provide a detailed and nuanced view of the CO2 time series data. By referencing Table 4 and examining the detailed visualization, we can conclusively argue that the K-means clustering approach offers more reliable and granular change point detection across temperature, CO2, and relative humidity reference trajectories compared to PELT algorithm. This improved detection capability has significant practical implications for crop management.
The effectiveness of our hybrid change point detection approach has particular significance for tomato cultivation. The method’s ability to detect rapid transitions is essential for tomato crops, which are notably sensitive to environmental fluctuations during critical growth stages. For instance, the precise detection of CO2 spikes and temperature variations directly impacts flower development and fruit set in tomatoes, where even short-term deviations can affect yield. The unfiltered data analysis proved especially valuable for capturing quick ventilation-related CO2 changes, which is crucial during pollination periods when optimal air movement enhances pollen distribution.
This methodology can be readily extended to other greenhouse crops with different environmental sensitivities. For leafy greens like lettuce, the system could be adjusted to focus more on humidity variations, as these crops are particularly susceptible to tip burn under rapidly changing humidity conditions. For cucumbers, which have different temperature optima than tomatoes, the change point detection parameters could be modified to align with their specific temperature requirements. The flexibility of the hybrid approach adopted here allows for the customization of detection sensitivities based on crop-specific thresholds and critical periods, such as flowering or fruit development stages.
By combining unsupervised trend detection and cluster separability optimization, we extracted comprehensive insights from the data as shown in the long narrative text in Section 3.3. Using supervised and unsupervised trend detection data, the generated long narrative report can inform our understanding of the underlying CO2 trajectory and captured details.
The effectiveness of our template-based approach in incorporating domain expertise and technical precision is evident in several aspects of our results: The detailed reports in Section 3.3 illustrate how our document planning framework successfully translated complex environmental data into domain specific narratives. The template structure ensured consistent reporting of CO2 measurements (e.g., 867 ppm) while maintaining accurate temporal resolution in the generated reports. Both the PELT algorithm and unsupervised hybrid approach narratives show consistent formatting in representing environmental measurements and time intervals, making the information readily interpretable for greenhouse operators.
Secondly, the templates incorporated domain-specific terminology and meaningful categorization of environmental changes. For instance, the narrative distinguished between different types of CO2 variations (“sharp decrease,” “exponential increase,” “sharp increase”) based on specific threshold values derived from research expertise. This categorization proves particularly valuable for tomato crop management, where different rates of environmental change can significantly impact crop development.
The template structure utilized effectively captured temporal precision, as evidenced by the consistent reporting of exact time intervals (e.g., “From 03:10 to 10:35”) and corresponding value changes. This temporal detail is essential for greenhouse operators to track and respond to environmental variations throughout the day. The templates’ capacity to preserve this level of detail while maintaining readability indicates their efficacy in balancing technical precision with practical utility.
Generative pretrained transformers, like GPT-4, tend to produce overly generalized outputs with basic instructions needing more adequate context (Luo et al., 2019). This phenomenon stems from training on vast and diverse textual datasets, leading to compilations of concepts from multiple sources and generic responses. Such behavior can be attributed to the “re-reading” technique, where models emulate human reading strategies by considering diverse interpretations of input (Xu et al., 2024; Yang et al., 2019).
This paper applied prompt engineering to address these challenges to generate concise, actionable summaries for greenhouse growers. The LLM extracted and emphasized key information directly relevant to decision-making needs by crafting clear and detailed prompts. This approach maintained semantic coherence while significantly reducing text length, demonstrating the potential for generating informative summaries of planned greenhouse climate.
The tailored approach reduced uncertainty and aligned text outputs, highlighting key trends in the climate reference trajectories from the MPC controller. The transfer of precise trend values from detection methods to narrative text enhanced the reliability of the summaries. These insights enable greenhouse operators to monitor and make informed decisions quickly.
While experimental results were encouraging, automated metrics like BERTScore have limitations in capturing the nuanced quality of generated summaries (Steinberger and Jezek, 2009). The current approach empowers growers to quickly grasp essential insights from reference trajectories, enhancing their understanding of advanced greenhouse climate control.
The proposed language support framework has demonstrated encouraging results in translating
MPC-generated trajectories into accessible text. However, it is imperative to address several significant limitations. A primary limitation resides in the system’s capacity to manage an augmentation of environmental variables. While the current implementation effectively processes core variables such as temperature, CO2, and humidity, the addition of more parameters (e.g. light intensity, soil moisture, nutrient levels, or ventilation rates) could exponentially increase the complexity of change point detection and narrative generation. This scalability challenge becomes particularly evident when describing the intricate interactions between multiple environmental parameters in real-time operations.
The framework’s automated metrics, primarily BERTScore, exhibit inherent limitations in evaluating the quality of generated summaries. While BERTScore provides a computational semantic similarity measure, it may not fully capture the nuanced requirements of greenhouse operations. For instance, the metric might assign high scores to technically accurate but practically less useful summaries or, conversely, undervalue summaries that experienced growers would find highly relevant. This limitation is further compounded when evaluating summaries that address intricate environmental interactions or abrupt climate transitions.
Furthermore, the current system faces challenges in prioritizing and contextualizing environmental changes when multiple variables exhibit significant variations simultaneously. In real-time greenhouse operations, concurrent fluctuations in multiple parameters may occur, making it difficult for the system to determine which changes are most critical for operational decision-making. This limitation can lead to information overload in the generated narratives, particularly during periods of high environmental dynamism.
These limitations highlight the need for future developments in several key areas:
1. The enhanced variable handling capabilities have been demonstrated to scale efficiently with an increasing number of environmental parameters while maintaining narrative clarity
2. The development of more sophisticated evaluation metrics that better align with the practical needs of greenhouse operations
3. The implementation of intelligent prioritization algorithms for multi-variable change point detection
4. The incorporation of domain-specific knowledge to improve the contextual relevance of generated summaries
In greenhouse farming, advanced control methods like MPC have demonstrated promising results in research settings. However, greenhouse operators have limited adoption of these methods due to their complexity and the communication barriers between researchers and practitioners (Saiz-Rubio and Rovira-Más, 2020). To address this gap, this study presented a language support framework that transforms the complex numerical data from planned MPC trajectories into readable text. The framework’s core is a robust data analysis process employing hybrid clustering to examine key climate variables such as temperature, humidity, and CO2 concentration. The unsupervised method effectively detected significant changes in the reference trajectories, capturing the nuances of data fluctuations without manual parameter tuning. Notably, the hybrid clustering approach demonstrated precision, completeness, and F1 score, indicating a reliable system that can accurately discern normal and abnormal momentary spikes and fluctuations. The subsequent document planning process then synthesizes this analyzed data into coherent narratives, further refined through GPT-4 generated summaries guided by predefined prompts.
While validated using tomato greenhouse data, where environmental fluctuations significantly impact crop development and yield, this language support system is not only confined to greenhouse farming but can be applied to any CEA farm, such as indoor farms, vertical farms, aquaponics, and insect farms, where climate control is essential. The framework’s adaptable nature allows for customization of detection parameters based on specific crop requirements and environmental sensitivities. Additionally, this framework can be utilized to analyze historical trajectories for quicker understanding and actionable insights.
Future research will focus on refining and expanding the applicability of the proposed language support framework across various CEA farms. The framework, initially developed for plants in greenhouses, can be extended to other facilities, such as vertical farms, and adapted for different plant species. One key direction is integrating real-time climate data analysis with predictive control systems tailored to specific crops. This enables precise regulation of temperature, humidity, and CO2 levels to enhance yield and quality. Another focus will be developing economic impact assessment tools to quantify the cost-effectiveness of advanced control strategies. These tools will provide greenhouse operators with actionable insights for decision-making.
Future research will prioritize comprehensive human evaluation methodologies to overcome the inherent limitations of automated metrics like BERTScore. We can validate the generated insights beyond computational measurements by engaging domain experts to assess summary quality, relevance, and practical utility. This human-centered approach ensures the summaries meet the greenhouse operator’s nuanced information needs.
Additionally, the research will investigate intuitive visualization methods, such as interactive dashboards, to complement textual explanations with dynamic, real-time representations of reference climate trajectories and system performance. These advancements will be coupled with automated feedback mechanisms that optimize trajectory settings based on operational outcomes. By bridging the gap between research advancements and practical implementation, the research aims to enhance greenhouse automation, improve resource efficiency, and simplify practitioners’ adoption of advanced control strategies.
The raw data supporting the conclusions of this article will be made available by the authors, without undue reservation.
RN: Methodology, Visualization, Writing – original draft, Writing – review & editing. KS: Writing – original draft, Writing – review & editing, Data curation, Project administration. NB: Supervision, Writing – review & editing. SS: Conceptualization, Supervision, Writing – review & editing.
The author(s) declare that no financial support was received for the research, and/or publication of this article.
We extend our heartfelt gratitude to Dr. Zuhal¨ Kurt for her invaluable support and guidance throughout the development of this paper. Her insightful feedback and encouragement were instrumental in shaping our work. We also wish to thank Morgan Uland for her meticulous proofreading and assistance in enhancing the readability of this manuscript.
The authors declare that the research was conducted in the absence of any commercial or financial relationships that could be construed as a potential conflict of interest.
The author(s) declare that no Generative AI was used in the creation of this manuscript.
All claims expressed in this article are solely those of the authors and do not necessarily represent those of their affiliated organizations, or those of the publisher, the editors and the reviewers. Any product that may be evaluated in this article, or claim that may be made by its manufacturer, is not guaranteed or endorsed by the publisher.
Aminikhanghahi S., Cook D. (2017). A survey of methods for time series change point detection. Knowledge Inf. Syst. 51, 339–367. doi: 10.1007/s10115-016-0987-z
PubMed Abstract | PubMed Abstract | Crossref Full Text | Google Scholar
Angeli C. (2004). Examining the effects of text-only and text-and-visual instructional materials on the achievement of field-dependent and field-independent learners during problem-solving with modeling software. Educ. Technol. Res. Dev. 52, 23–36. doi: 10.1007/BF02504715
Buşoniu L., de Bruin T., Tolíe D., Kober J., Palunko I. (2018). Reinforcement learning for control: Performance, stability, and deep approximators. Annu. Rev. Control 46, 8–28. doi: 10.1016/j.arcontrol.2018.09.005
Celikyilmaz A., Clark E., Gao J. (2020). Evaluation of text generation: A survey. ArXiv abs/2006, 14799. doi: 10.48550/arXiv.2006.14799
Chavez-Demoulin V., Davison A. (2012). Modelling the time series extremes. Revstat Stat. J. 10, 109–133. doi: 10.57805/revstat.v10i1.113
Chen W.-H., You F. (2022). Semiclosed greenhouse climate control under uncertainty via machine learning and data-driven robust model predictive control. IEEE Trans. Control Syst. Technol. 30, 1186–1197. doi: 10.1109/TCST.2021.3094999
Chinchor N. (1992). “MUC-4 evaluation metrics,” in Fourth Message Understanding Conference (MUC-4): Proceedings of a Conference Held in McLean, Virginia, June 16-18, 1992. (McLean, Virginia: Association for Computational Linguistics). doi: 10.3115/1072064.1072067
Coles S. (2001). An introduction to statistical modeling of extreme values. London: Springer London, 1–17. doi: 10.1007/978-1-4471-3675-01
Devineni S. K. (2024). AI-enhanced data visualization: Transforming complex data into actionable insights. J. Technol. Syst. 6, 52–77. doi: 10.47941/jts.1911
Gatt A., Krahmer E. (2018). Survey of the state of the art in natural language generation: core tasks, applications and evaluation. J. Artif. Int. Res. 61, 65–170. doi: 10.1613/jair.5477
Goldberg E., Driedger N., Kittredge R. (1994). Using natural-language processing to produce weather forecasts. IEEE Expert 9, 45–53. doi: 10.1109/64.294135
Hansen A. (2020). The three extreme value distributions: An introductory review. Front. Phys. 8. doi: 10.3389/fphy.2020.604053
Hearst M. A. (2023). Show it or tell it? Text, visualization, and their combination. Commun. ACM 66, 68–75. doi: 10.1145/3593580
Hemming S., Zwart F., Elings A., Petropoulou A., Righini I. (2020). Cherry tomato production in intelligent greenhouses—sensors and ai for control of climate, irrigation, crop yield, and quality. Sensors 20, 6430. doi: 10.3390/s20226430
PubMed Abstract | PubMed Abstract | Crossref Full Text | Google Scholar
Iddio E., Wang L., Thomas Y., McMorrow G., Denzer A. (2020). Energy efficient operation and modeling for greenhouses: A literature review. Renewable Sustain. Energy Rev. 117, 109480. doi: 10.1016/j.rser.2019.109480
Jain A. (2010). Data clustering: 50 years beyond K-means. Pattern Recognition Lett. 31, 651–666. doi: 10.1016/j.patrec.2009.09.011
Kamilaris A., Prenafeta-Boldú F. X. (2018). Deep learning in agriculture: A survey. Comput. Electron. Agric. 147, 70–90. doi: 10.1016/j.compag.2018.02.016
Kawahara Y., Sugiyama M. (2011). Sequential change-point detection based on direct density-ratio estimation. Stat. Anal. Data Min. 5, 114–127. doi: 10.1002/sam
Killick R., Fearnhead P., Eckley I. A. (2012). Optimal detection of changepoints with a linear computational cost. J. Am. Stat. Assoc. 107, 1590–1598. doi: 10.1080/01621459.2012.737745
Luo L., Ao X., Song Y., Li J., Yang X., He Q., et al. (2019). “Unsupervised neural aspect extraction with sememes,” in Proceedings of the Twenty-Eighth International Joint Conference on Artificial Intelligence, IJCAI-19. (Madrid, Spain: International Joint Conferences on Artificial Intelligence Organization), 5123–5129. doi: 10.24963/ijcai.2019/712
Mamatha H., Rao N., Hunashikatti L., Shivashankara K., Bhatt R., Pavithra K. (2014). Impact of elevated CO2 on growth, physiology, yield, and quality of tomato (Lycopersicon esculentum Mill) cv. arka ashish. Photosynthetica 52, 519–528. doi: 10.1007/s11099-014-0059-0
Moratiel R., Jimenez R., Mate M., Ibánez M. A., Moreno M. M., Tarquis A. M. (2023). Net CO2 assimilation rate response of tomato seedlings (Solanum lycopersicum L.) to the interaction between light intensity, spectrum and ambient CO2 concentration. Front. Plant Sci. 14. doi: 10.3389/fpls.2023.1327385
PubMed Abstract | PubMed Abstract | Crossref Full Text | Google Scholar
Morcego B., Yin W., Boersma S., van Henten E., Puig V., Sun C. (2023). Reinforcement Learning versus Model Predictive Control on greenhouse climate control. Comput. Electron. Agric. 215, 108372. doi: 10.1016/j.compag.2023.108372
OpenAI (2023). GPT-4 technical report. (San Francisco, California: arXiv). Available online at: https://openai.com/index/gpt-4-research/.
Padmanabha M., Beckenbach L., Streif S. (2020). Model predictive control of a food production unit: A case study for lettuce production. IFAC-PapersOnLine 53, 15771–15776. doi: 10.1016/j.ifacol.2020.12.204
Parliament E., for Parliamentary Research Services, D.G, De Baerdemaeker J. (2023). Artificial intelligence in the agri-food sector – Applications, risks and impacts (European Parliament). doi: 10.2861/516636
Pedregosa F., Varoquaux G., Gramfort A., Michel V., Thirion B., Grisel O., et al. (2011). Scikit-learn: Machine learning in python. J. Mach. Learn. Res. 12, 2825–2830.
Perona P., Malik J. (1990). Scale-space and edge detection using anisotropic diffusion. IEEE Trans. Pattern Anal. Mach. Intell. 12, 629–639. doi: 10.1109/34.56205
Plachouras V., Smiley C., Bretz H., Taylor O., Leidner J. L., Song D., et al. (2016). “Interacting with financial data using natural language,” in Proceedings of the 39th International ACM SIGIR Conference on Research and Development in Information Retrieval. (New York, NY, USA: Association for Computing Machinery), 1121–1124. doi: 10.1145/2911451.2911457
Rangaswamy T. C., Sridhara S., Ramesh N., Gopakkali P., El-Ansary D. O., Mahmoud E. A., et al. (2021). Assessing the impact of higher levels of CO2 and temperature and their interactions on tomato (Solanum lycopersicum L.). Plants (Basel) 10, 256. doi: 10.3390/plants10020256
PubMed Abstract | PubMed Abstract | Crossref Full Text | Google Scholar
Rawlings J. B., Mayne D. Q., Diehl M. (2017). Model predictive control: theory, computation, and design Vol. 2. (Santa Barbara, California, USA: Nob Hill Publishing Madison, WI). Available online at: https://books.google.de/books?id=MrJctAEACAAJ.
Raza H., Prasad G., Li Y. (2015). EWMA model based shift-detection methods for detecting covariate shifts in non-stationary environments. Pattern Recognition 48, 659–669. doi: 10.1016/j.patcog.2014.07.028
Saiz-Rubio V., Rovira-Más F. (2020). From smart farming towards agriculture 5.0: A review on crop data management. Agronomy 10. doi: 10.3390/agronomy10020207
Sánchez-Guerrero M. C., Lorenzo P., Medrano E., Castilla N., Soriano T., Baille A. (2005). Effect of variable co2 enrichment on greenhouse production in mild winter climates. Agric. For. meteorology 132, 244–252. doi: 10.1016/j.agrformet.2005.07.014
Sathyanarayanan K. K., Sauerteig P., Streif S. (2024). Deep neural network based optimal control of greenhouses. 2024 Eur. Control Conf. (ECC). doi: 10.23919/ECC64448.2024.10591283
Scott D., Hallett C., Fettiplace R. (2013). Data-to-text summarisation of patient records: Using computer-generated summaries to access patient histories. Patient Educ. Couns. 92, 153–159. doi: 10.1016/j.pec.2013.04.019
PubMed Abstract | PubMed Abstract | Crossref Full Text | Google Scholar
Searchinger T., Hanson C., Ranganathan J., Lipinski B., Waite R., Winterbottom R., et al. (2014). Creating a sustainable food future. A menu of solutions to sustainably feed more than 9 billion people by 2050: World resources report 2013-14: interim findings. (Washington, D.C., USA: World Resources Institute), 154.
Shanahan M., McDonell K., Reynolds L. (2023). Role play with large language models. Nature 623, 493–498. doi: 10.1038/s41586-023-06647-8
PubMed Abstract | PubMed Abstract | Crossref Full Text | Google Scholar
Sharifi S., Hendry M., Macciotta R., Evans T. (2022). Evaluation of filtering methods for use on high-frequency measurements of landslide displacements. Natural Hazards Earth System Sci. 22, 411–430. doi: 10.5194/nhess-22-411-2022
Sharma M., Brownstein J. S., Ramakrishnan N. (2021). “T3: Domain-agnostic neural timeseries narration,” in 2021 IEEE International Conference on Data Mining (ICDM). (Los Alamitos, California, USA: IEEE Computer Society), 1324–1329. doi: 10.1109/ICDM51629.2021.00165
Steinberger J., Jezek K. (2009). Evaluation measures for text summarization. Computing Inf. 28, 251–275.
Tripathi D., Tamrakar A. (2018). Natural language generation: Algorithms and applications. Turkish J. Comput. Mathematics Educ. (TURCOMAT) 9, 1394–1399. doi: 10.61841/turcomat.v9i3.14597
Truong C., Oudre L., Vayatis N. (2020). Selective review of offline change point detection methods. Signal Process. 167, 107299. doi: 10.1016/j.sigpro.2019.107299
Van Beveren P., Bontsema J., Van Straten G., Van Henten E. (2015). Minimal heating and cooling in a modern rose greenhouse. Appl. Energy 137, 97–109. doi: 10.1016/j.apenergy.2014.09.083
Van Straten G., Van Willigenburg L., Van Henten E., Van Ooteghem R. (2010). Optimal control of greenhouse cultivation. (Boca Raton, Florida, USA: CRC Press). doi: 10.1201/b10321
Wang Y., Li G., Li K., Yuan H. (2022). A deep generative model for trajectory modeling and utilization. Proc. VLDB Endow. 16, 973–985. doi: 10.14778/3574245.3574277
Warren Liao T. (2005). Clustering of time series data-a survey. Pattern Recogn. 38, 1857–1874. doi: 10.1016/j.patcog.2005.01.025
Wei J., Wang X., Schuurmans D., Bosma M., hsin Chi E. H., Xia F., et al. (2022). Chain of thought prompting elicits reasoning in large language models. ArXiv abs/2201, 11903.
Wei S., Xie Y. (2023). Online kernel CUSUM for change-point detection. arXiv preprint arXiv:2211.15070. doi: 10.48550/arXiv.2211.15070
Xu X., Tao C., Shen T., Xu C., Xu H., Long G., et al. (2024). “Re-Reading improves reasoning in large language models,” in Proceedings of the 2024 Conference on Empirical Methods in Natural Language Processing. (Miami, Florida, US: Association for Computational Linguistics), 15549–15575.
Yang M., Qu Q., Tu W., Shen Y., Zhao Z., Chen X. (2019). Exploring human-like reading strategy for abstractive text summarization. Proc. AAAI Conf. Artif. Intell. 33, 7362–7369. doi: 10.1609/aaai.v33i01.33017362
Zarnescu A., Ungurelu R., Varzaru G. (2019). “Controlling the temperature and humidity in a greenhouse,” in 2019 IEEE 25th International Symposium for Design and Technology in Electronic Packaging (SIITME). (Cluj-Napoca, Romania: IEEE), 168–171.
Keywords: large language models, model predictive control, natural language generation, prompt engineering, time-series to text
Citation: Naagarajan RA, Sathyanarayanan KK, Bauer N and Streif S (2025) Automated analysis and textual summarization of time-varying references in advanced greenhouse climate control. Front. Agron. 7:1536998. doi: 10.3389/fagro.2025.1536998
Received: 29 November 2024; Accepted: 12 February 2025;
Published: 25 March 2025.
Edited by:
Marco Sozzi, University of Padua, ItalyReviewed by:
Bruno Condori, Universidad Pública de El Alto, BoliviaCopyright © 2025 Naagarajan, Sathyanarayanan, Bauer and Streif. This is an open-access article distributed under the terms of the Creative Commons Attribution License (CC BY). The use, distribution or reproduction in other forums is permitted, provided the original author(s) and the copyright owner(s) are credited and that the original publication in this journal is cited, in accordance with accepted academic practice. No use, distribution or reproduction is permitted which does not comply with these terms.
*Correspondence: Stefan Streif, c3RlZmFuLnN0cmVpZkBldGl0LnR1LWNoZW1uaXR6LmRl
Disclaimer: All claims expressed in this article are solely those of the authors and do not necessarily represent those of their affiliated organizations, or those of the publisher, the editors and the reviewers. Any product that may be evaluated in this article or claim that may be made by its manufacturer is not guaranteed or endorsed by the publisher.
Research integrity at Frontiers
Learn more about the work of our research integrity team to safeguard the quality of each article we publish.