 Hannah L. Rusch
 Mitchell C. Hunter
 Alan Kraus
 Nicole E. Tautges3
 Jacob M. Jungers
94% of researchers rate our articles as excellent or good
Learn more about the work of our research integrity team to safeguard the quality of each article we publish.
Find out more
ORIGINAL RESEARCH article
Front. Agron., 10 April 2025
Sec. Agroecological Cropping Systems
Volume 7 - 2025 | https://doi.org/10.3389/fagro.2025.1534962
This article is part of the Research TopicAgroecological Practices To Enhance Resilience Of Farming SystemsView all 11 articles
Introduction: Intermediate wheatgrass [Thinopyrum intermedium (Host) Barkworth & D.R. Dewey] (IWG) is a novel perennial grain crop with the potential for dual use (DU) in a system that includes the harvest of summer grain and straw as well as the grazing of crop regrowth. This could diversify grower income streams but impacts on productivity and profitability of DU systems need evaluation.
Methods: A 4-year on-farm trial was conducted in Minnesota, USA comparing yields and net revenue of a grain+straw production system (GP) vs. a DU system. For both the GP and DU systems, the grain and straw yields from the summer harvest were evaluated, the subsequent IWG regrowth was measured in the fall and again in spring to quantify forage production and nutritive value, and the economic value of grain, straw, and forage were calculated. In the DU system, the herbage intake and forage utilization were also studied.
Results and discussion: The GP system produced 42% more grain and 41% more straw than the DU system in year 2 but both systems produced similar grain and straw yields in year 3. The DU system produced greater grain yields than the GP in year 4. Across systems, the forage yield peaked in year 3. Both agronomic systems generally displayed similar forage yields of comparable nutritive value. Crude protein (CP) in fall and spring forage averaged 140 to 150 g kg-1 whereas CP was 30 g kg-1 in the summer straw, comparable to common annual small grains. The relative feed value of IWG forage in the fall was 100 and 127 in spring compared with 80 in the summer. The sale of higher year 2 grain yields in the GP system led to this system earning a net return to the enterprise of $721 ha-1 yr-1 with the DU system producing $609 ha-1 yr-1. In conclusion, grazing IWG can take advantage of on-farm forage resources to generate revenue but waiting to begin grazing until after the second-year grain harvest may reduce the risk of grain and straw yield losses to enhance net returns to the enterprise.
Intermediate wheatgrass [Thinopyrum intermedium (Host) Barkworth & D.R. Dewey] (IWG) is a cool-season perennial grass in development as a perennial grain crop. Initially introduced into the U.S. as a forage crop, IWG provides multiple ecosystem services, including continuous living ground cover that prevents soil erosion (Kantar et al., 2016) as well as extensive rooting systems with the potential to accrue soil C (van der Pol et al., 2022) and reduce soil nitrate leaching (Jungers et al., 2019; Reily et al, 2022). Yet, adoption of a new perennial grain crop that provides environmental benefits and meets demand for sustainable food products also introduces economic risks to the farmer. Compared with conventional annual grains like wheat (Triticum aestivum L.), IWG produces lower grain yields. Studies in Michigan and New York reported that IWG produced 4.5%, 17%, and 33% as much grain as annual wheat (Law et al., 2022; Culman et al., 2023). Furthermore, a lack of crop insurance, consistent market demand, and accessible supply chain infrastructure for new crops disincentivizes production and stymies industry. However, identification of a secondary revenue stream from a new crop, such as forage in the case of IWG, can mitigate these economic barriers and facilitate the expansion of new crops.
Unlike annual crops that require planting each year, the perenniality of IWG enables vegetative growth early in the spring and late into the fall when annual fields lie fallow. Managing this vegetative growth for forage or hay production can generate additional revenue in a grain-type IWG operation (Hunter et al., 2020b). The relative value of forage in the system may increase over time since IWG grain yields (and thus sales) decline as the stand matures, so forages may contribute a greater portion of total revenues (Zhen et al., 2024). Additionally, the crop residue at grain harvest can be sold as straw for animal bedding or mixed into rations for beef or dairy cow feed. Thus, IWG vegetation could be commercialized as forage for feed or fodder up to three times per year, once in the spring, once in summer, and once in the fall. A Wisconsin study reported that forage economic value of IWG accounted for up to 40% of the potential total revenue in a dual use (DU) system that produced both grain+straw and forage (Pinto et al., 2022). The latter highlights the potential productive and economic contribution of forage in DU systems, which may improve on-farm resource use efficiency and profitability compared with grain+straw production (GP) systems, at least until grain yields are improved through breeding efforts.
Several recent studies investigated the production and profitability of grain-type IWG for DU production of grain+straw and hay (Culman et al., 2023; Law et al., 2022, Law et al., 2021; Hunter et al., 2020a, Hunter et al., 2020b). Across nine North American locations, an IWG DU system with a fall hay harvest led to greater grain yields than in the GP system with only a summer grain+straw harvest, although a spring (instead of a fall) hay harvest reduced the grain yield (Culman et al., 2023). In Minnesota, researchers studying three grain-type IWG DU systems with different hay harvest frequencies (spring only, fall only, and spring+fall) did not observe grain or straw yield declines in fall only and spring+fall DU systems compared with the control system (i.e., no hay harvest) while the spring only DU system sometimes reduced summer grain and straw yields because stands did not fully recover following May defoliation to produce grain to their highest potential (Hunter et al., 2020a; Hunter et al., 2020b). Fall only and spring+fall DU systems reported similar total forage (straw + hay), which were greater than the total forage yield in spring only DU system and in the control system (Hunter et al., 2020b). These studies underscore the variable effect of hay harvests on grain and forage yields in IWG DU systems.
In terms of nutritive value, IWG produces forage of comparable quality to barley (Hordeum vulgare L.), oat (Avena sativa L.), or wheat. The crude protein (CP) of IWG cut for hay ranged from 105 to 132 g kg-1 in fall and 195 to 288 g kg-1 in the spring (Hunter et al., 2020b) compared with the CP of mature oat and spring barley harvested approximately 100 days after planting, which were 109 g kg-1 and 105 g kg-1 in a study conducted in Turkey (Kocer and Albayrak, 2012). Similar values were reported for oat and barley cut for forage at the hard dough stage, which had CP values of 112 and 103 g kg-1, respectively (Pursley et al., 2020). The relative feed value (RFV) of IWG cut for hay ranged from 89 to 107 in the fall and 147 to 161 in the spring (Hunter et al., 2020b) compared with RFV of 97 for oat, 85 for barley, and 88 for wheat at the milk dough stage (Yavuz and Gulumser, 2022). The RFV of IWG straw harvested in the summer along with grain ranged from 57 to 70 (Hunter et al., 2020b) whereas the RFV of wheat straw was reported at 47 elsewhere (Kaithwas et al., 2020). Using RFV as a predictor in a model trained on recent hay sales, Hunter et al. (2020b) predicted the sale prices of the three types of forage (straw and hay). These prices reflected the same seasonal ranking, however, the summer straw produced three to four times as much biomass as the spring and fall hay harvests (Hunter et al., 2020b). So, straw was a more valuable product than the more nutritious but less abundant hay. Nonetheless, IWG regrowth in the spring and fall provides a source of highly nutritious forage at a time of limited forage resources and an additional income stream.
The literature on DU systems for grain and hay highlights potential tradeoffs between these and GP systems. Considering that important differences exist in the defoliation method of forage managed for hay (homogeneous) vs. grazing (heterogeneous) there may be limitations to the application of the results from one type of management to the other. Thus, the present study compared the productive and economic potential of a grain-type IWG system for GP vs. a DU system involving a summer grain+straw harvest and grazing of IWG regrowth in the fall and spring. The objectives were to evaluate the grain, straw, and forage yields; harvest index; nutritive value; and enterprise budgets of these two agronomic systems, as well as the herbage intake (HI) and forage utilization (FU) of the DU system. It was hypothesized that 1) the DU system would produce as much or more grain and straw than the GP system, although yields were expected to decline with increasing stand age in both systems, 2) the DU system would produce greater forage yields than the GP system, 3) fall would produce greater forage yields and have greater HI and FU than spring, 4) forage CP and RFV would be greater in spring and fall compared with summer straw, thus DU system would have superior nutritive value overall than the GP system, and 5) the DU system would be as profitable or more profitable than the GP system given the additional revenue stream from grazing.
A four-year on-farm trial was conducted from September 2018 to August 2022 near Goodhue, Minnesota, USA (44°24′02″N, 92°37′26″W; 335 m.a.s.l.) to compare the production and profitability of an IWG GP system (ungrazed control) with a DU system of IWG for both grain+straw and grazing. The soil was mapped as a Knox silt loam (fine-silty, mixed, superactive, mesic Mollic Hapludalfs). Soil tests in September 2018 indicated that N, P and K levels were more than adequate at the 0-15 cm depth and averaged 27, 52 and 419 ppm, respectively. Soil pH was 7.4 and OM 3.7%. Monthly minimum and maximum air temperature and total precipitation data were collected from the nearest National Weather Service Reporting Station in Zumbrota, Minnesota, US (44°17′59′N, -92°39′56″W; 344 m.a.s.l.; Minnesota Department of Natural Resources, 2025). Missing weather data points were supplemented with time series data from the Oregon State University PRISM Climate Group for Goodhue county, Minnesota, US (44°24′36′′N, -92°43′21″W; 359 m.a.s.l.; PRISM Climate Group, 2025).
The study was established as a completely randomized design consisting of three replications with the two agronomic systems (GP and DU) represented in each. Each replication was a 0.8 ha paddock with an exclosure area approximately 60 m2. Electric fencing was used to create the exclosure area for the ungrazed control treatment (GP system). The remainder of each paddock was assigned to the DU treatment to allow grazing cattle access to forage in the fall and spring each year.
The entire experimental area was previously a mixed species grass pasture, which was terminated on September 2, 2018 with glyphosate applied at labeled rates. Seed from an advanced breeding population of grain-type IWG procured from the University of Minnesota breeding program was planted in rows 19cm apart at a seeding rate of 20 kg pure live seed ha-1 using a no-till drill on September 10, 2018. By spring 2019, the IWG was well established. Herbicide was applied on July 3, 2019 using 2,4-D at labeled rates for a perennial grass. For fertility management, 18,927 L ha-1 of liquid dairy manure was applied each summer. This fertilization, which was repeated in the spring and summer of years 3 and 4, supplied approximately 45 kg N ha-1 yr-1, 23 kg P ha-1 yr-1, and 45 kg K ha-1 yr-1. The DU treatment may also have benefited from cattle urine and manure deposition during the grazing period.
The first data collection occurred with grain and straw harvest on August 23, 2019, approximately one year after establishing IWG. Hereafter year refers to the IWG stand age in years after establishment beginning in the fall (September) and ending in the summer of the subsequent calendar year (August; Figure 1). One subsample of grain and straw per experimental unit was collected by hand using a 0.5 m2 quadrat prior to production-scale grain harvesting in July/August each year. In the hand harvest, seed heads were separated from the stems and leaves in the subsample, the grain, stems and leaves were then weighed, dried at 60°C, and straw dry matter yields recorded. Grain was threshed from seed heads using a laboratory thresher (Wintersteiger LD-50), aspirated to remove chaff, and weighed to determine grain dry matter yield. Grain samples were about 80% dehulled. Summer experimental grain and straw yields reported are from the hand harvested subsamples. Grain and straw yields from hand-harvested quadrats are referred to hereafter as “experimental” to differentiate these yield estimates from those derived during the production-scale harvest by the producer. The harvest index was calculated as the dry grain weight divided by the sum of the dry grain weight plus the dry straw weight.
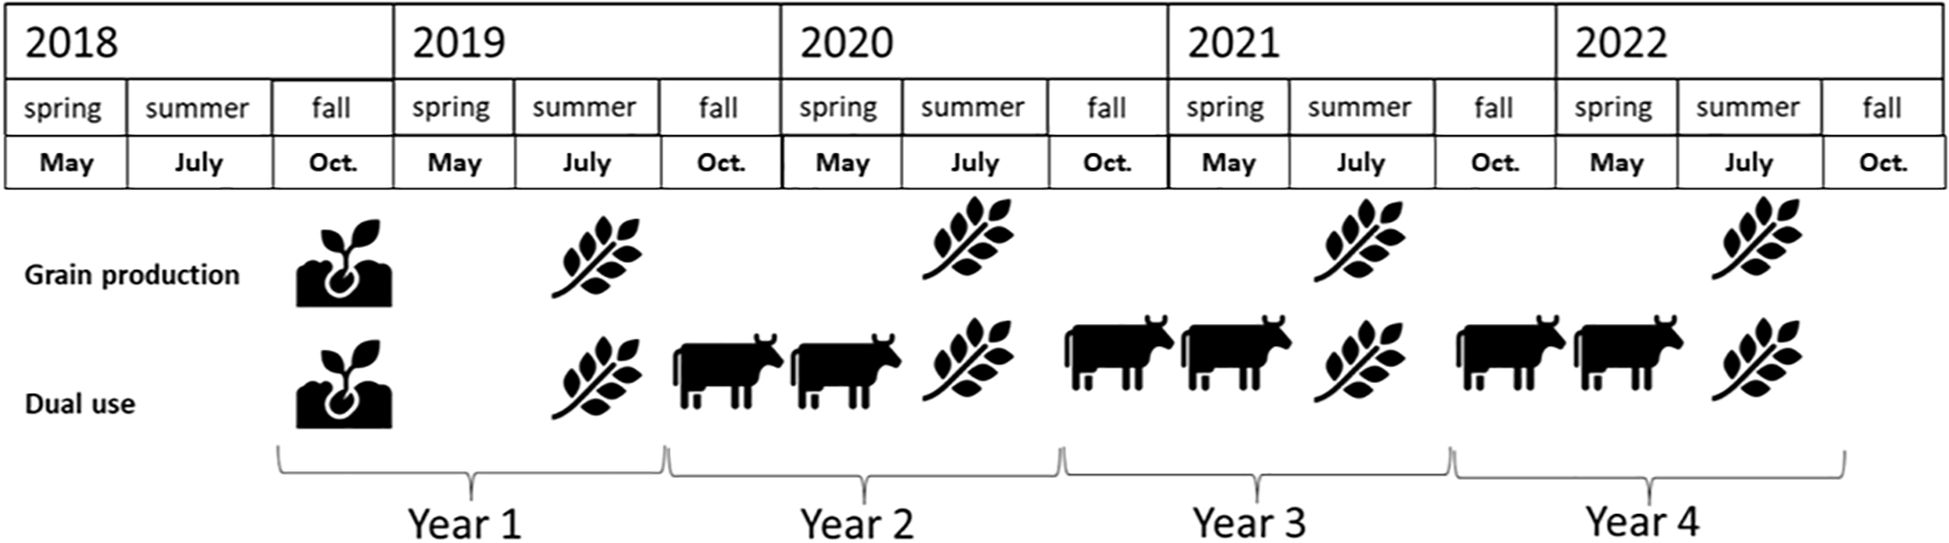
Figure 1. A schematic schedule of on-farm activities in an intermediate wheatgrass grain production system and a dual use system for both grain and grazing.
After hand sampling manually, the electric fence exclosures were removed to harvest the remaining grain and straw from the entire paddock. The grain was swathed and then picked up by a combine with a pickup header, except in 2019, when it was directly combined (John Deere, Moline, Illinois, USA). Straw was collected along with grain except in 2022. Electric fence exclosures were subsequently replaced using GPS coordinates. The grain and straw harvested mechanically was reported in the farm enterprise budget and is referred to hereafter as the “farmer” grain and straw yield.
The grazing treatment was first implemented in the DU system as the IWG stand entered its second year after establishment in mid-October 2019. Written informed consent was obtained from the owners for the participation of their animals in this study. The farm owner managed the grazing herd such that each paddock was grazed by 31 cow-calf pairs (~1.7 AU) plus 2 heifers (~1.3 AU each), at a stocking density of 560 kg LW ha-1, for five to twelve days in October/November 2019, 2020, and 2021 and in May 2020, 2021, and 2022 until a targeted range of 60% forage removal was achieved. Forage biomass was estimated in both the GP and DU systems by hand clipping the vegetation to an 8cm stubble height from three 30cm × 30cm quadrats per paddock to simulate mowing. Experimental samples were collected from both systems on the same day each year based on when grazing would occur in the DU system such that forage was evaluated on a date before grazing (pre-graze) and after grazing (post-graze). Fresh experimental forage weights were recorded before placing samples in a forced air oven to be dried at 60°C until moisture was removed from the biomass at which point the dry weights were recorded and are reported as experimental forage yield. Herbage intake (HI) was calculated as the difference between the pre-graze and post-graze experimental forage biomass (Smart et al., 2010). While the high grazing pressure asserted on the paddocks was assumed to have produced a decline in herbage post-grazing, the potential for uneven grazing as well as for active growth of IWG between these two sampling events may diminish the extent to which herbage declined. Forage utilization was calculated by dividing HI by the pre-graze experimental forage biomass to get the percentage of the total forage grazed (Smart et al., 2010).
A subsample of each of the dried experimental straw (summer harvest) and experimental forage (fall and spring harvests) biomass were ground through a 6mm screen in a Wiley mill (Thomas Scientific, Swedesboro, NJ) and subsequently through a 1mm screen in a Cyclotec (Foss, Hillerød, Denmark) before scanning under near infrared reflectance spectroscopy using a FOSS NIRS (Perkin Elmer DA7250, Waltham, Massachusetts, USA) with calibration equations developed with Minnesota IWG to estimate CP, acid detergent fiber (ADF), and neutral detergent fiber (NDF). The RFV of the experimental straw and experimental forage was calculated using Equations 1–3 (Moore and Undersander, 2002):
where NDF and ADF are a percent of dry matter.
Based on actual on-farm expenses and revenues from the management and sale of farmer grain, straw, and grazing forage, three enterprise budget scenarios for the production and sale of IWG were examined: grain only (GR), grain+straw (GP), and grain+straw+forage (DU). Although from a management perspective removing the straw along with the grain is important, the GR scenario illustrates sales if straw were not marketed. Some discrepancies arose between the yields reported by the farmer and the experimental yields obtained by hand-harvesting with quadrats. In general, the farmer’s yields were somewhat lower than the experimental yields, likely due to some seed loss from seed shatter during the mechanical harvest. As an established metric for valuing forage, the RFV was used as a proxy to estimate the market price that the farmer’s IWG straw and forage might earn, however, as a novel crop, the markets for IWG are still in development.
The net return to the enterprise was calculated as the total revenues less the total expenses. Net returns were standardized and reported on a per hectare per year basis. This standardization annualizes one-time expenses like seed and planting costs, which only occurred during the establishment year. Similarly, the standardization summarizes the farmer’s grain, straw, and forage yields and revenues, which were averaged across the four years of the production, including the year of establishment (year 1 = 2018) when no production or sales occurred. The zero for year 1 farmer grain, straw, and forage yields draws down the average farmer yields in the farm enterprise budget. Thus, some discrepancies may be perceived between the standardized farmer’s yields reported in the farm enterprise budget compared with the annual experimental yields presented elsewhere in the manuscript, which are reported on a per hectare basis for each of three years of treatment implementation and excludes the establishment year.
All statistical analyses were performed using R version 4.3.2 (R Core Team, 2023). Linear mixed effects models were run for all analyses using the nlme package (Pinheiro et al., 2023). Across all models, replication and plot were treated as random effects. Fixed effects for the experimental grain and straw yields, and harvest index models included stand age and agronomic system (i.e., treatment). The agronomic system was not included in the model for HI and FU as only the DU system was grazed, so data for analysis was only analyzed for this system. For the experimental forage yield, HI, FU, CP, and RFV models the fixed effects included season. All models were run with and without a variance structure and correlation structure and the Akike’s Information Criterion (AIC) was used to select the model of best fit. The grain and harvest index models specified the ‘varIdent()’ variance structure to account for the heterogeneity introduced by stand age. Similarly, the variance structure specification was applied for season in the models for HI, FU, CP, and RFV. A correlation structure (corAR1) was specified in the experimental forage yield and RFV models to account for repeated measures in the fall and spring each year. All models were optimized using the nlmeControl() specification. This manuscript reports the analysis of variance and pairwise comparisons of estimated marginal means from emmeans (Lenth, 2023) for each model. Statistical results are presented using p-values to discuss differences according to hypothesis tests and include 95% confidence intervals in figures to illustrate the variation in the data around mean estimates.
The following missing data were excluded from statistical analyses. Data for 2018 (year 1) experimental grain and straw yields were excluded because these harvests occurred prior to implementing the DU system (i.e., grazing treatment). Experimental forage yield, HI, and FU data for fall and spring for year 1 were excluded from the statistical analysis for the same reason. In 2022 (year 4), the experimental straw data was excluded from the analysis of experimental straw yield due to missing experimental straw yield data for both agronomic systems that year. For the same reason, the analysis of CP and RFV were excluded in year 4.
The models for the net return to the farm enterprise budget included the three enterprise budget scenarios (GR, GP, DU) as the fixed (treatment) effect and the year was treated as a random effect.
For the study period, the average annual minimum and maximum air temperatures were 2°C and 12°C, respectively, which were similar to the 30-year normals (Table 1). The average monthly cumulative precipitation during the study period was 920 mm while the 30-year normal was 873 mm. These averages mask the wide range of variation in temperature and precipitation during any given year at the study site. For example, in year 3 the minimum air temperature reached as low as -20°C while highest monthly average air temperature that year was 29°C. Thus, within the span of one year, the range of air temperatures spanned a range of 49°C. The range of air temperatures spanned 42°C in year 1, 43°C in year 2, and 48°C in year 4. Over the past 30 years air temperature spanned a range of 40°C between the lowest minimum and highest maximum monthly average air temperatures. So, a wider range of air temperatures was observed in the present study than for the 30-year average.

Table 1. Minimum and maximum average monthly air temperatures and cumulative monthly precipitation for the study years.
In general, the average cumulative precipitation by month in the first two years of the study was greater than the 30-year average for the study site while the last two years of the study were drier than normal (Table 1). In the establishment year, the monthly cumulative precipitation was greater than the 30-year average every month, except for August, which was 55 mm below average for that month. In the planting month (September) of the establishment year, the precipitation was 109 mm above and the minimum air temperature was 13°C greater than the 30-year average for the same month. Conversely, in year 3 the cumulative monthly precipitation was below average every month except for November (+10 mm) and August (+101 mm), with the lowest precipitation recorded in June and July at 100 mm and 54 mm below the 30-year average, respectively. The range in the 30yr-average precipitation was from 26 mm in January to 138 mm in June, a range of 112 mm. In the present study, the difference between the month with the most and the least precipitation ranged from 209 mm between August (221 mm) and February (12 mm) in year 3 to a difference of 91 mm in year 4 between August (104 mm) and February (13 mm). Overall, the weather observed in the present study varied more than historical averages.
The interaction of stand age × agronomic system (p < 0.001) explained differences in observed experimental grain yields. Experimental grain yield in the establishment year (year 1) was not considered in the analysis because the grazing treatment was not implemented until year 2, thus the two agronomic systems in year 1 could not be compared. As a point of reference, though, the GP system produced an experimental grain yield of 990 kg ha-1 in year 1. In year 2, a greater experimental grain yield (p < 0.01) was observed in the GP system (1,010 kg ha-1) than in the DU system (710 kg ha-1; Figure 2a). In year 3, the experimental grain yield was similar among agronomic systems (p = 0.44). In year 4, the experimental grain yield was greater in the DU system than in the GP system (p = 0.04). Specifically, the DU system yielded 533 kg ha-1, or 27% more grain than the GP system. The DU system produced as much and more IWG grain than the GP system in two out of three years, which supported hypothesis #1. However, overall, the DU system produced 14% less total experimental grain (1,822 kg ha-1) than the GP system (2,081 kg ha-1). The results also indicate a decline in experimental grain yields over time, particularly in the GP system. From year 2 to year 4, experimental grain yield declines in the DU system were 25% and 62% in the GP system.
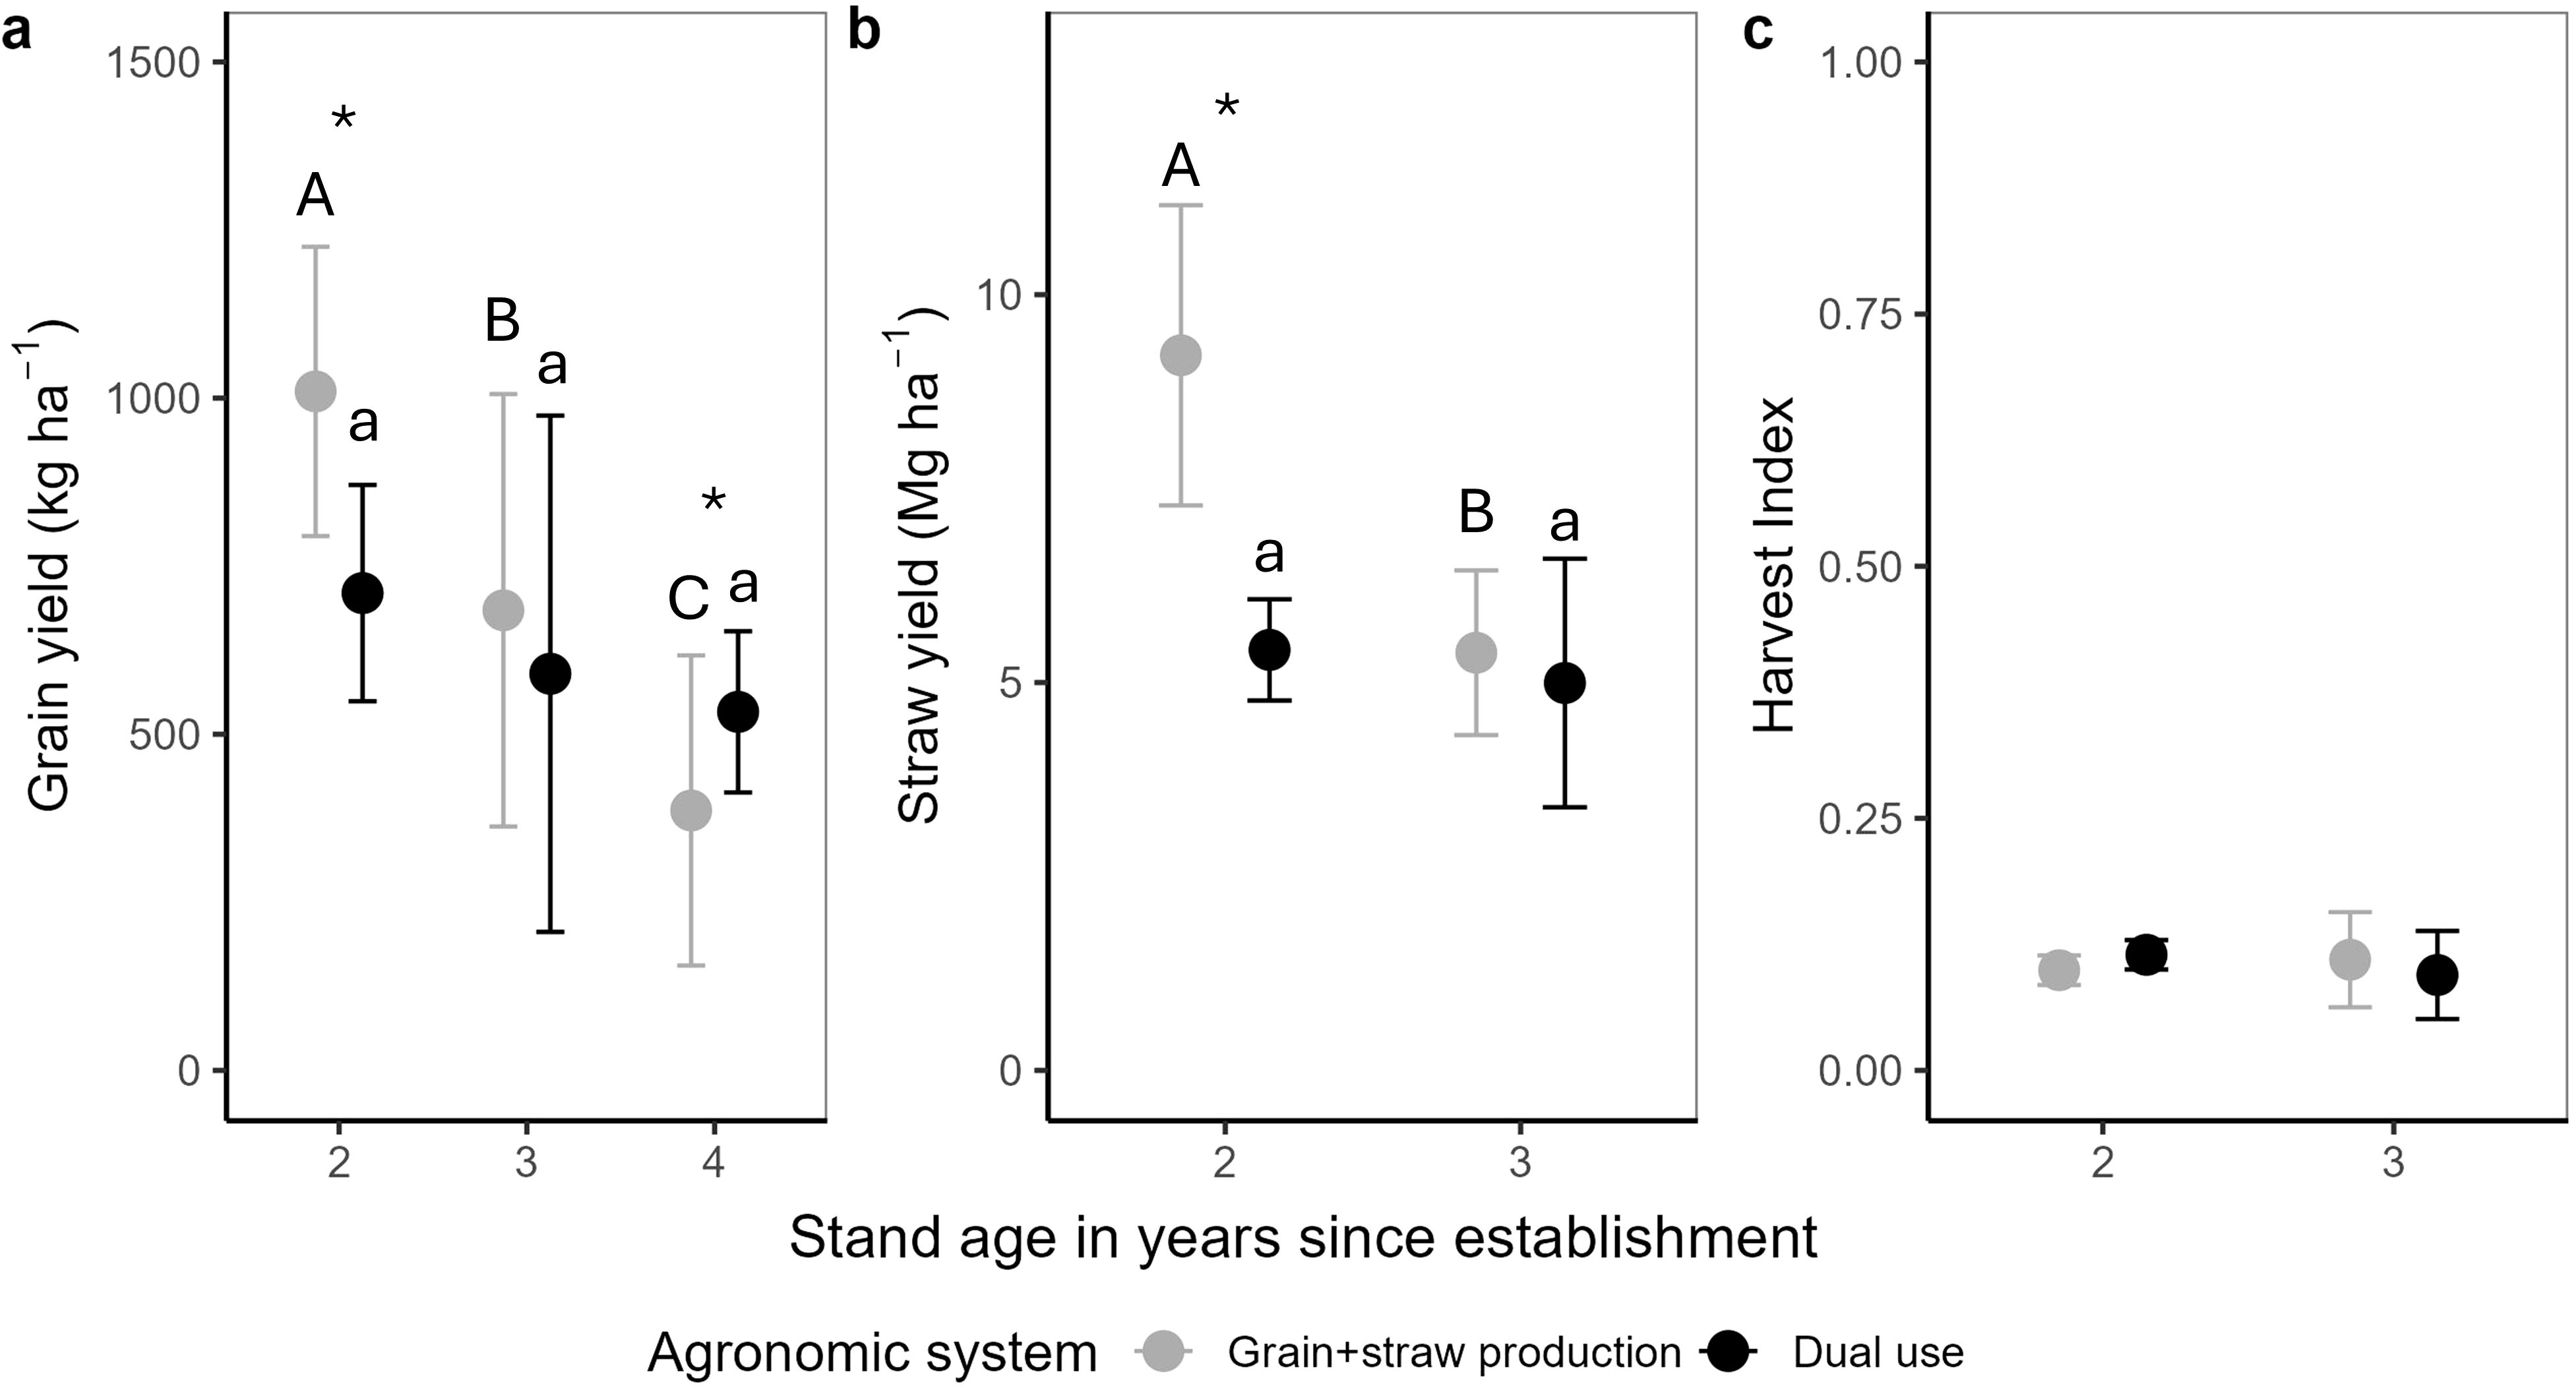
Figure 2. Mean experimental yields of intermediate wheatgrass (IWG) (a) grain and (b) straw harvested from a system for grain+straw production (GP) and a dual use (DU) system for grain+straw and grazing forage as well as the (c) harvest index for both agronomic systems. Straw yield was not measured in year 4. Within a given agronomic system, significant differences (p<0.05) between IWG stand ages are indicated by different upper-case (GP) and lower-case (DU) letters. Within a given IWG stand age, an asterisk indicates a significant difference between agronomic systems. Points represent calculated means and vertical lines represent 95% confidence intervals.
There was an interaction between stand age × agronomic system (p < 0.0001) that impacted IWG experimental straw yields and was driven by the lack of difference among year 2 and year 3 experimental straw yields in the DU system, compared with the greater variability in experimental straw yields among year 2 and year 3 stands in the GP system. The DU system produced 3.8 Mg ha-1 less experimental straw than the GP system in year 2 (p < 0.0001) but similar experimental straw yields of approximately 5 Mg ha-1 were observed in both agronomic systems in year 3 (p = 0.49). Overall, the DU system produced 29% less experimental straw than the GP system across the two study years, due to lower year 2 experimental straw yield. Intermediate wheatgrass experimental straw yields declined with stand age in the GP system (Figure 2b). In the GP system, experimental straw yields declined by 42% from 9.2 Mg ha-1 in year 2 to 5.4 Mg ha-1 in year 3. Meanwhile, the experimental straw yield in the DU system averaged 5.2 Mg ha-1 across the two study years. Taken together, the DU produced as much or more experimental grain and straw as the GP system, as hypothesized, but only after year 2.
No differences in harvest index were observed between the GP and DU systems in years 2 or 3 (p = 0.10). The harvest index averaged across agronomic systems and stand ages was 0.15 (Figure 2c).
Differences in experimental forage yield arose from the interactions of season × agronomic system (p < 0.0001) and stand age × season (p < 0.0001). However, it is important to note that while experimental forage production in the GP system was quantified by hand cutting, it was not grazed, thus GP forage yields represent potential experimental forage yield (i.e., the amount of forage available that was not consumed) rather than the realized experimental yield as in the DU system. The experimental forage yield for a given agronomic system varied by season (Figure 3a). Averaged across years, the realized experimental forage yield in the DU system in fall was 0.58 Mg ha-1 greater than in the spring (p < 0.0001). Contrary to the hypothesis, no differences between agronomic systems were observed for the experimental forage yield in fall (p = 0.39) or spring (p = 0.07).
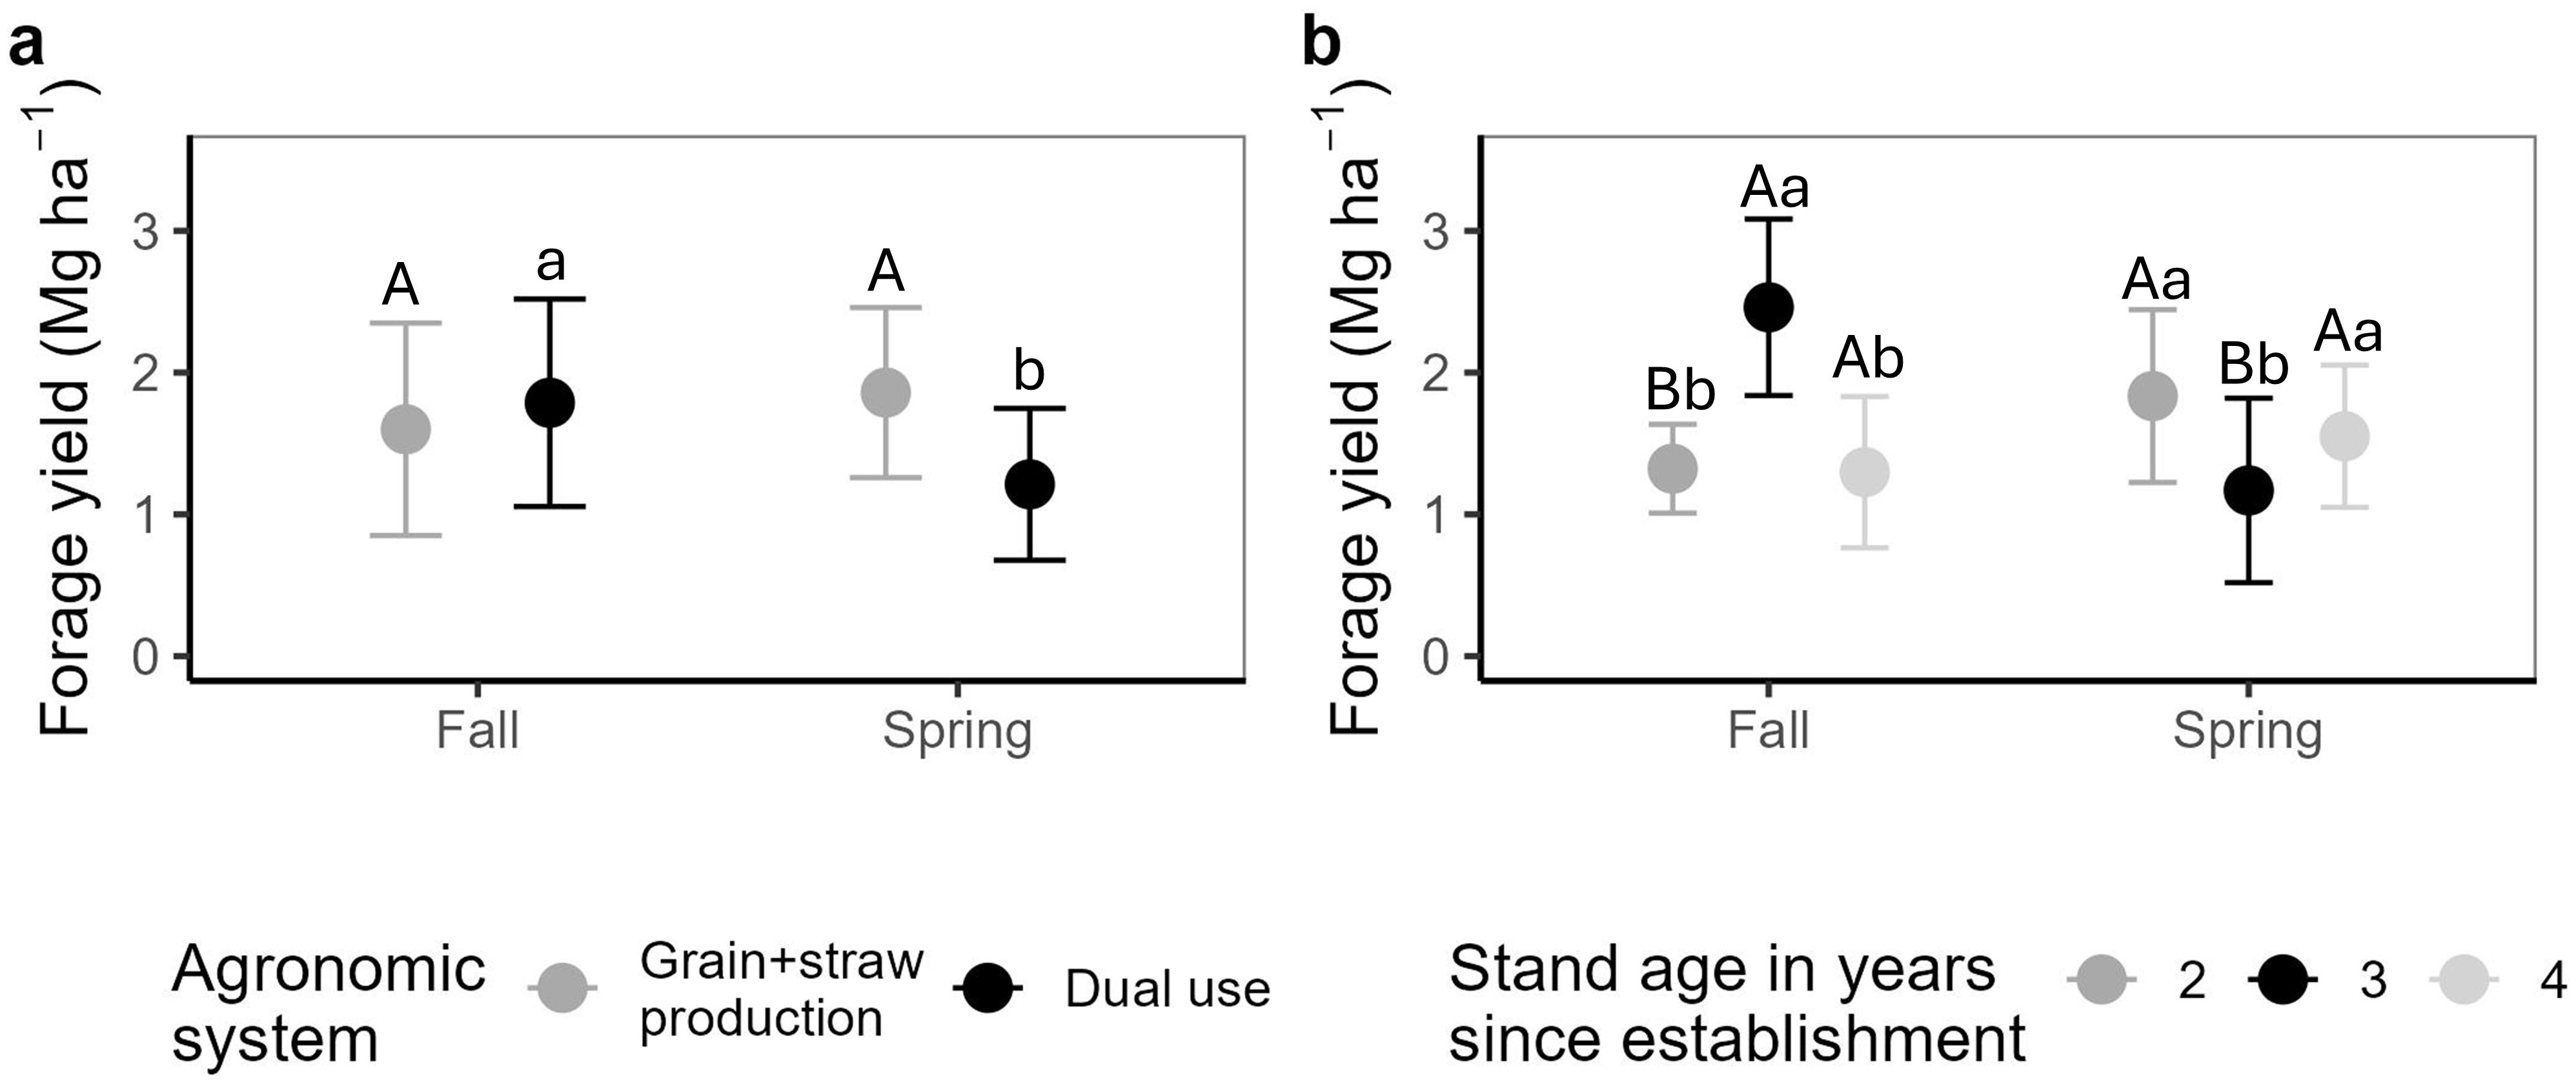
Figure 3. Intermediate wheatgrass (IWG) vegetative growth available as forage for grazing (a) in two agronomic systems during the fall and spring. Values for the grain+straw production (GP) system represent potential experimental forage as no grazing occurred in this system while values for the dual use (DU) system, in which grazing did occur, represent realized experimental forage yields. For a given agronomic system, significant differences (p < 0.05) in experimental forage yield between seasons are indicated by different upper-case (GP) and lower-case (DU) letters. (b) Seasonal experimental forage yield by IWG stand age. For a given IWG stand age, different upper-case letters indicate significant differences in experimental forage yield between seasons. Within a given season, different lower-case letters indicate a significant difference in experimental forage yield between IWG stand ages. Points represent calculated experimental means and vertical bars represent 95% confidence intervals.
Among production years, year 3 experimental forage yields were unlike those produced in years 2 and 4 (Figure 3b). The experimental forage yield in the fall of year 3 was 1.14 Mg ha-1 greater than in the fall of year 2 (p < 0.0001) and 1.16 Mg ha-1 greater than in the fall of year 4 (p < 0.0001). Conversely, the experimental forage yield in the spring of year 3 was 0.67 Mg ha-1 less than in the spring of year 2 (p < 0.001) and 0.45 Mg ha-1 less than in the spring of year 4 (p = 0.03). Meanwhile, the experimental forage yields in years 2 and 4 were similar in both fall (p = 0.99) and spring (p = 0.42).
Herbage intake (HI), the amount of forage consumed by grazing animals over a given unit area (Smart et al., 2010), was impacted by the interaction of stand age × season (p < 0.0001). This was driven by differences in the fall HI in year 3 being more than twice that of the fall HI in year 2 (p < 0.0001) and year 4 (p < 0.001; Figure 4a). Additionally, greater HI was observed in fall than in the spring in year 3 (p < 0.0001) and year 4 (p = 0.04). In year 3, the HI declined 95% from 2.29 Mg ha-1 in the fall to 0.11 Mg ha-1 in the spring (Figure 4a). Similarly, in year 4 the spring HI (0.46 Mg ha-1) was 56% lower than the fall HI (1.05 Mg ha-1). Thus, we observed evidence to support the hypothesis that fall HI would be greater than spring HI in two of three study years.
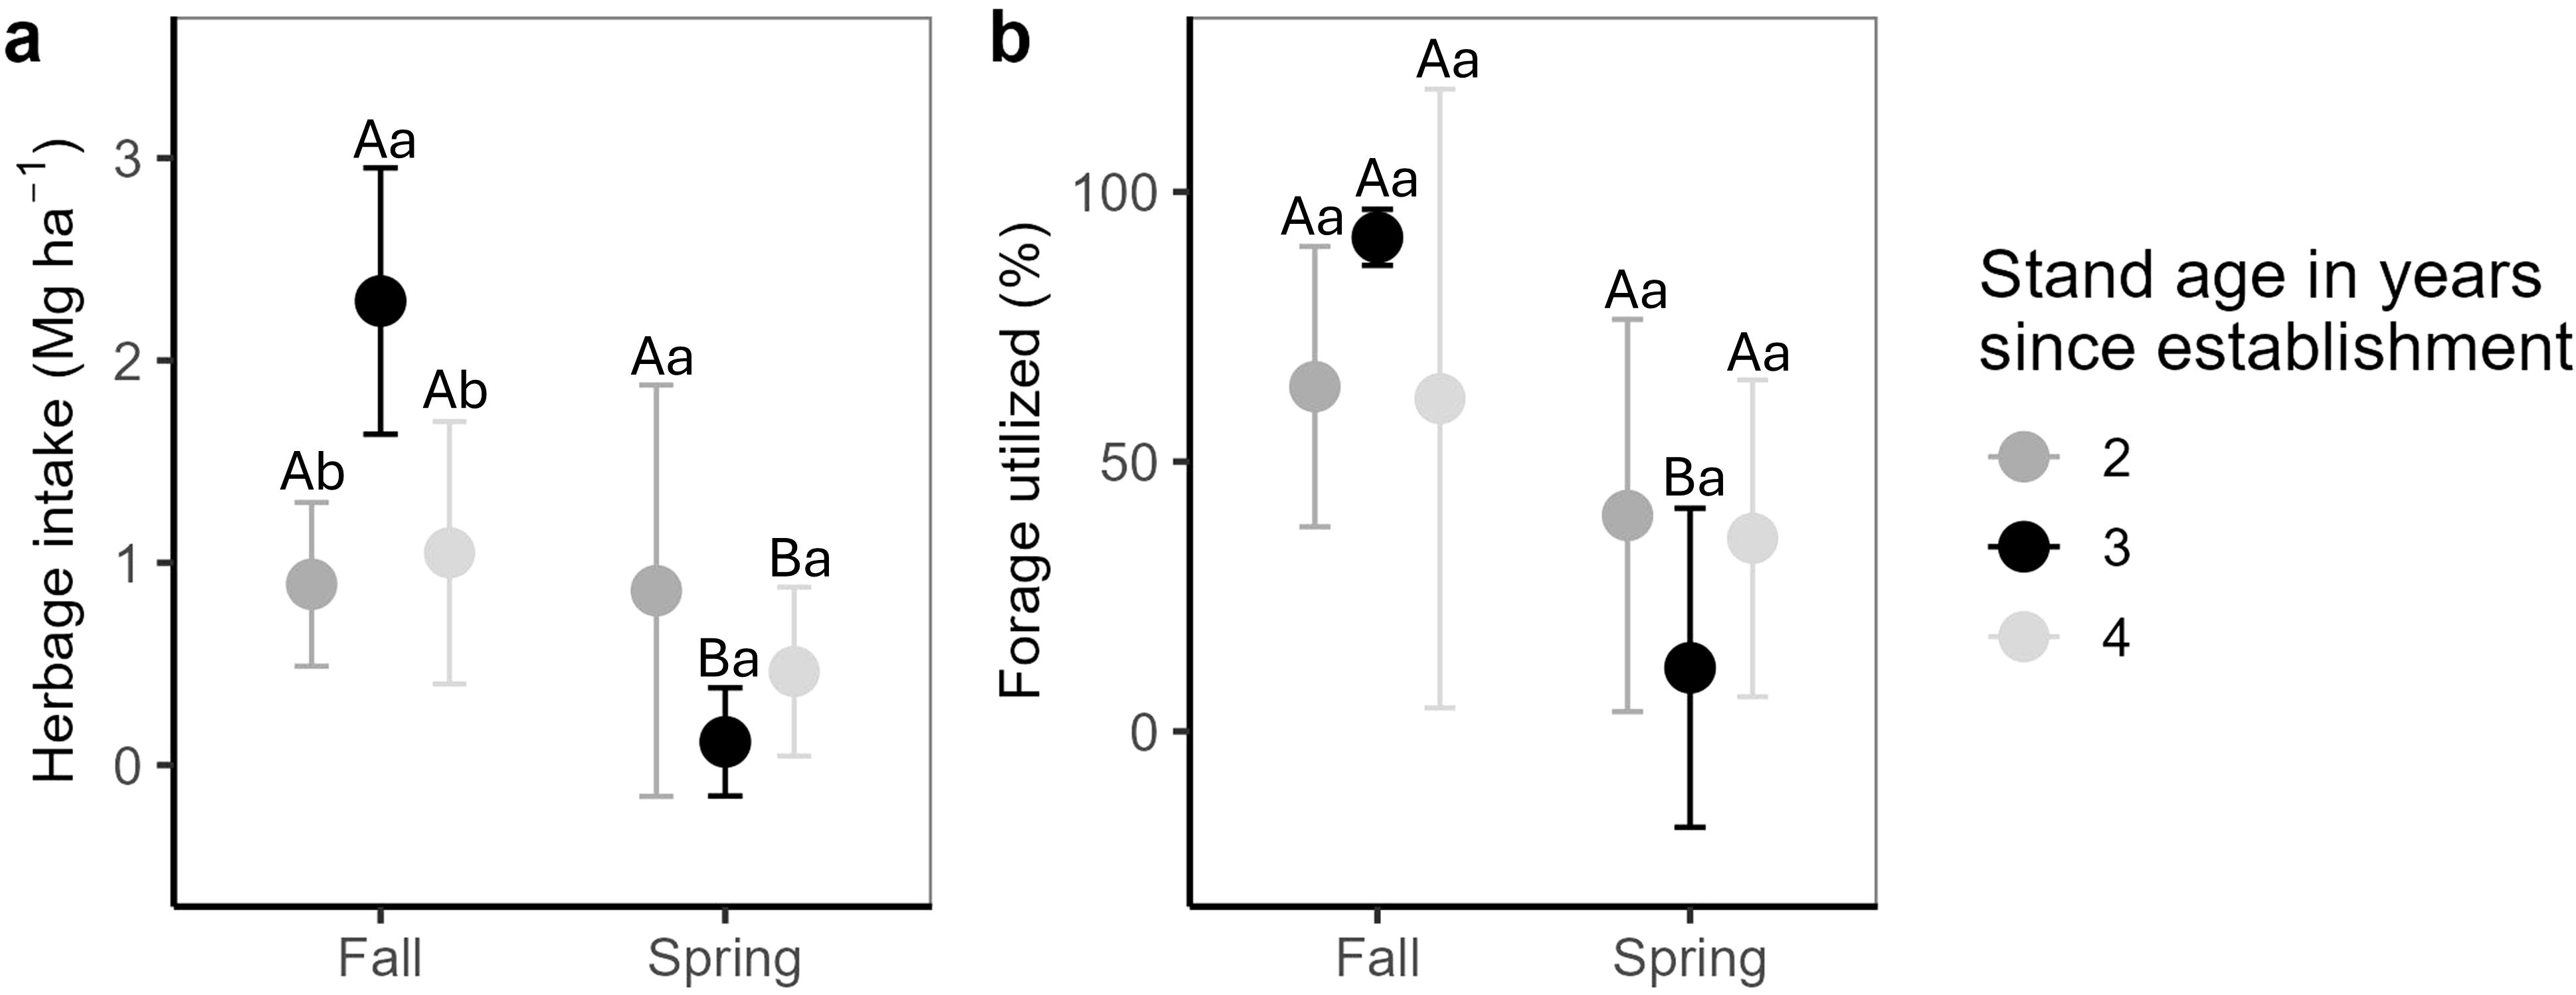
Figure 4. Means for the intermediate wheatgrass (IWG) (a) herbage intake and (b) forage utilization by grazing cattle as a proportion of the available forage. Within a given IWG stand age, significant differences (p <0.05) between seasons are indicated by different upper-case letters. Within a season, different lower-case letters indicate a difference between IWG stand ages. Points are calculated means and vertical bars represent 95% confidence intervals.
Forage utilization (FU), the proportion of available forage that is consumed or destroyed by grazing animals expressed as a percentage (Guretzky et al., 2020; Smart et al., 2010), reflected the trends for HI (Figure 4b). As in HI, the stand age × season interaction (p=0.01) influenced FU. Specifically, the difference between the fall FU (92%) and spring FU (12%) in year 3 (p < 0.0001) drove this result and provided evidence in support of hypothesis #3.
The CP in experimental forage varied by stand age × season (p < 0.0001). Averaged across agronomic systems, year 2 CP in the fall experimental forage was 212 g kg-1 and declined by 75 g kg-1 in spring experimental forage, with summer experimental straw containing 87% less CP than the fall experimental forage that year (Figure 5a). Thus, the CP ranking in year 2 was fall>spring>summer. In year 3, however, the CP ranked spring>fall>summer. The fall experimental forage CP in year 3 was under 70 g kg-1 in both agronomic systems, a 70% decline from the previous year. Meanwhile, the spring experimental forage remained relatively stable across years and agronomic systems.
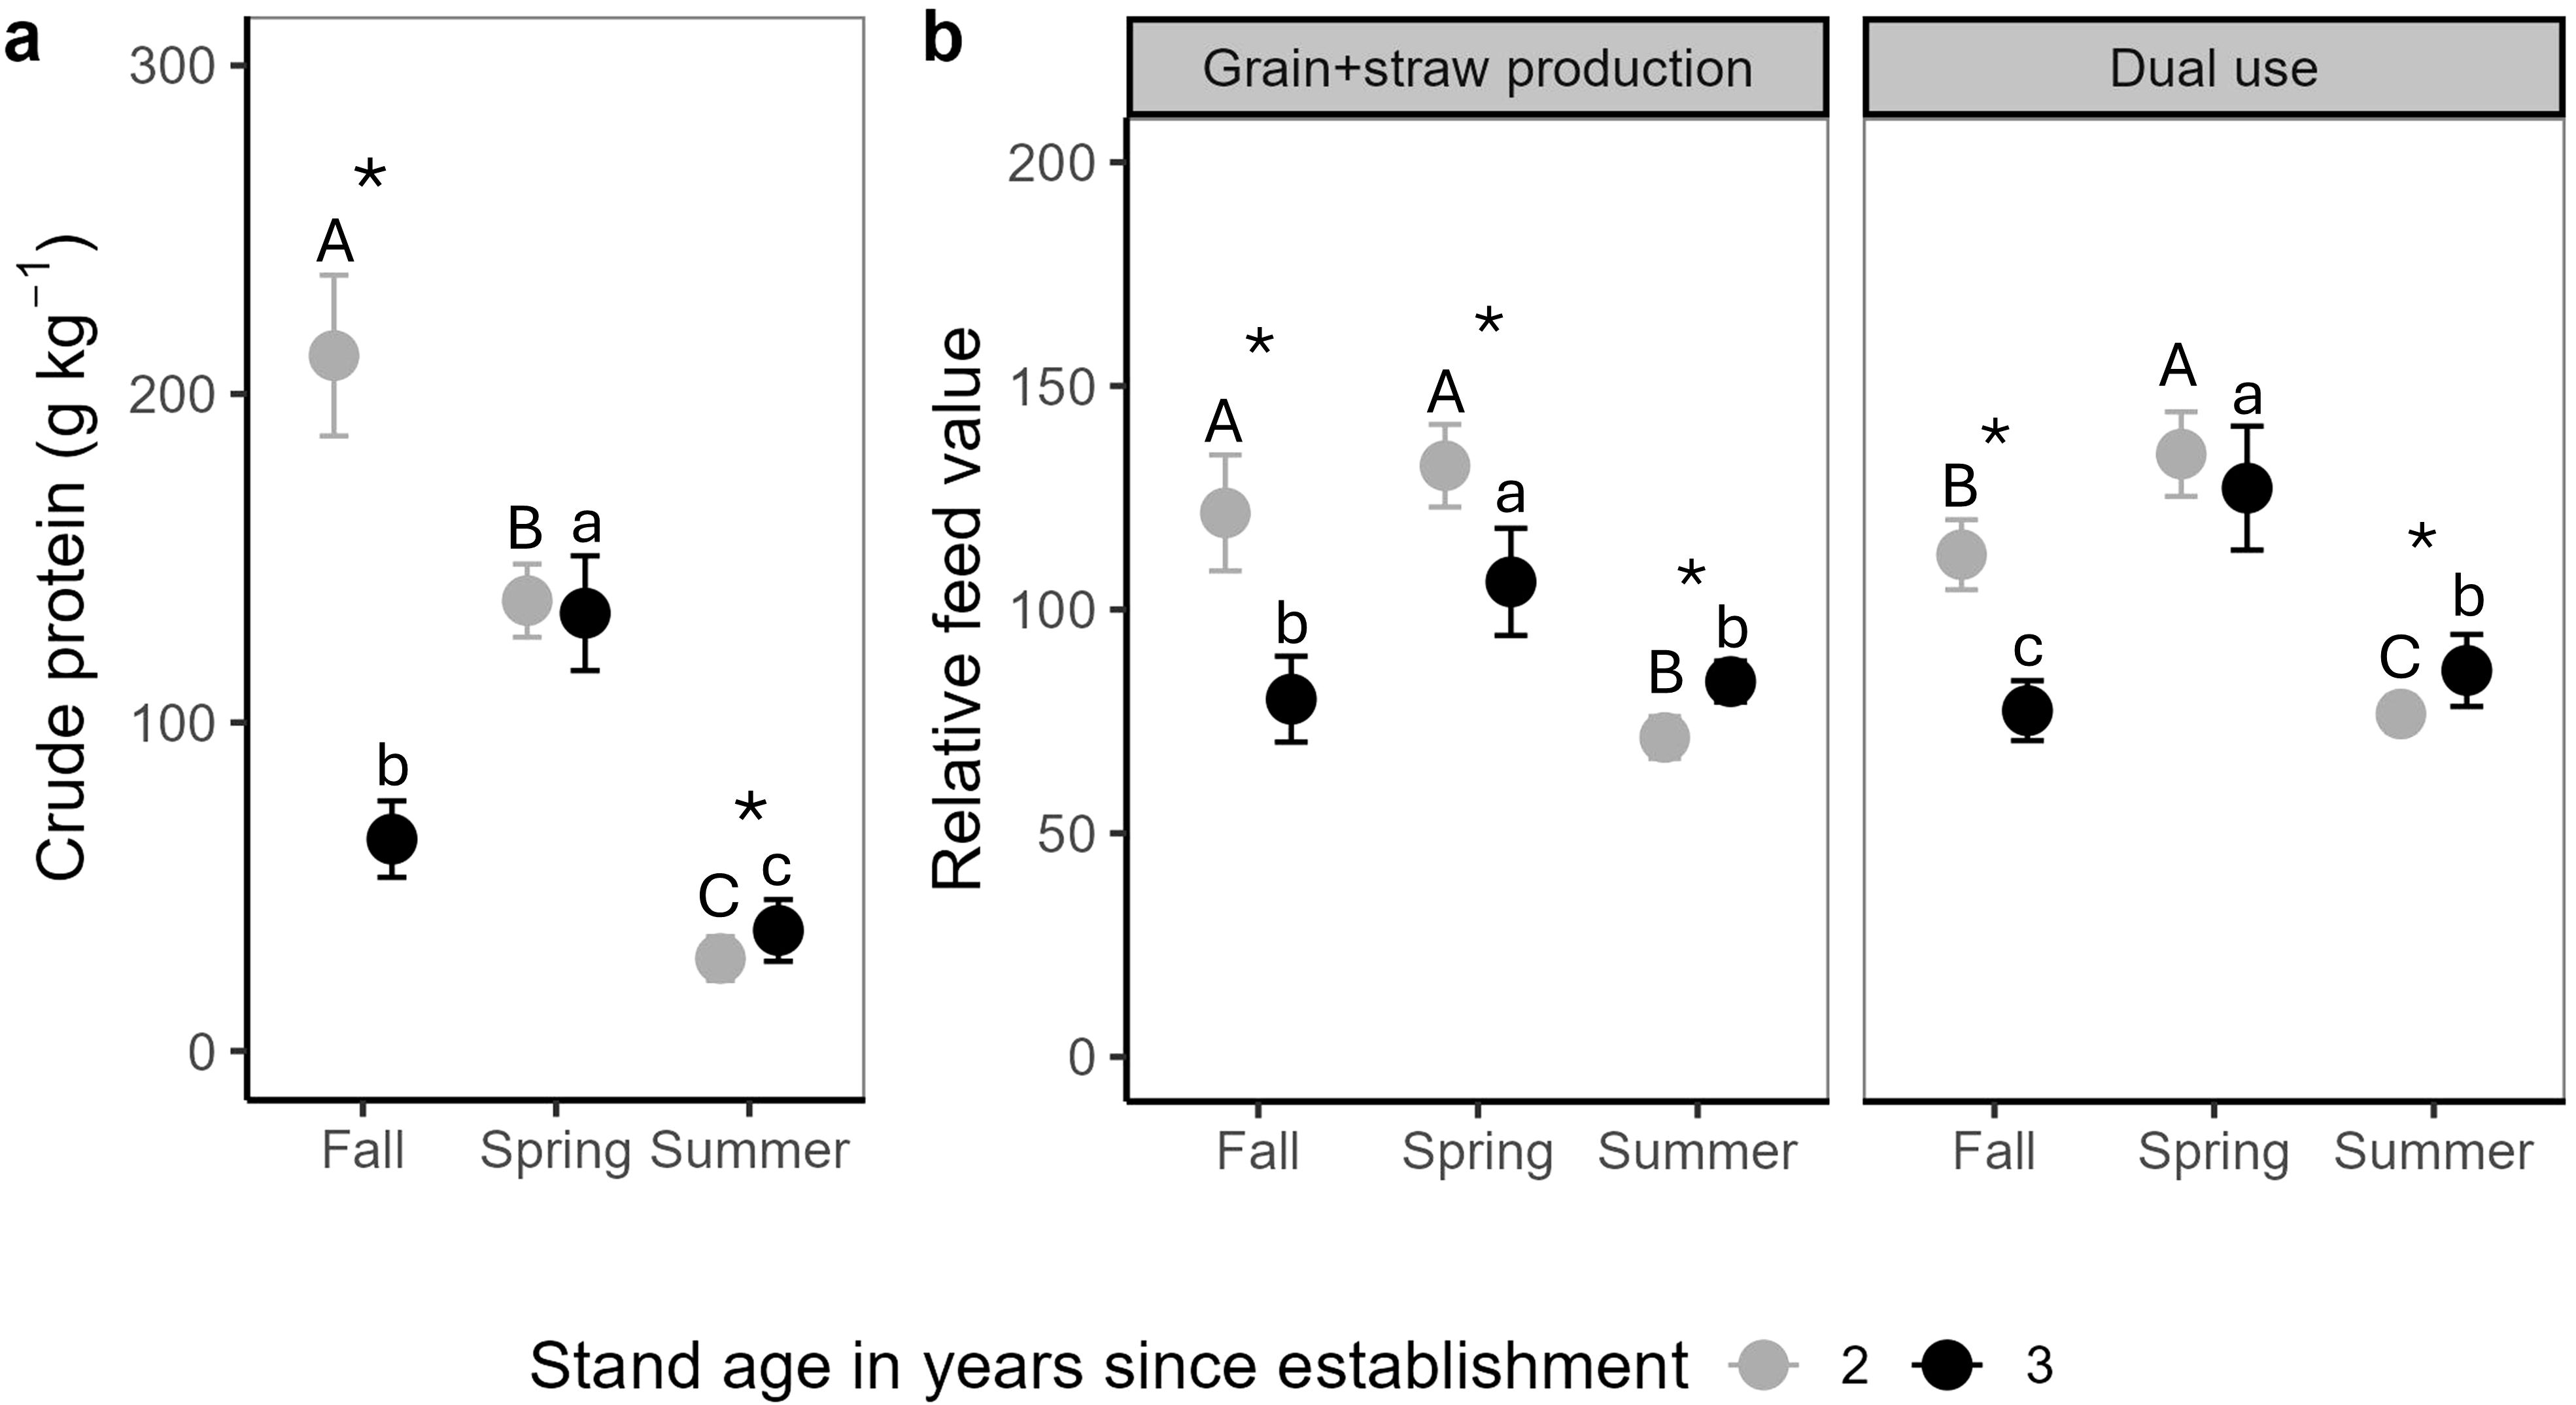
Figure 5. The seasonal nutritive value in terms of (a) crude protein and (b) relative feed value of intermediate wheatgrass (IWG) vegetative growth available as forage for grazing in fall and spring and as straw in summer in a grain+straw system and the dual use system for grain+straw production and grazing of forage. Different letters indicate significant differences (p <0.05) among seasons for a given IWG stand age (2=upper-case; 3=lower-case). Within a given season, an asterisk indicates a significant difference in experimental forage yield between IWG stand ages. Points are calculated means and vertical bars represent 95% confidence intervals.
Differences in RFV arose from the interaction of stand age × season (p<0.0001), season × agronomic system (p = 0.002), and the three-way interaction of stand age × season × agronomic system (p = 0.04). No differences in RFV were observed among agronomic systems, except for in the spring of year 3 (p < 0.01) when the RFV of spring forage in the DU system was 21 units greater than in the GP system. Within an agronomic system, there were seasonal variations in RFV (Figure 5b). In the GP system in year 2, the summer RFV was 50 units less than in the fall (p < 0.0001) and 61 units less than in the spring (p < 0.0001). In year 3, the RFV of the experimental forage in the GP system was greater in the spring than in the fall (p < 0.0001) and the summer straw RFV was the lowest among the seasons (p < 0.0001). The same pattern was observed in the DU system in year 2 with the RFV of the spring experimental forage being 23 units greater than in the fall (p < 0.0001) and the fall experimental forage RFV being 36 units greater than the summer straw RFV (p < 0.0001). Conversely, in year 3 in the DU system, the RFV of the summer straw was 9 units greater than for the fall experimental forage (p = 0.04). The top ranking of spring experimental forage overall was likely driven by lower acid detergent fiber - which enhances forage digestibility - observed in year 3, particularly in the DU system (Supplementary Materials S1).
Like CP, the seasonal RFV varied by year. From year 2 to year 3, the fall experimental forage RFV declined by 42 units in the GP system (p < 0.0001) and by 35 units in the DU system (p < 0.0001). Spring experimental forage RFV in the GP system also decreased by 26 units from year 2 to year 3 (p < 0.0001). The summer straw RFV increased from year 2 to 3 in the GP system (p < 0.0001) and the DU system (p < 0.001) by 13 and 10 units, respectively. In general, the RFV for a given year and season tended to be similar among the two agronomic systems and the greatest RFV was observed in spring. These results provide partial evidence to support the hypothesis that spring and fall would have the greatest RFV but provide little evidence of greater RFV in the DU system compared to the GP system.
In agreement with hypothesis #5, the net return to the enterprise for the DU system was statistically similar to the GP system (p=0.19). Yet, the mean estimated net return to the enterprise for the DU system was $112 ha-1 yr-1 less than in the GP system but $347 ha-1 yr-1 greater than for the GR system (Table 2). The annual net return to enterprise ranged from -$855 ha-1 yr-1 in the establishment year to over $2,000 ha-1 yr-1 in the GP system in year 3 (Figure 6). Although the DU system did not produce a net return numerically as high as the GP system our statistical results support our hypothesis that the DU system would produce at least as great of net returns to the enterprise as the GP system.

Table 2. The farmer’s 2018-2021 enterprise budgets summarized on a per hectare per year basis for three intermediate wheatgrass production systems: grain only, grain+straw, and dual use for grain+straw+forage.
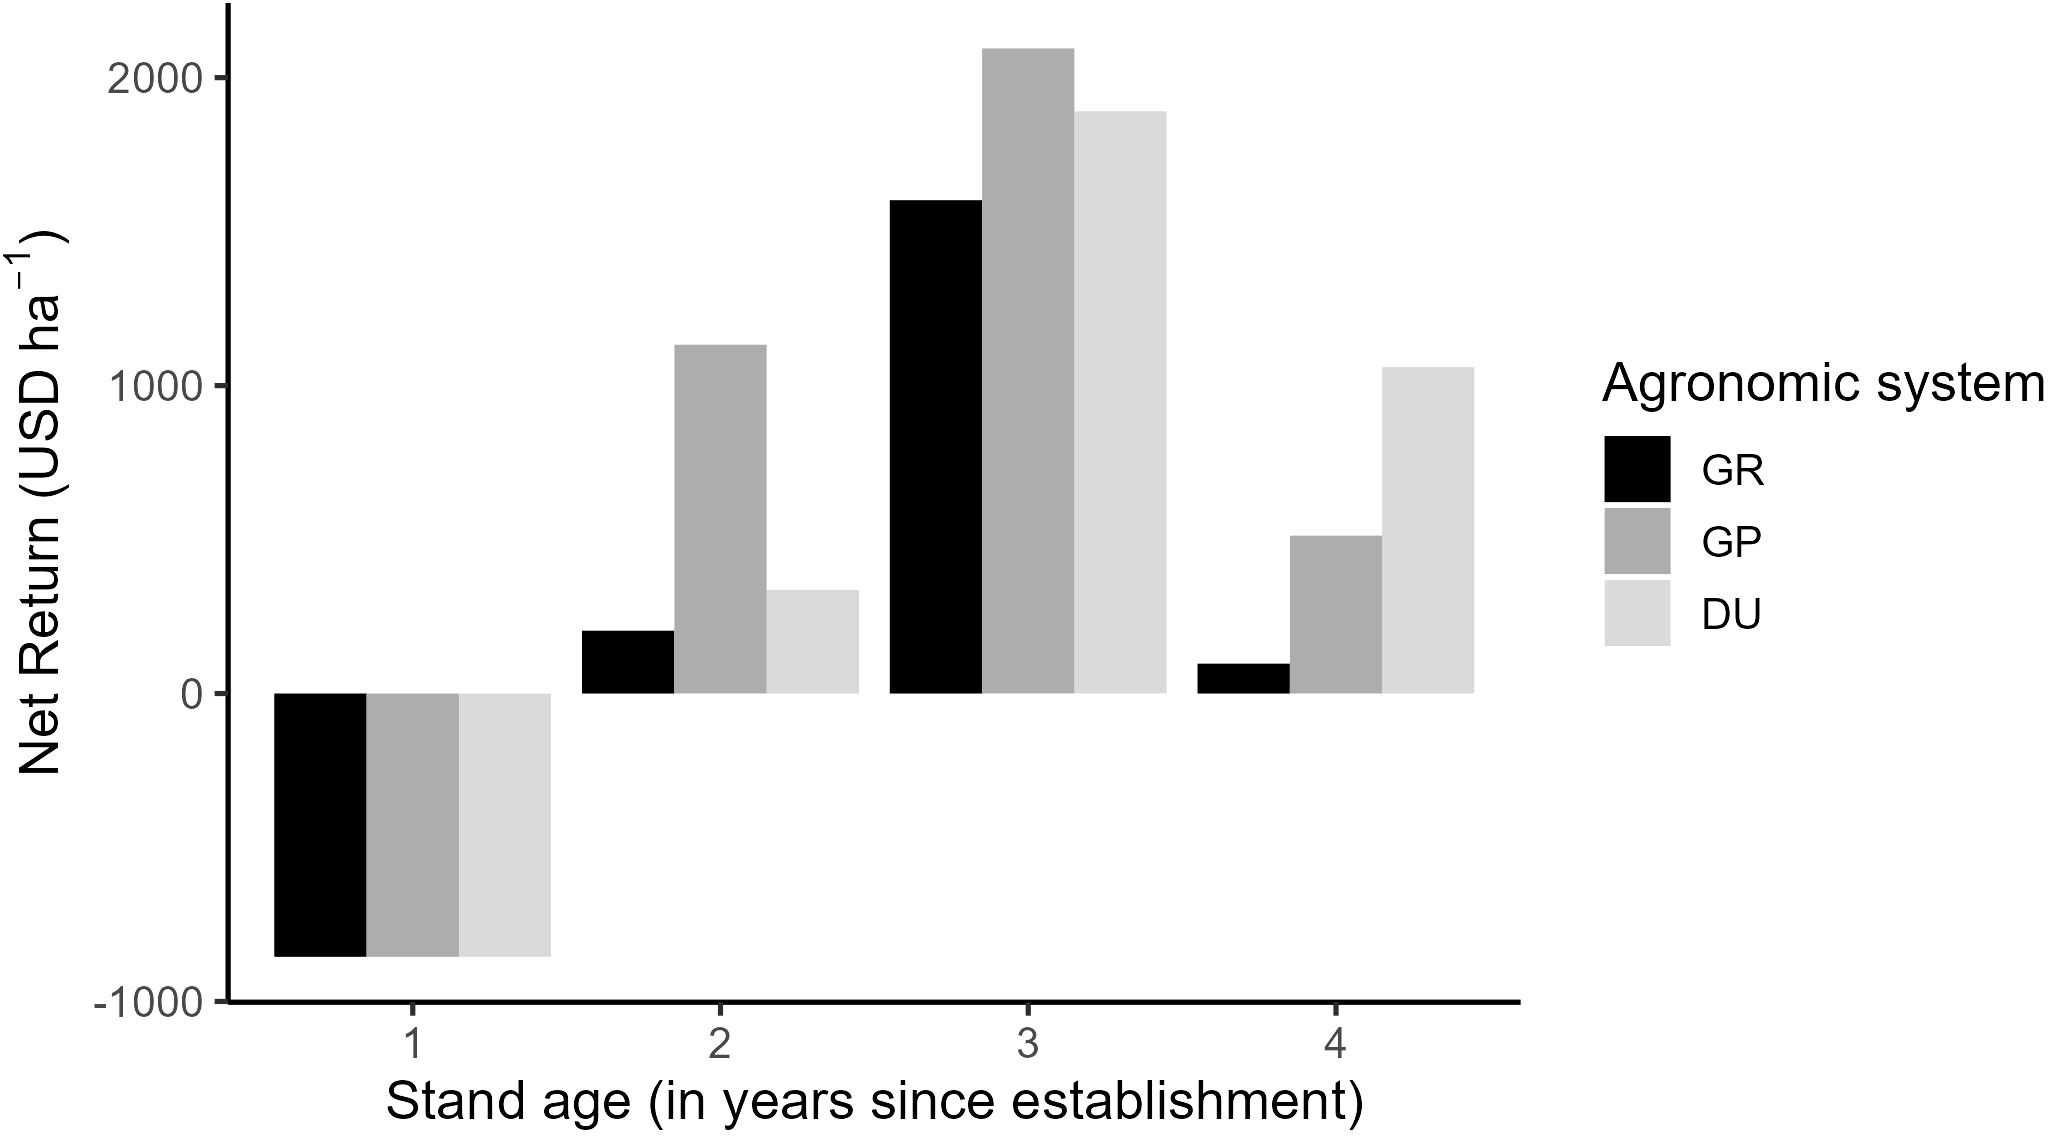
Figure 6. Farm enterprise data for an intermediate wheatgrass (IWG) grain-only production system (GR), grain+straw harvest (GP) system, and for dual use (DU) as a grain+straw and grazed forage crop. Bars indicate the actual total annual net return to enterprise for the establishment year (year 1) and three production years (2, 3, and 4).
Grain sales generated the most revenue in the GR, GP, and DU systems (Table 2). The lower farmer grain yields in the DU system in year 2 meant that less grain was sold and thus there was less grain revenue in this system. Despite the extra expense of $126 ha-1 yr-1 to harvest straw, straw sales in the GP and DU systems were more than enough to offset the cost. Straw sales increased the net return to the enterprise by $585 ha-1 yr-1 in the GP system and $411 ha-1 yr-1 in the DU system compared with the GR system, which did not market straw. As with grain sales, the lower farmer straw yield in the DU system in year 2 resulted in less revenue from straw sales in this system. After accounting for the additional expenses of fencing, water, and the grazing labor costs associated with forage production ($135 ha-1 yr-1), forage sales contributed a net benefit of $60 ha-1 yr-1 to the DU system. Grazing the forage compensated for the lower farmer grain and straw yields and produced a total revenue in the DU system that was $21 ha-1 yr-1 more than in the GP system, and $606 ha-1 yr-1 more than the GR system. Nonetheless, the GP system produced the greatest net return to the enterprise because it did not incur grazing expenses of $135 ha-1 yr-1, and because farmer grain and straw yields in year 2 contributed to higher grain and straw revenues than the DU system.
Perennial grains such as IWG provide year-round ground cover that promotes multiple environmental benefits in addition to producing a marketable grain. While gains in IWG grain yields have been made, this new crop yields (from 67% to 95.5%) less than comparable conventional annual wheat (Law et al., 2022; Culman et al., 2013). The latter has undergone millennia of informal selection and decades of formal crop improvement that contribute to current high yields. For IWG to be an attractive crop for growers to plant, the IWG system must offer opportunities to ensure profitability in spite of lower yields. It has been proposed that introducing livestock to graze the vegetative IWG growth between grain harvests can take advantage of on-farm resources during the off-season and generate an additional revenue stream (Zhen et al., 2024; Culman et al., 2023; Hunter et al., 2020a, Hunter et al., 2020b; Lanker et al., 2020).
In the present study, experimental grain yields in the DU system that were lower, the same, and greater than in the GP system depending on the year were observed. The effect of defoliation on IWG grain yields has previously been found to vary over time. For example, in the first year after establishing IWG, a spring defoliation event alone or with a fall defoliation event was associated with a greater grain yield than a defoliation event in the fall only, but two years later a spring defoliation event had the opposite effect (Hunter et al., 2020a). Compared with the undefoliated control, defoliation events in the spring+fall produced greater IWG grain yields in the second year after establishing IWG but after three years the grain yields in both treatments were the same, having both declined (Hunter et al., 2020a). A similar trend was observed in Ohio (Pugliese et al., 2019). Possible explanations for greater grain yields with defoliation include a reduction in lodging and an increased number of tillers m-1 because of a reduced canopy following defoliation (Hunter et al., 2020b), neither of which were evaluated in the present study. Shorter plants are less vulnerable to lodging, increasing the harvestability of the crop. Defoliation, such as by haying and grazing, promotes greater light penetration through a reduced canopy which stimulates tiller recruitment (Da Silva et al., 2015). To limit the potential for reducing IWG grain yields in a DU system, attention must be paid to the timing of defoliation. For example, defoliation in spring must occur before stem elongation to prevent removal of what will become the seed head to prevent reducing grain yield.
The decline of IWG grain yield with stand age that observed in the present study is well documented in the literature. For example, IWG breeders reported a 77% decline in grain yield after three years of production of the ‘MN-Clearwater’ IWG grain-type cultivar (Bajgain et al., 2020). The yields of a grain-type and a forage-type IWG declined 75 and 84%, respectively, from the first to the second year of production and further declines (48 and 35%) were observed from the second to third production season (Jungers et al., 2017). These declines exceeded the grain yield declines of 62% in the GP system and 25% in the DU system over the course of the present study. Researchers in Minnesota observed a ~50% decline in the number of IWG grains per spike after the first year of IWG grain production (Hunter et al., 2020a). The authors also reported the number of spikes producing grain declined with time, thus fewer spikes with less grain per spike likely led to lower IWG grain yield as the stand aged (Hunter et al., 2020a). Across nine North American sites, including a Minnesota site, yields appeared to be influenced by stand age more than by location, suggesting that yield may be more under genetic than environmental control (Culman et al., 2023). The authors noted greater IWG grain yield with greater annual precipitation and lower annual average temperatures, with the latter having a greater impact. In the present study, the greater IWG grain yields in years 1 and 2 coincided with average total annual precipitation that was greater than the 30-year average. Meanwhile, the average total annual precipitation was below average in year 3 and year 4 and IWG grain yields declined. Average annual temperatures were largely the same across years and similar to the 30-year averages in the present study, suggesting that precipitation may have had a larger role than temperature in this case.
Harvesting the IWG straw in addition to the grain added value to both the GP and DU systems. Experimental straw yields ranging from 4.99 Mg ha-1 in the DU system to 9.21 Mg ha-1 in the GP system were observed, which is within ranges previously reported in the literature. For example, the average straw yields across nine North American sites were 5.21 and 6.47 Mg ha-1 for two consecutive study years (Culman et al., 2023). In an organic IWG production system in New York, researchers reported straw yields of 5.73 Mg ha-1 averaged over three years, which accounted for nearly half of the revenue generated from the sale of grain and straw (Law et al., 2021). Higher straw yields than what we observed have also been reported, such as results from five Minnesota locations that produced an average of 11.2 Mg ha-1 for a grain-type IWG supplied with the agronomically optimum N rate (Jungers et al., 2017). As with IWG grain, we observed a decline in experimental straw yield in both systems as the IWG stand matured but whereas the GP system declined by 42% from one year to the next the DU declined by 8%. Similarly, previous research in a DU system reported a straw yield decline of 24% from the first to the second year of production (Hunter et al., 2020b). Experimental straw production in the DU system was less variable from year to year, although production was lower than in the GP system in the second year after establishing IWG.
The harvest index around 0.10 for IWG observed in the present study coincides with harvest index for IWG reported previously (Zhen et al., 2024) but it is lower compared with annual small grain crops like oat and barley. For example, oat and barley grown for grain in Italy had a harvest index of 0.35 and 0.45, respectively (Francia et al., 2006). The authors observed similar harvest index when the oat (0.36) and barley (0.41) were grazed once at the final tillering stage but lower harvest index when they were grazed a second time at the shoot elongation stage in oat (0.29) and the first node for barley (0.36). The relatively smaller grain size of IWG compared with conventional small grains, as well as the number of seeds per spike, and the proportion of fertile tillers (Hunter et al., 2020a) help to explain the lower harvest index in IWG. Increasing the IWG grain size remains a primary breeding goal for improving this novel crop (Bajgain et al, 2020).
The fall regrowth and spring vegetative growth of IWG that was grazed by cattle in the present study produced experimental forage yields that reflect previously reported ranges. In a DU study in St. Paul, Minnesota the fall IWG hay yielded from 1.1 to 3.0 Mg ha-1 while the spring IWG hay yielded from 1.0 to 2.4 Mg ha-1, which together contributed to greater total forage (straw+hay) being observed in the DU system than in the control treatment where hay was not harvested (Hunter et al., 2020b). Summed together their fall and spring hay harvests yielded 3.5 to 4.0 Mg ha-1 (Hunter et al., 2020b). Similarly, a study of two- and three-year old grain-type IWG stands harvested for hay either once (in summer), twice (in summer+September), or three times (in summer+September+November) yielded approximately 4 to nearly 5 Mg ha-1 (Puka-Beals et al., 2022). These values are similar to the average fall+spring forage production of 4.0 Mg ha-1 and 4.5 Mg ha-1 observed for the DU and the GP systems, respectively.
Adequate herbage mass was available in both fall and spring to support grazing cattle in the DU system. A 60% HI was targeted, which was achieved for fall in two of three study years with the HI surpassing 90% in one of three years. Springtime HI, on the other hand, was generally closer to 40%. Spring HI values in the DU system are probably depressed since they would capture any leaf regrowth between the pre- and post-graze sample collection thereby reducing the difference between the two. Nonetheless, except for the fall of year 3, lower HI were observed than by researchers in Nebraska who grazed cattle at low [7,697 kg live weight (LW) ha-1] and high (235,622 kg LW ha-1) stocking densities, obtaining HI of 85 and 93%, respectively (Guretzky et al., 2020). Greater grazing pressure in the Nebraska study (i.e., more animals per unit area and a long grazing period in the high and low stocking density treatments, respectively) compared with the present study likely explains the differences in observed HI.
In terms of forage nutritive value, CP levels in spring experimental forage that remained relatively consistent across years were observed while fall experimental forage CP varied and summer experimental straw CP was consistently low. Puka-Beals et al. (2022) observed CP from 56 to 109 g kg-1 for IWG biomass harvested once, twice or three times between July and November each year. This CP range coincides with what was observed in the present study for summer and fall IWG forage. Similarly, the CP of spring hay, fall hay, and summer straw averaged 234, 122, and 34 g kg-1, respectively, in a IWG grain plus biomass coproducts system (Hunter et al., 2020b). These results reflect the pattern of greater CP in spring forage>fall forage>summer straw observed here.
Like CP, RFV followed the same seasonal pattern. Seasonal differences arising between the agronomic systems likely resulted from lower acid detergent fiber (ADF) in the DU system than in the GP system (Supplementary Materials S1). The lower ADF in the DU system probably occurred in spring because the fall grazing removed more mature forage, giving rise to new shoots in the spring. Meanwhile, without grazing in the GP system remnants of fall leaf tissue likely were still present and thus captured in the spring sampling event. The nutritive value of forage declines with maturity, as the proportion of cellulose, hemicellulose, and lignin increases in plant tissues (Moore and Jung, 2001). Similarly, it is well understood that forage yield increases with maturity. Thus, increased yield is negatively correlated with RFV. This relationship may help to explain why the RFV observed in year 2 was greater than in year 3, but the experimental forage yield in year 2 was less than in year 3. Spring grazing in the DU system may take advantage of forage with a greater RFV but has sometimes led to decreases in grain and straw yield (Hunter et al., 2020a). In the present study, it cannot be concluded whether the spring grazing in the DU system reduced the experimental grain and straw yields in one of three study years.
The RFV results reflect those reported in the literature. Culman et al. (2023) reported similar RFV values in the GP and DU systems they studied across nine temperate North American sites. The authors suggested focusing efforts to improve RFV in IWG on breeding rather than defoliation management since the most important factor influencing IWG RFV was season, which follows well-established trends (Culman et al., 2023). Previous research identified a relationship between lower IWG RFV and an increasing number of growing degree days (GDD; Puka-Beals et al., 2022), which accumulate more rapidly with warmer temperatures. Hunter et al. (2020b) reported fewer GDD accumulated in the spring (470°C d) than in the fall (1,280°C d) and in the summer (2,200°C d) which likely explained the seasonal pattern of RFV that they observed in IWG RFV. A Wisconsin study of an IWG monoculture and an intercrop of IWG+red clover (Trifolium pratense L.) also reported RFV values of 175, 116, and 65 for spring, fall, and summer, respectively, in the IWG monoculture (Favre et al., 2019). While their values for fall and spring forage were greater than those observed here (101 and 127), higher summer straw RFV (75 to 85 vs 65) were observed in the present study. The RFV is used as an indicator for determining the price paid for straw and forage. The sale of the abundant, low quality summer straw and of good quality forage, albeit of limited volume, factors into the profitability of IWG DU systems.
Finally, GP and DU systems were profitable but the greatest net profit was for the GP system that included a summer grain as well as a straw harvest and sales. On the basis of net return to the enterprise, a value of $1,247 ha-1 yr-1 for the GP system and $1,096 ha-1 yr-1 for the DU was reported while in New York an organically-managed IWG crop that produced grain+straw generated a mean annual income of $432.93 ha-1 yr-1 (Law et al., 2022). The production expenses were lower in the New York study but the revenues were too. Although the present study observed that the GP system had the greatest numeric net return, the DU system was also profitable, suggesting that producers with livestock can benefit from grazing their cattle on IWG in the spring and fall when feed supply is low. The present study did not reflect the feed costs offset by grazing IWG, nor the animal gain which influences the sale price of cows. These budget items would provide additional insight into the costs and benefits of an IWG DU system.
Consideration of management decisions such as when to graze cattle on IWG can impact profitability. For example, a Minnesota study reported a DU system for grain and hay with a single fall harvest more consistently produced the best net returns compared with hay harvested in the spring only or in the fall+spring (Hunter et al., 2020b). Similarly, researchers reported diminishing returns from a third fall hay harvest compared with a single or two hay harvests per season in mature IWG stands due to limited vegetative growth between September and November (Puka-Beals et al., 2022). Thus, consideration must be given to ensure that the economic value of grazing offsets the costs of each additional grazing event.
This study was conducted in a region where row crop agriculture is economically competitive with livestock production because of the favorable climate and highly productive soils in the region. When IWG is grown on marginal land in the region, though, the DU benefit of IWG may increase since the crop can yield grain, straw, and forage on land deemed unsuitable for row crop production thereby generating up to three marketable products or at least reducing input costs of cattle feed. Moreover, as a drought tolerant species, IWG has significant potential to function as a profitable grain crop in more arid regions including the Great Plains and Intermountain West in the US. In these areas, the lower yield potential of row crops and relatively lower land prices could increase the profitability of DU IWG production and studies like this should be conducted in regions with varying growing conditions and access to agricultural markets.
Other directions for future research might compare harvesting hay vs. grazing cattle since mowing could reduce some of the fixed costs associated with managing animals (e.g., water, fencing) in a DU system. However, the costs of additional mechanical harvest and labor needs will need to be considered for a hay operation. Beyond costs, comparing these two systems may elucidate which approach, cutting hay vs. grazing, may be more feasible under different production conditions, such as years with greater or lower IWG biomass production. Studies of the impacts of incorporating cattle into IWG cropping systems on ecosystem services, such as N cycling and C storage, could highlight potential tradeoffs beyond yield and forage quality that might result from grazing IWG in a DU system. Lastly, as new cultivars of grain-type IWG come onto the market, evaluating their potential for a DU system can increase the management options available for IWG producers.
This study compared the productivity and profitability of two IWG agronomic systems. A DU system that utilized IWG for forage as well as grain and straw production extended the growing season into the fall and spring, allowing for multiple biomass harvests within a single growing season to maximize the agronomic productivity of the land, and solar energy and precipitation utilization. Furthermore, the DU system generated an additional revenue stream by valorizing forage production, which led to increased profitability compared with grain sales alone. For both grain+straw (GP) and DU systems, harvesting summer straw is recommended to increase net returns to the enterprise. Although the DU system had a lower net return than the GP system due to lower grain and straw yields in one of three years, these findings underscore the potential of a DU system to particularly enhance the productivity of more mature IWG cropping stands to generate additional income at a time when IWG grain yields decline. Where livestock are already present in an operation, grazing IWG in spring and fall can supply forage of good nutritive value to help offset the costs of purchasing feed during periods of limited forage availability. Overall, these results demonstrate how a perennial grain crop can achieve goals of sustainable intensification and provides a model that could facilitate an agroecological transition in the short-term.
The code and data sets supporting the conclusions of this article will be made available by the authors, without undue reservation.
Written informed consent was obtained from the owners for the participation of their animals in this study.
HR: Conceptualization, Data curation, Formal analysis, Visualization, Writing – original draft, Writing – review & editing. MH: Data curation, Investigation, Methodology, Writing – review & editing. AK: Data curation, Investigation, Methodology, Writing – review & editing. NT: Funding acquisition, Writing – review & editing. JJ: Conceptualization, Funding acquisition, Investigation, Methodology, Project administration, Resources, Supervision, Writing – review & editing.
The author(s) declare that financial support was received for the research and/or publication of this article. Funding for this project was provided by the Minnesota Department of Agriculture Sustainable Agriculture Demonstration Grant Program (SWIFT Contract #138801; PO #3000027068).
The authors would like to thank Jesse Puka-Beals, Dane McKittrick, Loren Dauer, Katherine Bohn, and the rest of the Sustainable Cropping Systems Lab staff for their dedication and assistance with essential research activities. We would also like to thank Kaleb Anderson for his invaluable contributions to data collection and site maintenance.
The authors declare that the research was conducted in the absence of any commercial or financial relationships that could be construed as a potential conflict of interest.
The author(s) declare that no Generative AI was used in the creation of this manuscript.
All claims expressed in this article are solely those of the authors and do not necessarily represent those of their affiliated organizations, or those of the publisher, the editors and the reviewers. Any product that may be evaluated in this article, or claim that may be made by its manufacturer, is not guaranteed or endorsed by the publisher.
The Supplementary Material for this article can be found online at: https://www.frontiersin.org/articles/10.3389/fagro.2025.1534962/full#supplementary-material
Bajgain P., Zhang X., Jungers J. M., DeHaan L. R., Heim B., Sheaffer C. C., et al. (2020). ‘MN-Clearwater’, the first food-grade intermediate wheatgrass (Kernza perennial grain) cultivar. J. Plant Registrations 14, 288–297. doi: 10.1002/plr2.20042
Culman S., Pinto P., Pugliese J., Crews T., DeHaan L., Jungers J., et al. (2023). Forage harvest management impacts “Kernza” intermediate wheatgrass productivity across North America. Agron. J. 115, 2424–2438. doi: 10.1002/agj2.21402
Culman S. W., Snapp S. S., Ollenburger M., Basso B., DeHaan L. R. (2013). Soil and water quality rapidly responds to the perennial grain Kernza wheatgrass. Agronomy J. 105 (3), 735–744. doi: 10.2134/agronj2012.0273
Da Silva S. C., Sbrissia A. F., Pereira L. E. T. (2015). Ecophysiology of C4 forage grasses: understandingplant growth for optimizing their use and management. Agriculture 5, (598–625). doi: 10.3390/agriculture5030598
Favre J. R., Munoz Castiblanco T., Combs D. K., Wattiaux M. A., Picasso V. D. (2019). Forage nutritive value and predicted fiber digestibility of Kernza intermediate wheatgrass in monoculture and in mixture with red clover during the first production year. Anim. Feed Sci. Technol. 258, 114298. doi: 10.1016/j.anifeedsci.2019.114298
Francia E., Pecchioni N., Li Destri Nicosia O., Paoletta G., Taibi L., Franco V., et al. (2006). Dual-purpose barley and oat in a Mediterranean environment. Field Crops Res. 99, 158–266. doi: 10.1016/j.fcr.2006.04.006
Guretzky J. A., Mamo M., Schacht W. H., Volesky J. D., Wingeyer A. B. (2020). Mob grazing increases trampling but not litter deposition in a Nebraska Sandhills subirrigated meadow. Crop Forage Turfgrass 6, e20047. doi: 10.1002/cft2.20047
Hunter M. C., Sheaffer C. C., Culman S. W., Jungers J. M. (2020a). Effects of defoliation and row spacing on intermediate wheatgrass I: grain production. Agron. J. 112, 1748–1763. doi: 10.1002/agj2.20128
Hunter M. C., Sheaffer C. C., Culman S. W., Lazarus W. F., Jungers J. M. (2020b). Effects of defoliation and row spacing on intermediate wheatgrass II: Forage yield and economics. Agron. J. 112, 1862–1880. doi: 10.1002/agj2.20124
Jungers J. M., deHaan L. R., Betts K. J., Sheaffer C. C., Wyse D. L. (2017). Intermediate wheatgrass grain and forage yield responses to nitrogen fertilization. Agron. J. 109, 462–472. doi: 10.2134/agronj2016.07.0438
Jungers J. M., DeHaan L. H., Mulla D. J., Sheaffer C. C., Wyse D. L. (2019). Reduced nitrate leaching in a perennial grain crop compared to maize in the Upper Midwest, USA. Agriculture Ecosystem Environ. 272, 63–73. doi: 10.1016/j.agee.2018.11.007
Kaithwas M., Singh S., Prusty S., Mondal G., Kundu S. S. (2020). Evaluation of legume and cereal fodders for carbohydrate and protein fractions, nutrient digestibility, energy and forage quality. Range Manage. Agroforestry 41, 126–132. Available online at: https://publications.rmsi.in/index.php/rma/article/view/84.
Kantar M. B., Tyl C. E., Dorn K. M., Zhang X., Jungers J. M., Kase J. M., et al. (2016). Perennial grain and oilseed crops. Annu. Rev. Plant Biol. 67, 703–729. doi: 10.1146/annurev-arplant-043015-112311
Kocer A., Albayrak S. (2012). Determination of forage yield and quality of pea (Pisum sativum L.) mixtures with oat and barley. Turkish J. Field Crops 17, 96–99.
Lanker M., Bell M., Picasso V. D. (2020). Farmer perspectives and experiences introducing the novel perennial grain Kernza intermediate wheatgrass in the US Midwest. Renewable Agric. Food Syst. 35, 653–662. doi: 10.1017/S1742170519000310
Law E. P., Wayman S., Pelzer C. J., Culman S. W., Gomez M. I., DiTommaso A., et al. (2022). Multi-criteria assessment of the economic and environmental sustainability characteristics of intermediate wheatgrass grown as a dual-purpose grain and forage crop. Sustainability 14. 3548doi: 10.3390/su14063548
Law E., Wayman S., Pelzer C. J., DiTommaso A., Ryan M. R. (2021). Intercropping red clover with intermediate wheatgrass suppresses weeds without reducing grain yield. Agron. J. 114, 700–716. doi: 10.1002/agj2.20914
Lenth R. (2023). _emmeans: Estimated Marginal Means, aka Least-Squares Means_. R package version 1.9.0. Available online at: https://CRAN.R-project.org/package=emmeans (Accessed January 10, 2024).
Minnesota Department of Natural Resources (2025). Retrieve Climate Data from National Weather Service Reporting Stations. [Data set]. Minnesota Department of Natural Resources. Available at: https://www.dnr.state.mn.us/climate/historical/acis_stn_meta.html (Accessed March 5, 2025).
Moore K. J., Jung H.-J. G. (2001). Lignin and fiber digestion. J. Range Manage. 54, 420–430. doi: 10.2307/4003113
Moore J. E., Undersander D. J. (2002). “Relative forage quality: An alternative to relative feed value and quality index,” in 13th annual florida ruminant nutrition symposium (Gainesville, FL, USA: University of Florida), 16–32.
Pinheiro J., Bates D., R Core Team (2023). nlme: Linear and Nonlinear Mixed Effects Models. R package version 3, 1–163. Available at: https://CRAN.R-project.org/package=nlme (Accessed January 10, 2024).
Pinto P., Cartoni-Casamitjana S., Cureton C., Stevens A. W., Stoltenberg D. E., Zimbric J., et al. (2022). Intercropping legumes and intermediate wheatgrass increases forage yield, nutritive value, and profitability without reducing grain yields. Front. Sustain. Food Syst. 6. doi: 10.3389/fsufs.2022.977841
PRISM Climate Group. (2025). Time Series Values for Individual Locations. [Data set] Oregon State University. Available at: https://www.prism.oregonstate.edu/explorer/ (Accessed March 5, 2025).
Pugliese J. Y., Culman S. W., Sprunger C. D. (2019). Harvesting forage of the perennial grain crop Kernza (Thinopyrum intermedium) increases root biomass and soil nitrogen. Plant Soil 437, 241254. doi: 10.1007/s11104-019-03974-6
Puka-Beals J., Sheaffer C. C., Jungers J. M. (2022). Forage yield and profitability of grain-type intermediate wheatgrass under different harvest schedules. Agrosystems Geosciences Environ. 5, e20274. doi: 10.1002/agg.20274
Pursley A. A., Biligetu B., Warkentin T. D., Lardner H. A., Penner G. B. (2020). Effect of incorporating forage pea (Pisum sativum L.) hay into cereal hay on ruminal fermentation and apparent digestibility when fed to beef heifers. Can. J. Anim. Sci. 100, 716–728. doi: 10.1139/cjas-2020-0002
R Core Team (2023). R: A language and environment for statistical computing (Vienna, Austria: R Foundation for Statistical Computing). Available at: https://www.R-project.org/ (Accessed January 10, 2024).
Reily E. C., Gutknecht J. L., Sheaffer C. C., Jungers J. M. (2022). Reductions in soil water nitrate beneath a perennial grain crop compared to an annual crop rotation on sandy soil. Front. Sustain. Food Syst. 6. doi: 10.3389/fsufs.2022.996586
Smart A. J., Derner J. D., Hendrickson J. R., Gillen R. L., Dunn B. H., Mousel E. M., et al. (2010). Effects of grazing pressure on efficiency of grazing on North American Great Plains rangelands. Rangeland Ecol. Manage. 63, 397–406. doi: 10.2111/REM-D-09-00046.1
van der Pol L. K., Nester B., Schlautman B., Crews T. E., Cotrufo M. F. (2022). Perennial grain Kernza® fields have higher particulate organic carbon at depth than annual grain fields. Can. J. Soil Sci. 102, 1005–1009. doi: 10.1139/CJSS-2022-0026
Yavuz K., Gulumser E. (2022). Evaluation of forage turnip + cereal mixtures for forage yield and quality traits. Turkish J. Field Crops 27, 26–32. doi: 10.17557/tjfc.1014538
Keywords: Thinopyrum intermedium, perennial grain, nutritive value, enterprise budget, forage yield
Citation: Rusch HL, Hunter MC, Kraus A, Tautges NE and Jungers JM (2025) Intermediate wheatgrass as a dual use crop for grain and grazing. Front. Agron. 7:1534962. doi: 10.3389/fagro.2025.1534962
Received: 26 November 2024; Accepted: 12 March 2025;
Published: 10 April 2025.
Edited by:
Moritz Von Cossel, University of Hohenheim, GermanyReviewed by:
Abhishek K. Bhardwaj, Amity University, IndiaCopyright © 2025 Rusch, Hunter, Kraus, Tautges and Jungers. This is an open-access article distributed under the terms of the Creative Commons Attribution License (CC BY). The use, distribution or reproduction in other forums is permitted, provided the original author(s) and the copyright owner(s) are credited and that the original publication in this journal is cited, in accordance with accepted academic practice. No use, distribution or reproduction is permitted which does not comply with these terms.
*Correspondence: Jacob M. Jungers, anVuZ2UwMzdAdW1uLmVkdQ==
Disclaimer: All claims expressed in this article are solely those of the authors and do not necessarily represent those of their affiliated organizations, or those of the publisher, the editors and the reviewers. Any product that may be evaluated in this article or claim that may be made by its manufacturer is not guaranteed or endorsed by the publisher.
Research integrity at Frontiers
Learn more about the work of our research integrity team to safeguard the quality of each article we publish.