 David Rivest
 Marc-Olivier Martin-Guay
 Ève-Marie Hébert
 Audrey Maheu
- Département des sciences naturelles & Institut des sciences de la forêt tempérée, Université du Québec en Outaouais, Ripon, QC, Canada
Agroforestry is increasingly recognized as an effective tool for enhancing multifunctionality in agroecosystems globally, improving land-use efficiency and delivering multiple ecosystem services (ES). This study investigates the multifunctionality of tree-based intercropping (TBI) systems, which integrate widely spaced rows of trees with agricultural crops and can be adapted to different climates. We assessed spatial gradients of 11 ES indicators based on field measurements taken at increasing distances from the tree rows within a temperate TBI system of 50 trees ha-1, aged 7 to 10 years. These indicators were compared between the TBI system and agricultural control plots, which were managed similarly to the cultivated alleys in the TBI system but without trees. We measured light availability, soil moisture and crop yields (forage and wheat) across cultivated alleys associated with three tree species compositions: 1) red oak in monoculture, 2) hybrid poplar in monoculture, and 3) a mix of red oak and hybrid poplar alternating along the row. The greatest variation in ES indicators within the cultivated alleys, compared to the agricultural controls, was frequently observed nearest to the tree rows. Specifically, yields of annual crops (wheat and corn), soil moisture, P supply, NO3- leaching rates and bulk density decreased, while potential evaporation increased in areas closest to the tree rows, in contrast to measurements taken near the alley centre and in the control plots. Other ES indicators, including forage yield, N and K supplies, and soil C stocks, remained unaffected by the TBI system. Our results suggest that trade-offs between ES may occur at fine scales and be location-specific within TBI systems. Plots containing poplar (alone or mixed with red oak) exhibited lower soil moisture and light availability compared to those with red oak only, resulting in a greater decrease in wheat yield at the tree-crop interface. Conversely, C stocks in fast-growing poplar biomass were substantially higher than those in red oak. We conclude that composition of tree species is crucial in determining trade-offs in ES delivery within TBI systems. At the system level, we found comparable levels of multifunctionality between TBI and control plots, likely due to the limited sample size of aggregated data.
1 Introduction
Agroforestry is considered a key tool for achieving sustainability in agriculture worldwide, which is why significant resources have been allocated to agroforestry research in both developing and developed countries (Liu et al., 2019). Temperate tree-based intercropping (TBI) systems, which are also known as alley cropping or silvoarable systems, combine widely spaced tree rows and various agricultural crops that are cultivated in the alleys between them. These systems typically use high-value hardwood species and fast-growing trees (e.g., poplars and willows) alongside annual or perennial field crops (Wolz and DeLucia, 2018). The design of tree-crop combinations in TBI systems aims to optimize land-use efficiency, while promoting synergies in the delivery of multiple ecosystem services (ES), a concept that is referred to as multifunctionality. A deeper understanding of how TBI systems contribute to multifunctionality is crucial for assessing whether they can sustainably fulfill both ecological and economic objectives. This is especially significant given that conventional agricultural systems often prioritize maximizing yield at the expense of essential ecosystem functions. Assessing multifunctionality of agroforestry systems has mostly been conducted through meta-analyses at the regional scale, whether in Africa or Europe (Félix et al., 2018; Kuyah et al., 2019; Torralba et al., 2016).
TBI systems have shown the capacity to deliver a diverse array of ES, including improved soil nutrient cycling and water regulation, increased C sequestration, enhanced biodiversity, and the stabilization of crop yields under climate change conditions (Kletty et al., 2023; Mayer et al., 2022; Reyes et al., 2021; Torralba et al., 2016). TBI systems could also play a crucial role in enhancing food security in developing regions (e.g., Kuyah et al., 2019). However, as the trees mature, competition for sunlight and soil moisture near tree rows often leads to reduced crop yields (Ivezić et al., 2021; Majaura et al., 2024). Since crop production is a critical ES and a primary factor influencing farmers’ decisions to adopt TBI systems, this competition poses a significant challenge (Graves et al., 2009; Laroche et al., 2019). Some studies have indicated that crop yields may increase at greater distances from the trees, although the mechanisms behind this facilitation remain poorly understood (Gagné et al., 2022; Piotto et al., 2024). To optimize TBI system designs and promote their broader adoption, it is essential to examine how tree rows and management practices affect the spatial and temporal dynamics of crop yields and other ES within alleys. One of the key management decisions is tree species selection and the present study specifically examines this aspect, which shapes both competitive and facilitative interactions between trees and crops (Scordia et al., 2023).
Few studies have thoroughly evaluated the trade-offs and synergies among the various ES that are provided by temperate TBI systems (Veldkamp et al., 2023). Addressing this knowledge gap could provide scientifically grounded guidance for shaping policy decisions and designing incentive structures, such as payments for ES schemes, to encourage broader adoption of TBI systems by farmers (Thiesmeier and Zander, 2023). Multifunctionality can be quantified using arbitrary thresholds for each ES (Byrnes et al., 2014; Grass et al., 2020), or by comparing multiple ES or categories across different agroecosystems (Clough et al., 2016; Rolo et al., 2021; Veldkamp et al., 2023). Analyzing correlations among ES can also help identify trade-offs and synergies in the transition from conventional agricultural systems to agroforestry systems (Cerda et al., 2019; Grass et al., 2020; Rapidel et al., 2015). For example, while dedicating land to trees may reduce agricultural production (Ivezić et al., 2021), it often leads to increased C sequestration in both biomass and soils (Ivezić et al., 2022; Ma et al., 2020). This trade-off has also been identified in tropical climates along the intensification gradient of rubber and oil palm plantations (Clough et al., 2016; Grass et al., 2020). Here, we present a novel approach for quantifying ecosystem multifunctionality in temperate TBI systems, focusing on either the cropped area or the whole TBI system. By assessing multiple ES simultaneously, we aim to provide a comprehensive evaluation of ecological performance of TBI system.
The first objective of this study was to assess spatial gradients of 11 ES indicators at increasing distances from the tree rows within a TBI system (50 trees ha-1; 7- to 10-years-old) and compare them to agricultural controls, i.e., fields without trees but managed in the same way as the cultivated alleys in the TBI system. These 11 indicators were grouped into four ES categories: provisioning (forage, wheat and corn yields), water quantity and quality regulation (soil bulk density as a proxy for water infiltration, potential evaporation, volumetric water content and NO3- leaching), climate regulation (soil organic C and tree C stocks) and nutrient cycling (supply of NO3-, P and K). We hypothesized that the greatest variation in multifunctionality within the cultivated alleys, compared to agricultural controls, would be observed near the tree rows, where above- and below-ground tree-crop interactions are most intense. The second objective was to assess the effect of tree species composition on crop production. Over two years, we measured light availability, soil moisture, and crop yields (forage and wheat) within cultivated alleys that were associated with three contrasting tree species compositions along the tree row: 1) moderately growing red oak; 2) fast-growing hybrid poplar; and 3) a mixture of red oak and hybrid poplar alternating along the row. We hypothesized that the lowest crop yields would occur in plots with only fast-growing hybrid poplar, especially near the tree rows, where competition for light and water is expected to be the greatest. The third objective was to compare ecosystem multifunctionality between the TBI system and the agricultural control, focusing on trade-offs and synergies between different ES categories. We hypothesized that ES related to nutrient cycling, water regulation, and climate regulation would improve in the TBI system compared to the controls, while provisioning ES would remain unchanged or decrease. As a result, we anticipated trade-offs between specific provisioning ES and others, as well as synergies among nutrient cycling and climate regulation ES.
2 Materials and methods
2.1 Study site and experimental design
The experimental site was located near St-Télesphore (45°17’N, 74°26’W; ca. 67 m above sea level), in southwestern Québec, Canada. The region’s 30-year climate normals (1981–2010) indicate an annual average temperature of 5.8°C and total precipitation of 1077 mm (Dalhousie Mills station, 45° 19’ N, 74° 28’ W). The terrain is gently sloped and stone-free. The soil, derived from marine deposits, is classified as a Humic Gleysol (Soil series: Dalhousie; Soil Classification Working Group, 1998) with a clay loam texture (24% sand, 38% silt, 38% clay) and bulk pH of 6.3 in the uppermost 20 cm.
The experimental site was established in a ca. 10-ha field with subsurface drainage, where a tree-based intercropping (TBI) system had been established in May 2014. The system comprised eight single tree rows, each 170 m in length, oriented northwest-southeast (Figure 1). Trees were spaced 5 m apart within the rows and 40 m between rows, yielding a density of 50 trees ha-1. The experimental design was divided into three replicated blocks. Each block included 11 TBI plots (consisting of sequences of five to ten trees) and two adjacent control plots without trees, which followed the same cropping history and management practices.
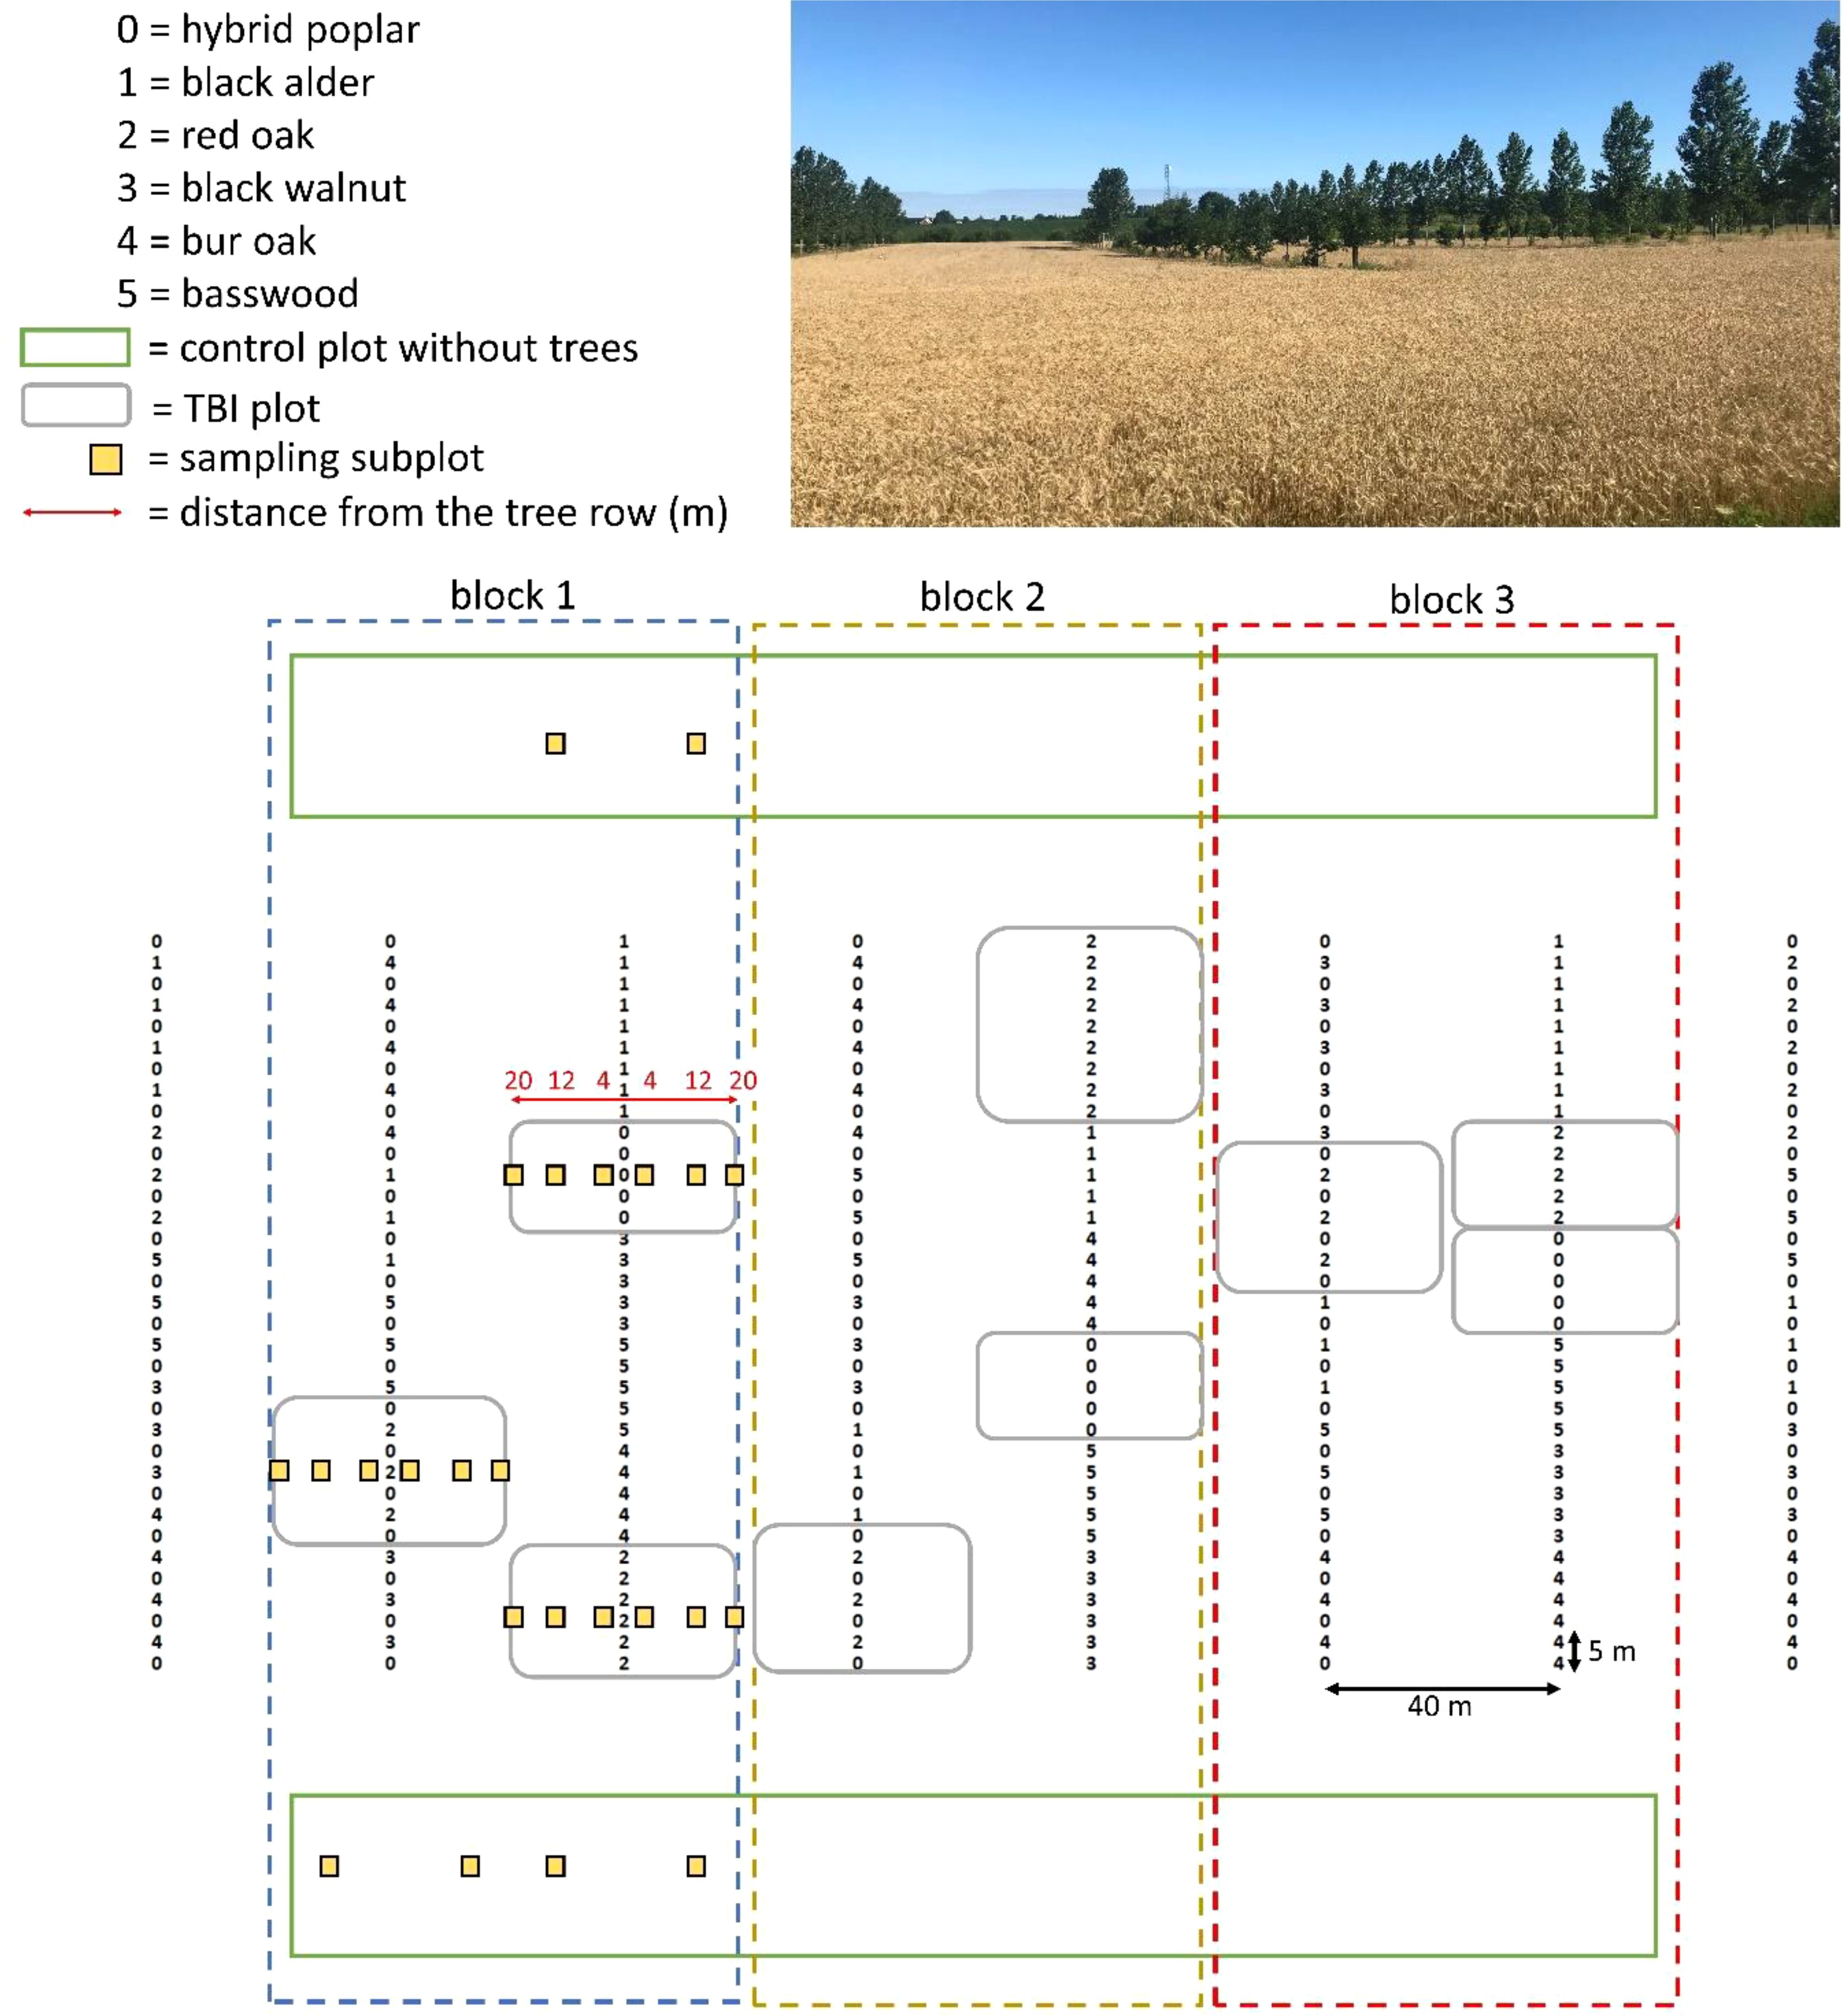
Figure 1. Experimental layout (not to scale) of the tree-based intercropping system. The first and last rows of trees form guard rows. The photo was taken in August 2022, a few days before wheat harvesting, when the system was 9-years-old. Centre of the photo: a sequence of moderate-growth red oak; right of the photo: a sequence of fast-growing hybrid poplars alternating with different hardwood species; bottom of the photo: an agricultural control plot.
Within the TBI system, six randomly distributed plots in each tree row were planted with high-value hardwoods (European black alder, Alnus glutinosa [L.] Gaerrtn.; red oak, Quercus rubra L.; black walnut, Juglans nigra L.; bur oak, Quercus macrocarpa Michx.; basswood, Tilia Americana L.) or fast-growing hybrid poplar (Populus deltoides W. Bartram ex Marshall x Populus nigra L., clone 3570) in monoculture. Five plots that were randomly distributed in other rows were also composed of alternating high-value hardwoods and hybrid poplars (Figure 1). By September 2023, 10 years after planting, the hybrid poplars had reached an average height of 14.8 m and a diameter at breast height (DBH) of 29.5 cm, while the hardwoods reached 5.0 m in height and 8.7 cm in DBH. Since planting in 2014, both poplars and hardwoods have undergone annual shape pruning (to maintain a single straight stem) and branch pruning (up to one-third of tree height). A 1.5 m-wide uncultivated strip was maintained along each tree row. Herbaceous vegetation in this strip was controlled using a continuous black polythene-film mulch. In the cultivated alleys and in the control plots, the crop rotation followed a sequence that included perennial forage mixture (alfalfa, Medicago sativa L.; timothy, Phleum pratense L.; and tall fescue, Festuca arundinacea [Schreb.] Dumort.; two harvests per growing season; 2014-2015 and 2019-2021), corn (Zea mays L.; 2016 and 2023), wheat (Triticum aestivum L.; 2017 and 2022) and soybean (Glycine max [L.] Merrill; 2018). Annual crops were grown using conventional tillage, consisting of a mouldboard plough to a depth of 20 cm in the autumn post-harvest, followed by disking and harrowing to 10 cm before seeding. Herbicide use, cultivars/hybrids, and fertilization levels were aligned with local agronomic recommendations (Centre de Référence en Agriculture et Agroalimentaire du Québec (CRAAQ), 2010; Réseaux grandes cultures du Québec (RGCQ), 2016). Nitrogen fertilizer applications followed standard rates: about 150 kg ha−1 in corn, 100 kg ha−1 in wheat, 25 kg ha−1 in soybean, and 60–80 kg ha−1 in perennial forages.
In this study, measurements were focused on three of the 11 TBI plots: (1) red oak monoculture; (2) poplar monoculture; and (3) red oak alternating with poplar (Figure 1). Sampling within these TBI plots was conducted along transects that were positioned perpendicularly to the tree rows, centrally located within each plot (Figure 1). Variables were typically measured at four distances from the tree row (referred to as subplots): 4 m, 12 m, 20 m (representing the alley centre), and an agricultural control plot located more than 30 m from the nearest tree row. This setup resulted in a total of 72 subplots (3 blocks × 3 TBI plots × 2 transects × 4 distances). Most variables, except for soil C and bulk density in 2023, were assessed using all or a subset of these 72 subplots. In early October 2022, soil texture in the uppermost 20 cm was determined. For each subplot, six evenly spaced soil cores (7 cm in diameter) were collected and combined into a composite sample, which was then sieved through a 2-mm mesh. The proportions of sand, silt, and clay were determined using the hydrometer method.
2.2 Crop yields
In 2021, forage yield (g m-2) was measured in the 72 subplots before each harvest by the farmer, on 12 June and 11 August, using one 1 m² quadrat per subplot. Fresh mass from each quadrat was recorded in the field after manually cutting all aboveground biomass to a height of 5 cm above the soil surface. Fresh subsamples (~500 g) were dried to a constant mass at 60°C to calculate forage yield on a dry-mass basis. In 2022, wheat yield was measured on 26 July in each of the 72 subplots, using a quadrat covering 0.86 m² (1.5 m × 0.57 m, with 19 cm row spacing). In 2023, corn yield was determined on 2 October using quadrats covering 1.52 m² (2 m × 0.76 m, with 76 cm row spacing) in 24 subplots (3 blocks × 1 TBI plot [red oak + hybrid poplar] × 2 transects × 4 distances). Wheat grain was separated using a laboratory thresher, while corn samples were threshed manually. Both wheat and corn seeds were cleaned and dried at 40°C for 72 h before yield determination.
2.3 Proportion of total light transmittance
In September 2022, hemispherical photographs were taken at a height of 1 m above ground in each of the 72 subplots using a digital camera (Nikon Coolpix 995, Tokyo, Japan) that was equipped with a hemispherical lens (Nikkor fisheye converter FC-E8). The PTLT (direct and diffuse) throughout the growing season was estimated using Gap Light Analyzer software (Frazer et al., 1999). The analysis was conducted with a temporal resolution of 1 minute and a spatial resolution of 36 azimuthal directions across 9 zenith angles.
2.4 Soil volumetric water content and potential evaporation
Soil VWC (%) was measured in the uppermost 7.5 cm of mineral soil across the 72 subplots using a Field Scout TDR 350 Soil Moisture Meter (Spectrum Technologies, Aurora, IL, USA). Measurements were taken multiple times during the 2021 growing season (on July 11, August 5, and September 13) and throughout the 2022 growing season (on June 14, June 29, July 14, and July 26). Each measurement represented the average of 10 readings taken within each subplot.
To assess potential evaporation, non-covered Piché evaporimeters were installed in 16 subplots (2 blocks × 1 TBI plot [red oak + poplar] × 2 transects × 4 distances) during multiple rainless 24-h periods in 2021 (deployed on July 10, August 4, and September 13) and in 2022 (deployed on June 27, June 28, July 13, and July 25). To normalize moisture loss due to evaporation, the volume of evaporated water was divided by the exact time difference (to the minute) between two measurements.
2.5 Soil nutrient supply
Soil nutrient supply rates under field conditions were assessed in 24 subplots (3 blocks × 1 TBI plot [red oak + poplar] × 2 transects × 4 distances). In 2021, soil nitrate (NO3-) and ammonium (NH4++) supply rates were measured using 25 mm x 100 mm anion and cation exchange membranes (Duran et al., 2013; AR204SZRA and CR67-HMR, Durpro, Candiac, QC, Canada) during two burial periods: from June 29 to August 12 (44 days) and from September 2 to 27 (25 days). For each burial period, three pairs of membranes (one of each type, approximately 30 mm apart; pairs spaced 2 m apart) were incubated at a depth of 0–10 cm and then bulked into one composite sample for both membrane types. After removal from the field, each composite sample was rinsed with distilled water and extracted with 35 ml of 2 M KCl (shaken for 1 h at 60 rpm), filtered (Whatman No. 42), and analyzed colorimetrically for NO3- and NH4+ using a SEAL AA3 AutoAnalyzer (Folio Instruments, Kitchener, ON, Canada). The membranes were scanned to estimate the contact area for each type. It should be noted that this method yields values relative to the membrane surface area, rather than the soil surface area, due to the unknown radius of adsorption by the membranes.
In 2022, NO3- and NH4+, phosphorus (P), and potassium (K) supply rates were measured using Plant Root Simulator (PRS®) probes (Hangs et al., 2004). This technology also utilizes cation and anion exchange membranes (adsorbing surface area of 17.5 cm² per probe) that are encapsulated in thin plastic probes. In each subplot, four anion and four cation PRS probes were buried to a depth of 5–10 cm (one additional pair compared to 2021, but with the same distances within and between pairs) during two burial periods: from June 10 to July 4 (24 days) and from July 4 to 26 (22 days). These probes were bulked into one composite sample per subplot for both probe types. Cleaned PRS probes were stored at 4°C before being sent back to the manufacturer (Western Ag Innovations, Saskatoon, SK, Canada) for complete analysis. Following elution, NO3- and NH4+ in the eluant were determined colorimetrically using automated flow-injection analysis (Skalar San++ Analyzer, Skalar Inc., Breda, The Netherlands), while P and K were measured using inductively coupled plasma spectrometry (Optima ICP-OES 8300, PerkinElmer Inc., Waltham, MA, USA). Both ion exchange membranes methods yield similar results, allowing the choice of the most affordable or practical option depending on available financial resources.
2.6 Nitrogen leaching
Leaching of NO3- and NH4+ was assessed using ion exchange resin lysimeters, following the methodology described by Rivest and Martin-Guay (2024). These passive lysimeters were constructed from PVC pipe sections measuring 10 cm in length and 10 cm in diameter, filled with a mixture of cation and anion exchange resins (50 g of C100E and 50 g of A400, fresh masses; Durpro). The lysimeter construction included the following layers from bottom to top: 1) 125 ml of sand to prevent contamination from below, placed on top of a permeable polyester membrane with 0.3-mm pores; 2) the resin mixture contained between two permeable membranes; 3) 150 ml of sand; 4) 150 ml of a 50:50 mixture of sand and native soil; and 5) native soil to fill the remaining space. Lysimeters were deployed during two burial periods: from May 17, 2021 (allowing two weeks for deployment), to June 2, 2022 (one week for retrieval and redeployment), and from June 2, 2022, to October 18, 2022 (two days for retrieval). A total of 16 subplots (3 blocks × 1 TBI plot [red oak + poplar] × 1 or 2 transects [block 1 included two transects] × 4 distances) had two lysimeters installed at a depth of 40 cm (top of the lysimeter) beneath an undisturbed soil profile, ensuring adequate contact with the soil (32 samples per burial period). To achieve this, a square pit (about 70 cm on each side and 50 cm deep) was manually excavated in each plot, and the lysimeters were placed at the ends of two horizontal tunnels (10 cm width and height; 40 cm length) that originated from the corners of the pit bottom, spaced 60 cm apart. The tunnels were oriented to maximize the distance from the disturbed pit surface (approximately 100 cm between the two lysimeters). The pits were refilled after the lysimeters were deployed. Upon retrieval of the resin lysimeters, NO3- and NH4+ were extracted from the entire resin using 500 ml of 2 M KCl (shaken for 1 h at 60 rpm), followed by filtration of the extracts (Whatman No. 42). The filtrates were then analyzed for NO3- and NH4+ concentrations using a SEAL AA3 AutoAnalyzer.
2.7 Soil and tree C stocks
Soil bulk density and soil C stock were determined in 36 subplots (3 blocks × 2 TBI plot [red oak only and poplar only] × 1 transect [for this protocol, the two transects were combined into one for each TBI plot, i.e., each subplot is a combination of the two subplots at the same distance on both sides of the tree row] × 6 distances [0 m, 2 m, 4 m, 8 m, 20 m and control]) from soil samples collected in June 2023. In each subplot, six soil cores (7 cm dia., with three cores collected on each side of the tree row and spaced 10 m apart) were collected and bulked into three composite samples for three separate depth layers (0-20, 20-40 and 40-60 cm). Total C concentration (mg g-1) of these composite samples was measured following high-temperature combustion (1450 °C) by thermal conductometric detection using a TruMac CNS analyzer (LECO, St. Joseph, MI, USA). The top layer subsamples (0-20 cm) were analyzed for texture using the hydrometer method. Bulk density for each layer (g cm-3; 10, 20 and 50 cm depths) was determined from a dried (105°C for 48 h) 90.59 cm3 soil sample in the westward transect. Data for the 10-cm layer were combined with those from a similar bulk density sampling conducted in early June 2022 across the main 72 subplots, resulting in a total of N = 108 samples. Soil C stocks (Mg ha-1) for each layer were calculated by using Equation 1, which is as follows:
Soil C stocks were subsequently converted to an equivalent soil mass basis following the method that was outlined by Wendt and Hauser (2013) to facilitate comparability across all distances from the tree row, accounting for variations in soil bulk density within the site. A reference soil mass of 5400 t ha-1 was selected, which corresponds to an average depth of 42 cm. This approach was employed to avoid extrapolations when using predictive models (i.e., for each subplot, a monotonic cubic spline of the relation “cumulative soil C stocks ~ cumulative soil mass” using the whole profile [0-60 cm]).
Tree heights and diameters at breast height (DBH) were recorded in autumn 2023. Red oak biomass for branches, wood, and bark was estimated using allometric equations that were developed by Lambert et al. (2005), with a correction factor of 1.2 applied to account for enhanced crown development in trees that were located on agricultural land (Zhou et al., 2015). The above-ground biomass of hybrid poplar was estimated using allometric equations specifically developed in an agroforestry context for the same clone that was used in our experiment (Fortier et al., 2013). For both species, below-ground biomass was estimated using Equation 5 from Li et al. (2003). Subsequently, tree C stocks were calculated using species-specific C concentrations for stems that were sourced from the global database compiled by Doraisami et al. (2022).
2.8 Other measured variables
Some of the variables that were measured during the 2021 and 2022 growing seasons were not included in the main paper, as they were not used in the primary analyses of multifunctionality and trade-offs. Although many of these variables could be linked to ecosystem services, better proxies (i.e., a measured variable correlated to an ES and indirectly representing it) or direct indicators were used in the main analyses. For instance, while wheat height and Fabaceae biomass could serve as proxies for provisioning services, wheat grain yield and total forage biomass are more appropriate and direct indicators. The omitted variables include: 1) forage composition in Fabaceae and Poaceae, and their ratio; 2) wheat height and harvest index; 3) macronutrient supply rates of NH4+, Ca, and Mg; 4) NH4+ leaching; 5) leaf litter; 6) soil organic matter; 7) ambient air temperature and relative humidity; and 8) vapour-pressure deficit. The methods and results for these variables are presented in Appendix S1 in Suppplemetary Data Sheet 1.
2.9 Statistical analyses
2.9.1 Effects of the distance to the tree row
To test the effects of distance and tree row composition, general linear mixed-effect models were used for our twelve independent variables (Table 1). The significance of each predictor was determined using ANOVA with Type-III sums-of-squares. To achieve residual normality and homoscedasticity, some independent variables were transformed prior to modelling. The simplest form of model was run for corn yield:
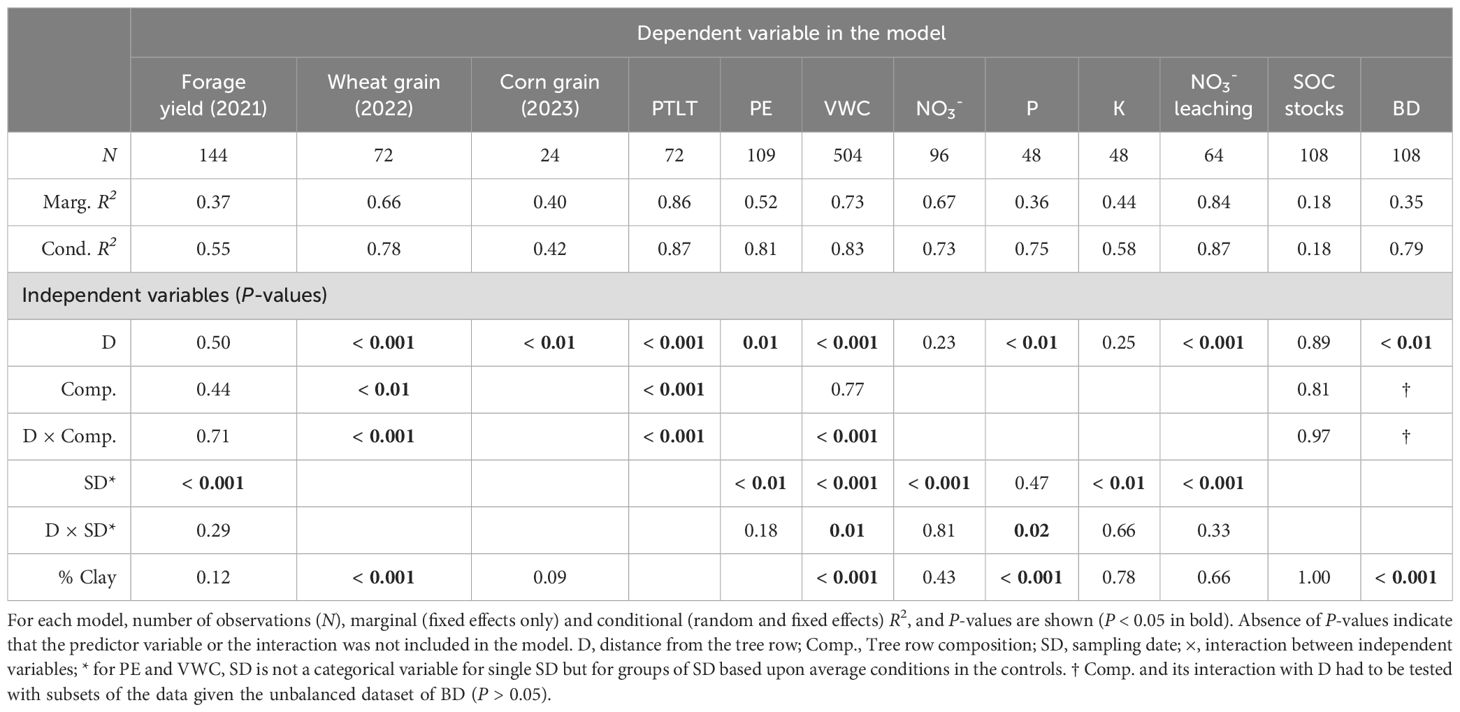
Table 1. ANOVA of general linear mixed models explaining yields (forage biomass in 2021, wheat grain in 2022, corn grain in 2023), proportion of total light transmitted (PTLT), potential evaporation (PE), soil volumetric water content (VWC), macronutrient supply rates (NO3-, P and K), NO3- leaching, soil organic carbon (SOC) stocks and soil bulk density (BD).
where D is a categorical variable for every distance and the control; %Clay is the soil content in clay; and a random effect control for block spatial correlation.
For wheat yield, PTLT (logit-transformation; %Clay was excluded from the predictors), SOC stocks and soil bulk density, tree row composition (Comp.) was added as a categorical variable to the model (the dependent variable referred to as Y) with its interaction with D:
For supply rates of NO3-, P and K, and leaching rate of NO3- (log-transformation was necessary for these four variables), only one tree row composition was studied (red oak + poplar) at multiple sampling dates (SD, categorical variable), resulting in this model:
where an interaction between D and SD was tested; and a nested random effect controlled for the repeated measurements made on the same subplot. Given there were two lysimeters per subplot (or pit) for NO3- leaching rate, Tunnel was also added to the random effects nested within subplot.
For potential evaporation (PE, square-root-transformation), samplings were assigned to two groups (Evaporation intensity, low vs. high), based upon average PE in the controls, resulting in this model:
where an interaction between Evaporation intensity and D is tested; and a crossed random effect controlling for correlation within each sampling is added to the nested random effects.
For forage yield, available data included different samplings and different tree row compositions, resulting in the following model:
where both SD and Comp. are tested in interaction with D.
Soil VWC was also sampled on multiple occasions and in different tree row compositions, except that groups of samplings were used instead of SD in interaction with D. These groups (control VWC, low vs. high) were based upon average soil humidity conditions within the controls. The resulting model was:
Multiple comparisons (Tukey’s HSD) among distances and the controls were made when D was significant. When its interaction with another variable was significant, these multiple comparisons were also made within each category of this second variable (e.g., among distances and the controls within each sampling date).
2.9.2 Multifunctionality, trade-offs and synergies
ES indicators were assigned to one of four categories, i.e., provisioning (forage, wheat and corn yields), water regulation (soil BD [proxy for water infiltration], PE, NO3- leaching and VWC), climate regulation (SOC and tree C stocks) and nutrient cycling (supply of NO3-, P and K). Almost all ES were measured only within the cultivated alleys of the TBI system; thus, the main multifunctionality analysis compared this part of the TBI system to controls and excluded tree C. A reduced analysis was performed using only provisioning and climate regulation ES for the whole area of the TBI system, i.e., including the tree row and tree C. Weighted averages were calculated for each transect within the TBI system based upon the area that was represented by each subplot, which was decided by using the half distance between two subplots (e.g., for a transect representing the cultivated alley: 4 m = 1 to 8 m; 12 m = 8 to 16 m; and 20 m = 16 to 20 m). When multiple samplings of the same ES were performed on a specific transect, the overall average was used. For each ES, data were Z-standardized by subtracting the mean and dividing by the standard deviation (µ = 0, σ = 1) to obtain comparable values among ES (Clough et al., 2016). For soil BD, PE and NO3- leaching, the additive inverses of the standardized values were used; thus, larger and positive values meant beneficial effects for all ES indicators. For each ES category, we used the following mixed model:
where ES is a categorical variable comparing ES indicators, System is a categorical variable comparing the TBI system to controls, and both System and %Clay interact with ES. The same ANOVA procedure was used (nutrient supply rates had to be log-transformed prior to Z-standardization to obtain normally distributed residuals). Multiple comparisons were made to compare systems for each ES indicator.
To assess trade-offs and win-win situations, Pearson’s correlation coefficients (r) were calculated for each pair of ES. The visualization of these correlations with elliptic confidence intervals for each system allowed us to determine whether the difference between TBI transects and control subplots explained these correlations (Supplementary Figure 9).
All analyses were performed in R version 4.2.3 (R Core Team, 2023) with packages “lme” for mixed models (Pinheiro et al., 2023), “glmmTMB” for mixed models with crossed random effects (Brooks et al., 2017), “car” for ANOVA and Levene’s tests (Fox and Weisberg, 2019) and “emmeans” for multiple comparisons (Lenth, 2023).
3 Results
3.1 Crop and forage yields
In 2021, forage yield was not significantly affected by either distance from the tree row or tree row composition (Table 1; Figure 2A). In 2022, a significant interaction was observed between distance from the tree row and tree row composition on wheat yield (Table 1). In plots that were planted solely with red oak, wheat yield was lowest at 4 m from the tree row, intermediate at 12 m, and highest at 20 m and in control plots without trees (Figure 2C). In plots containing a mix of red oak and hybrid poplar or hybrid poplar alone, wheat yield at 4 m was lower than at the other distances. In 2023, corn yield at 4 m was significantly lower than at 20 m, although no significant differences were found between 12 m and control plots (Figure 2B).
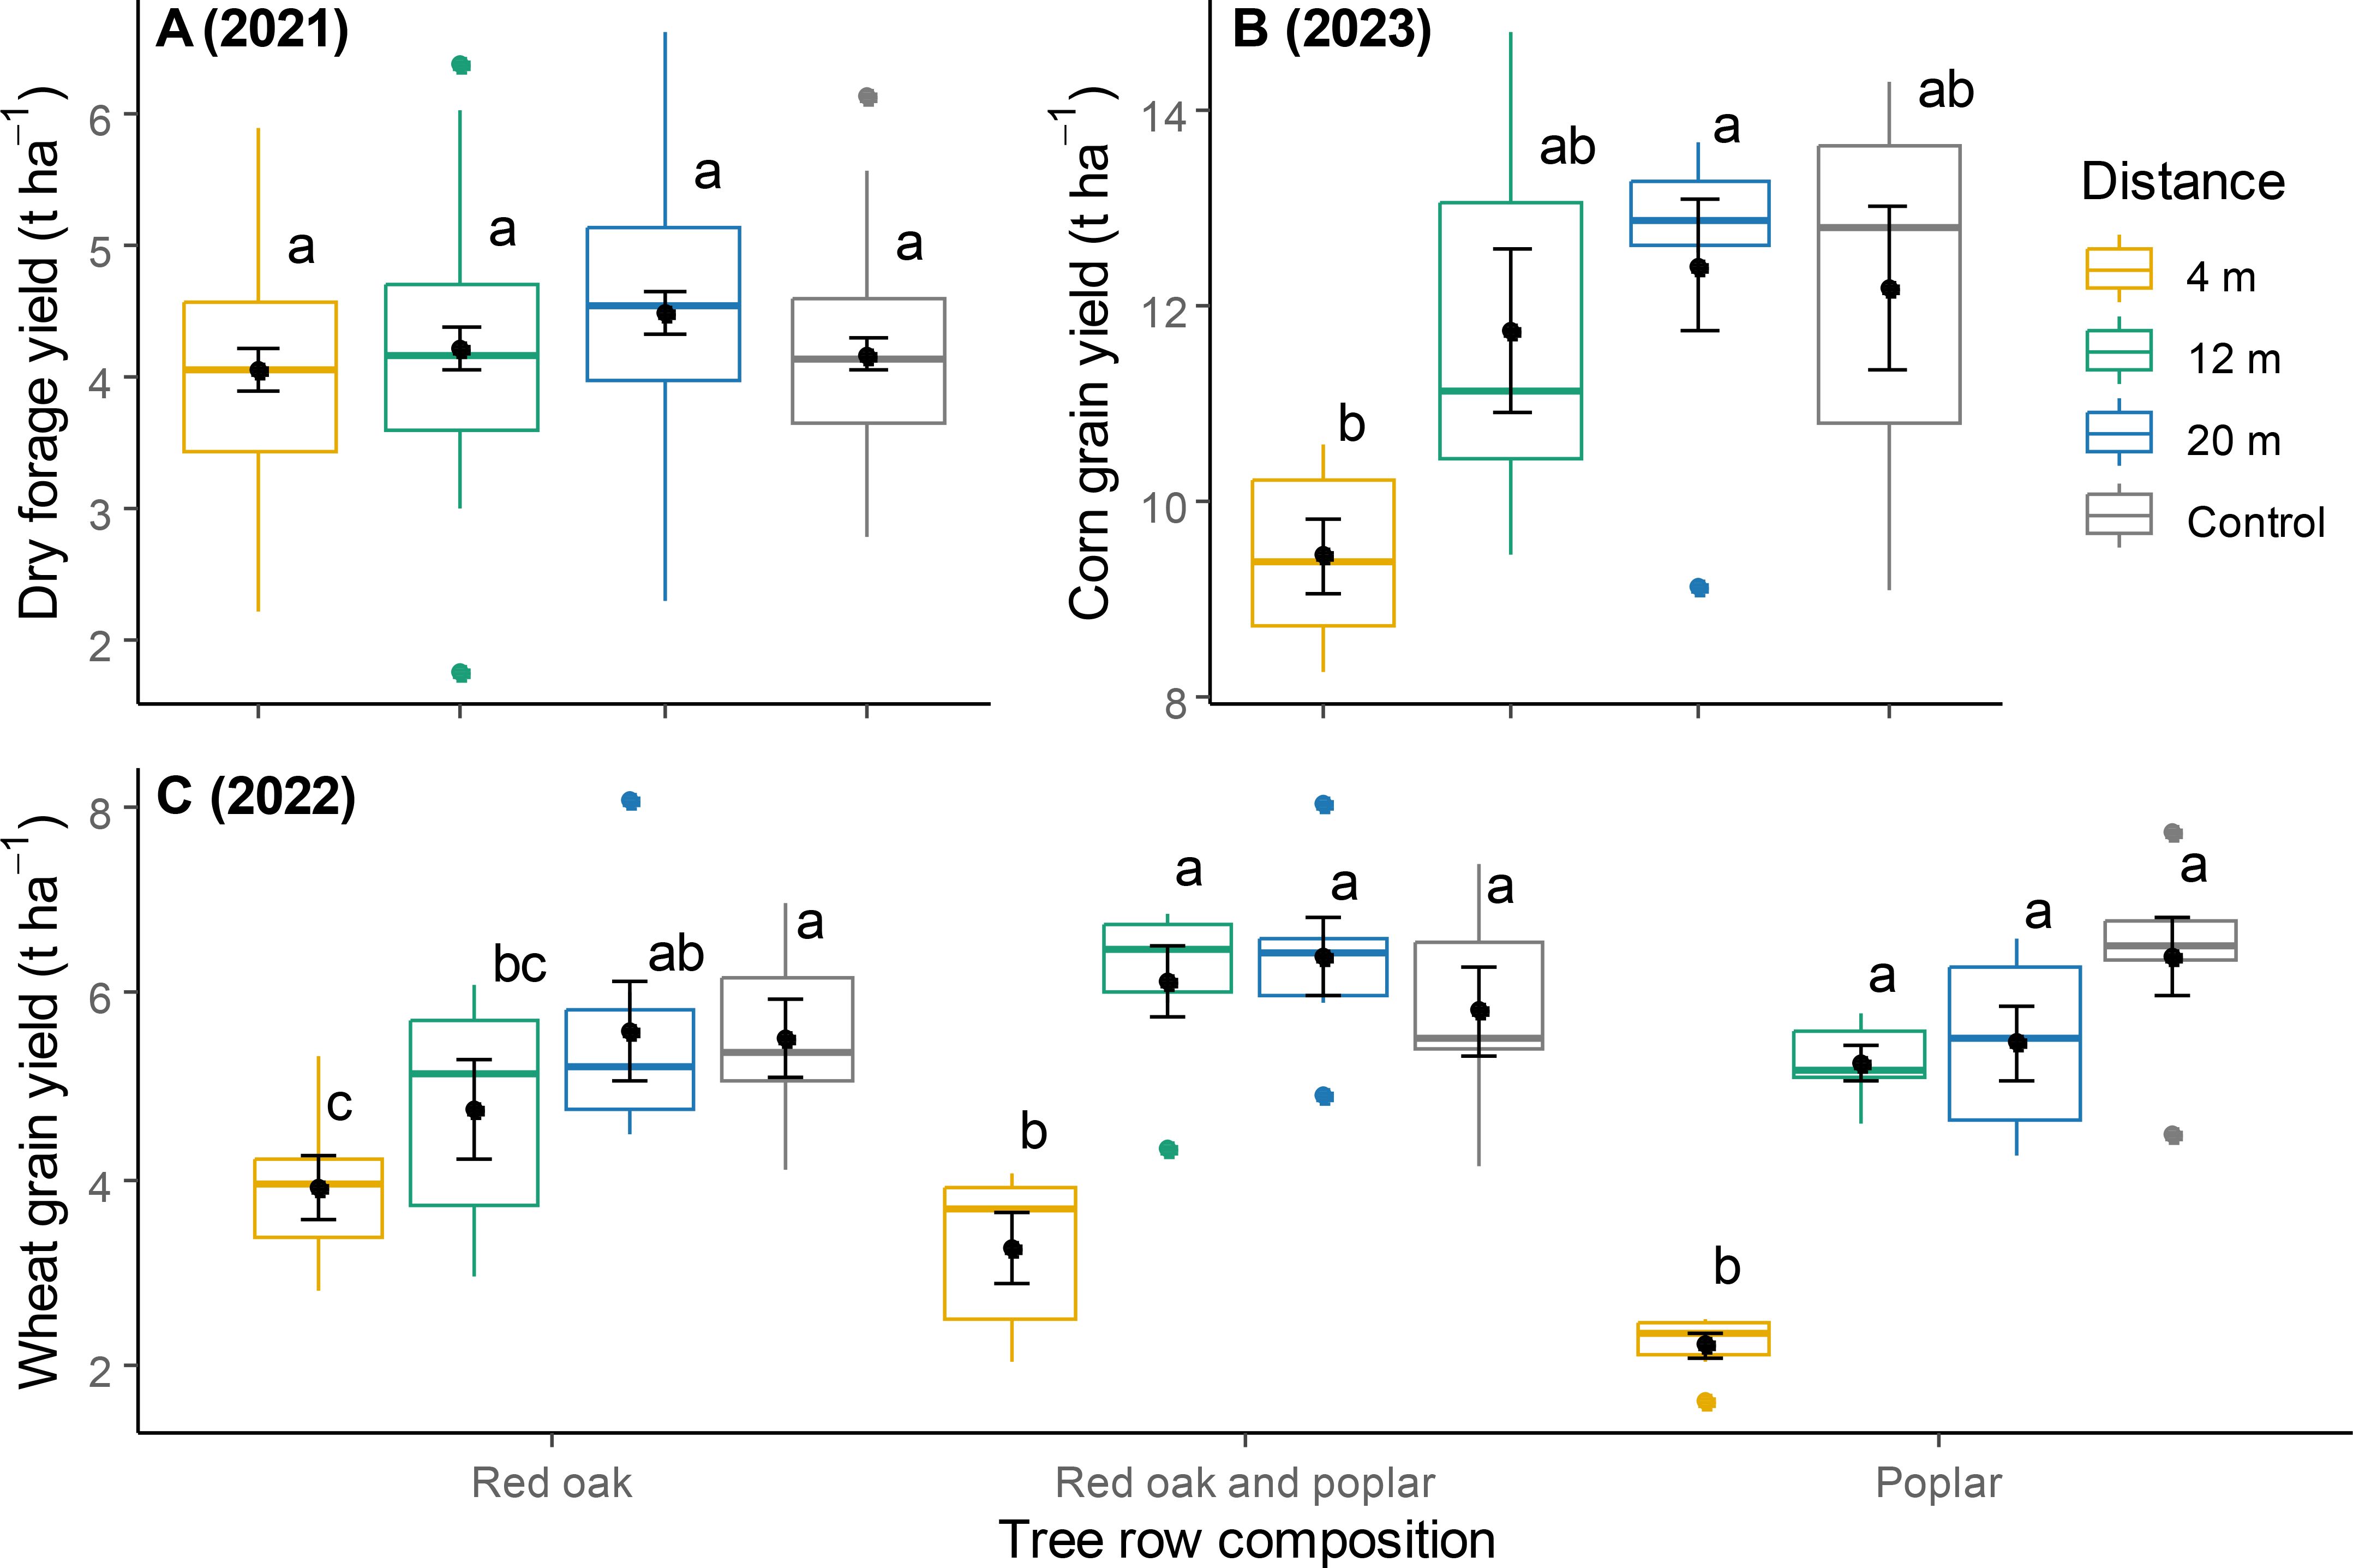
Figure 2. Yields in forage biomass (A; average per harvest in 2021), corn grain (B; 2023) and winter wheat grain (C; 2022) at different distances within the TBI system and in the controls. Different letters above the boxplots represent a significant difference between two distances (Tukey HSD for multiple comparisons, P < 0.05). For wheat crops, comparisons were made within each category of tree row composition. Points within boxplots and error bars represent means and standard errors, respectively; horizontal bars are medians, while closed circles are boxplot outliers.
3.2 Microclimate conditions
PLTT and soil VWC varied significantly according to a significant interaction between distance from the tree row and tree row composition (Table 1). In alleys that were adjacent to tree rows composed solely of red oak, both PTLT and soil VWC were consistent across all distances and comparable to those in control plots (Figures 3A, 4A). In plots integrating hybrid poplar, PTLT and soil VWC at 4 m were substantially lower than at 12 and 20 m, or in control plots. Under high soil moisture conditions, VWC at 12 m was higher than that in the control (Figure 4B). Potential evaporation at 4 m was higher than that at 12 and 20 m and in the control (Table 1; Figure 3B).
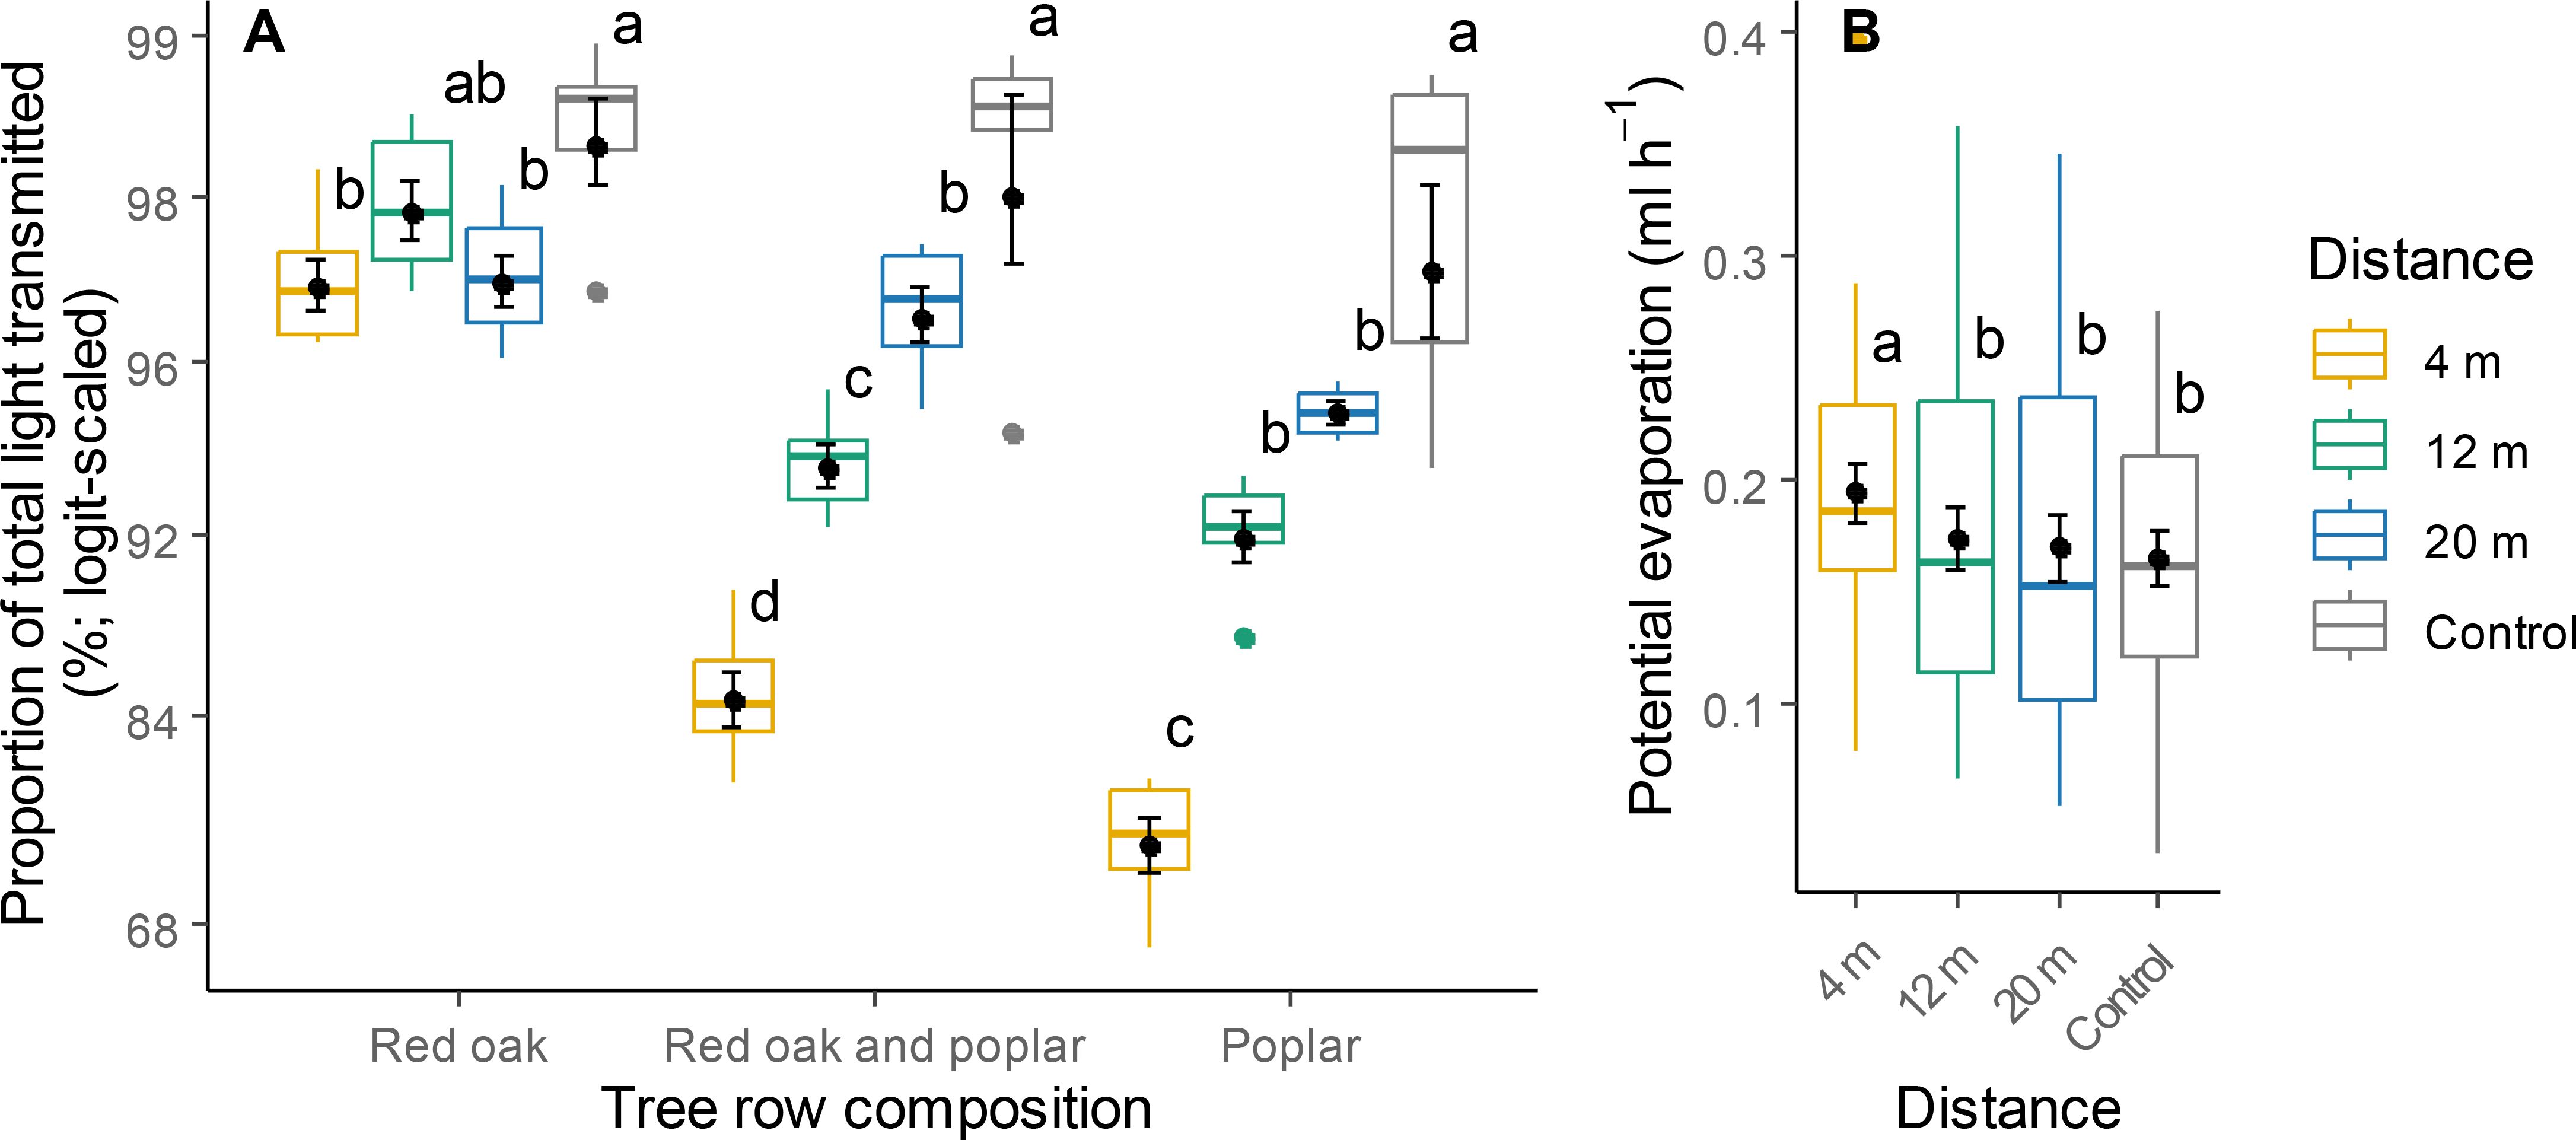
Figure 3. Proportion of total light transmitted (A) and potential evaporation (B) at different distances within the TBI system and in the controls. Within each category, different letters represent a significant difference between two distances (Tukey HSD for multiple comparisons, P < 0.05). Points within boxplots and error bars represent means and standard errors, respectively; horizontal bars are medians, while closed circles are boxplot outliers.
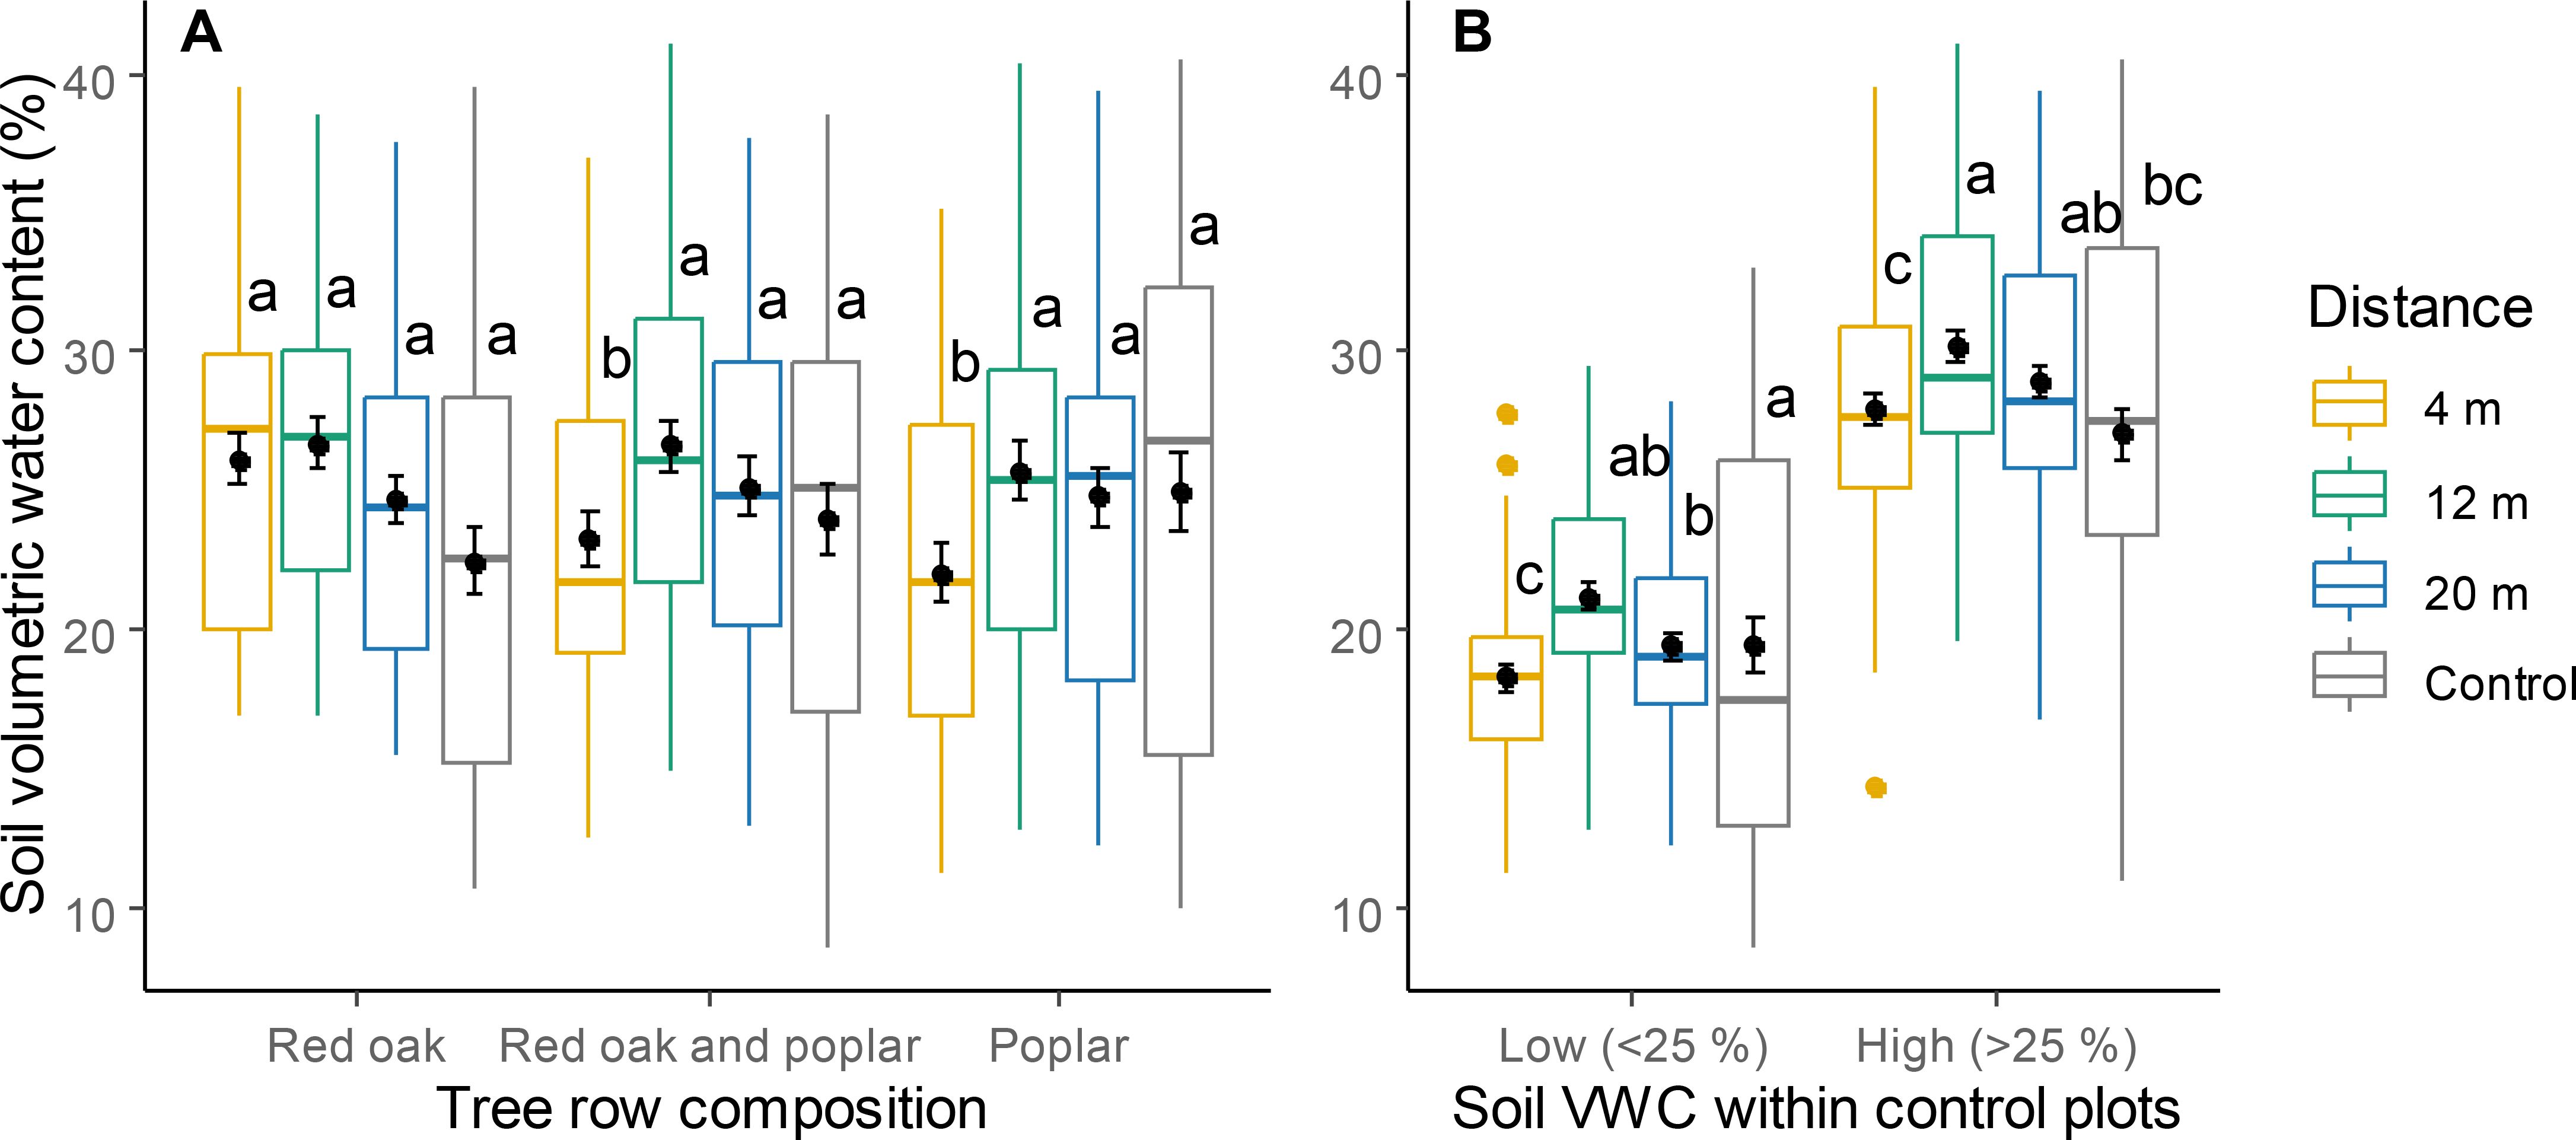
Figure 4. Soil volumetric water content (VWC) for different tree row compositions (A) and different conditions of soil humidity within the control plots (B) at different distances within the TBI system and in the controls. Within each category, different letters represent a significant difference between two distances (Tukey HSD for multiple comparisons, P < 0.05). Points within boxplots and error bars represent means and standard errors, respectively horizontal bars are medians, while closed circles are boxplot outliers.
3.3 Macronutrient dynamics
The supply of NO3- and K within the cultivated alleys remained relatively uniform across all distances and did not differ from that in the control (Table 1; Figures 5A, C). Supply rates of P were affected by a significant interaction between distance from the tree row and burial period (Table 1). At 4 m, P supply rates were generally lower than at the other distances or the controls, but this effect was only significant between 4 m and 20 m during the first burial period, and between 4 m and the controls during the second one (Figure 5B). Rates of NO3- leaching at 4 m were 3.1 times lower than those in the control plots, irrespective of burial period (Figure 6).
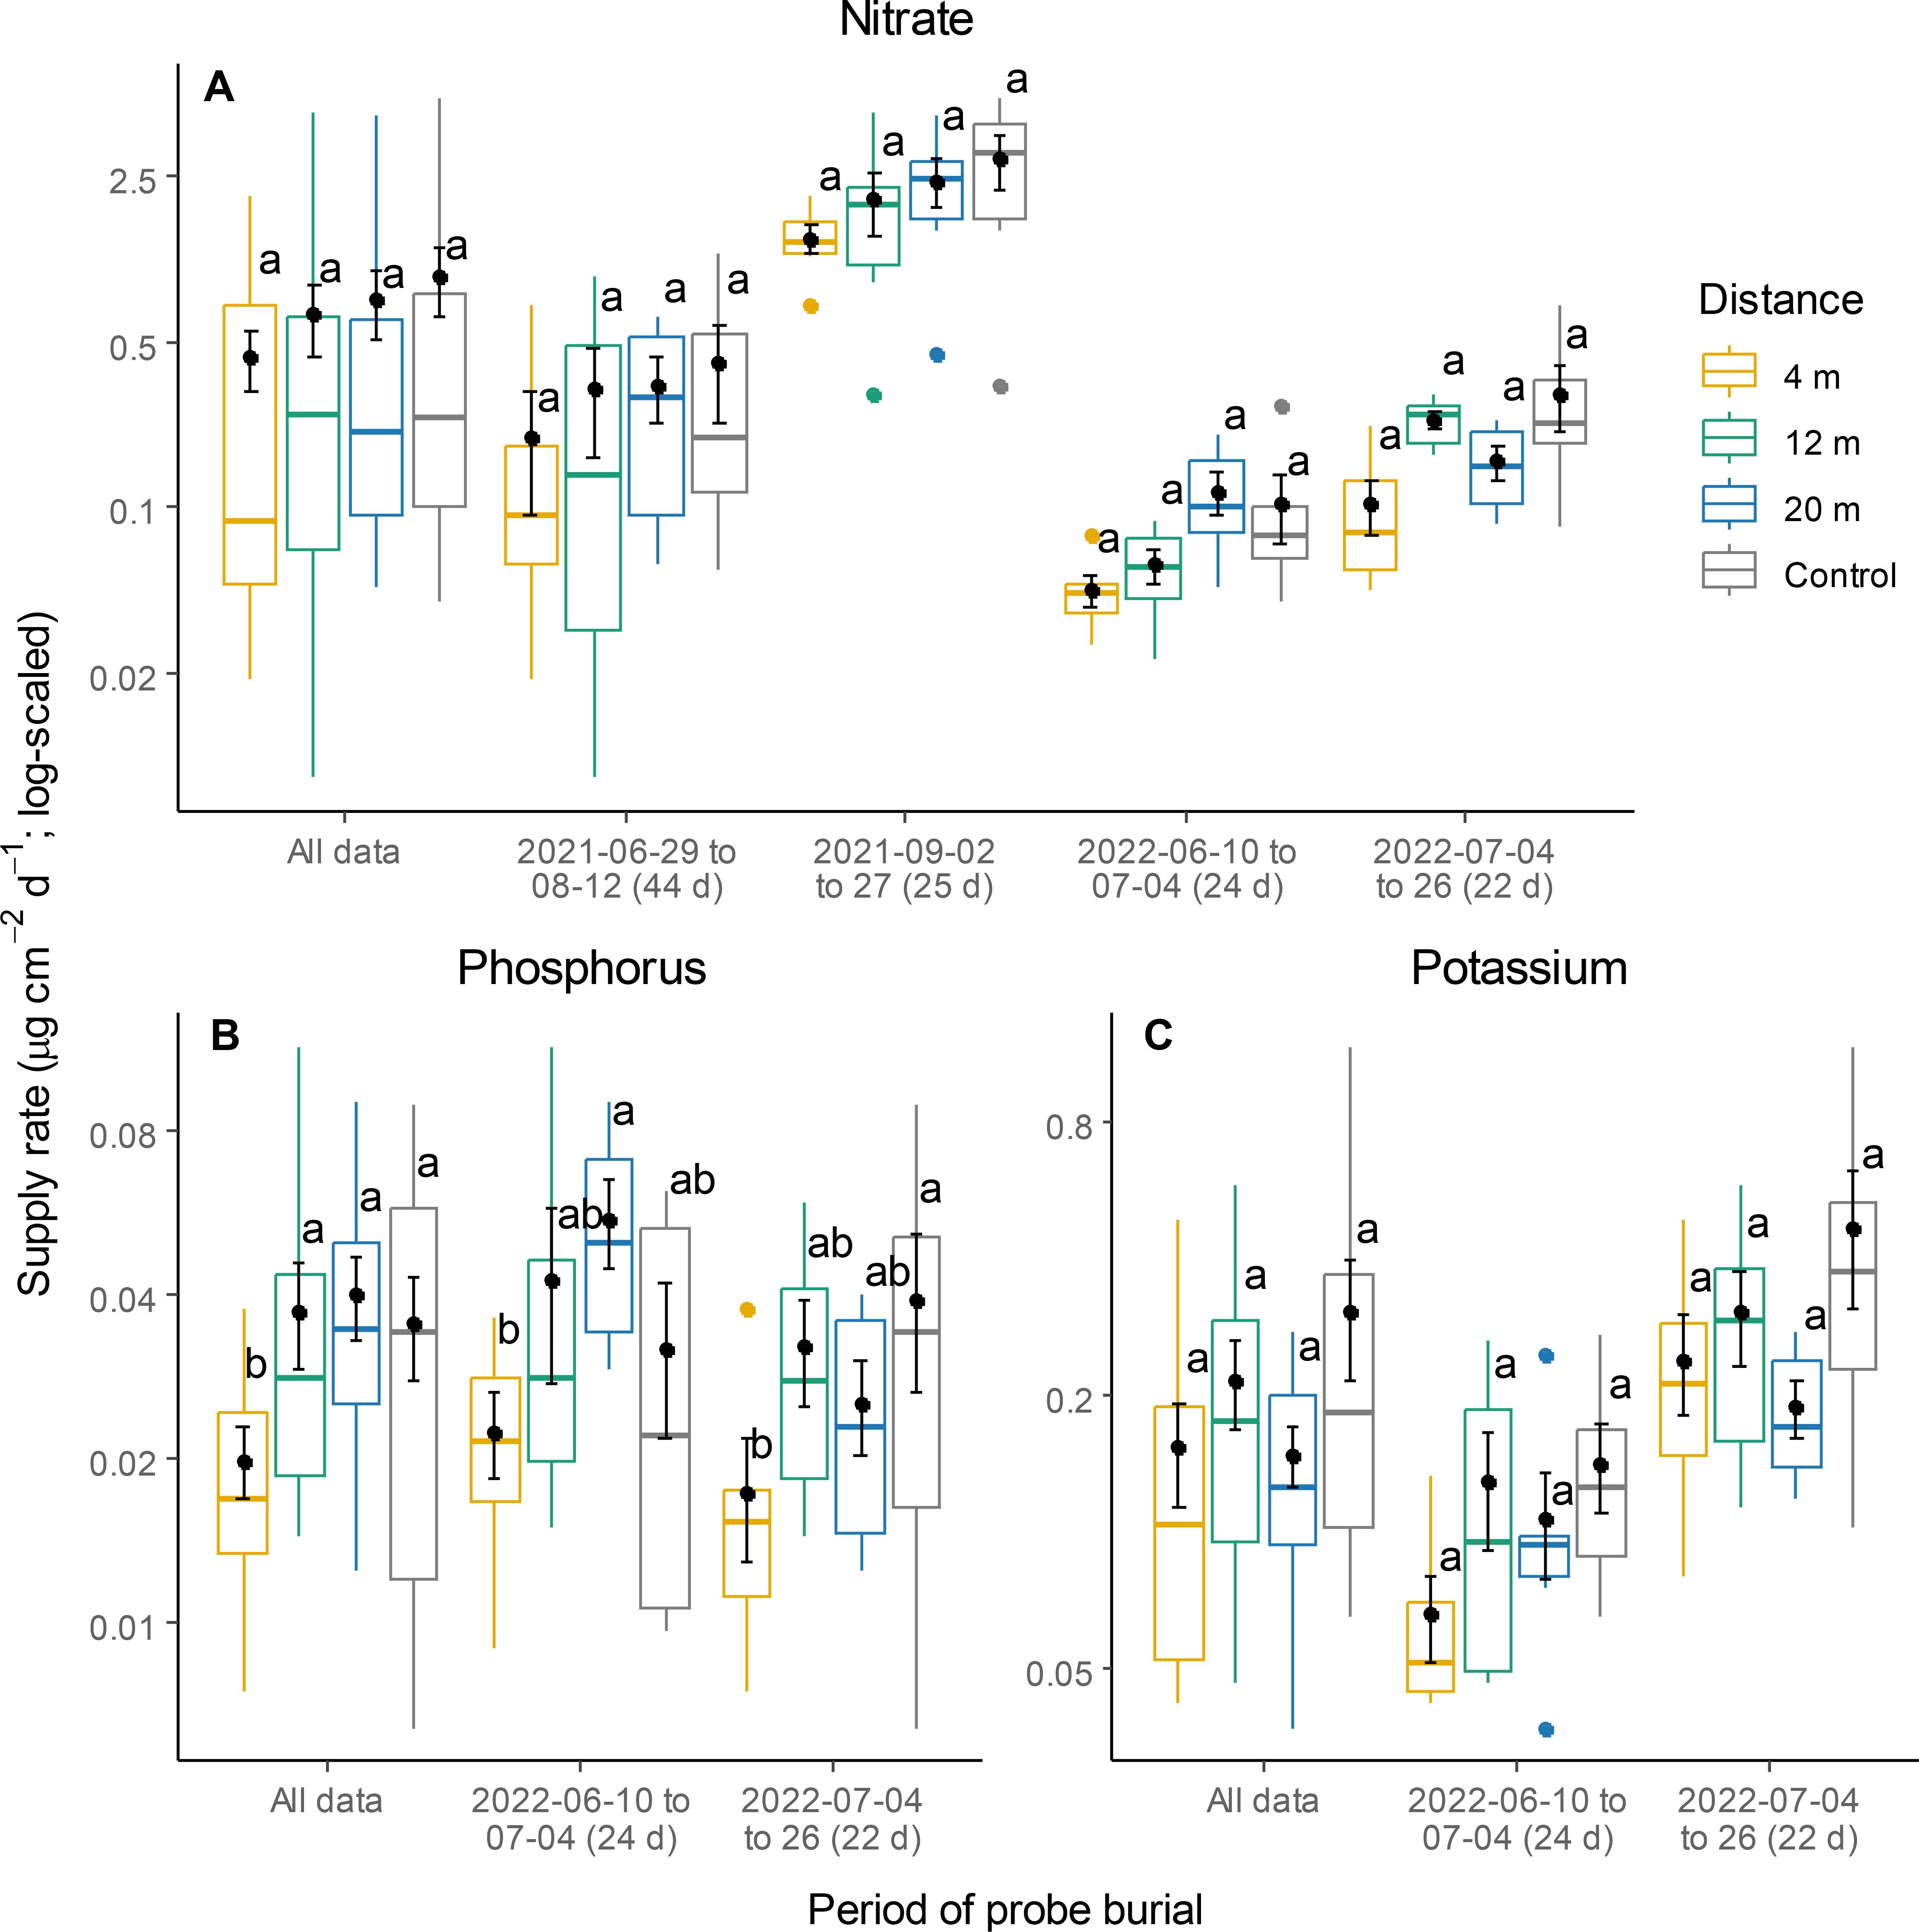
Figure 5. Supply rates of nitrate (A), phosphorus (B) and potassium (C) at different distances within the TBI system and in the controls. Within each burial period, different letters represent a significant difference between two distances (Tukey HSD for multiple comparisons, P < 0.05). Points and error bars represent means and standard errors, respectively horizontal bars are medians, while closed circles are boxplot outliers.
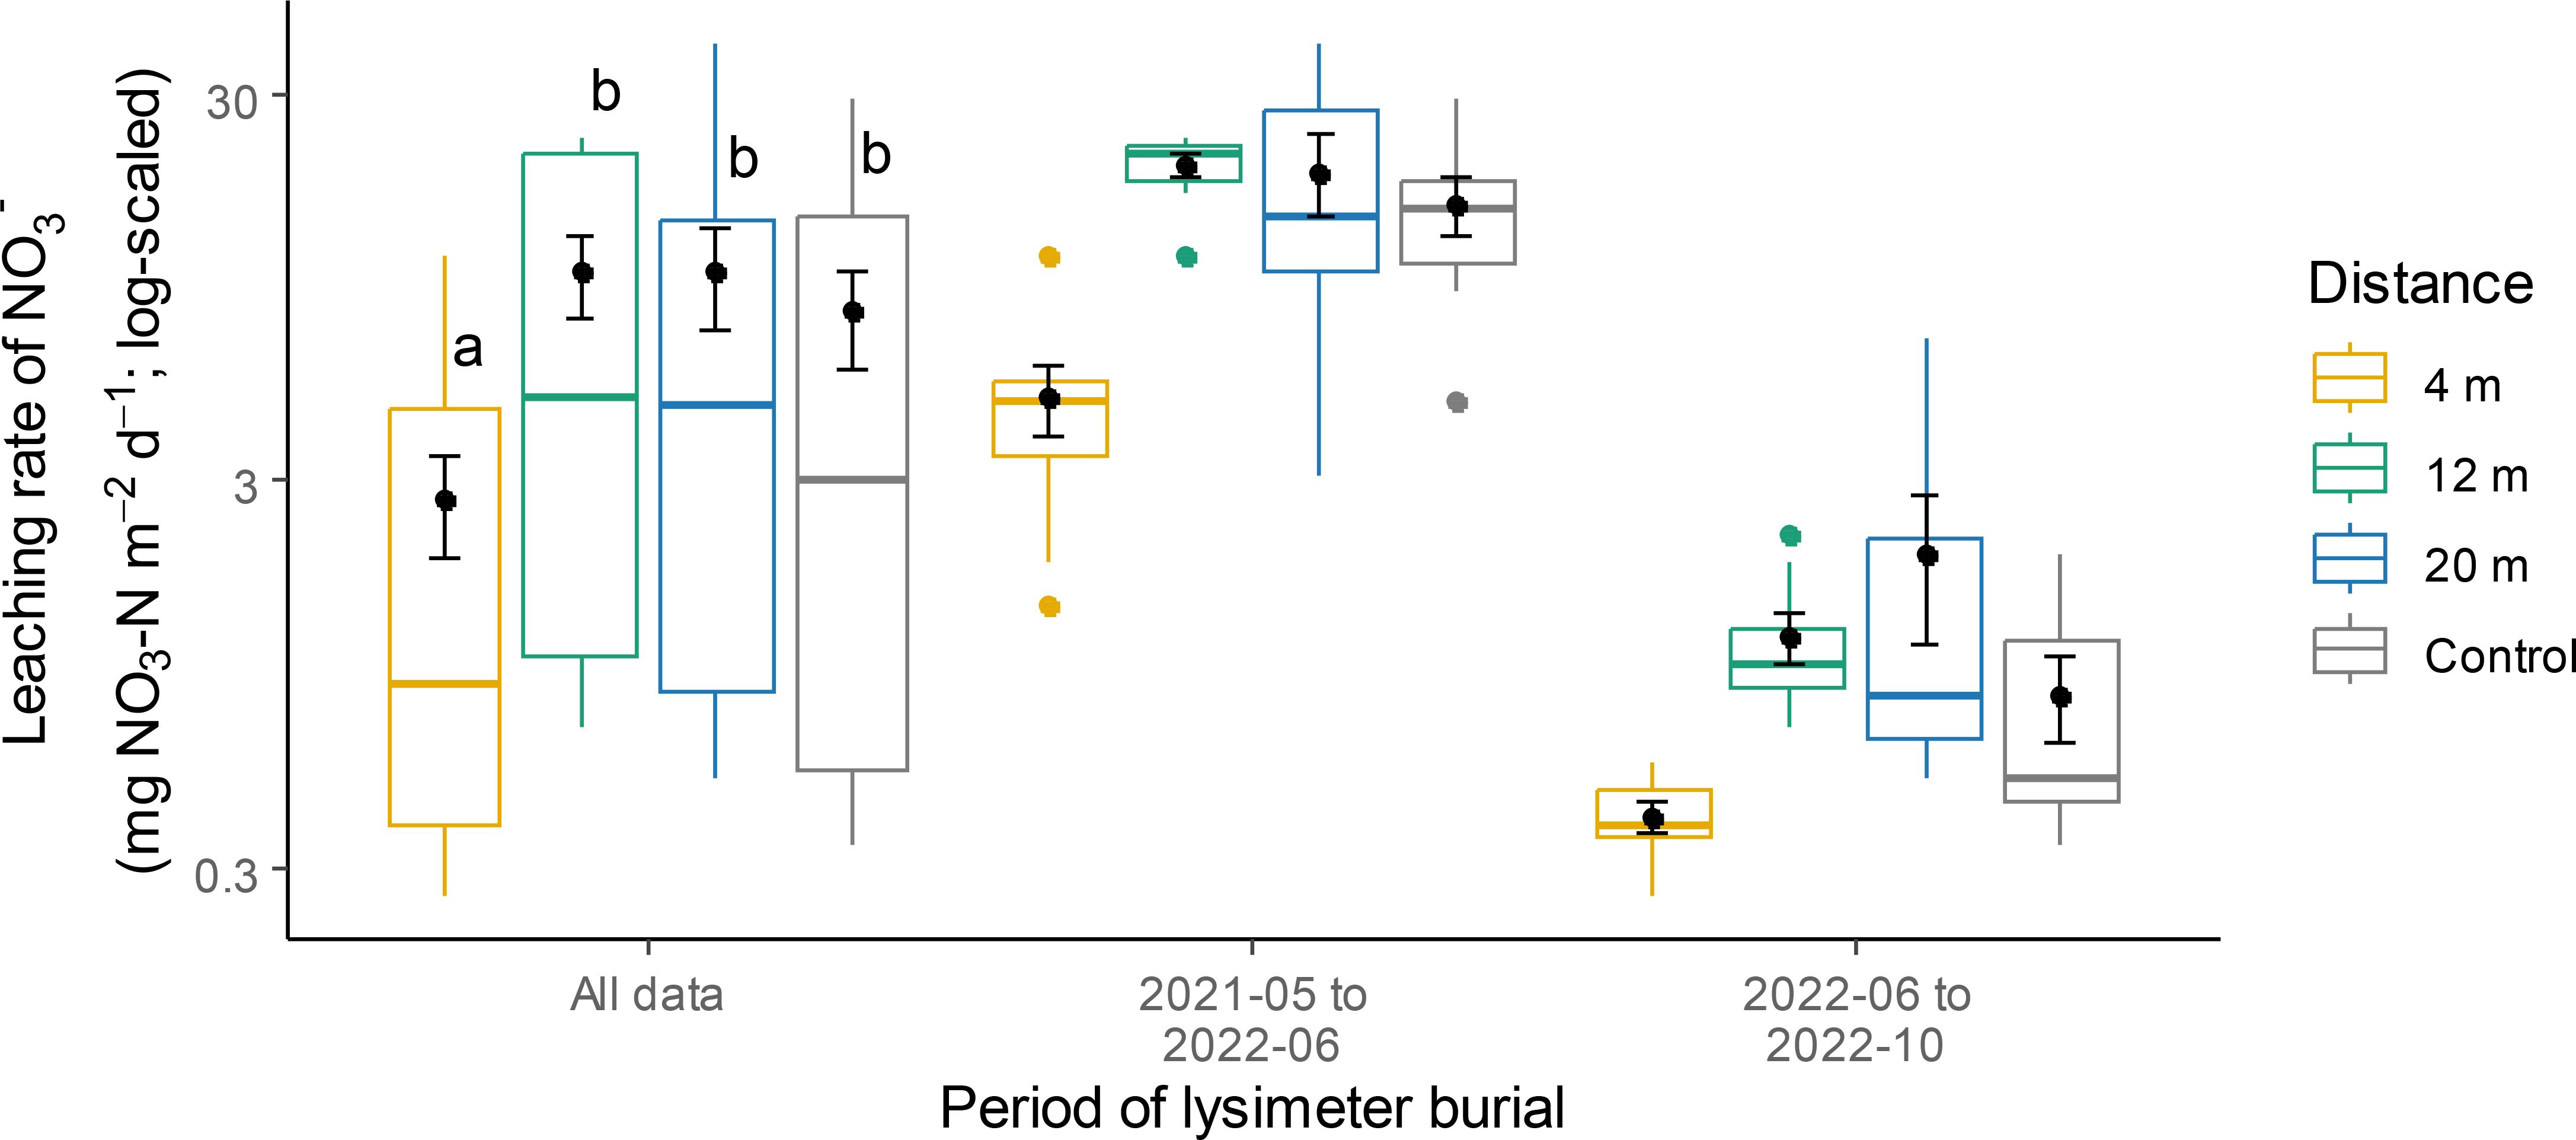
Figure 6. Nitrate leaching rate at different distances within the TBI system and in the controls. Within each burial period, different letters represent a significant difference between two distances (Tukey HSD for multiple comparisons, P < 0.05). Points within boxplots and error bars represent means and standard errors, respectively; horizontal bars are medians, while closed circles are boxplot outliers.
3.4 Soil organic C stocks and bulk density
There was no significant effect of distance from the tree row on soil organic C stocks (Table 1; Figure 7A). Bulk density at 0 m was lower than that at 4 and 12 m and in the control (Table 1; Figure 7B).
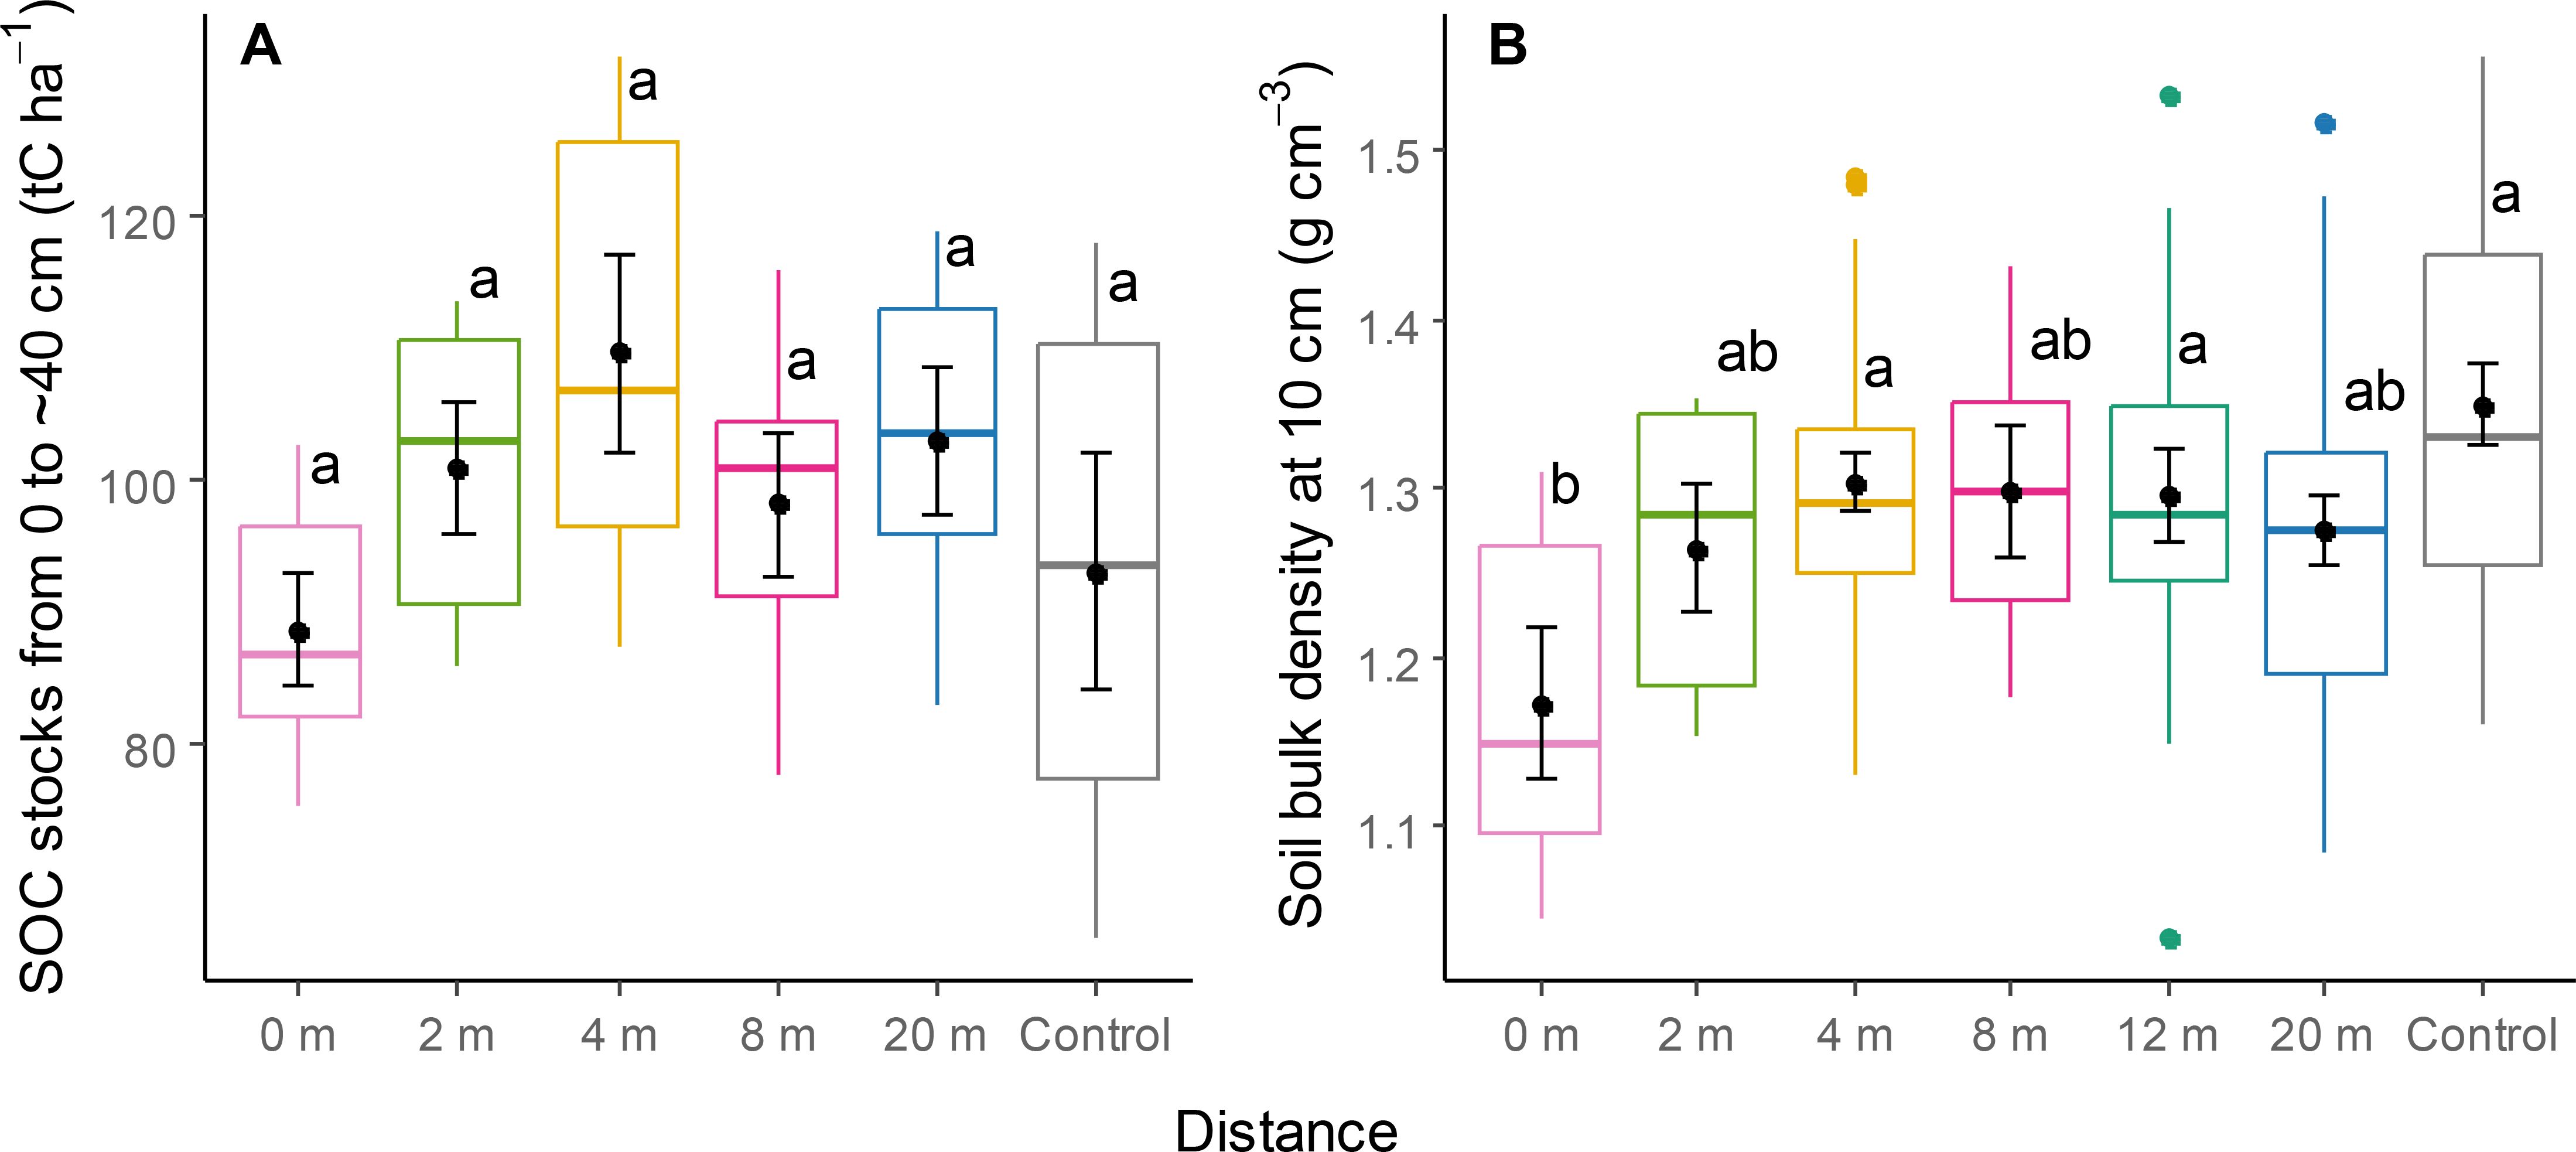
Figure 7. Stocks of soil organic carbon (A) and bulk density (B) at different distances within the TBI system and in the controls. Different letters represent a significant difference between two distances (Tukey HSD for multiple comparisons, P < 0.05). Points within boxplots and error bars represent means and standard errors, respectively; horizontal bars are medians, while closed circles are boxplot outliers.
3.5 Multifunctionality of the TBI system
Wheat yield and a proxy for drought-stress mitigation (i.e., the inverse of potential evaporation) were the only two ES showing a significant difference between the TBI cultivated alleys and the controls (Figure 8A; Supplementary Figure 6). Both systems performed equally well when compared across all ES categories (Figure 8B; Supplementary Table 2). Since only two significant effects were observed, with all other ES being relatively equal between systems, we were unable to identify clear trade-offs or synergies (Appendix S2 in Supplementary Data Sheet 1). Although some ES were correlated, these correlations were not due to differences between the systems. For example, forage and wheat yields were positively correlated with soil VWC (Supplementary Figure 8). However, further examination showed that control subplots exhibited values at both extremes of the soil VWC range, while cultivated alleys had intermediate values (Supplementary Figures 9B, C). Therefore, the positive relationships were not driven by differences between the systems, but by variation within the experimental site (e.g., soil texture).
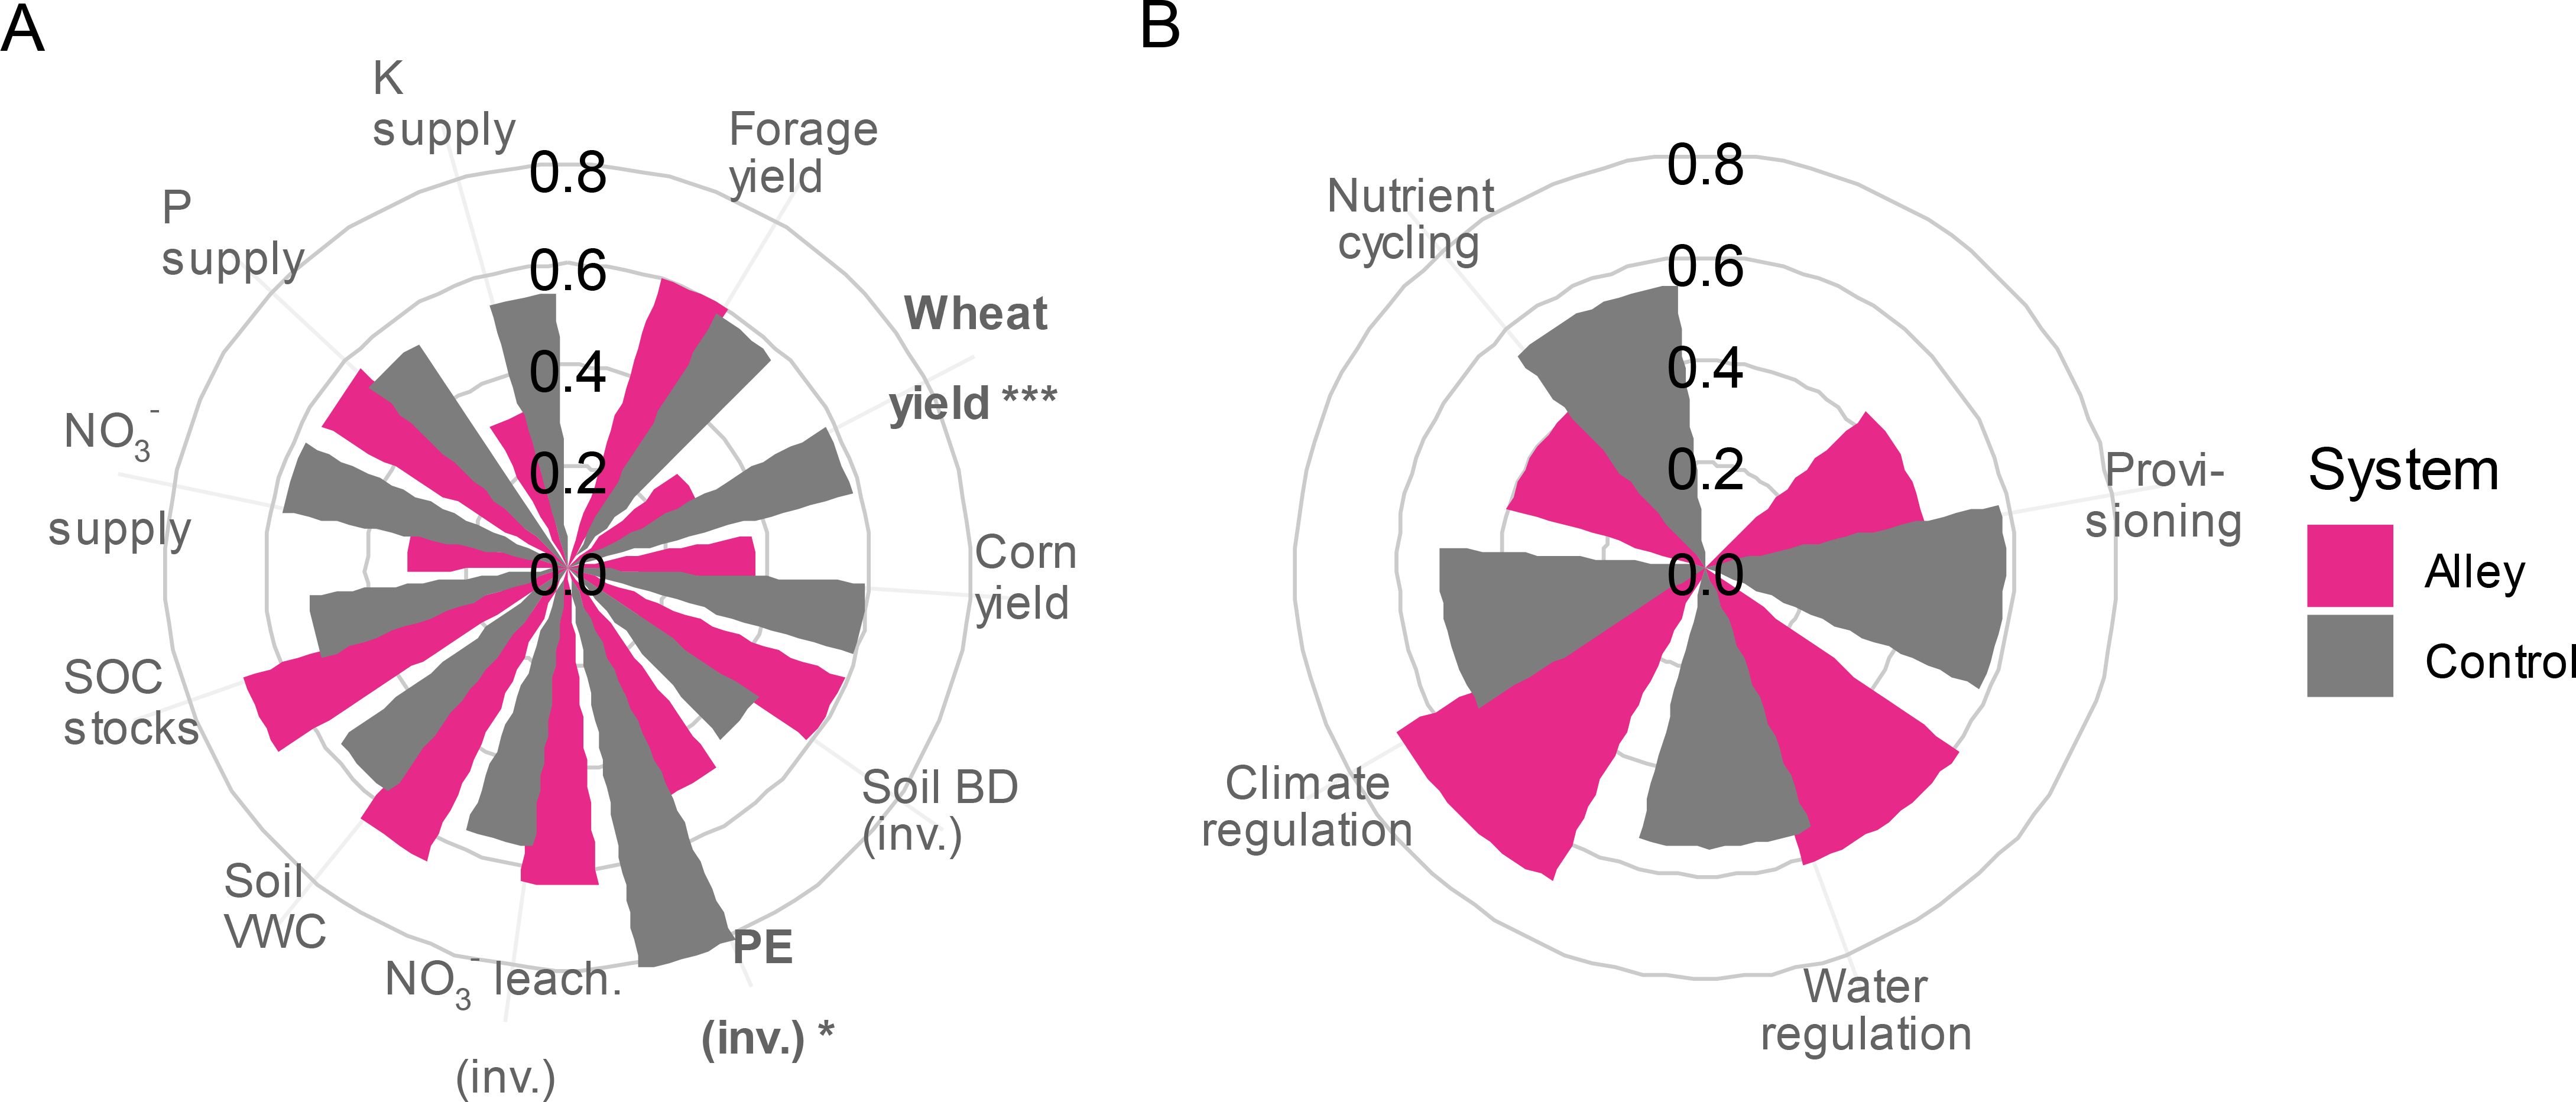
Figure 8. Polar diagrams for multiple ES (A) and ES categories (B) comparing systems (TBI cultivated alleys vs. controls). Before averaging, values were scaled on the range of 0 to 1 for each ES following Equation 1 in Bradford and D’Amato (2012). ES values increase proportionally as distance from the diagram center increases. BD, bulk density; PE, potential evaporation; SOC, soil organic carbon; VWC, volumetric water content; (inv.), the additive inverse of the ES is used. *P < 0.05; ***P < 0.001.
For ES that could be calculated for the entire TBI system (i.e., provisioning and climate regulation ES), only wheat yield showed a significant difference (Supplementary Figure 7), and correlations among ES were not significant (P > 0.05; results not shown). Although there was a net increase in carbon stocks due to tree biomass, when combined with SOC stocks, which were two orders of magnitude larger (see Figure 7A), this did not result in a significant difference in climate regulation between our six TBI transects and six control subplots (Supplementary Figure 7B). Based upon the whole area of the TBI system, tree C stocks after 10 growing years were estimated at 3.7 ± 0.1 tC ha-1 for hybrid poplar, 2.3 ± 0.1 tC ha-1 for mixed rows and 0.5 ± 0.1 tC ha-1 for red oak (Supplementary Figure 5).
4 Discussion
4.1 Indicators of ecosystem services vary spatially within the TBI system
As expected, the greatest variation in ES within the cultivated alleys, compared to the agricultural controls, was typically observed in areas that were closest to the tree rows. Wheat yields were significantly reduced at 4 m from the tree row (Figure 2). These yield reductions were associated with significant decreases in PTLT, soil VWC, and P supply (Figures 3A, 4A, 5B). However, because above- and below-ground tree–crop interactions were not experimentally controlled (e.g., with a root barrier), it is unclear whether one of these factors was the primary limiting factor or they were co-limiting. In contrast, forage yields were unaffected by the TBI system. Alfalfa-based perennial forage mixtures have demonstrated a greater tolerance to competition for light and moisture compared to annual crops (Carrier et al., 2019). Many cool-season forage species, including alfalfa, have been reported to withstand moderate shading, tolerating up to 45% of full sunlight (Lin et al., 1999; Pang et al., 2019).
Soil VWC was reduced near the tree row (4 m) (Figure 4A), likely due to a combination of rainfall interception, soil moisture uptake by the trees, and increased potential evaporation. Potential evaporation at 4 m increased (Figure 3B), contrary to our expectations based on previous studies (Jacobs et al., 2022). This result may be explained by unexpected decreases in air relative humidity and increases in vapour-pressure deficit at 4 m (Supplementary Figure 3), and the likely enhancement of wind turbulence. In widely spaced TBI systems with pruned trees, high-porosity tree rows can lead to increased wind turbulence near the trees (Lawson et al., 2019). Under high soil moisture conditions, soil VWC at 12 m was higher than that in the control (Figure 4B), which may be attributed to reduced windspeed and crop transpiration (Jacobs et al., 2022). This finding suggests that the influence of the TBI system on a particular ES can vary, with both positive and negative effects depending on the distance from the tree rows and the prevailing environmental conditions.
The observed decrease in P supply rates near the tree row (4 m) (Figure 5C) was unexpected, given that nutrient movement from deeper soil layers (i.e., nutrient pumping by tree roots), tree litter accumulation, and inputs from throughfall water typically enhance soil nutrient availability in TBI systems (Pardon et al., 2017). Phosphorus is generally less mobile in the soil compared to other nutrients, and under drier conditions, it may become less soluble, thereby reducing its availability to plants (DeLonge et al., 2013).
The significant decrease in NO3- leaching rates at 4 m from the tree row (Figure 6) was anticipated and is likely linked to reduced soil moisture and NO3- supply rates (see Supplementary Figure 4) at the surface (Rivest and Martin-Guay, 2024). Decreased soil water availability can limit drainage and net nitrification, subsequently reducing NO3- leaching (Daryanto et al., 2017; Thapa et al., 2018). This finding suggests that trade-offs between ES (in this case, soil moisture and NO3- leaching) may occur at a fine scale and be location-specific within the TBI system.
Soil organic C stocks (0-40 cm) were 1.1 times higher at 2 m and 1.2 times higher at 4 m from the tree row compared to the agricultural control, although these differences were not statistically significant, likely due to the limited number of observations and great variability among them (Figure 7A). A meta-analysis suggests that significant positive effects of TBI systems on SOC generally become apparent at least a decade after tree establishment (Ivezić et al., 2022).
Soil bulk density was significantly lower in close proximity to the tree row (0-2 m) (Figure 7B), likely due to the increased root density of the trees and the absence of soil tillage in this zone.
Our study was conducted over three growing seasons in a relatively young TBI system (7 to 10 years old), which offers a limited perspective on the temporal and spatial dynamics of ecosystem multifunctionality. Although most measured ES exhibited variation at short distances from the tree rows, we anticipate that these patterns would extend further into the alleys over time as the trees mature and as tree litter and roots become more evenly distributed throughout the system.
4.2 Tree species composition is an important determinant of resource availability and crop yield
As expected, plots containing 8- or 9-year-old poplar (either mixed with red oak or alone) exhibited lower soil moisture and light availability compared to plots with red oak only (Figures 3A, 4A). This resulted in a significantly greater decrease in wheat yield at the tree-crop interface (4 m) in plots with poplar (Figure 2C). These effects could be mainly attributed to the fast-growing nature of poplar and its higher competitive ability compared to red oak. For example, after 10 growing years, poplar had reached a height of 14.8 m, which was three times greater than the 4.9-m height of red oak, allowing its canopy to intercept substantially more water and light near the tree row. In an 8-year-old TBI system established in southern Quebec, Bouttier et al. (2014) found that a large proportion of the fine roots of both hybrid poplar (40% of total fine-root system) and red oak (43%) were located in the uppermost 10 cm of soil close to the tree row. This fine root distribution contributed to a significant reduction in crop production due to interspecific root interference. The authors found that hybrid poplar produced 1.5 times more fine roots per unit of diameter and had a 2.2 times greater specific root length than red oak, suggesting a stronger belowground competitive ability and, at the same time, greater potential to enhance positive feedback mechanisms (e.g., soil structure improvement, tree rhizodeposition, nutrient pump, hydraulic lift).
Our experimental site was designed to evaluate various mixtures of hardwood species with hybrid poplars (Figure 1). Increasing tree species diversity in TBI systems, particularly by combining species with contrasting traits, may improve ecosystem multifunctionality relative to less diverse systems, in line with the biodiversity and ecosystem functioning (BEF) hypothesis (Schwarz et al., 2021). In plots combining red oak and poplar, we suggest that observed effects on ES at the tree-crop interface were primarily driven by poplar rather than by red oak. While poplars rapidly competed with agricultural production, they also contributed positively to other ES, such as C sequestration in tree biomass and increased aboveground litterfall production (Supplementary Figures 2, 5). Further investigation is needed to determine how management practices (e.g., tree spacing within rows, balancing fast- and slow-growing species, timber harvesting schedules of fast-growing species) can be optimized to manage trade-offs in TBI systems that incorporate species with different growth rates.
4.3 Unexpectedly similar multifunctionality of the TBI system compared to the agricultural control
Since most of our ES indicators were measured only within the cultivated alleys, we initially opted to compare the multifunctionality of this part of the TBI system with the controls. This approach differs from comparing ES delivery across the entire TBI system versus the controls, for instance, as Ivezić et al. (2021) did for yield. Contrary to our hypothesis, provisioning, nutrient cycling, climate regulation, and water regulation were generally equivalent between the TBI system and the controls, suggesting a similar level of multifunctionality (Figure 8). We had anticipated increased ES delivery, particularly for climate regulation and nutrient cycling ES (Beillouin et al., 2021). Regional-scale meta-analyses have shown that agroforestry implementation increases multifunctionality, which is particularly relevant in rural Africa, where sustainable intensification of agriculture is crucial (Félix et al., 2018; Kuyah et al., 2019; Torralba et al., 2016). The water regulation benefits of agroforestry may also be more pronounced in more arid climates than the one in our experiment, providing resilience to climate change, as seen in Mediterranean and West African contexts (Félix et al., 2018; Reyes et al., 2021).
We conducted a reduced multifunctionality analysis comparing the entire TBI system, by focusing specifically on provisioning and climate regulation ES (Supplementary Figure 6). We argue that C stocks in tree biomass and soils beneath the trees should be included only if other ES are also assessed across the entire TBI system. Trade-off assessments between ES cannot be accurate if yields are estimated solely from the cultivated alley area, while other ES are estimated from the whole area, as was performed by Veldkamp et al. (2023). In our analysis, we considered that both the lost surface and added C stocks did not alter the result of equivalent multifunctionality (Supplementary Figures 6, 7). However, there was a trend showing an 8 ± 3% (mean ± SE) decrease in our TBI system for annual yield that was based on 42 comparisons, driven by a significant 19 ± 4% decrease in wheat yield. Forage biomass remained equivalent, but the corn sample size was insufficient (Supplementary Figure 7). This yield reduction is smaller than the 29% that was reported in European TBI systems (Ivezić et al., 2021), where narrower cultivated alleys (6 to 16 m between tree rows, compared to 40 m in this study) may have intensified tree competition. Although C stocks were increased with tree biomass (2.1 ± 0.5 tC ha-1 after 10 growing years), the variability in SOC and the small sample size across six comparisons limited our ability to detect a significant effect on total C stocks (TBI - controls = 10 ± 12 tC ha-1). Assuming the same mean and variance, 65 comparisons would be needed to detect a significant effect at P < 0.05 in 80% of sampling. Therefore, we can infer at least one clear trade-off between tree C sequestration and wheat yield. Although our results cannot be generalized to other climatic conditions, our methodological approach can be applied in many contexts. Notably, distinguishing between comparisons using the whole field and those using only the cultivated part of an agroforestry system is crucial and should always be clearly stated. This methodological clarity will aid both researchers and policymakers.
Another way to identify trade-offs or synergies is to detect a correlation between two ES (Cerda et al., 2019; Rapidel et al., 2015). Yet, part of this correlation must be attributed to the differences between the agroecosystems being compared. Otherwise, the correlations may simply reflect inherent relationships among ES indicators, independent of system-level differences. In our study, significant correlations emerged from environmental variation within the experimental site, which were likely driven by soil texture, rather than from differences between the TBI system and the control (Supplementary Figure 9). Ideally, trade-offs or synergies should be clearly attributable to system differences, as illustrated graphically (e.g., Figure 2 in Rapidel et al., 2015). This was not the case in our study, where all observed correlations appeared to be driven by within-site variation rather than by differences between the two systems.
In addition to substantial within-site variation caused by soil texture, our study faced another limitation due to the proximity of surrounding trees (either from the TBI system or nearby shelterbelts) to the agricultural control plots. This proximity requires careful interpretation of differences between the TBI and control plots. Although the control plots were placed in open areas with near full sunlight exposure (Figure 3A), they may have still benefited from wind protection that was provided by surrounding trees. As a result, the effects of the TBI system on some ES may have been masked by this experimental noise. We cannot rule out that control plots that were more exposed to wind might have shown greater or more pronounced benefits of the TBI system, particularly regarding water regulation and crop production. Therefore, we stress the importance of precise placement of control plots in future TBI experiments to minimize these confounding factors.
5 Conclusion
This study analyzed the spatial variation of 11 indicators of ES within a TBI system (7- to 10-years-old) established in southern Québec, Canada. As expected, the greatest variation in indicators of ES within the cultivated alleys, compared to the agricultural controls, was most often observed near the tree rows. This phenomenon has resulted in trade-offs in ES at a fine spatial scale, particularly concentrated near the tree rows. For instance, reduced soil moisture that was caused by trees likely contributed to the decrease in NO3- leaching at the tree-crop interface. The composition of tree species in the row played a crucial role in determining light availability, soil water supply, wheat yield, and C stocks in tree biomass. We propose that combining fast- and slow-growing tree species, rather than relying on monocultures, may better optimize trade-offs in the delivery of ES within TBI systems. At the system scale, we observed similar levels of multifunctionality between the TBI and control plots. Yet, a notable trade-off emerged between C sequestration in tree biomass (and potentially in soils) and crop yield. The small sample size of aggregated values from a single site limited our ability to assess multifunctionality, thereby reducing the statistical power of our analysis. To address this limitation, we recommend that future research prioritize assessments incorporating data from multiple sites and over a longer time scale. Standardizing measurement protocols across sites will be crucial for facilitating comparative analyses at regional, continental and global scales. Additionally, identifying trade-offs among ES could be improved by establishing control plots with comparable soil conditions, including soil texture and its variability. This would ensure that observed trade-offs are driven by differences between systems rather than site-specific variations.
Data availability statement
The raw data supporting the conclusions of this article will be made available by the authors, without undue reservation.
Author contributions
DR: Conceptualization, Funding acquisition, Methodology, Project administration, Supervision, Writing – original draft. M-OM-G: Conceptualization, Formal Analysis, Investigation, Methodology, Writing – review & editing. È-MH: Investigation, Methodology, Writing – review & editing. SD: Investigation, Methodology, Writing – review & editing. AC: Funding acquisition, Investigation, Methodology, Writing – review & editing. AM: Conceptualization, Funding acquisition, Methodology, Supervision, Writing – review & editing.
Funding
The author(s) declare that financial support was received for the research, authorship, and/or publication of this article. This study was supported by grants from the Ministère de l’Agriculture, des Pêcheries et de l’Alimentation du Québec (MAPAQ) and the Natural Sciences and Engineering Research Council of Canada (NSERC).
Acknowledgments
We extend our sincere thanks to S. Villeneuve, owner of the property where the experiment was conducted. We thank Dr. W.F.J. Parsons for improving the language of this paper.
Conflict of interest
The authors declare that the research was conducted in the absence of any commercial or financial relationships that could be construed as a potential conflict of interest.
Generative AI statement
The author(s) declare that no Generative AI was used in the creation of this manuscript.
Publisher’s note
All claims expressed in this article are solely those of the authors and do not necessarily represent those of their affiliated organizations, or those of the publisher, the editors and the reviewers. Any product that may be evaluated in this article, or claim that may be made by its manufacturer, is not guaranteed or endorsed by the publisher.
Supplementary material
The Supplementary Material for this article can be found online at: https://www.frontiersin.org/articles/10.3389/fagro.2025.1520142/full#supplementary-material
References
Beillouin D., Ben-Ari T., Malézieux E., Seufert V., Makowski D. (2021). Positive but variable effects of crop diversification on biodiversity and ecosystem services. Global Change Biol. 27, 4697–4710. doi: 10.1111/gcb.v27.19
Bouttier L., Paquette A., Messier C., Rivest D., Olivier A., Cogliastro A. (2014). Vertical root separation and light interception in a temperate tree-based intercropping system of Eastern Canada. Agroforestry Syst. 88, 693–706. doi: 10.1007/s10457-014-9721-6
Bradford J. B., D’Amato A. W. (2012). Recognizing trade-offs in multi-objective land management. Front. Ecol. Environ. 10, 210–216. doi: 10.1890/110031
Brooks M. E., Kristensen K., van Benthem K. J., Magnusson A., Berg C. W., Nielsen A., et al. (2017). glmmTMB Balances speed and flexibility among packages for zero-inflated generalized linear mixed modeling. R. J. 9, 378–400. doi: 10.32614/RJ-2017-066
Byrnes J. E., Gamfeldt L., Isbell F., Lefcheck J. S., Griffin J. N., Hector A., et al. (2014). Investigating the relationship between biodiversity and ecosystem multifunctionality: challenges and solutions. Methods Ecol. Evol. 5, 111–124. doi: 10.1111/mee3.2014.5.issue-2
Carrier M., Rhéaume Gonzalez F. A., Cogliastro A., Olivier A., Vanasse A., Rivest D. (2019). Light availability, weed cover and crop yields in second generation of temperate tree-based intercropping systems. Field Crops Res. 239, 30–37. doi: 10.1016/j.fcr.2019.05.004
Centre de Référence en Agriculture et Agroalimentaire du Québec (CRAAQ) (2010). Guide de référence en fertilisation [Reference Guide for Crop Fertilization, In French]. 2nd edn (Québec: Centre de Référence en Agriculture et Agroalimentaire du Québec).
Cerda R., Orozco-Aguilar L., Sepúlveda N., Ordoñez J., Carreño-Rocabado G., Amores F., et al. (2019). “Tropical agroforestry and ecosystem services: trade-off analysis for better design strategies,” in Agroforestry for sustainable agriculture. Eds. Mosquera-Losada M. R., Prabhu R. (Burleigh Dodds Science Publishing, Cambridge, UK), 467–510.
Clough Y., Krishna V. V., Corre M. D., Darras K., Denmead L. H., Meijide A., et al. (2016). Land-use choices follow profitability at the expense of ecological functions in Indonesian smallholder landscapes. Nat. Commun. 7, 13137. doi: 10.1038/ncomms13137
Daryanto S., Wang L., Jacinthe P. A. (2017). Impacts of no-tillage management on nitrate loss from corn, soybean and wheat cultivation: A meta-analysis. Sci. Rep. 7, 12117. doi: 10.1038/s41598-017-12383-7
DeLonge M., Vandecar K. L., D’Odorico P., Lawrence D. (2013). The impact of changing moisture conditions on short-term P availability in weathered soils. Plant Soil 365, 201–209. doi: 10.1007/s11104-012-1373-6
Doraisami M., Kish R., Paroshy N. J., Domke G. M., Thomas S. C., Martin A. R. (2022). A global database of woody tissue carbon concentrations. Sci. Data 9, 284. doi: 10.1038/s41597-022-01396-1
Duran J., Delgado-Baquerizo M., Rodríguez A., Covelo F., Gallardo A. (2013). Ionic exchange membranes (IEMs): a good indicator of soil inorganic N production. Soil Biol. Biochemistry. 57, 964–968.
Félix G. F., Scholberg J. M. S., Clermont-Dauphin C., Cournac L., Groot J. C. J., Tittonell P. (2018). Enhancing agroecosystem productivity with woody perennials in semi-arid West Africa. A meta-analysis. Agron. Sustain. Dev. 38, 57. doi: 10.1007/s13593-018-0533-3
Fortier J., Truax B., Gagnon D., Lambert F. (2013). Mature hybrid poplar riparian buffers along farm streams produce high yields in response to soil fertility assessed using three methods. Sustainability 5, 1893–1916. doi: 10.3390/su5051893
Fox J., Weisberg S. (2019). An {R} Companion to Applied Regression. 3rd ed. (Thousand Oaks CA: Sage). Available at: https://socialsciences.mcmaster.ca/jfox/Books/Companion/ (Accessed June 01, 2024).
Frazer G. W., Canham C. D., Lertzman K. P. (1999). Gap Light Analyzer (GLA), Version 2.0: Imaging software to extract canopy structure and gap light transmission indices from true-colour fisheye photographs, users manual and program documentation (Millbrook, N.Y: Simon Fraser University, Burnaby, B.C., and the Institute of Ecosystem Studies).
Gagné G., Lorenzetti F., Cogliastro A., Rivest D. (2022). Soybean performance under moisture limitation in a temperate tree-based intercropping system. Agric. Syst. 201, 103460. doi: 10.1016/j.agsy.2022.103460
Grass I., Kubitza C., Krishna V. V., Corre M. D., Mußhoff O., Pütz P., et al. (2020). Trade-offs between multifunctionality and profit in tropical smallholder landscapes. Nat. Commun. 11, 1186. doi: 10.1038/s41467-020-15013-5
Graves A. R., Burgess P. J., Liagre F., Pisanelli A., Paris P., Moreno G., et al. (2009). “Farmer perceptions of silvoarable systems in seven european countries”. In: Agroforestry in Europe: Current Status and Future Prospects. Eds. Rigueiro-Rodríguez A., McAdam J., Mosquera-Losada M. R. (Springer, Agroforestry in Europe: Current Status and Future Prospects, Dordrecht, The Netherlands).
Hangs R. D., Greer K. J., Sulewski C. A. (2004). The effect of interspecific competition on conifer seedling growth and nitrogen availability measured using ion-exchange membranes. Can. J. For. Res. 34, 754–761. doi: 10.1139/x03-229
Ivezić V., Lorenz K., Lal R. (2022). Soil organic carbon in alley cropping systems: a meta-analysis. Sustainability 14, 1296. doi: 10.3390/su14031296
Ivezić V., Yu Y., van der Werf W. (2021). Crop yields in European agroforestry systems: a meta-analysis. Front. Sustain. Food Syst. 5, 606631. doi: 10.3389/fsufs.2021.606631
Jacobs S. R., Webber H., Niether W., Grahmann K., Lüttschwager D., Schwartz C., et al. (2022). Modification of the microclimate and water balance through the integration of trees into temperate cropping systems. Agric. For. Meteorol. 323, 109065. doi: 10.1016/j.agrformet.2022.109065
Kletty F., Rozan A., Habold C. (2023). Biodiversity in temperate silvoarable systems: a systematic review. Agricult. Ecosyst. Environ. 351, 108480. doi: 10.1016/j.agee.2023.108480
Kuyah S., Whitney C. W., Jonsson M., Sileshi G. W., Öborn I., Muthuri C. W., et al. (2019). Agroforestry delivers a win-win solution for ecosystem services in sub-Saharan Africa. A meta-analysis. Agron. Sustain. Dev. 39, 47. doi: 10.1007/s13593-019-0589-8
Lambert M. C., Ung C. H., Raulier F. (2005). Canadian national tree aboveground biomass equations. Can. J. For. Res. 35, 1996–2018. doi: 10.1139/x05-112
Laroche G., Domon G., Gélinas N., Doyon M., Olivier A. (2019). Integrating agroforestry intercropping systems in contrasted agricultural landscapes: a SWOT-AHP analysis of stakeholders’ perceptions. Agroforestry Syst. 93, 947–959. doi: 10.1007/s10457-018-0191-0
Lawson G., Dupraz C., Watté J. (2019). “Can silvoarable systems maintain yield, resilience, and diversity in the face of changing environments?,” in Agroecosystem Diversity. Eds. Lemaire G., De Faccio Carvalho P. C., Kronberg S., Recous S. (London, England: Academic Press), 145–168.
Lenth R. (2023). _emmeans: Estimated Marginal Means, aka Least-Squares Means_. R package version 1.8.6. Available online at: https://CRAN.R-project.org/package=emmeans (Accessed June 01, 2024).
Li Z., Kurz W. A., Apps M. J., Beukema S. J. (2003). Belowground biomass dynamics in the Carbon Budget Model of the Canadian Forest Sector: recent improvements and implications for the estimation of NPP and NEP. Can. J. For. Res. 33, 126–136. doi: 10.1139/x02-165
Lin C. H., McGraw R. L., George M. F., Garrett H. E. (1999). Shade effects on forage crops with potential in temperate agroforestry practices. Agroforestry Syst. 44, 109–119. doi: 10.1023/A:1006205116354
Liu W., Yao S., Wang J., Liu M. (2019). Trends and features of agroforestry research based on bibliometric analysis. Sustainability 11, 3473. doi: 10.3390/su11123473
Ma Z., Chen H. Y., Bork E. W., Carlyle C. N., Chang S. X. (2020). Carbon accumulation in agroforestry systems is affected by tree species diversity, age and regional climate: A global meta-analysis. Global Ecol. Biogeogr. 29, 1817–1828. doi: 10.1111/geb.v29.10
Majaura M., Böhm C., Freese D. (2024). The influence of trees on crop yields in temperate zone alley cropping systems: a review. Sustainability 16, 3301. doi: 10.3390/su16083301
Mayer S., Wiesmeier M., Sakamoto E., Hübner R., Cardinael R., Kühnel A., et al. (2022). Soil organic carbon sequestration in temperate agroforestry systems - a meta-analysis. Agricult. Ecosyst. Environ. 323, 107689. doi: 10.1016/j.agee.2021.107689
Pang K., Van Sambeek J. W., Navarrete-Tindall N. E., Lin C. H., Jose S., Garrett H. E. (2019). Responses of legumes and grasses to non-, moderate, and dense shade in Missouri, USA. I. Forage yield and its species-level plasticity. Agroforestry Syst. 93, 1124. doi: 10.1007/s10457-017-0067-8
Pardon P., Reubens B., Reheul D., Mertens. J., De Frenne P., Coussement T., et al. (2017). Trees increase soil organic carbon and nutrient availability in temperate agroforestry systems. Agricult. Ecosyst. Environ. 247, 98–111. doi: 10.1016/j.agee.2017.06.018
Pinheiro J., Bates D., R Core Team (2023). _nlme: Linear and Nonlinear Mixed Effects Models_. R package version 3.1-162. Available online at: https://CRAN.R-project.org/package=nlme (Accessed June 01, 2024).
Piotto S., Panozzo A., Pasqualotto G., Carraro V., Barion G., Mezzalira G., et al. (2024). Phenology and radial growth of poplars in wide alley agroforestry systems and the effect on yield of annual intercrops in the first four years of tree age. Agricult. Ecosyst. Environ. 361, 108814. doi: 10.1016/j.agee.2023.108814
Rapidel B., Ripoche A., Allinne C., Metay A., Deheuvels O., Lamanda N., et al. (2015). Analysis of ecosystem services trade-offs to design agroecosystems with perennial crops. Agron. Sustain. Dev. 35, 1373–1390. doi: 10.1007/s13593-015-0317-y
R Core Team. (2023). R: A language and environment for statistical computing (Vienna, Austria: R Foundation for Statistical Computing). Available at: https://www.R-project.org/ (Accessed June 01, 2024).
Réseaux grandes cultures du Québec (RGCQ) (2016). Guide des réseaux grandes cultures du Québec (CEROM), 56 p.
Reyes F., Gosme M., Wolz K. J., Lecomte I., Dupraz C. (2021). Alley cropping mitigates the impacts of climate change on a wheat crop in a Mediterranean environment: a biophysical model-based assessment. Agriculture 11, 356. doi: 10.3390/agriculture11040356
Rivest D., Martin-Guay M. O. (2024). Nitrogen leaching and soil nutrient supply vary spatially within a temperate tree-based intercropping system. Nutrient. Cycling. Agroecosyst. 128, 217–231. doi: 10.1007/s10705-024-10347-8
Rolo V., Roces-Diaz J. V., Torralba M., Kay S., Fagerholm N., Aviron S., et al. (2021). Mixtures of forest and agroforestry alleviate trade-offs between ecosystem services in European rural landscapes. Ecosyst. Serv. 50, 101318. doi: 10.1016/j.ecoser.2021.101318
Schwarz J., Schnabel F., Bauhus J. (2021). A conceptual framework and experimental design for analysing the relationship between biodiversity and ecosystem functioning (BEF) in agroforestry systems. Basic. Appl. Ecol. 55, 133–151. doi: 10.1016/j.baae.2021.05.002
Scordia D., Corinzia S. A., Coello J., Vilaplana Ventura R., Jiménez-De-Santiago D. E., Singla Just B., et al. (2023). Are agroforestry systems more productive than monocultures in Mediterranean countries? A meta-analysis. Agron. Sustain. Dev. 43, 73. doi: 10.1007/s13593-023-00927-3
Soil Classification Working Group (1998) (The Canadian System of Soil Classification: Agriculture and Agri-Food Canada Publication 1646). Revised.
Thapa R., Mirsky S. B., Tully K. L. (2018). Cover crops reduce nitrate leaching in agroecosystems: A global meta-analysis. J. Environ. Qual. 47, 1400–1411. doi: 10.2134/jeq2018.03.0107
Thiesmeier A., Zander P. (2023). Can agroforestry compete? A scoping review of the economic performance of agroforestry practices in Europe and North America. For. Policy Econ. 150, 102939. doi: 10.1016/j.forpol.2023.102939
Torralba M., Fagerholm N., Burgess P. J., Moreno G., Plieninger T. (2016). Do European agroforestry systems enhance biodiversity and ecosystem services? A meta-analysis. Agricult. Ecosyst. Environ. 230, 150–161. doi: 10.1016/j.agee.2016.06.002
Veldkamp E., Schmidt M., Markwitz C., Beule L., Beuschel R., Biertümpfel A., et al. (2023). Multifunctionality of temperate alley-cropping agroforestry outperforms open cropland and grassland. Commun. Earth Environ. 4, 20. doi: 10.1038/s43247-023-00680-1
Wendt J. W., Hauser S. (2013). An equivalent soil mass procedure for monitoring soil organic carbon in multiple soil layers. Eur. J. Soil Sci. 64, 58–65. doi: 10.1111/ejs.2013.64.issue-1
Wolz K. J., DeLucia E. H. (2018). Alley cropping: Global patterns of species composition and function. Agricult. Ecosyst. Environ. 252, 61–68. doi: 10.1016/j.agee.2017.10.005
Keywords: alley cropping, silvoarable systems, ecosystem services, tree species composition, crop yield, tree-crop interactions
Citation: Rivest D, Martin-Guay M-O, Hébert È-M, Dulac S, Cogliastro A and Maheu A (2025) Evaluating ecosystem multifunctionality in tree-based intercropping: a case study from southern Québec, Canada. Front. Agron. 7:1520142. doi: 10.3389/fagro.2025.1520142
Received: 30 October 2024; Accepted: 21 January 2025;
Published: 05 February 2025.
Edited by:
Nasim Ahmad Yasin, University of the Punjab, PakistanReviewed by:
Stefano Monaco, Council for Agricultural Research and Agricultural Economy Analysis | CREA, ItalyPetros Chavula, World Agroforestry Centre (ICRAF), Zambia
Copyright © 2025 Rivest, Martin-Guay, Hébert, Dulac, Cogliastro and Maheu. This is an open-access article distributed under the terms of the Creative Commons Attribution License (CC BY). The use, distribution or reproduction in other forums is permitted, provided the original author(s) and the copyright owner(s) are credited and that the original publication in this journal is cited, in accordance with accepted academic practice. No use, distribution or reproduction is permitted which does not comply with these terms.
*Correspondence: David Rivest, ZGF2aWQucml2ZXN0QHVxby5jYQ==