
94% of researchers rate our articles as excellent or good
Learn more about the work of our research integrity team to safeguard the quality of each article we publish.
Find out more
ORIGINAL RESEARCH article
Front. Agron., 04 March 2025
Sec. Climate-Smart Agronomy
Volume 7 - 2025 | https://doi.org/10.3389/fagro.2025.1476033
 Phongnapha Phanthanong1
 Kanokporn Promnikorn2
 Pasajee Kongsil1
 Ekaphan Kraichak2Sujin Jenweerawat1
 Supachai Vuttipongchaikij3,4
 Piya Kittipadakul1*
Despite cassava’s significance as a staple crop in tropical and subtropical regions, there is limited understanding of how specific environmental factors influence the productivity of different cassava varieties. This study investigated the complex relationship between environmental factors and cassava yield traits such as fresh root yield (FRY), dry root yield (DRY), starch content (SC) and harvest index (HI) using data obtained from six cassava varieties cultivated for five seasons (2014 to 2019) across nine major locations in Thailand. A total of 41 distinct environmental trials were conducted, representing a range of conditions encompassing various rainfall and temperature patterns, as well as soil characteristics. Field experiments were conducted using a randomized complete block design with four replicates at each location. Climatic data, including air temperature and precipitation, along with soil parameters, were recorded and analyzed to assess their impact on cassava yield traits. Regression analysis revealed distinct coefficients for environmental factors affecting different yield parameters. Cumulative precipitation during 4-5 months after planting (MAP) and 6-10 MAP, as well as the average air temperature during 2-3 MAP and 6-10 MAP, positively influenced cassava yield. However, negative correlations were observed between soil organic matter and HI. Furthermore, the average air temperature at 4-5 MAP, 6-10 MAP, and 1-10 MAP negatively impacts FRY and DRY, while cumulative precipitation during 1 MAP and 2-3 MAP negatively impacts the HI and SC traits. Varieties exhibited varied responses to environmental factors, emphasizing the need to consider specific variety responses for accurate interpretation. The study introduces a novel approach for selecting specific cassava genotypes adapted to distinct environmental conditions by grouping regression coefficients across evaluated parameters. These findings provide insights for optimizing agricultural practices to enhance cassava productivity and contribute to sustainable crop cultivation.
Cassava (Manihot esculenta Crantz) stands as a major crop in tropical and subtropical regions, serving as a source of carbohydrates for both human consumption and animal feed (McCallum et al., 2017). According to the Food and Agriculture Organization of the United Nations (FAO), global cassava production reached approximately 330 million tonnes in 2022, cultivated over an area of about 32 million hectares (FAOSTAT, 2022). Asia contributes significantly to this production, accounting for around 30% of the world’s cassava output. Thailand, in particular, is one of the leading producers in the region, with an annual production of over 34 million tonnes from approximately 1.5 million hectares, and an average yield of about 21 tonnes per hectare (FAOSTAT, 2022). The substantial production levels in Thailand underscore the importance of cassava in both the regional and global agricultural landscape. Moreover, cassava-derived starch plays a pivotal role in various industries worldwide. The demand for cassava as a raw material extends beyond food consumption to include applications in the food processing industry, animal feed, biofuel production, and the manufacture of biodegradable products (Sawangkeaw and Ngamprasertsith, 2013; Sriroth et al., 2010). In Thailand, cassava starch is a significant export commodity, contributing to the country’s economy and meeting the global demand for renewable and sustainable industrial materials (Sriroth et al., 2016). The market dynamics surrounding cassava are influenced by its versatility and the increasing need for eco-friendly products, positioning cassava as a key player in both food security and industrial development (Howeler, 2014b). The growing demand underscores the necessity to enhance cassava production to support both local livelihoods and global market needs.
Cassava’s adaptability to diverse climatic and soil conditions renders it a resilient crop, contributing significantly to food security and economic stability (Montagnac et al., 2009; Pushpalatha and Gangadharan, 2020). In the pursuit of maximizing cassava production, the selection of suitable cultivars adapted to specific climate and soil conditions becomes paramount. The intricacies of cassava growth are influenced by various climatic factors such as temperature and precipitation, along with soil characteristics including type, mineral content and compost availability (Senkoro et al., 2018; Pushpalatha and Gangadharan, 2020). Understanding the interactions among these variables is crucial for identifying key factors that control cassava productivity.
Various factors such as soil properties, farming practices, varietal selection, climate conditions, pests, and diseases significantly impact cassava yield worldwide (Howeler, 2014a). Cassava is a resilient crop that experiences less yield reduction from climate change compared to maize, sorghum, millet, and groundnut (Schlenker and Lobell, 2010). Cassava demonstrates considerable tolerance to temperatures of approximately 34°C, provided moisture is adequate (Brown et al., 2016). In a study on the impact of climate change on crop yields in sub-Saharan Africa, yield changes of -19% to +6% for maize, -38% to -13% for millet, and -47% to -7% for sorghum by 2100 were predicted, whereas predictions in cassava yields were near zero (Blanc, 2012). Despite its resilience, cassava yields can be affected by extreme weather conditions such as floods and prolonged drought, which may lead to substantial yield losses (Schlenker and Lobell, 2010; Jarvis et al., 2012). Furthermore, Dwamena et al. (2022) reported that the minimum temperature, maximum temperature extremes, relative humidity, and rainfall collectively accounted for 74.3% of the variability in cassava yield reduction in Ghana, highlight the importance of understanding cassava’s response to climatic stressors in the face of changing environmental conditions.
However, until recently, comprehensive data detailing the growth responses of different cassava varieties under various conditions were limited (Amelework et al., 2023). With the advent of newly developed tools for collecting weather data over extended periods and insights gained from yield trials spanning nearly a decade, we are now equipped to explore parameters that can predict and identify key controlling factors for cassava production (Adejuwon and Agundiminegha, 2019; Pipitpukdee et al., 2020). Using cassava as a test crop is justified due to its economic importance, its role in food security, and the pressing need to meet the rising market demand.
Despite cassava’s importance in global agriculture and its resilience to various environmental stressors, there remains limited understanding of how specific environmental factors influence the productivity of different cassava varieties (Nduwumuremyi et al., 2017). Previous studies have highlighted general trends in cassava’s response to climate and soil conditions, but they often overlook variety-specific responses that could be critical for optimizing yields under region-specific conditions (Fermont et al., 2010; OkogBenin et al., 2013). Additionally, while cassava is often lauded for its tolerance to high temperatures and varying moisture levels, the specific climatic and soil factors that maximize its yield in distinct environments are still not fully understood. This study aims to fill these gaps by investigating the influence of both climatic and edaphic factors on cassava productivity across multiple varieties cultivated in Thailand over five years.
Our hypothesis is that cassava yield traits such as fresh root yield (FRY), dry root yield (DRY), starch content (SC), and harvest index (HI) are significantly influenced by a combination of specific climatic and soil parameters, and that these factors interact uniquely with different cassava varieties. By identifying the environmental factors that most strongly correlate with yield characteristics, we hope to provide insights that can inform targeted cassava breeding and cultivation strategies to enhance productivity, especially in the context of climate change.
Selected trials were monitored for their annual yield and soil quality from 2014 to 2019. These trials spanned across nine provinces in Central and Eastern Thailand (Table 1; Figure 1). These locations were chosen because they vary in cassava productivity due to differences in climate, soil types, and topography. For instance, Nakhon Ratchasima, the largest province and main cassava production area, features sandy loam soils and a tropical savanna climate with distinct wet and dry seasons. Nakhon Sawan has fertile alluvial plains with loamy soils and a tropical wet and dry climate. Chaiyaphum presents sandy soils and moderate rainfall. In contrast, Chachoengsao in Eastern Thailand experience higher rainfall and heavier clay soils, testing cassava’s adaptability to higher moisture and less permeable soils. Chonburi combines coastal and inland areas with sandy soils and moderate to high rainfall, possibly introducing salinity factors. Lop Buri offers fertile loamy soils and a tropical wet and dry climate. Kamphaeng Phet provides varying soils from sandy loam to clay loam under a tropical savanna climate, adding diversity in soil textures. Uthai Thani features both river plains and upland areas with varying soil fertility and moderate rainfall patterns. Lastly, Kanchanaburi has lateritic soils with lower fertility and higher acidity.
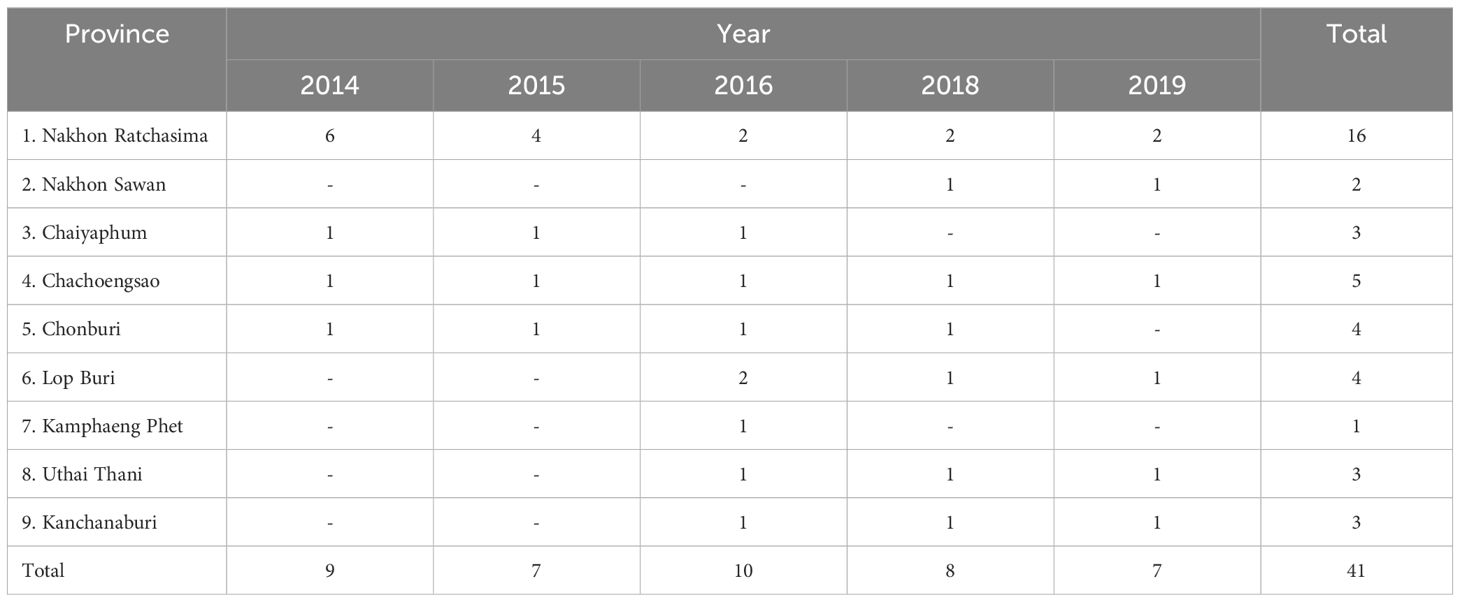
Table 1. Number of experiments conducted across locations performed in this study during 2014-2019.
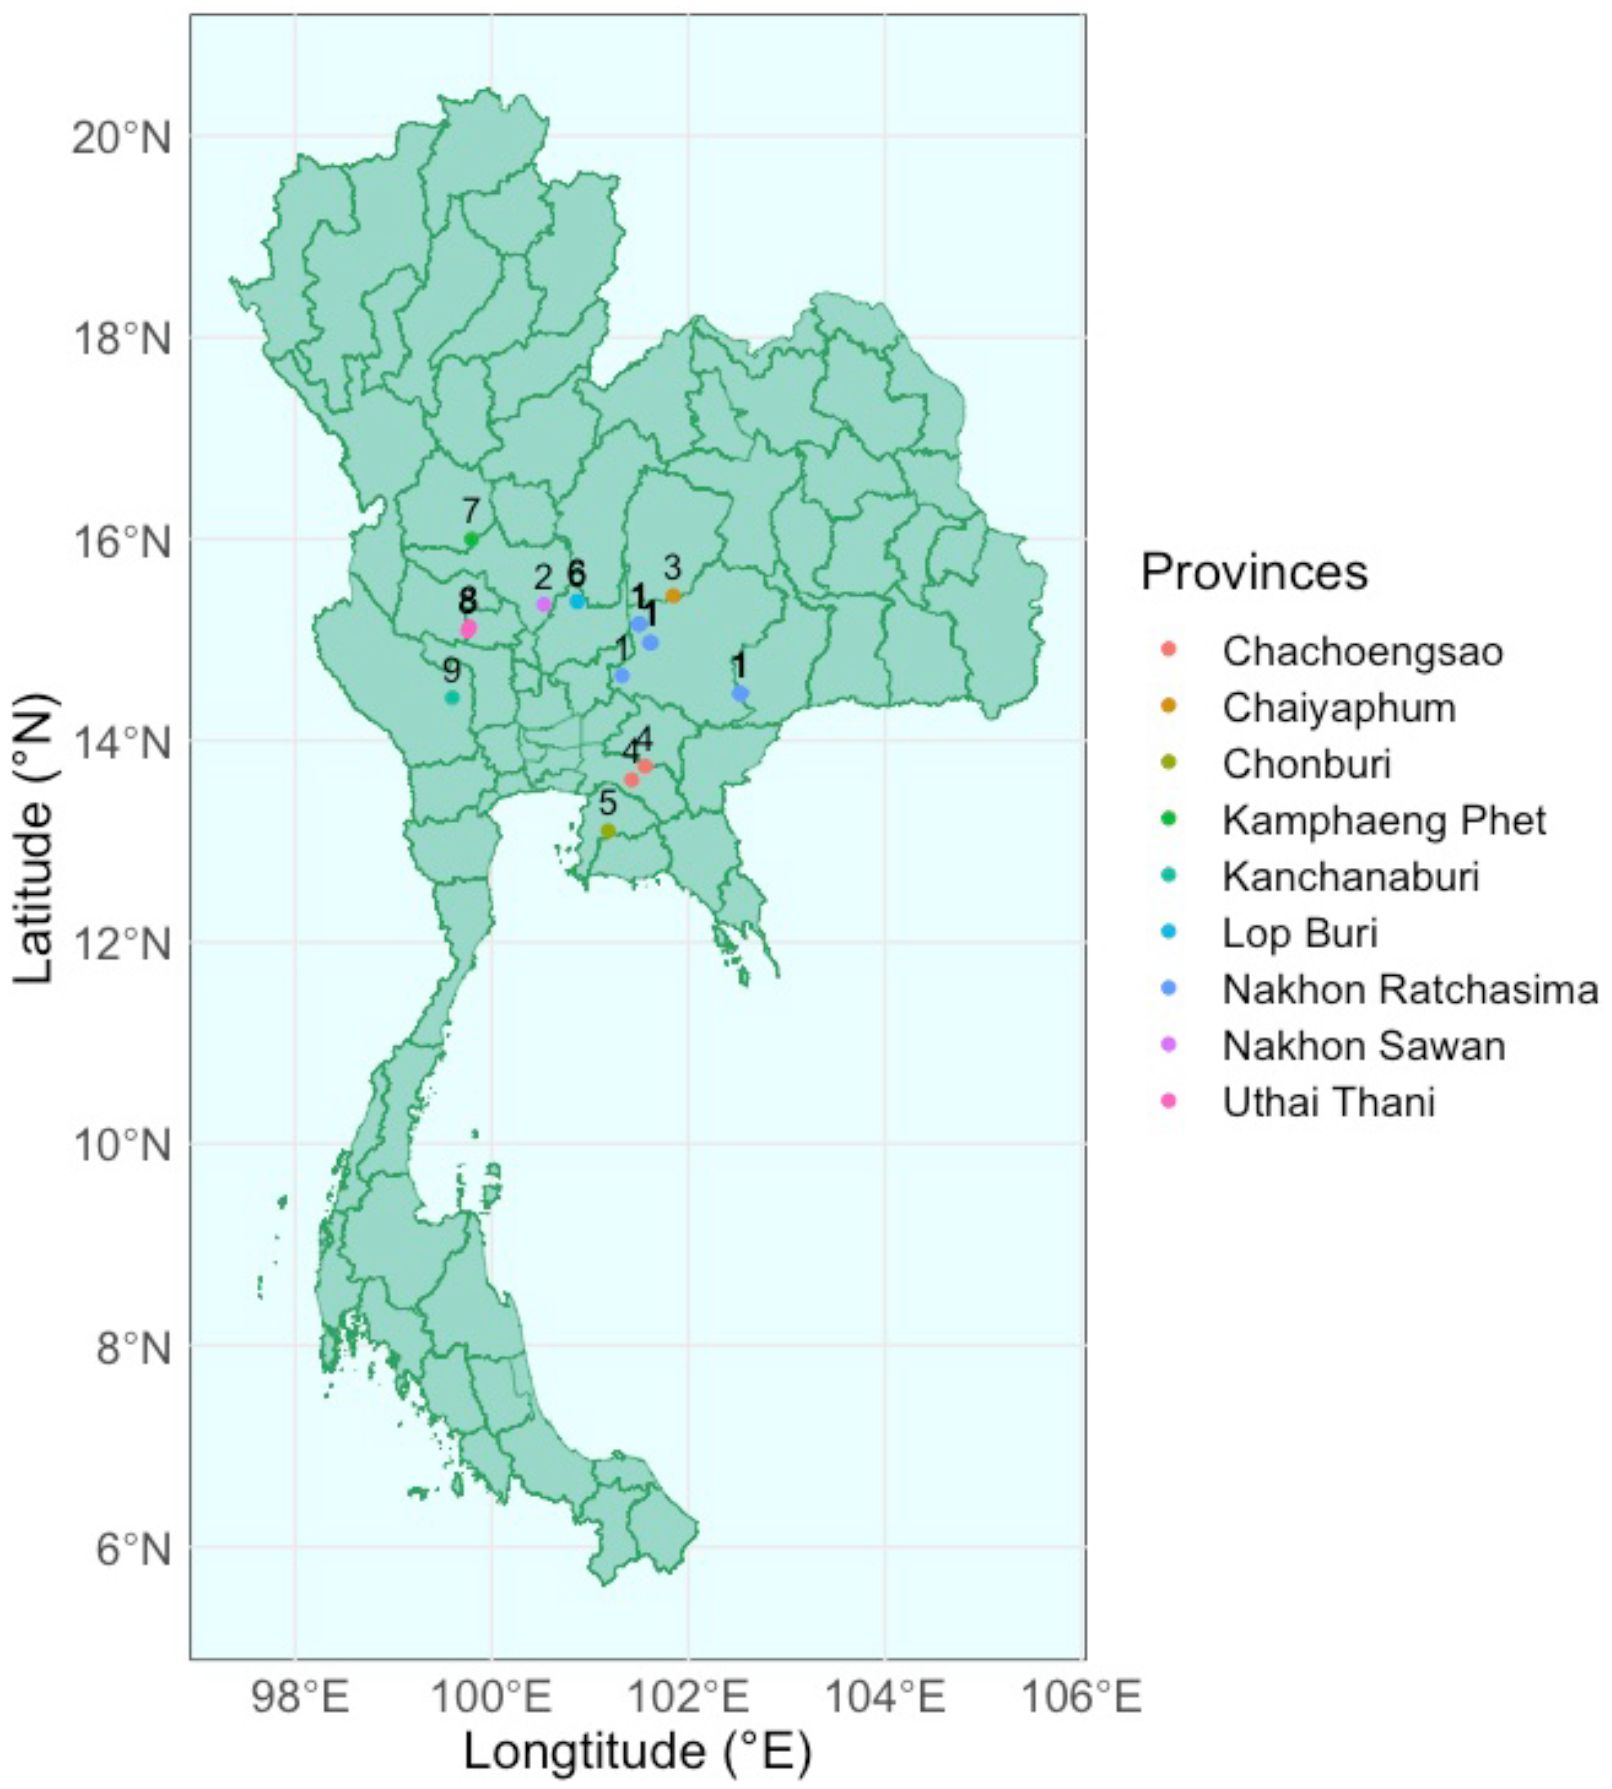
Figure 1. Locations of cassava selection trials used in this study.
The trials utilized a randomized complete block design (RCBD) comprising four blocks. The planting area of each experimental unit is 46 m2 (6 rows, 8 plants per row) with an area of 23 m2 being harvested (24 plants). Border rows were incorporated into the experimental field design.
The study involved six cassava varieties, including four commercial varieties and two breeding lines. The commercial varieties were Kasetsart 50 (KU50), Rayong 1 (R1), Rayong 5 (R5), and Huay Bong 60 (HB60). KU50 has been widely propagated in Thailand for 32 years since its release and remains highly popular due to its high yield potential and tolerance to Cassava Mosaic Disease (CMD). HB60 is also a high-yielding variety with CMD tolerance. R1 is known for its large root crown and adaptability to various environments, though it generally produces low starch content. R5 is a high-yielding variety popularly used in the western production areas of Thailand. The two breeding lines were KUC51-13-99, a progeny of R11 and KU50, notable for its high yield and high root number per plant, and KUC50-17-03, a progeny of open-pollinated HB60, distinguished by its high yield and high starch content.
Field trials were conducted with spacing of 1.2 meters between rows and 0.8 meters within rows. The crop was rainfed throughout the growing season. Chemical fertilizers with an N:P:K ratio of 1:2:1 were applied at a rate of 31.25 g m-2. The fertilizer was applied by sowing beneath the cassava plants at 3 MAP. Harvesting took place at 11 MAP, manually and weighed on-site using a 60 kg capacity spring balance with 200 g resolution. FRY was calculated as total fresh root yield on 1,600 m2. HI was calculated as the ratio of root weight to total plant weight. For DRY data, thin fresh-root slices (~5 mm thickness) of 300 grams were obtained from the middle section of three selected cassava roots per crown, dried in an incubator oven at 70°C for at least seven days, or until they reached a constant weight, and then weighed using a two-digit electronic balance. Then DRY was calculated as weight on 1,600 m2. Starch content (SC, % w/w) was assessed directly on-site using a Reimann scale based on the specific gravity (Wholey and Booth, 1979).
The climate data including temperature at 2 meters above the land and the total precipitation (meters) were acquired from the ERA5-Land monthly Averaged-ECMWF Climate reanalysis product (Muñoz, 2019), at 11-132 kilometers spatial resolution on Google Earth Engine (GEE) cloud-based platform (Gorelick et al., 2017). The climate data covered the study site (Figure 1) from January 2014 to March 2020 (see Supplementary File S1). The monthly precipitation was reduced into the cumulative precipitation following the cassava’s growth including the cumulative precipitation of the first MAP, the cumulative precipitation of the 2-3 MAP, the cumulative precipitation of the 4-5 MAP, and the cumulative precipitation of the 6-10 MAP. Likewise, the monthly air temperature was the average air temperature.
Soil sampling was conducted, ensuring coverage across each trial with 15-20 spots sampled per trial. Employing a shovel, V-shaped holes were excavated to a depth of approximately 15 centimeters vertically. Subsequently, the collected soil samples were analyzed for soil qualities included pH, percent of the sand, the silt, the clay, and the organic matter, and contents of the potassium, the calcium, and the magnesium.
To determine the environmental factors influencing cassava yield traits, we conducted trials including four commercial varieties and two breeding lines. These trials were carried out across 41 trials throughout central Thailand over five years, from 2014 to 2019. Data collection included FRY, DRY, HI, and SC.
These data were subjected to correlation analysis to determine the relationships between yield parameters and environmental factors. Multiple regression and model selection were employed to determine the best set of environmental factors for predicting yield parameters for each variety. The results offer an understanding of the cultivar-specific responses to climatic and edaphic factors affecting cassava productivity.
All of the subsequent data preparation and analysis were performed using R program version 4.2.1. The climatic and edaphic data were subjected to the standardization to ensure the comparability across variables prior to correlations and multiple regression.
To determine the interaction of environmental variables with differing units and scales on cassava productivity, each variable was standardized to a similar scale using z-scores before multivariate analyses. The z-score for each variable was calculated following Equation 1:
where zi is the z-score of environmental variable i, xi is the raw value of environmental variable i, μi is the mean of environmental variable i, and σi is the standard deviation of environmental variable i.
The Pearson’s pairwise correlation analysis was performed to determine the correlation between each of the productivity measure and each of the environmental variable. The correlation coefficients were visualized using the function “corrplot” in the package “corrplot” (Wei et al., 2021).
For each variety, a multiple regression model was constructed with one yield parameter as a response variable and all available environmental factors as explanatory. The full model was then subjected to the stepwise model selection to reduce unnecessary environmental variables from the multicollinearity among environmental variables. The variable selection process using a stepwise regression was applied to extract the significant environmental variables affecting yield-related variables in each cassava variable. The best regression model was selected by considering the Akaike information criterion (AIC) value. If which model had the lowest AIC value, the model was chosen prior to determining the coefficient power of environmental variables on cassava productivity in the next step. The model selection was performed using stepAIC function from the “MASS” package (Venables and Ripley, 2002).
The final model for each variety and yield parameter was chosen through the model selection process. The coefficients of these variables were retrieved from each of the final models, using the “coef” function. For the variables that were excluded from the final model, the value of zero was assigned as a coefficient for that variable. The coefficients from the best models were visualized for each variety using heatmap in the package “pheatmap” to demonstrate the patterns of responses and similarities among the variety (Kolde, 2012).
A set of 17 environmental factors recorded over the 5-year period, encompassing variables comprising air temperature, soil composition and properties, along with cumulative precipitation, as detailed in Table 2.
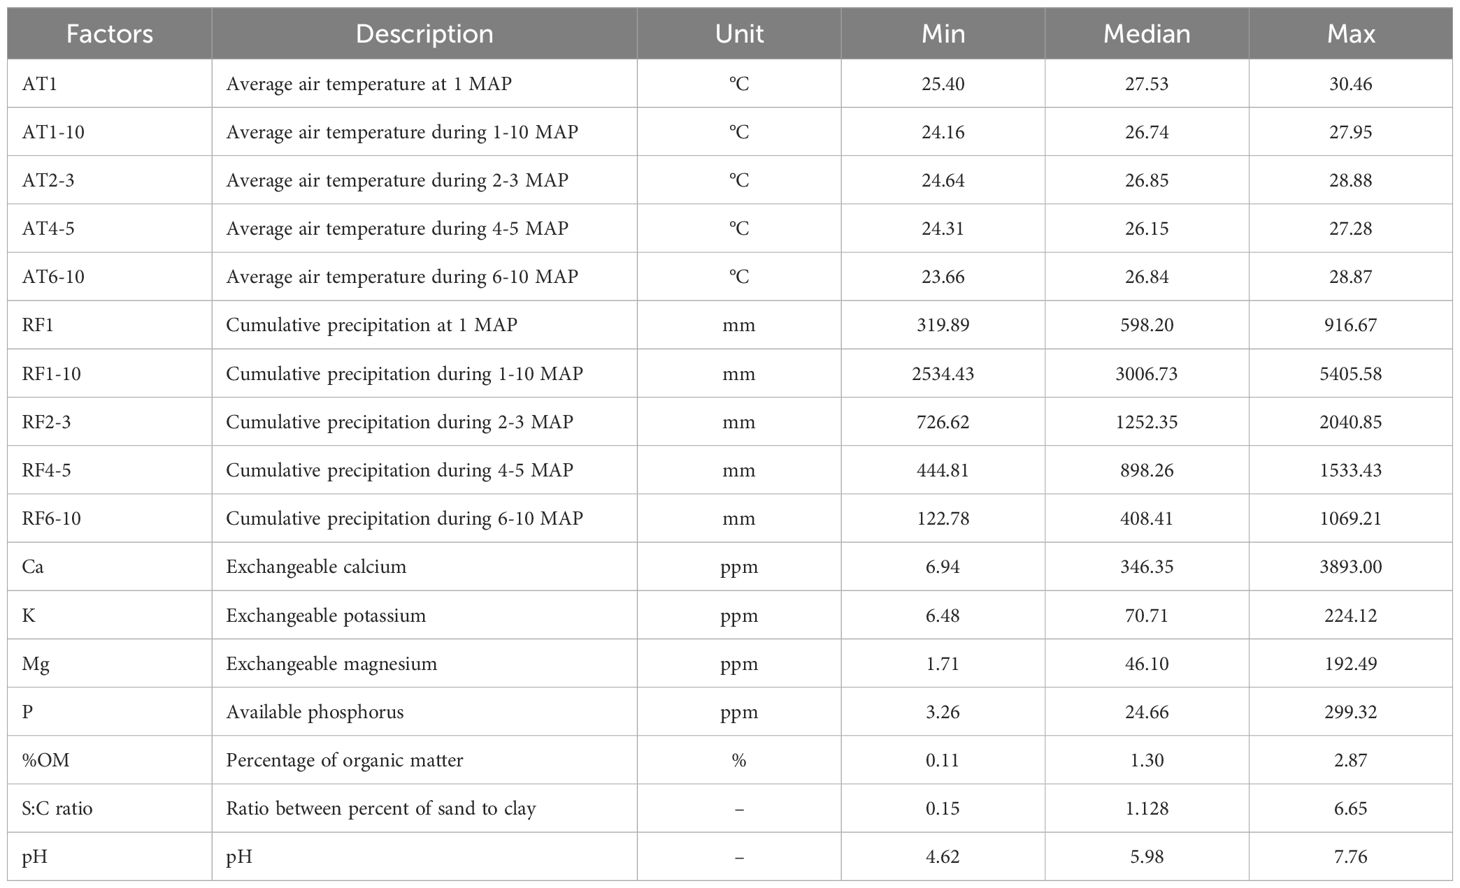
Table 2. Summary of climatic and edaphic data in the study areas during 2014-2019.
Pearson’s pairwise correlation analysis revealed cumulative precipitation during 4-5 MAP and 6-10 MAP had a robust positive correlation with all yield traits (Figure 2). In contrast, other environmental factors exhibited both negative and positive correlations with specific yield traits. Particularly noteworthy was the negative correlation of organic matter, displaying a notably high negative association with the HI. Various soil factors exhibited weak correlations with the traits, excepting HI. When considering each yield trait, HI displayed that the majority of soil factors exhibited negative correlations. Conversely, HI demonstrated positive correlations with various factors. However, it displayed negative associations with cumulative precipitation during 1 MAP and 2-3 MAP. The FRY exhibited relatively weak correlations with the majority of factors. Whereas, it had a robust positive correlation, particularly with cumulative precipitation during 6-10 MAP, along with moderate positive correlations with cumulative precipitation during 4-5 MAP and throughout the planting season. DRY showed strong positive correlations with cumulative precipitation in a similar pattern to those of FRY. However, it displayed moderate negative correlations with average air temperature during 4-5 MAP and 6-10 MAP and average air temperature over the planting season. Furthermore, DRY exhibited apparent weak correlations with all soil factors. The SC displayed a strong correlation with cumulative precipitation during 4-5 MAP and moderate positive correlations with cumulative precipitation during 6-10 MAP and average air temperature at 1 MAP. The majority of factors had relatively weak correlations with SC. The differential responses of individual traits demonstrate the interplay between environmental factors and cassava yield traits, underlining the effects of specific conditions in influencing crop outcomes.
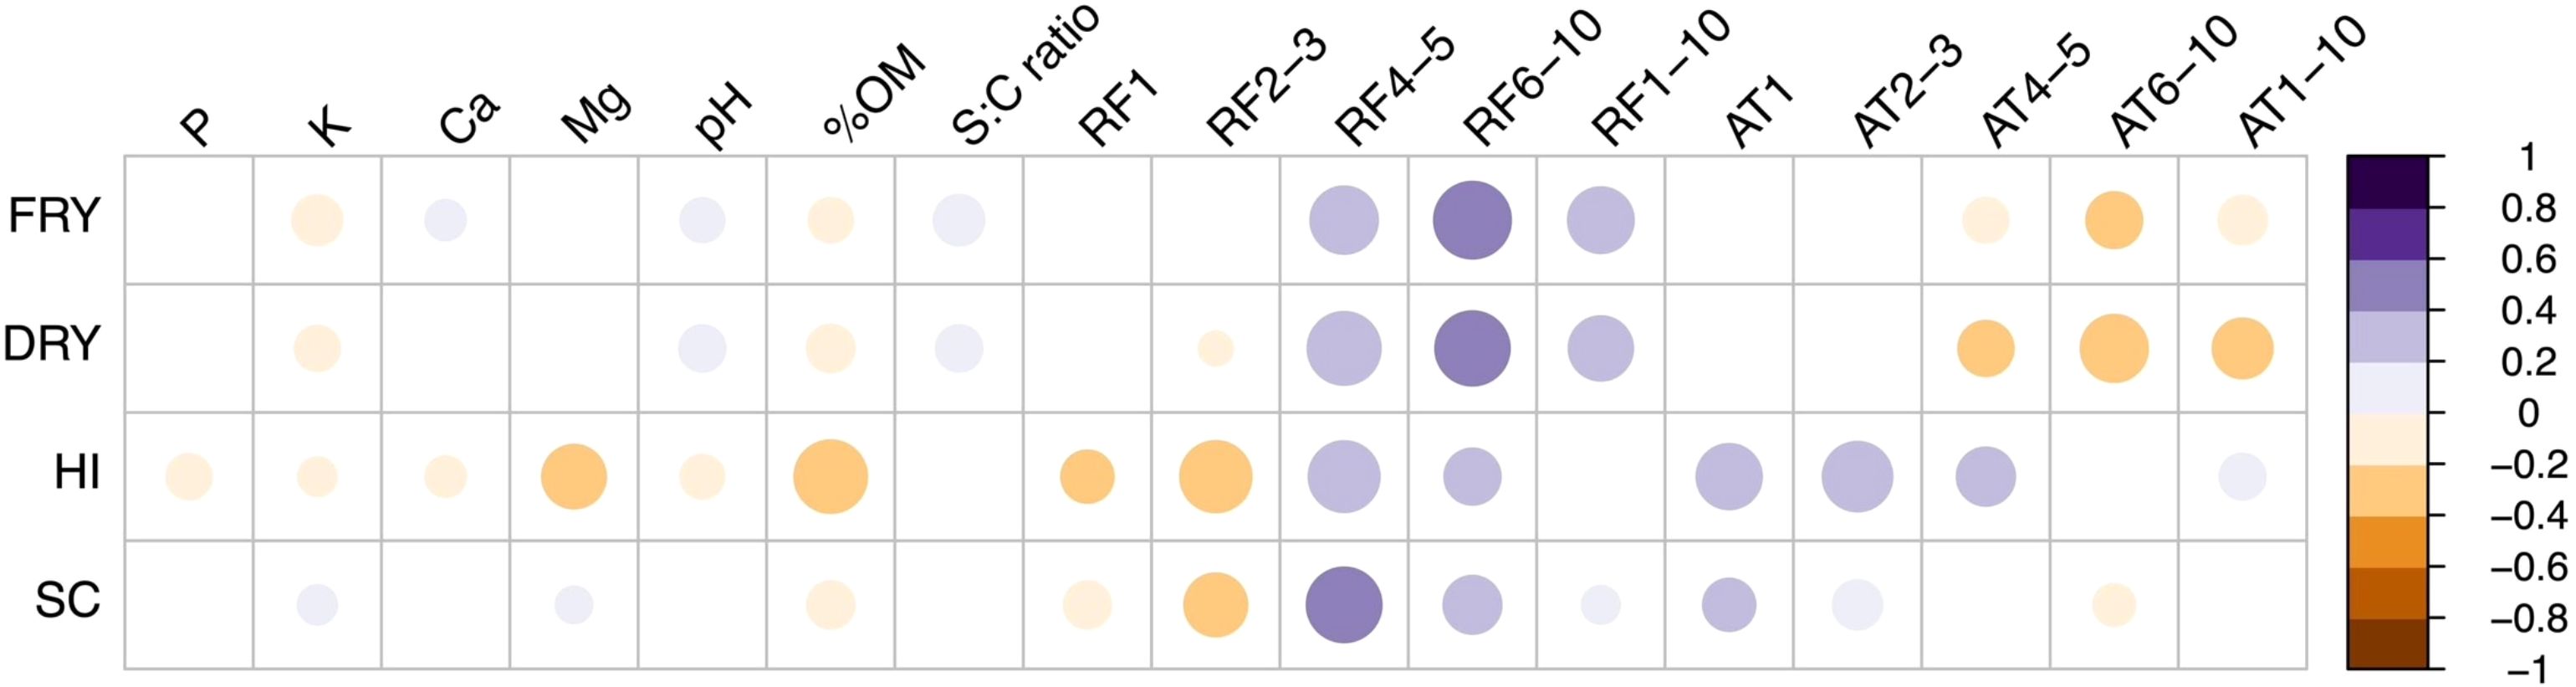
Figure 2. Correlation matrix between productivity and explanatory variables. The four cassava traits include fresh root yield (FRY), dry root yield (DRY), starch content (SC), and harvest index (HI). The environmental factors analyzed include average air temperature at different growth periods (AT1, AT2-3, AT4-5, AT6-10), cumulative precipitation during key growth stages (RF1, RF2-3, RF4-5, RF6-10, RF1-10), and soil properties (K, P, Ca, Mg, pH, S:C ratio and %OM). Each cell in the matrix represents the correlation coefficient between the corresponding variables, with positive correlations indicated by purple colors and negative correlations represented by brown colors (p<0.05).
Utilizing stepwise model selection, we identified the best regression models based on AIC values before determining the coefficient strengths of environmental variables on cassava yield parameters, including FRY, DRY, HI and SC (Figure 3; Supplementary Tables S1–S4).
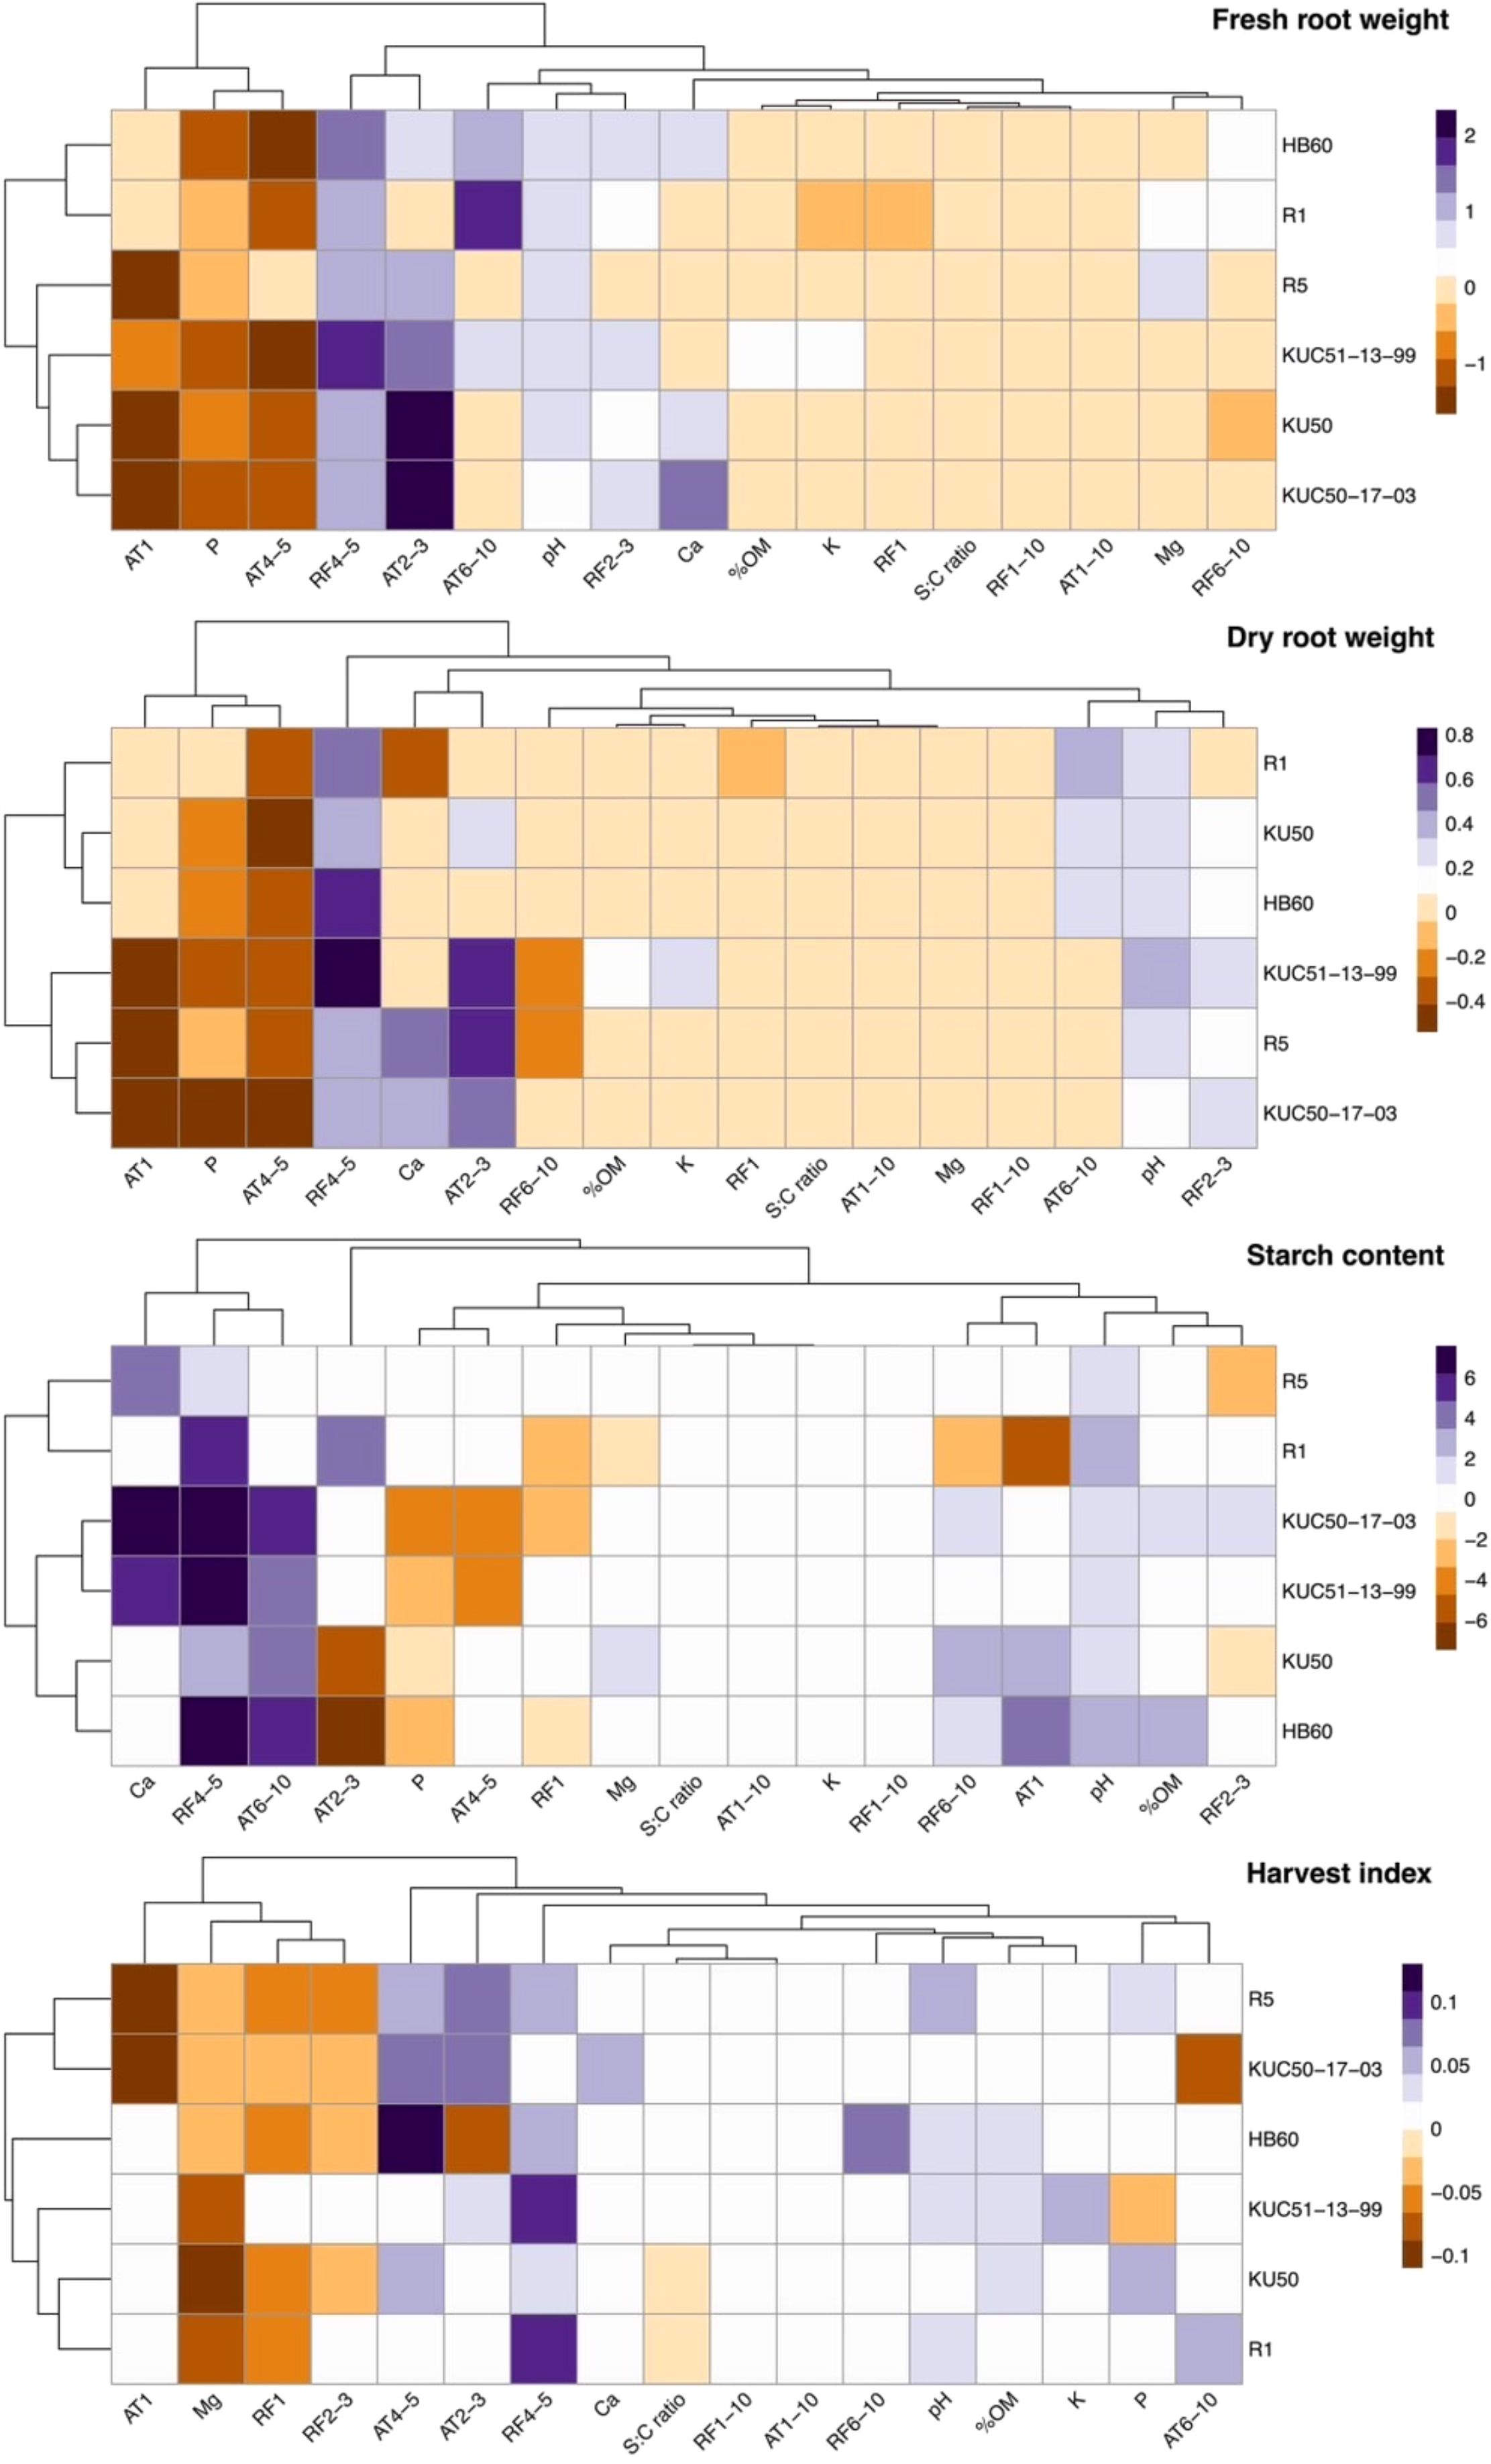
Figure 3. Heatmap showing regression coefficients of each explanatory variables in the best models for predicting cassava productivity in four varieties (R5, HB60, KU50, and R1) and two breeding lines (KUC50-17-03 and KUC51-13-99). The cluster diagrams group variables and varieties based on their similarities in regression coefficients.
For FRY, the regression analysis revealed that average temperature during 4-5 MAP, phosphorus content, and average temperature at 1 MAP generally exhibited negative coefficients. Conversely, average temperature during 2-3 MAP and total precipitation during 4-5 MAP showed strong positive impacts on FRY, with other explanatory variables demonstrating relatively smaller effects.
For DRY, the most effective model showcased slightly divergent coefficients for each environmental variable. Average air temperature during 4-5 MAP, average air temperature at 1 MAP, and phosphorus content typically exhibited negative coefficients, whereas cumulative precipitation during 4-5 MAP and average temperature during 2-3 MAP had predominantly positive coefficients. Cumulative precipitation during 2-3 MAP, pH, and average temperature during 6-10 MAP had slightly positive coefficients.
Analysis of SC revealed varying coefficients for each environmental factor across varieties, with some factors exerting influence, while others had no discernible effect. Cumulative precipitation during 4-5 MAP strongly impacted most varieties positively, with pH showing a weaker positive effect. Average air temperature during 6-10 MAP had a strong positive effect across most varieties, while phosphorus content had a moderate negative effect. Notably, R1 and R5 were unaffected by the average air temperature during 6-10 MAP and phosphorus content.
For HI, the final model depicted varying coefficients of environmental factors across varieties. Magnesium content exhibited negative coefficients across all varieties, while total precipitation at 1 MAP and cumulative precipitation during 2-3 MAP mostly displayed negative coefficients. Cumulative precipitation during 4-5 MAP had positive coefficients in most varieties. Average temperature during 2-3 MAP elicited positive responses in most varieties. Calcium content had positive impacts only on KUC50-17-03, while cumulative precipitation during 6-10 MAP had positive impacts solely on HB60. pH exhibited moderately positive coefficients in most varieties. Magnesium content exhibited negative coefficients with particularly strong coefficients in KU50, KUC51-13-99, and R1, and moderate coefficients in KUC50-17-03, HB60, and R5.
Regarding FRY, when considering the environmental effects on each variety, the best models for each variety displayed slightly different coefficients for each explanatory variable (Figure 3; Supplementary Tables S1–S4). We observed that HB60 and R1 were similar in their lack of response to average temperature at 1 MAP. Conversely, other varieties were more negatively impacted by average temperature at 1 MAP and positively affected by average temperature in 2-3 MAP.
For DRY, the varieties were divided into two groups based on their responses to environmental factors. The first group, consisting of HB60, KU50, and R1, was negatively impacted by average air temperature during 4-5 MAP and positively impacted by cumulative precipitation during 4-5 MAP. Additionally, this group exhibited moderate positive effects from average air temperature during 6-10 MAP, cumulative precipitation during 2-3 MAP, and pH. The second group, comprising KUC51-13-99, KUC50-17-03, and R5, was negatively impacted by average air temperature at 1 MAP and during 4-5 MAP, as well as phosphorus content. Conversely, it was positively affected by average air temperature during 2-3 MAP and cumulative precipitation during 4-5 MAP. Notably, calcium content had positive coefficients in the dry root weight of R5 and KUC50-17-03, but negative coefficients in the dry root weight of R1.
For SC, although KUC50-17-03 exhibited responses similar to KUC51-13-99 for some variables, it differed in response to others. KUC50-17-03 positively affected cumulative precipitation during 2-3 and 6-10 MAP and organic matter, but negatively affected total precipitation at 1 MAP. Additionally, KU50 and HB60 displayed partly positive responses to cumulative precipitation during 4-5 MAP and 6-10 MAP, average temperature at 1 MAP, and pH, but partly negative responses to average temperature during 2-3 MAP and phosphorus content. R5 exhibited more positive responses to calcium content, while R1 showed more positive responses to cumulative precipitation during 4-5 MAP and more negative responses to average temperature at 1 MAP.
For HI, R5 and KUC50-17-03 negatively responded to total precipitation at 1 MAP and cumulative precipitation during 2-3 MAP, average air temperature at 1 MAP, and magnesium content. Moreover, they positively responded to average air temperature during 2-3 MAP and 4-5 MAP. Conversely, KU50 and R1 negatively responded to magnesium content and total precipitation at 1 MAP, while positively responding to cumulative precipitation during 4-5 MAP, pH, and phosphorus content. Only KUC51-13-99 negatively responded to phosphorus content. Additionally, only HB60 was positively impacted by cumulative precipitation during 6-10 MAP.
In this study, regression analysis revealed distinct coefficients for environmental factors affecting different yield parameters. For instance, FRY and DRY were negatively impacted by average temperature during 4-5 MAP, 6-10 MAP and 1-10 MAP, but positively influenced by cumulative precipitation during the same intervals. This indicates that while higher temperatures during critical growth phases can stress the plants, adequate rainfall can mitigate some of these adverse effects by ensuring sufficient soil moisture (El-Sharkawy, 2006). Similarly, SC was positively affected by cumulative precipitation during 4-5 MAP and 6-10 MAP but negatively impacted by potassium content and magnesium content. Excessive soil potassium and magnesium might disrupt osmotic balance and interfere with starch synthesis pathways, reducing SC (Howeler, 2001; Ezui et al., 2017). Varieties responded differently to environmental factors, with some exhibiting similar responses and others showing divergent impacts. For instance, HB60 and R1 showed similar responses to average temperature at 1 MAP on FRY, while HB60, KU50, and R1 showed similar responses to average temperature at 1 MAP on DRY. This may stem from their kinship, considering in the pedigree as R1 is a progenitor of KU50 and KU50 is a progenitor of HB60 (Kittipadakul et al., 2017; Ceballos et al., 2020). Conversely, KUC51-13-99, KUC50-17-03, and R5 were negatively affected by average air temperature at 1 MAP and during 4-5 MAP but positively influenced by average air temperature during 2-3 MAP and cumulative precipitation during 4-5 MAP. Overall, the study highlights the complex interplay between environmental factors and cassava yield traits, providing insights for optimizing cultivation practices and enhancing productivity.
The impact of rainfall on cassava yield is generally positive, with some exceptions. Firstly, cumulative rainfall at 1 MAP has a negative regression coefficient for HI in almost all varieties, except for KUC51-13-99, and for SC, especially in varieties R1, HB60, and KUC50-17-03. Secondly, cumulative rainfall during 2 -3 MAP has a negative regression coefficient for HI, except for KUC51-13-99 and R1. Notably, the HI of KUC51-13-99 remains unaffected by precipitation during the early stages from 1-3 MAP, allowing its HI to thrive rapidly during 4-5 MAP when receiving adequate rainfall. Conversely, cumulative rainfall during 4-5 MAP exhibited a positive regression coefficient for all yield-related parameters. This finding is consistent with Almeida et al. (2021), who revealed a decline in cassava productivity, including shoot, root, and stake yield, during water shortages experienced from 3 to 6 MAP. Additionally, water limitation from 9 to 12 MAP also impacts shoot and root productivity, albeit to a lesser extent than drought observed from 3 to 6 MAP. During 4-5 MAP, the canopy reached its maximum volume, and increased precipitation may enhance cassava growth without providing further advantage to unwanted weeds in the fields (Pipatsitee et al., 2019). Effective weed control in cassava can lead to a yield increase of up to 18% in areas impacted by weed competition (Howeler, 2014b).
During 4-5 MAP, the canopy of cassava reached its maximum volume, and increased precipitation may enhance cassava growth by promoting plant health and vigor. This period is crucial for the establishment of the crop, as a dense canopy can effectively suppress the growth of unwanted weeds, reducing competition for nutrients and water. While our study did not directly assess the presence of weeds or specific weed management practices, it is important to recognize that effective weed control can significantly influence cassava yield. Previous studies have shown that implementing weed management strategies can lead to yield increases of up to 18% in affected areas (Howeler, 2014b). Therefore, although our primary focus was on the effects of environmental factors such as precipitation on cassava growth, the interaction between cassava and weed competition is a vital consideration for maximizing productivity, especially during key growth phases.
The negative regression coefficient of average temperature at 1 MAP for HI, particularly for the variety R5 and the line KUC50-17-03, FRY for almost all varieties and lines except HB60 and R1, and DRY especially for the lines KUC51-13-99 and KUC50-17-03 and R5, can be attributed to the high temperatures during this period leading to water deficit for cassava seedlings, which lack root depth to regain soil moisture for evapotranspiration during the day (Alves, 2001). Interestingly, the negative regression coefficient of average temperature during 4-5 MAP for FRY, except for variety R5, DRY for all varieties and lines, and SC specifically for varieties KUC50-17-03 and KUC51-13-99, suggests a different response. During the period of 3 to 6 MAP, cassava plants are expected to reach full canopy developmental stage (Alves, 2001), and the highest leaf area index should be achieved by 4 to 5 MAP (Pipatsitee et al., 2019). Consequently, the increase in air temperature during this period may accelerate leaf cell respiratory activity and lead to water loss through evapotranspiration. Supporting evidence for this is found in the study by Grados and Schrevens (2020), which demonstrated that canopy growth of cassava reached a plateau during 4 to 5 MAP. The study showed that the differential values of Normalized Difference Vegetation Index (NDVI) during 1 to 206 days after planting ranged from 0.35 to 0.40 during 295 to 372°C days of growing degree days (GDD) to reach the highest value around 0.7 at 800°C days, remaining at 0.7 until 1,600°C days. Conversely, the positive regression coefficient of average temperature during 4-5 MAP for HI, especially for variety HB60, can be attributed to the cessation of shoot and leaf growth during this period, which redirects the main photoassimilates towards the roots. Additionally, positive regression coefficients were observed for average temperature during 6-10 MAP in relation to fresh root production, particularly for varieties R1 and HB60, and SC for almost all varieties, except for varieties R5 and R1. This finding aligns with Alves (2001), indicating that root starch accumulation primarily occurs during the 6 to 10 MAP period.
The study conducted by Brown et al. (2016) investigated the interaction between temperature and soil moisture in cassava growth. It revealed that cassava demonstrates considerable tolerance to temperatures of approximately 34°C, provided it receives adequate water supply. However, if drought and high temperatures coincide throughout the plant’s growth cycle, particularly during the 5 MAP period, the formation of storage roots could be inhibited. Therefore, our study emphasizes the importance of the total amount of rainfall received during the 4-5 MAP period in influencing all cassava yield characteristics. This is particularly critical because tuberization, the process in which cassava roots begin to form, starts at around 3-4 MAP. Adequate moisture during this period is essential to support the physiological processes involved in root development and storage accumulation and can strongly affect storage root formation and overall yield (El-Sharkawy, 2003).
Fotso et al. (2018) conducted a study examining the combined analysis of variance of FRY and DRY from 18 cassava genotypes cultivated in Cameroon. The study encompassed eight environments with diverse rainfall and temperature patterns, as well as varying soil characteristics, across two cropping seasons. The results revealed that genotype accounted for 5% and 7% of the total sum of squares for FRY and DRY, respectively. In contrast, environment contributed 46.6% and 40.8% to the total sum of squares for FRY and DRY, respectively. The contribution of Genotype by Environment to the overall sum of squares was 12.8% and 12.7%. Among several environmental parameters, soil phosphorus, potassium, calcium, and magnesium showed a negative correlation with HI. Particularly KUC51-13-99 exhibited decreasing HI with increasing soil phosphorus. Notably, soil phosphorus had detrimental impacts on FRY and DRY for all varieties, and on SC for almost all varieties and lines except for R1 and R5. According to Howeler (2014b), the optimal soil phosphorus level for cassava is between 4 and 15 ppm. However, our study found that the soil phosphorus levels ranged from 3.3 to 299.3 ppm, exceeding the optimal range for cassava growth. Excessive phosphorus can lead to nutrient imbalances, particularly by inhibiting the uptake of other essential nutrients such as iron and zinc, which are critical for plant health and growth. High phosphorus levels can also alter soil pH, potentially leading to conditions that are less favorable for cassava root development. Consequently, these high phosphorus levels could have adverse impacts on cassava yield by disrupting nutrient uptake and causing physiological stress in the plants (Shen et al., 2011).
Our study further demonstrated that soil potassium had a favorable effect alone on DRY of KUC51-13-99. The optimal range for soil potassium was found to be between 6.5 to 224.1 ppm. In contrast, Howeler (2014b) recommended a narrower range of 58.5 to 97.5 ppm for cassava cultivation. Of all the nutrients present in the soil, potassium is one of the most important nutrients for enhancing the cassava storage root formation. Conversely, soil magnesium had an adverse impact on HI of all varieties when its concentration ranged from 1.7 to 192.5 ppm. However, Howeler (2014b) recommended a narrower range of 48 to 120 ppm for soil magnesium in cassava cultivation. Remarkably, soil calcium exhibited a positive impact on both FRY of KUC50-17-03 and the starch content of KUC50-17-03, KUC51-13-99, and R5. The soil calcium levels in this study varied from 6.9 to 3,893 ppm, whereas Howeler (2014b) suggested a desirable range of 200 to 1,000 ppm. In cassava, adequate calcium levels can enhance root development and nutrient uptake, ultimately leading to improved growth and yield. Conversely, insufficient calcium may result in physiological disorders, reduced root quality, and lower starch accumulation in the storage roots (Agbaje and Akinlosotu, 2004). Therefore, certain trials in this study exhibited a diminished level of soil calcium, which could potentially impact the productivity of cassava by adversely affecting root development and nutrient utilization.
The level of the soil’s pH had a positive impact on all four cassava yield traits in specific varieties. The positive impact of soil pH on cassava yield traits is likely due to improved nutrient availability at optimal pH levels. In soils closer to neutral pH, essential nutrients become more accessible, supporting cassava growth and storage root formation. This increased nutrient uptake could explain the higher yields observed in specific varieties. The HI of HB60, KUC51-13-99, and KU50 showed positive responses in fields with higher levels of organic matter. KUC51-13-99 was the only variety that responded positively to organic matter availability in both fresh and dry root production, while KUC50-17-03 and HB60 responded positively in starch production. The soil organic matter OM and pH levels observed in this investigation were predominantly within the low range. The organic matter range observed was 0.1-2.9%, which was lower than the range proposed by Howeler (2014b) of 2-4%. Hence, the presence of higher quantities of soil organic matter in regions with low organic matter content is initially low can significantly enhance the productivity of cassava. The soil pH range observed was 4.6-7.8, falling within the recommended range of 4.5 to 7.0. However, it is worth noting that a neutral soil pH is optimal for nutrient availability, thereby promoting increased cassava yield.
Various cassava varieties exhibited distinct responses to environmental parameters such as precipitation, air temperature, and soil chemical composition in this study. The SC in cassava was particularly influenced by changes in environmental conditions, as indicated by the regression coefficient scale, compared to other yield parameters. Interestingly, the correlation between yield and environmental factors studied across all six varieties did not consistently align with each variety’s specific yield response to environmental conditions. Therefore, it is essential to consider the regression coefficient of each variety to interpret its individual response to particular environmental conditions. In addition to an assessment of cassava yield stability through multiplicative interaction (AMMI) analysis (Adjebeng-Danquah et al., 2017) and genotype stability index (GSI) analysis (Amelework et al., 2023), and the selection of genotypes based on regression variance index (Sampaio et al., 2023), our study introduces a novel approach for selecting specific cassava genotypes adapted to distinct environmental conditions in specific cultivation regions, by grouping regression coefficients across evaluated parameters.
Our study examined the complex interplay between environmental factors and cassava yield traits, with a focus on cumulative precipitation, temperature, and soil composition. We identified that cumulative precipitation during 4-5 MAP and 6-10 MAP positively influenced all four yield traits: FRY, DRY, SC, and HI. The results also highlight the varied responses of different cassava varieties to these environmental factors, underscoring the importance of variety-specific adaptation strategies. By introducing a new approach to selecting cassava genotypes tailored to specific environmental conditions, our findings provide a framework for developing targeted cassava breeding and cultivation strategies. This approach aims to optimize yield under varying climate and soil conditions, contributing to sustainable cassava production and enhancing food security.
The original contributions presented in the study are included in the article/Supplementary Material. Further inquiries can be directed to the corresponding author.
PP: Formal Analysis, Visualization, Writing – original draft. KP: Formal Analysis, Methodology, Visualization, Writing – original draft. PKo: Formal Analysis, Writing – original draft. EK: Formal Analysis, Methodology, Visualization, Writing – original draft. SJ: Formal Analysis, Writing – original draft. SV: Formal Analysis, Visualization, Writing – original draft, Writing – review & editing. PKi: Conceptualization, Formal Analysis, Writing – original draft, Writing – review & editing.
The author(s) declare that financial support was received for the research, authorship, and/or publication of this article. This work was financially supported by Kasetsart University Research and Development Institute (KURDI) and the Office of the Ministry of Higher Education, Science, Research and Innovation; and the Thailand Science Research and Innovation through the Global Network on Sustainable Bioeconomy in Agri-Business program: (Cassava Value Chain as a Successful Model). This research is supported in part by the Graduate Program Scholarship from The Graduate School, Kasetsart University. SV was financial supported by the Office of the Ministry of Higher Education, Science, Research and Innovation; and the Thailand Science Research and Innovation through the Kasetsart University Reinventing University Program 2024.
We thank the Kasetsart University Research and Development Institute (KURDI) and the Center for Advanced Studies of Agriculture and Food (CASAF) for their support. We used ChatGPT Model GPT-4o to enhance language and readability. After utilizing this tool, we reviewed and edited the content and take full responsibility for the content of the publication.
The authors declare that the research was conducted in the absence of any commercial or financial relationships that could be construed as a potential conflict of interest.
All claims expressed in this article are solely those of the authors and do not necessarily represent those of their affiliated organizations, or those of the publisher, the editors and the reviewers. Any product that may be evaluated in this article, or claim that may be made by its manufacturer, is not guaranteed or endorsed by the publisher.
The Supplementary Material for this article can be found online at: https://www.frontiersin.org/articles/10.3389/fagro.2025.1476033/full#supplementary-material
Adejuwon J. O., Agundiminegha Y. G. (2019). Impact of climate variability on cassava yield in the humid forest agro-ecological zone of Nigeria. Appl. Sci. Environ. Management. 23, 903–908. doi: 10.4314/jasem.v23i5.21
Adjebeng-Danquah J., Joseph M. A., Vernon E. G., Isaac K. A., Samuel K. O. (2017). AMMI stability analysis and estimation of genetic parameters for growth and yield components in cassava in the forest and Guinea savannah ecologies of Ghana. Int. J. Agron. 2017 (1), 1–10. doi: 10.1155/2017/8075846
Agbaje G. O., Akinlosotu T. A. (2004). Influence of NPK fertilizer on tuber yield of early and late-planted cassava in a forest alfisol of south-western Nigeria. Afr. J. Biotechnol. 3, 547–551. doi: 10.5897/AJB2004.000-2107
Almeida S. M., Samara Z., Hariane L. S., Lais F. M. P. (2021). Nutritional status, yield components, and yield of cassava as influenced by phenological stages and water regimes. J. Plant Nutr. 44, 2912–2927. doi: 10.1080/01904167.2021.1927084
Alves A. A. C. (2001). Cassava botany and physiology In Cassava botany and physiology (Wallingford, UK: CABI Publishing), 67–89. doi: 10.1079/9780851995243.0067
Amelework A. B., Michael W. B., Roelene M., Mark L., Sonja L. V. (2023). Genotype× environment interaction and stability analysis of selected cassava cultivars in South Africa. Plants 12, 2490. doi: 10.3390/plants12132490
Blanc E. (2012). The impact of climate change on crop yields in sub-saharan africa. Am. J. Clim. Chang. 1 (1), 1–13. doi: 10.4236/ajcc.2012.11001
Brown A. L., Timothy R. C., Ros G., Rebecca E. M. (2016). Interactive effects of temperature and drought on cassava growth and toxicity: implications for food security? Global Change Biol. 22, 3461–3473. doi: 10.1111/gcb.13380
Ceballos H., Rojanaridpiched C., Phumichai C., Becerra L. A., Kittipadakul P., Iglesias C., et al. (2020). Excellence in cassava breeding: perspectives for the future. Crop Breeding. Genet. Genomics 2, 1–31. doi: 10.20900/cbgg20200008
Dwamena H. A., Kassim T., Amanda S. A. K. (2022). The effect of rainfall, temperature, and relative humidity on the yield of cassava, yam, and maize in the Ashanti region of Ghana. Int. J. Agron. 2022, 1–12. doi: 10.1155/2022/9077383
El-Sharkawy M. A. (2003). Cassava biology and physiology. Plant Mol. Biol. 53, 621–641. doi: 10.1155/2022/9077383
El-Sharkawy M. (2006). International research on cassava photosynthesis, productivity, eco-physiology, and responses to environmental stresses in the tropics. Photosynthetica 44, 481–512. doi: 10.1007/s11099-006-0063-0
Ezui K. S., Franke A. C., Leffelaar P. A., Mando A., van Heerwaarden J., Sanabria J. M. S. J., et al. (2017). Water and radiation use efficiencies explain the effect of potassium on the productivity of cassava. Eur. J. Agron. 83, 28–39. doi: 10.1016/j.eja.2016.11.005
FAOSTAT. (2022). Crops and livestock products in Production and Trade sections. Food and Agriculture Organization of the United Nations (FAO), Rome, Italy. Available online at: https://www.fao.org/faostat/en/data (Accessed November 10, 2024).
Fermont A. M., Tittonell P. A., Baguma Y., Ntawuruhunga P., Giller K. E. (2010). Towards understanding factors that govern fertilizer response in cassava: lessons from East Africa. Nutrient. Cycling. Agroecosyst. 86, 133–151. doi: 10.1007/s10705-009-9278-3
Fotso A. K., Rachid H., Peter K., Elisabeth P., Peter I., Francis A. N., et al. (2018). AMMI analysis of cassava response to contrasting environments: case study of genotype by environment effect on pests and diseases, root yield, and carotenoids content in Cameroon. Euphytica 214, 1–13. doi: 10.1007/s10681-018-2234-z
Gorelick N., Hancher M., Dixon M., Ilyushchenko S., Thau D., Moore R. (2017). Google Earth Engine: Planetary-scale geospatial analysis for everyone. Remote Sens. Environ. 202, 18–27. doi: 10.1016/j.rse.2017.06.031
Grados D., Schrevens E. (2020). Cassava NDVI analysis: a nonlinear mixed model approach based on UAV-imagery. PFG - J. Photogramm. Remote Sens. Geoinf. Sci. 88 (3), 337–347.
Howeler R. H. (2001). “Cassava mineral nutrition and fertilization,” in Cassava: Biology, production and utilization (CABI, Wallingford UK), 115–147.
Howeler R. H. (2014a). “Chapter 3: What are the major constraints to high yields?,” in Sustainable soil and crop management of cassava in Asia: a reference manual (Cali, Colombia: International Center for Tropical Agriculture (CIAT)).
Howeler R. H. (2014b). “Chapter 6: How to diagnose nutritional problems,” in Sustainable soil and crop management of cassava in Asia: a reference manual (Cali, Colombia: International Center for Tropical Agriculture (CIAT)).
Jarvis A., Ramirez-Villegas J., Herrera C. B. V., Navarro-Racines C. (2012). Is cassava the answer to African climate change adaptation? Trop. Plant Biol. 5, 9–29. doi: 10.1007/s12042-012-9096-7
Kittipadakul P., Kongsil P., Phumichai C., Jansky S. H. (2017). “Chapter 7 Breeding cassava for higher yield,” in Achieving sustainable cultivation of cassava Volume 2: Genetics, breeding, pests and diseases. Ed. C. Hershey C. (Burleigh Dodds Science Publishing, Cambridge, UK), 139–170.
Kolde R. (2012). pheatmap: Pretty heatmaps (Version 1.726) [R package]. Comprehensive R Archive Network (CRAN). Available online at: https://cran.r-project.org/web/packages/pheatmap/.
McCallum E. J., Ravi B. A., Wilhelm G. (2017). Tackling agriculturally relevant diseases in the staple crop cassava (Manihot esculenta). Curr. Opin. Plant Biol. 38, 50–58. doi: 10.1016/j.pbi.2017.04.008
Montagnac J. A., Christopher R. D., Sherry A. T. (2009). Nutritional value of cassava for use as a staple food and recent advances for improvement. Compr. Rev. Food Sci. Food Saf. 8, 181–194. doi: 10.1111/j.1541-4337.2009.00077.x
Muñoz S. J. (2019). ERA5-Land monthly averaged data from 1981 to present (Reading, UK: Copernicus Climate Change Service (C3S) Climate Data Store (CDS). doi: 10.24381/cds.68d2bb30
Nduwumuremyi A., Melis R., Shanahan P., Theodore A. (2017). Interaction of genotype and environment effects on important traits of cassava (Manihot esculenta Crantz). Crop J. 5, 373–386. doi: 10.1016/j.cj.2017.02.004
OkogBenin E., Setter T. L., Ferguson M., Mutegi R., Ceballos H., Olasanmi B., et al. (2013). Phenotypic approaches to drought in cassava. Front. Physiol. 4, 93. doi: 10.3389/fphys.2013.00093
Pipatsitee P., Apisit E., Patchara P., Navavit P., Kanyarat T., Sumaid K., et al. (2019). Non-destructive leaf area estimation model for overall growth performances in relation to yield attributes of cassava (Manihot esculenta Cranz) under water deficit conditions. Notulae. Bot. Horti. Agrobotanici. Cluj-Napoca. 47 (3), 580–591. doi: 10.15835/NBHA47311487
Pipitpukdee S., Attavanich W., Bejranonda S. (2020). Impact of climate change on land use, yield and production of cassava in Thailand. Agriculture 10, 402. doi: 10.3390/agriculture10090402
Pushpalatha R., Gangadharan B. (2020). Is cassava (Manihot esculenta Crantz) a climate “smart” crop? A review in the context of bridging future food demand gap. Trop. Plant Biol. 13, 201–211. doi: 10.1007/s12042-020-09255-2
Sampaio F. J. S., Tiago O., Eder J. O. (2023). Multi-trait selection in multi-environments for performance and stability in cassava genotypes. Front. Plant Sci. 14. doi: 10.3389/fpls.2023.1282221
Sawangkeaw R., Ngamprasertsith S. (2013). A review of lipid-based biomasses as feedstocks for biofuels production. Renewable Sustain. Energy Rev. 25, 97–108. doi: 10.1016/j.rser.2013.04.007
Schlenker W., Lobell D. B. (2010). Robust negative impacts of climate change on African agriculture. Environ. Res. Lett. 5 (1), 014010. doi: 10.1088/1748-9326/5/1/014010
Senkoro C. J., Francis M. T., Catherine N. K., Keziah W. N., Gabriel W. Q., Atanasio E. M., et al. (2018). Cassava yield and economic response to fertilizer in Tanzania, Kenya and Ghana. Agron. J. 110, 1600–1606. doi: 10.2134/agronj2018.01.0019
Shen J., Yuan L., Zhang J., Li H., Bai Z., Chen X., et al. (2011). Phosphorus dynamics: from soil to plant. Plant Physiol. 156, 997–1005. doi: 10.1104/pp.111.175232
Sriroth K., Piyachomkwan K., Wanlapatit S., Nivitchanyong S. (2010). The promise of a technology revolution in cassava bioethanol: From Thai practice to the world practice. Fuel. 89 (7), 1333–1338.
Sriroth K., Vanichsriratana W., Sunthornvarabhas J. (2016). The current status of sugar industry and by-products in Thailand. Sugar Tech. 18, 576–582.
Venables W. N., Ripley B. D. (2002). Modern applied statistics with S, 4th ed. New York, NY: Springer.
Wei T., Simiko V., Levy M., Xie Y., Jin Y., Freidank M., et al. (2021). corrplot: Visualization of a Correlation Matrix (Version 0.92) [R package]. Comprehensive R Archive Network (CRAN). Available online at: https://cran.r-project.org/web/packages/corrplot/.
Keywords: cassava, environmental factor, genotype x environment interaction, cassava selection trials, cassava production, cassava breeding
Citation: Phanthanong P, Promnikorn K, Kongsil P, Kraichak E, Jenweerawat S, Vuttipongchaikij S and Kittipadakul P (2025) Variety-specific responses to climatic and edaphic factors in cassava productivity. Front. Agron. 7:1476033. doi: 10.3389/fagro.2025.1476033
Received: 05 August 2024; Accepted: 14 February 2025;
Published: 04 March 2025.
Edited by:
Matthew Chidozie Ogwu, Appalachian State University, United StatesReviewed by:
Buddhi Marambe, University of Peradeniya, Sri LankaCopyright © 2025 Phanthanong, Promnikorn, Kongsil, Kraichak, Jenweerawat, Vuttipongchaikij and Kittipadakul. This is an open-access article distributed under the terms of the Creative Commons Attribution License (CC BY). The use, distribution or reproduction in other forums is permitted, provided the original author(s) and the copyright owner(s) are credited and that the original publication in this journal is cited, in accordance with accepted academic practice. No use, distribution or reproduction is permitted which does not comply with these terms.
*Correspondence: Piya Kittipadakul, cGl5YS5rQGt1LnRo
Disclaimer: All claims expressed in this article are solely those of the authors and do not necessarily represent those of their affiliated organizations, or those of the publisher, the editors and the reviewers. Any product that may be evaluated in this article or claim that may be made by its manufacturer is not guaranteed or endorsed by the publisher.
Research integrity at Frontiers
Learn more about the work of our research integrity team to safeguard the quality of each article we publish.