- 1Atmospheric Biometeorology Group, Department of Crop and Soil Sciences, College of Agricultural and Environmental Sciences, The University of Georgia, Griffin, GA, United States
- 2Department of Horticulture, College of Agricultural and Environmental Sciences, The University of Georgia, Tifton, GA, United States
Sap flow methods are widely used to estimate water use through transpiration in orchards. This study reports for the first time on pecan tree sap flow properties observed in a micro-irrigated orchard in the southeastern US in 2022 and 2023. This new information regarding sap flow properties of Southeastern pecan trees sheds some insight on how pecan water use responds to environmental conditions. The daily peak in the sap flow density occurs either before or after the peak in diurnal solar radiation. The latter peaks before that of air temperature and vapor pressure deficit while the peaks of air temperature and vapor pressure deficit occur later than that of solar radiation. Seasonally, the largest sap flow density occurred during both the growth stage of early nut sizing in May-July and the growth stage of nut sizing and early kernel filling in July-August. The sap flow density in 2022 was higher than that in 2023 mainly due to higher vapor pressure deficit that year. While a single anticlockwise loop of hysteresis occurred in the sap flow diurnally varying with solar radiation in 2023, a twin loop of hysteresis of sap flow to solar radiation was observed in 2022. The twin loop happened since the sap flow peak occurred earlier than that of solar radiation, possibly attributed to high morning vapor pressure deficit that year. A single clockwise loop hysteresis was present in both years in the response of sap flow to air temperature and vapor pressure deficit. The hysteretic strength of the sub-diurnal sap flow density against the vapor pressure deficit for the Southeastern pecan is quantified using a hysteresis index. The index is correlated positively with vapor pressure deficit. This suggests that the drier the air, the greater difference for pecan tree sap flow (or transpiration) in the afternoon to be smaller than that in the morning at the same vapor pressure deficit.
1 Introduction
Georgia is one of the leading states in pecan production in the United States. Pecan is sensitive to water stress and requires abundant water for optimal growth and production. Even a brief period of water stress can reduce pecan yield, nut weight, and tree growth (Worley, 1982; Stein et al., 1989; Wells, 2015). While there have been myriad studies of pecan tree water use with flood irrigation in the arid Western U.S., there is a paucity of guidelines regarding water supplementation with micro irrigation in the hot and humid Southeastern region of the US, other than the work by Wells (2015, 2016). Thus, information on water use of pecan trees in hot humid climate conditions such as those in the southeastern US is needed.
One method of determining water use by pecan trees is through the use of the sap flow method. This technique has been widely used to estimate transpiration in various orchard crops such as pecan trees (Steinberg et al., 1990; Sorensen et al., 1999), orange trees (Saitta et al., 2020), apple trees (Sakuratani et al., 1997), mango trees (Cotrim et al., 2019), olive, apple and Asian pear trees and grapevines (Fernández et al., 2008), and in various forests (Liu et al., 2017; Oogathoo et al., 2020; and Zeppel et al., 2004). Zhang et al. (1997) reported good agreement between the transpiration rate of poplar trees in Reading UK measured with the sap flow method and the transpiration rate estimated using the Penman-Monteith equation for single trees.
However, Flo et al. (2019) reviewed 290 individual sap flow calibration experiments of the sap flow method from the literature and reported biases and uncertainties in general between the measured sap flow density (or sap flow) and the reference sap flow density (or reference sap flow) typically measured with gravimetric or volumetric methods. Thus, a correction is generally needed to transform the sap flow data into transpiration data. Paço et al. (2004) measured peach tree sap flow in central Portugal. They used the relationship of sap flow to evapotranspiration after removing soil evaporation component to determine transpiration.
The role of meteorological variables such as solar radiation, air temperature, and vapor pressure deficit on sap flow properties has been studied previously (Ferraz et al., 2015; Kokkotos et al., 2021; Lu et al., 2002, 2004). These meteorological variables lead to hysteresis, a phenomenon characterized by a nonlinear loop-like behavior commonly found in many fields such as biology, hydrology, and climate science. Hysteresis occurs when the variation of an independent variable causes a response of the dependent variation different from the dependence between the variables in its history (Zeppel et al., 2004). Studying hysteresis can help understand how and why the interested variable responds to different forcings in environmental conditions.
Hysteresis is also commonly observed in the diurnal variation of sap flow density with weather conditions, especially water vapor pressure deficit (hereafter referred to as VPD) (Liu et al., 2017; Oogathoo et al., 2020; Zeppel et al., 2004). Hysteresis is usually characterized by the shape, direction, and size such as the area of the hysteresis loops (Matheny et al., 2014; Wang et al., 2019). Following an approach originally proposed by Langlois et al. (2005) to quantify the hysteresis in suspended sediment transport, Xu et al. (2022) used a hysteretic index to quantify globally the hysteresis strength in actual evapotranspiration versus VPD. The index reflects the difference between morning and afternoon evaporation in the same VPD conditions. Thus, it can be used, for example, to describe how well the sap flow – VPD curve is used to predict the sap flow using VPD.
As the first study of pecan sap flow under Southeastern U.S. conditions, the present study characterizes the diurnal and seasonal variations of sap flow of pecan trees characterized by long, hot, and humid growing seasons. The influence of environmental variables on pecan tree sap flow is analyzed. This new information helps quantify pecan tree sap flow response to hot humid conditions.
2 Materials and methods
2.1 Study site
The experiment was conducted in a micro-irrigated commercial pecan orchard (32°20’35” N, 83°37’43” W) near Hawkinsville, Georgia in 2022 and 2023. The 287-ha orchard was planted in 2013 with ‘Desirable’ as the main cultivar and ‘Sumner’ as the pollinator. Pecan trees are spaced in 9 m x 15 m with a repeated pattern of eight rows of the main cultivar and two rows of the pollinator. The leaf area index of pecan trees was 2.3 ± 0.3 as measured on September 30, 2022, 1.2 ± 0.2 on June 9, 2023, and 1.0 ± 0.1 on September 22, 2023. The soil type in the vicinity of the measurement site is Norfolk loamy fine sand with 2-5% slopes (NRCS/USDA, 2021). Trees were irrigated according to current University of Georgia Extension recommendations (Wells, 2016).
2.2 Measurement methods
Sap flow measurements were made using thermal dissipation sap flow sensors (model TDP-30, Dynamax Inc., TX) in an irrigation experiment of ‘Desirable’ pecan trees in 2022 and 2023. The current paper only uses data of the normal irrigation following the current University of Georgia Extension recommendations (Wells, 2016), with sensors installed on the north side of tree trunks as the measurements on that side were in all growth stages in both years.
For each tree, a sap flow sensor was set up at a height of about 1.2 m on the north side of the trunk. Two probes of each sap flow sensor were radially inserted 30 mm into the sapwood of the trunk, with the two probes being 4 cm vertically apart between them (Figure 1). Replication varied from 2 to 6 in different periods depending on the available amount of sap flow sensors. All sensors were wrapped with foam and the trunk below the sensors was shielded with aluminum foil to minimize the influence of temperature fluctuations within the sapwood due to sunlight radiation. Sap flow rates were measured every minute and 15-min averages recorded. The 15-min sap flow data was then averaged into 30-min data.
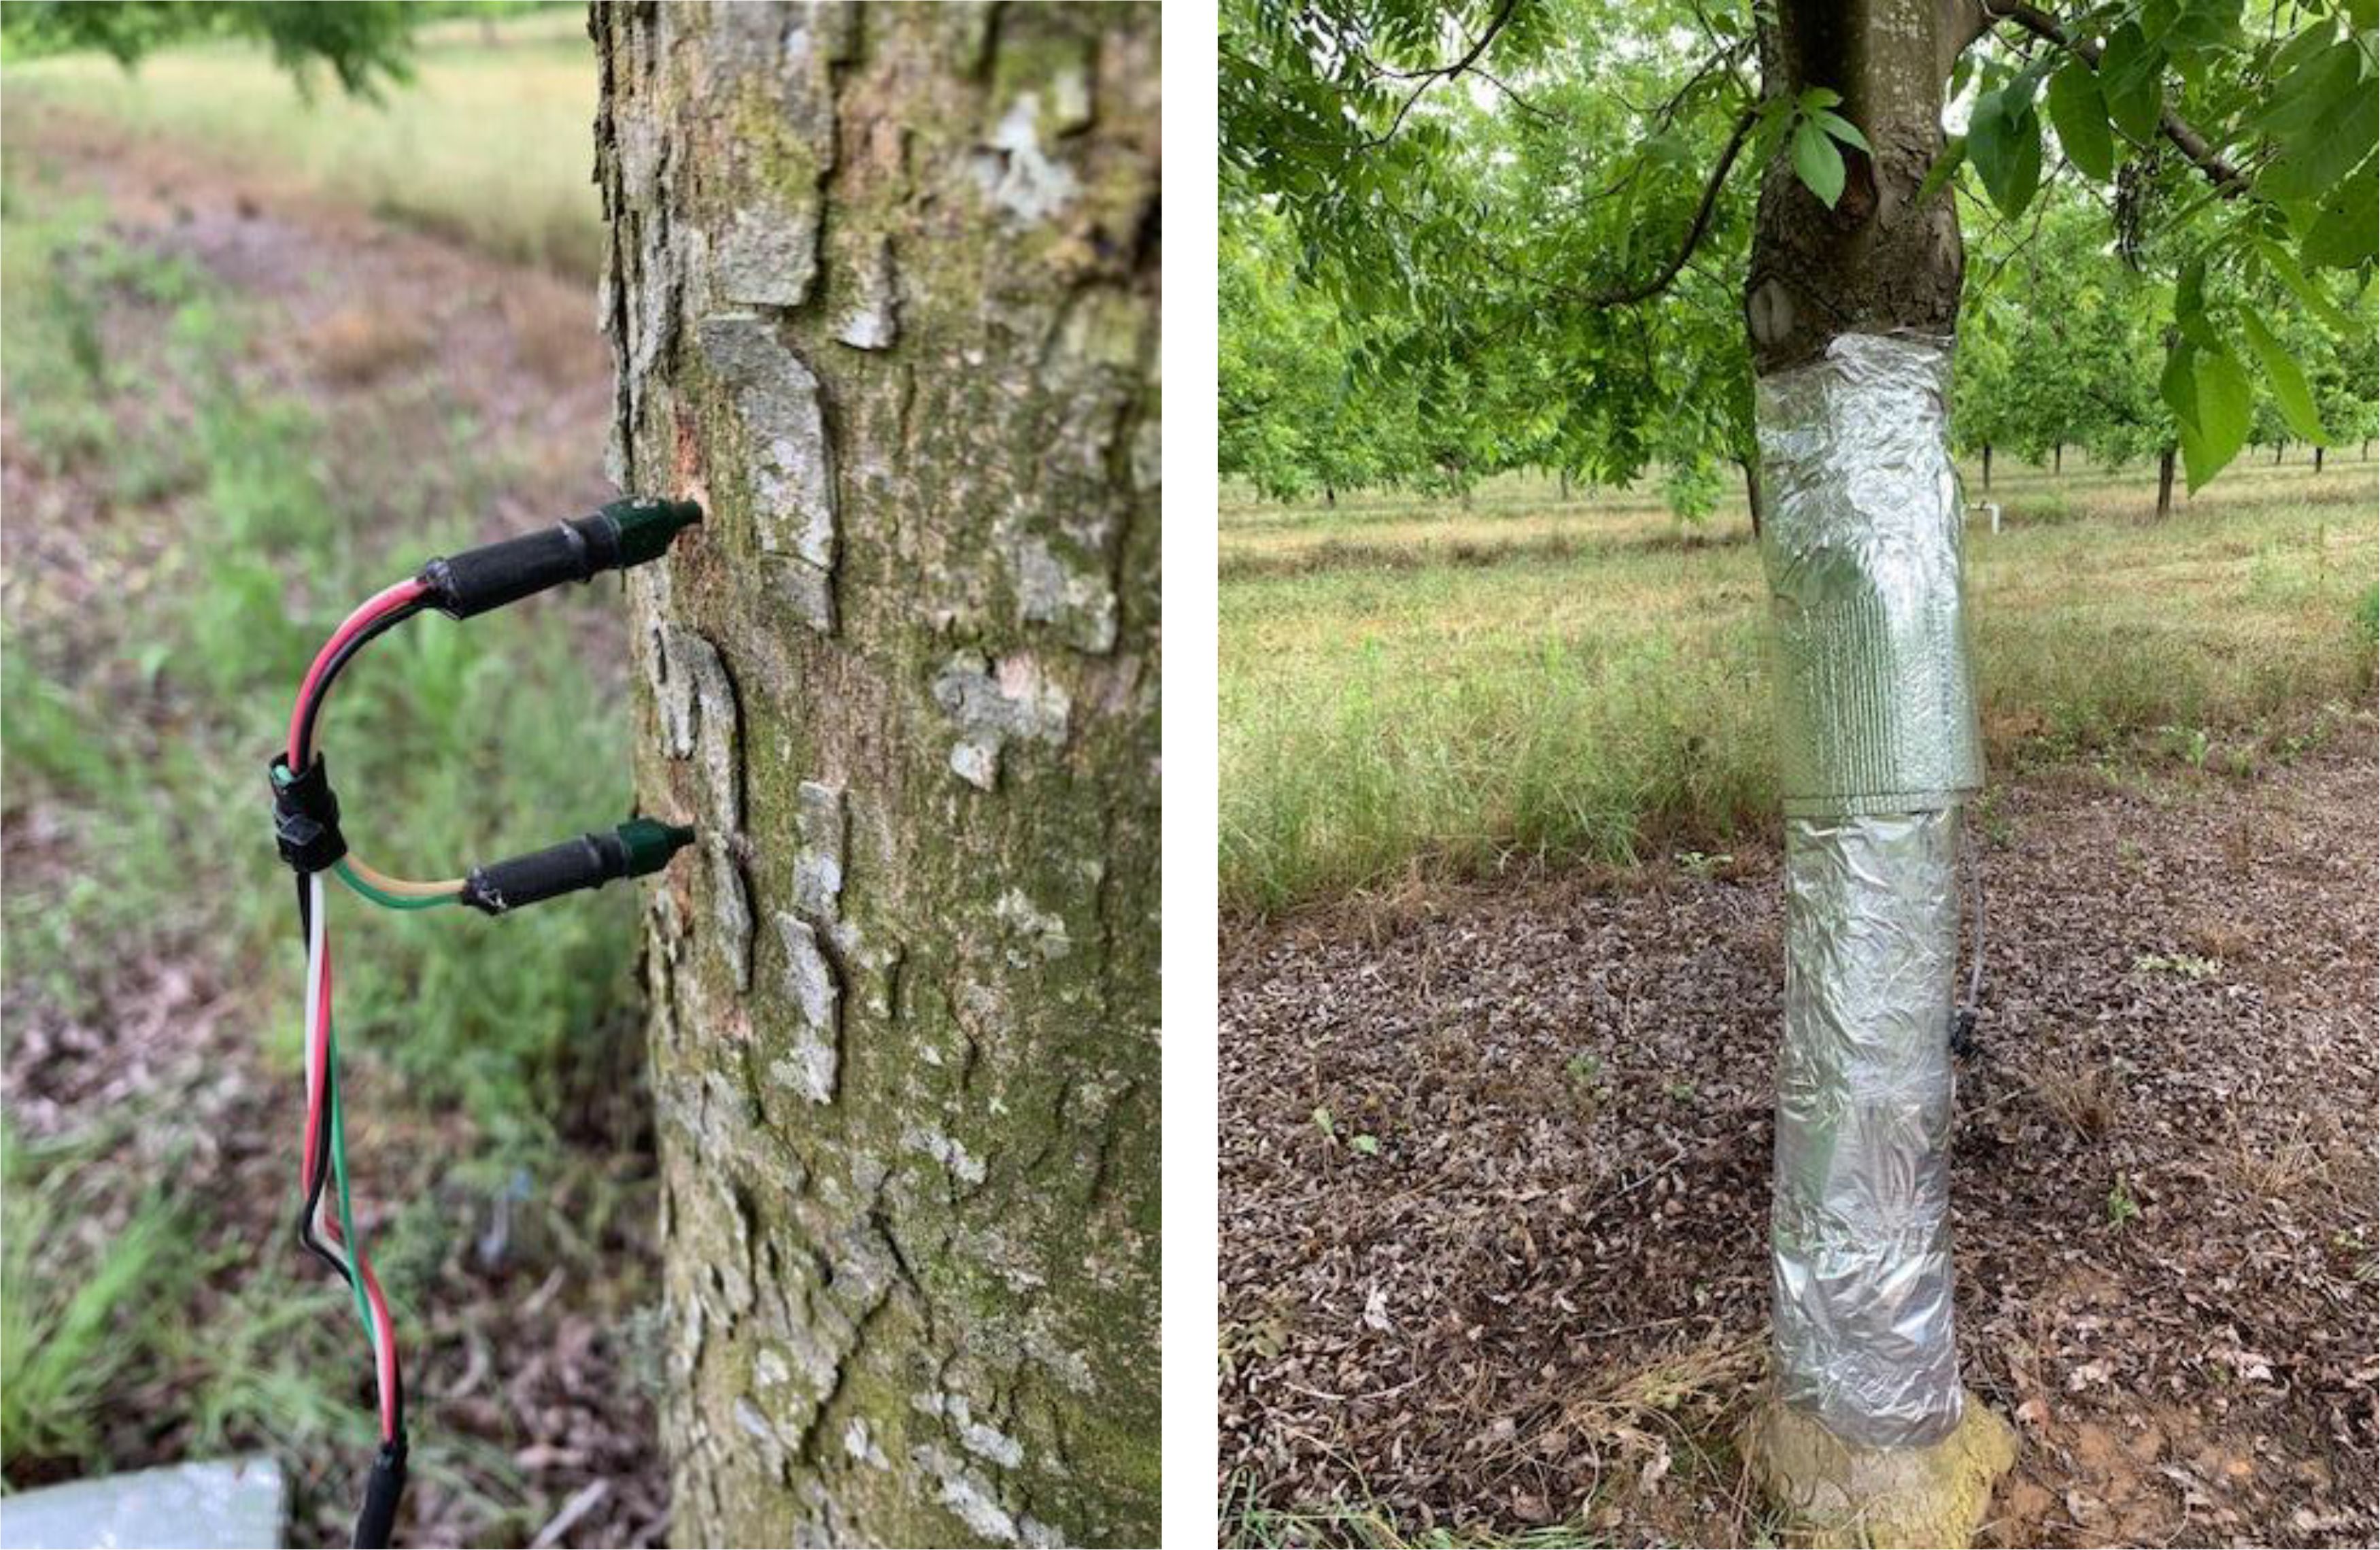
Figure 1. Installation of Dynamax TDP-30 sap flow sensor: (Left) two probes of the sensor radially inserted 30 mm into the sapwood of the trunk, with the two probes being 4 cm vertically apart between them; (Right) the sensor wrapped with foam and the trunk below the sensor shielded with aluminum foil.
Weather conditions were measured above the pecan canopy with sensors mounted on a tower. Air temperature and humidity were measured using a weather transmitter (WXT510, Vaisala, Helsinki, Finland). The data was also used to calculate vapor pressure deficit. Solar radiation was measured using a pyranometer (SP-510-SS, Apogee, Logan, UT, USA). The measurements were controlled, and the 30-min average meteorological data were recorded with dataloggers (CR1000, Campbell Scientific Inc., Logan, UT, USA).
2.3 Method to quantify the hysteresis of sap flow to VPD
The hysteresis strength in pecan sap flow density versus vapor pressure deficit was quantified in this study following the method proposed by Langlois et al. (2005) and used by Xu et al. (2022). The hysteresis index (hindex) was used to reflect the size of the hysteric loop or the hysteresis strength. The hysteretic loop of a dependent variable versus an independent variable is split into a rising limb (r) and a falling limb (f). hindex is defined as the ratio of the area under the rising limb to the area under the falling limb, i.e.
where (1) hindex≈1 means that the falling limb is almost overlapping the rising limb, indicating a weak hysteresis. (2) The magnitude of hindex being more different from 1 (either larger or smaller than 1) means that the falling limb is further away from the rising limb, indicating larger hysteresis strength, or larger difference between morning and afternoon dependent variable values at the same dependent variable values. (3) hindex<1 indicates an anticlockwise hysteresis, i.e., afternoon values of the dependent variable are larger than morning values at any given value of the independent variable. (4) hindex>1 indicates a clockwise hysteresis, i.e., afternoon values of the dependent variable are less than morning values at any given value of the independent variable.
Sap flow data measured on the north side of tree trunks was separated into five groups according to the growth stages (Table 1) in order to present the seasonal variation of sap flow density and its hysteresis strength in 2022 and 2023. Table 1 describes the five growth stages in leaf and fruit development for Desirable pecan grown in southern Georgia, USA based on Sparks et al. (2009) and Wells (2017). For each group of data, the averaged sub-diurnal 30-min time series of sap flow density was plotted against the corresponding averaged VPD, and hysteresis index was calculated. The index reflects the degree in the sap flow density in the afternoon differing from that in the morning at the same VPD.
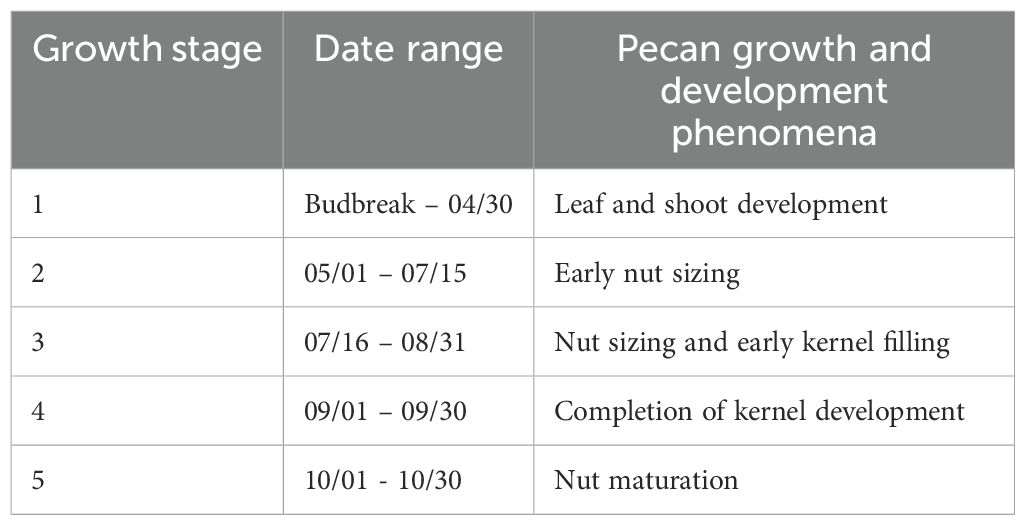
Table 1. Growth stages in leaf and fruit development for Desirable pecan grown in southern Georgia, USA based on Sparks et al. (2009) and Wells (2017).
3 Results
3.1 Diurnal and seasonal variations of the sap flow density
The average diurnal variation of sap flow density measured on the north side of tree trunks during various growth stages in the 2022 and 2023 is compared in Figure 2. The sap flow density presents a similar pattern of diurnal variation throughout both growing seasons. The sap flow density increases around sunrise and accelerates early in the morning. It is noted that the sap flow density in 2022 reached a maximum late in the morning and decreased gradually from late morning to early afternoon. In 2023, sap flow density often peaked early in the afternoon. The sap flow density decreased quickly from late afternoon (16:30-18:00 EST) through early evening (around 20:00).

Figure 2. Comparison of the average diurnal variation of pecan sap flow density measured on the north side of tree trunks at different growth stages in (A) 2022 and (B) 2023.
Figure 2 also reflects the seasonal variation of pecan sap flow density. The sap flow density was lowest during growth stage 1, a period spanning bud break to leaf and shoot development and expansion (Table 1) with the average daily maximum of less than 7 cm/hour. Sap flow increased quickly following leaf expansion, and the daily maximum reached about 17-18 cm hr-1 during growth stage 2, a period of May 1 to July 15 as fruit began to size. During growth stage 3, i.e., from July 16 through the end of August as fruit reached maximum size and kernel filling began, the sap flow density was similar to that of stage 2. During both stage 4 (completion of kernel development) in September and stage 5 (nut maturation) in October, the sap flow density was lower than that observed during nut sizing and early kernel filling.
3.2 Influence of environmental factors on the daily variation in sap flow density
The hysteresis response of the averaged pecan sap flow density measured on the north side of the trunk to solar radiation, air temperature, and vapor pressure deficit is depicted in Figures 3, 4 during different growth stages in 2022 and 2023, respectively.

Figure 3. Hysteresis response of the averaged pecan sap flow density measured on the north side of trunk during different growth stages in 2022 to (A) solar radiation, (B) air temperature, and (C) vapor pressure deficit, and the illustrated plots of the hysteresis loops with (A1) solar radiation, (B1) air temperature, and (C1) vapor pressure deficit with time of day shown on the loops during growth stage 2 with early nut sizing in 2022.
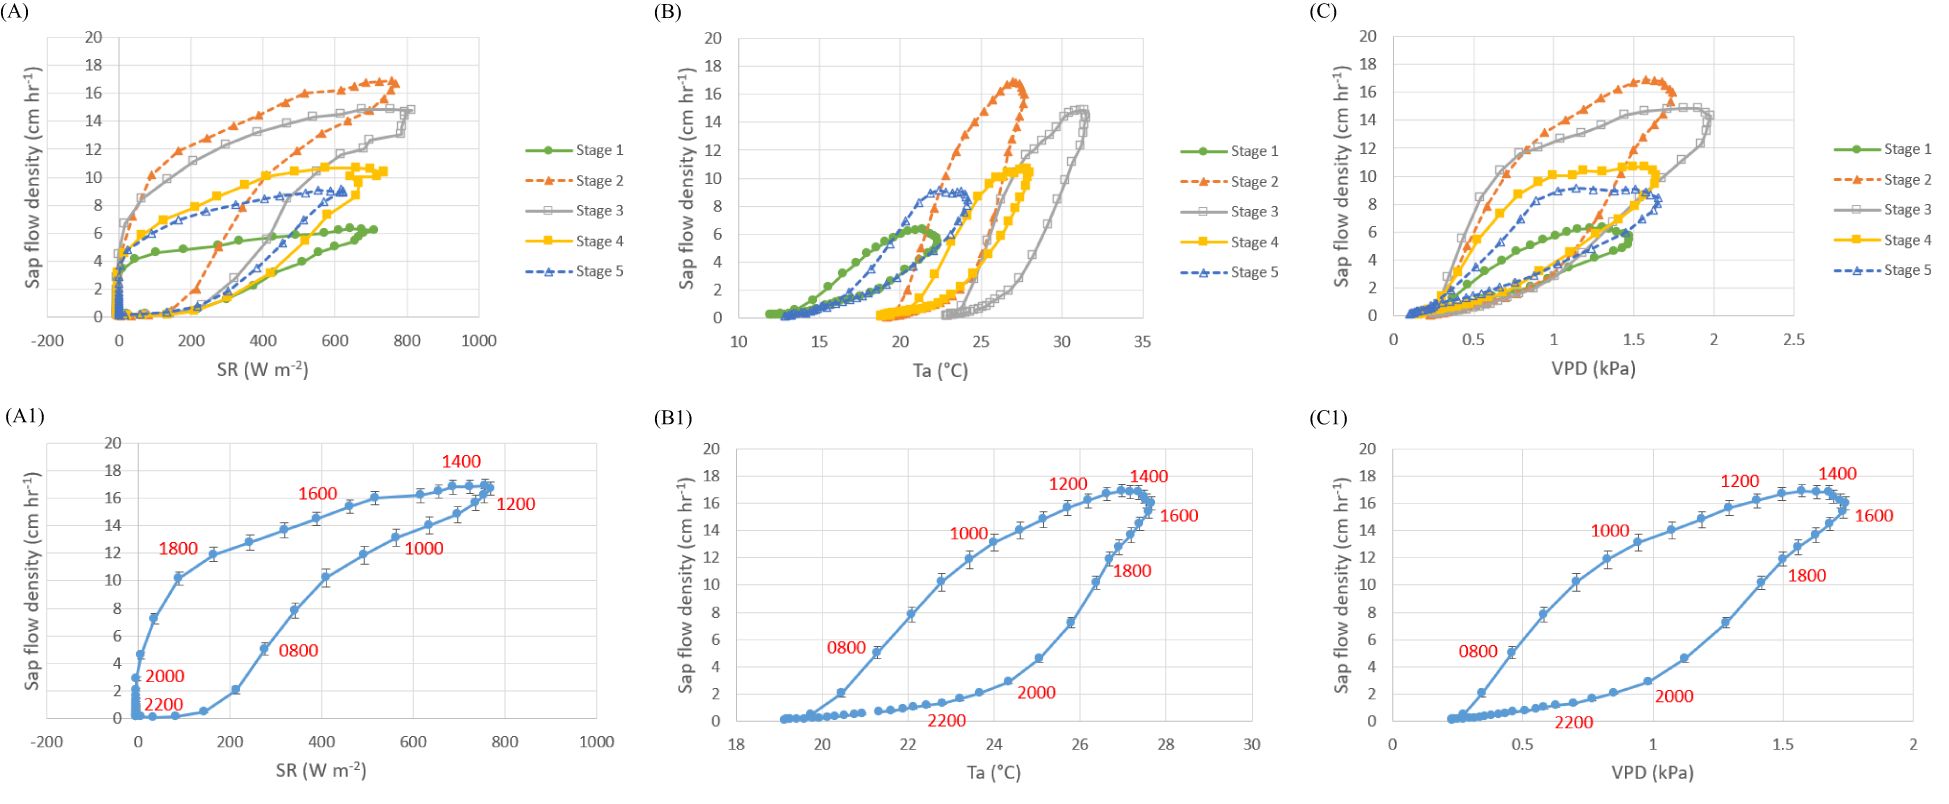
Figure 4. Hysteresis response of the averaged pecan sap flow density measured on the north side of trunk during different growth stages in 2022 to (A) solar radiation, (B) air temperature, and (C) vapor pressure deficit, and the illustrated plots of the hysteresis loops with (A1) solar radiation, (B1) air temperature, and (C1) vapor pressure deficit with time of day shown on the loops during growth stage 2 with early nut sizing in 2023.
Different patterns of the hysteresis response of pecan sap flow density to environmental factors were observed throughout the pecan growing season. Twin loops were observed in the hysteresis with solar radiation during growth stages 1, 2, and 3 in 2022 (Figure 3A). The hysteresis with solar radiation during the growth stage 2 is plotted in Figure 3A1 with time sequence shown. The twin loops contain one clockwise loop from 9:00 to 16:30 and another counterclockwise loop before 9:00 and after 16:30.
However, the twin loops were not observed in the hysteresis of sap flow density with solar radiation in 2023 (Figure 4A). Instead, single counterclockwise loops were observed during different growth stages in that year. As an example, the hysteresis of sap flow density with solar radiation during growth stage 2 in 2023 is plotted in Figure 4A1. Unlike 2022 when the sap flow density decreased around noon (Figure 3A1), the sap flow continued to increase through noon and reached a maximum value around 13:00 in 2023 (Figure 4A1). The sap flow density in the afternoon was always larger than that of the morning with the same solar radiation, forming a single counterclockwise loop. The reason for the difference between 2023 and 2022 is discussed in Section 4.
The hysteresis response of sap flow density to air temperature and vapor pressure deficit is observed in a single clockwise loop in both years (Figures 3B, C, 4B, C). The sap flow density increased as both air temperature and vapor pressure deficit increased in the morning, reached the peak during noon – early afternoon (about 14:00) and decreased linearly as both air temperature and vapor pressure deficit decreased late in the afternoon (after 16:00), forming a single clockwise hysteresis loop (Figures 3B1, C1, 4B1, C1).
3.3 Hysteretic strength of sub-diurnal sap flow density against VPD
Figure 5 illustrates the rising limb and falling limb of the sub-diurnal hysteresis of sap flow density against vapor pressure deficit during growth stage 3 in 2022. The corresponding time is from 8:00 to 15:00 for the rising limb and 15:00 to 22:00 for the falling limb. The regression analyses of sap flow density and VPD for the rising limb and the falling limb are shown in Figure 5. Following the equation 1, the hysteresis index hindex is the ratio of the area under the rising limb to that under the falling limb and equals to 1.62.
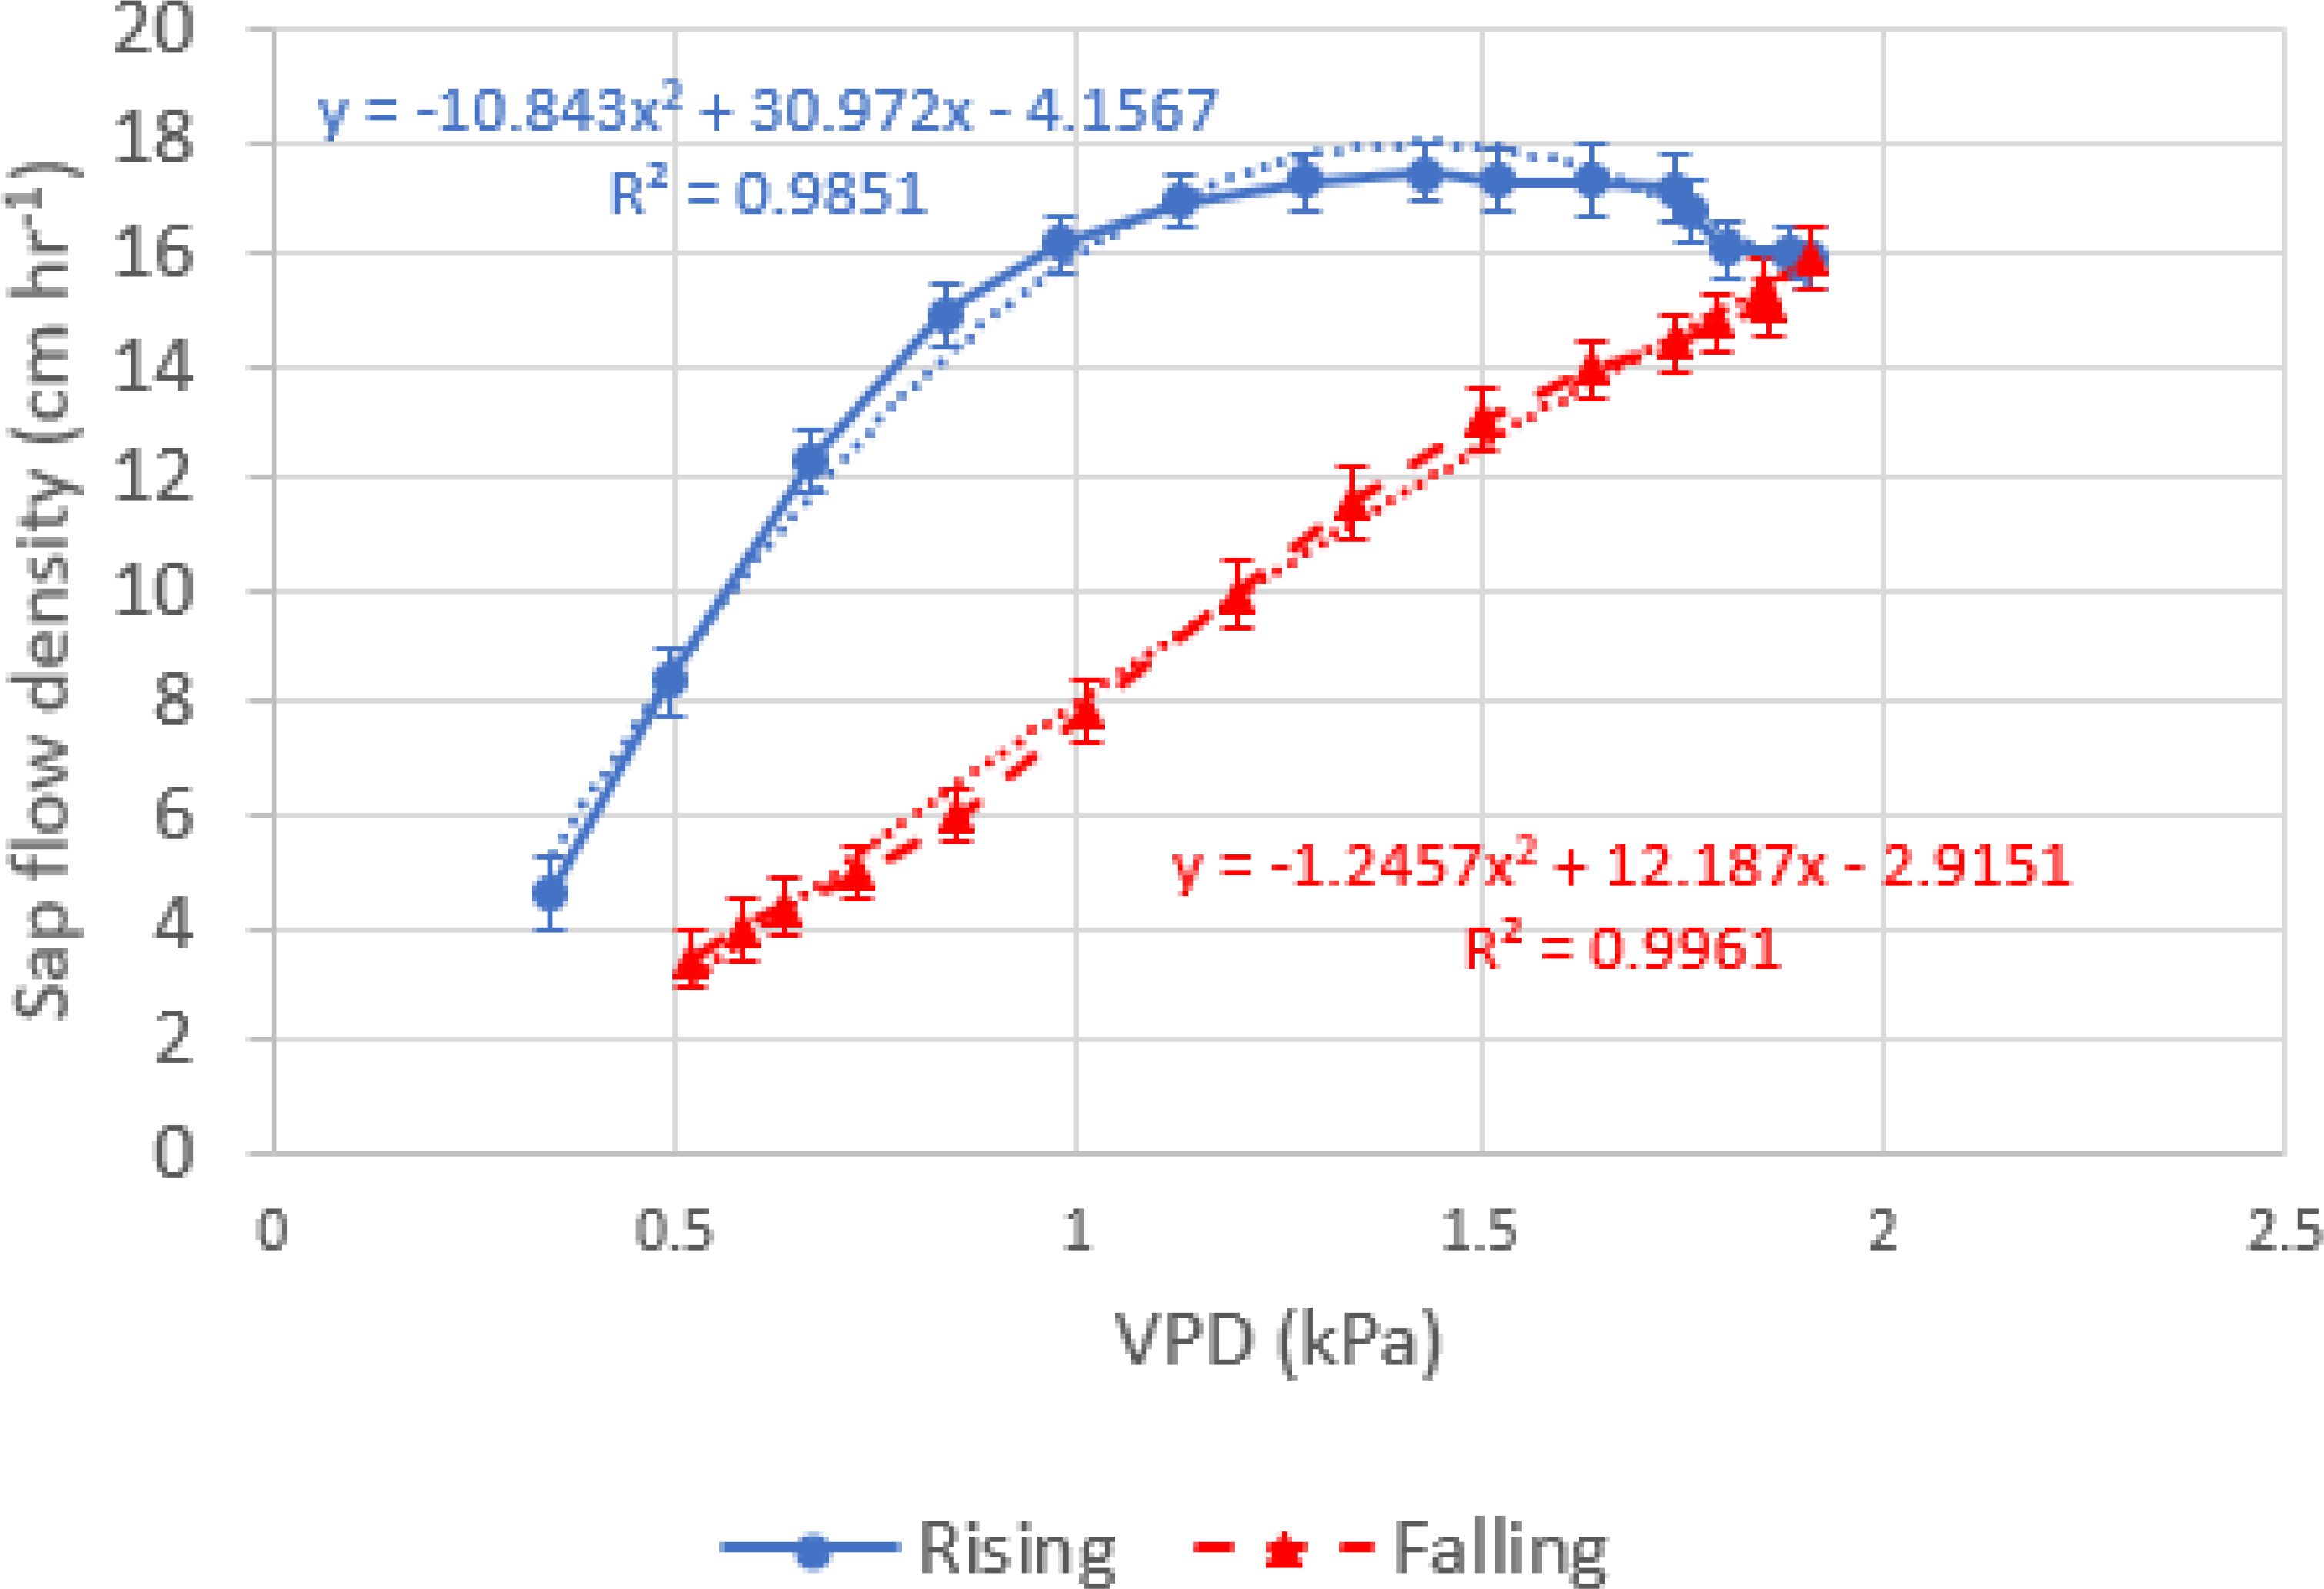
Figure 5. Illustration of the rising limb and falling limb of the sub-diurnal hysteresis of sap flow density against vapor pressure deficit in the period of the growth stage 3 with nut sizing and early kernel filling in 2022.
The same procedures were applied to each growth stage in 2022 and 2023 and the hindex for each stage was plotted in Figure 6. During the different growth stages in both 2022 and 2023, the peak VPD for rising limb turning to falling limb usually occurred at 15:30. This is later than that for sap flow density (Figure 2). The hindex values throughout the growing season are greater than 1.0, suggesting that a sub-diurnal course of sap flow density versus VPD generally presents a clockwise hysteresis, or a sap flow density in the afternoon that is smaller than that in the morning under the same VPD conditions. The hindex values vary in the range of 1.62-2.26 in 2022 and 1.69-2.39 in 2023, respectively.
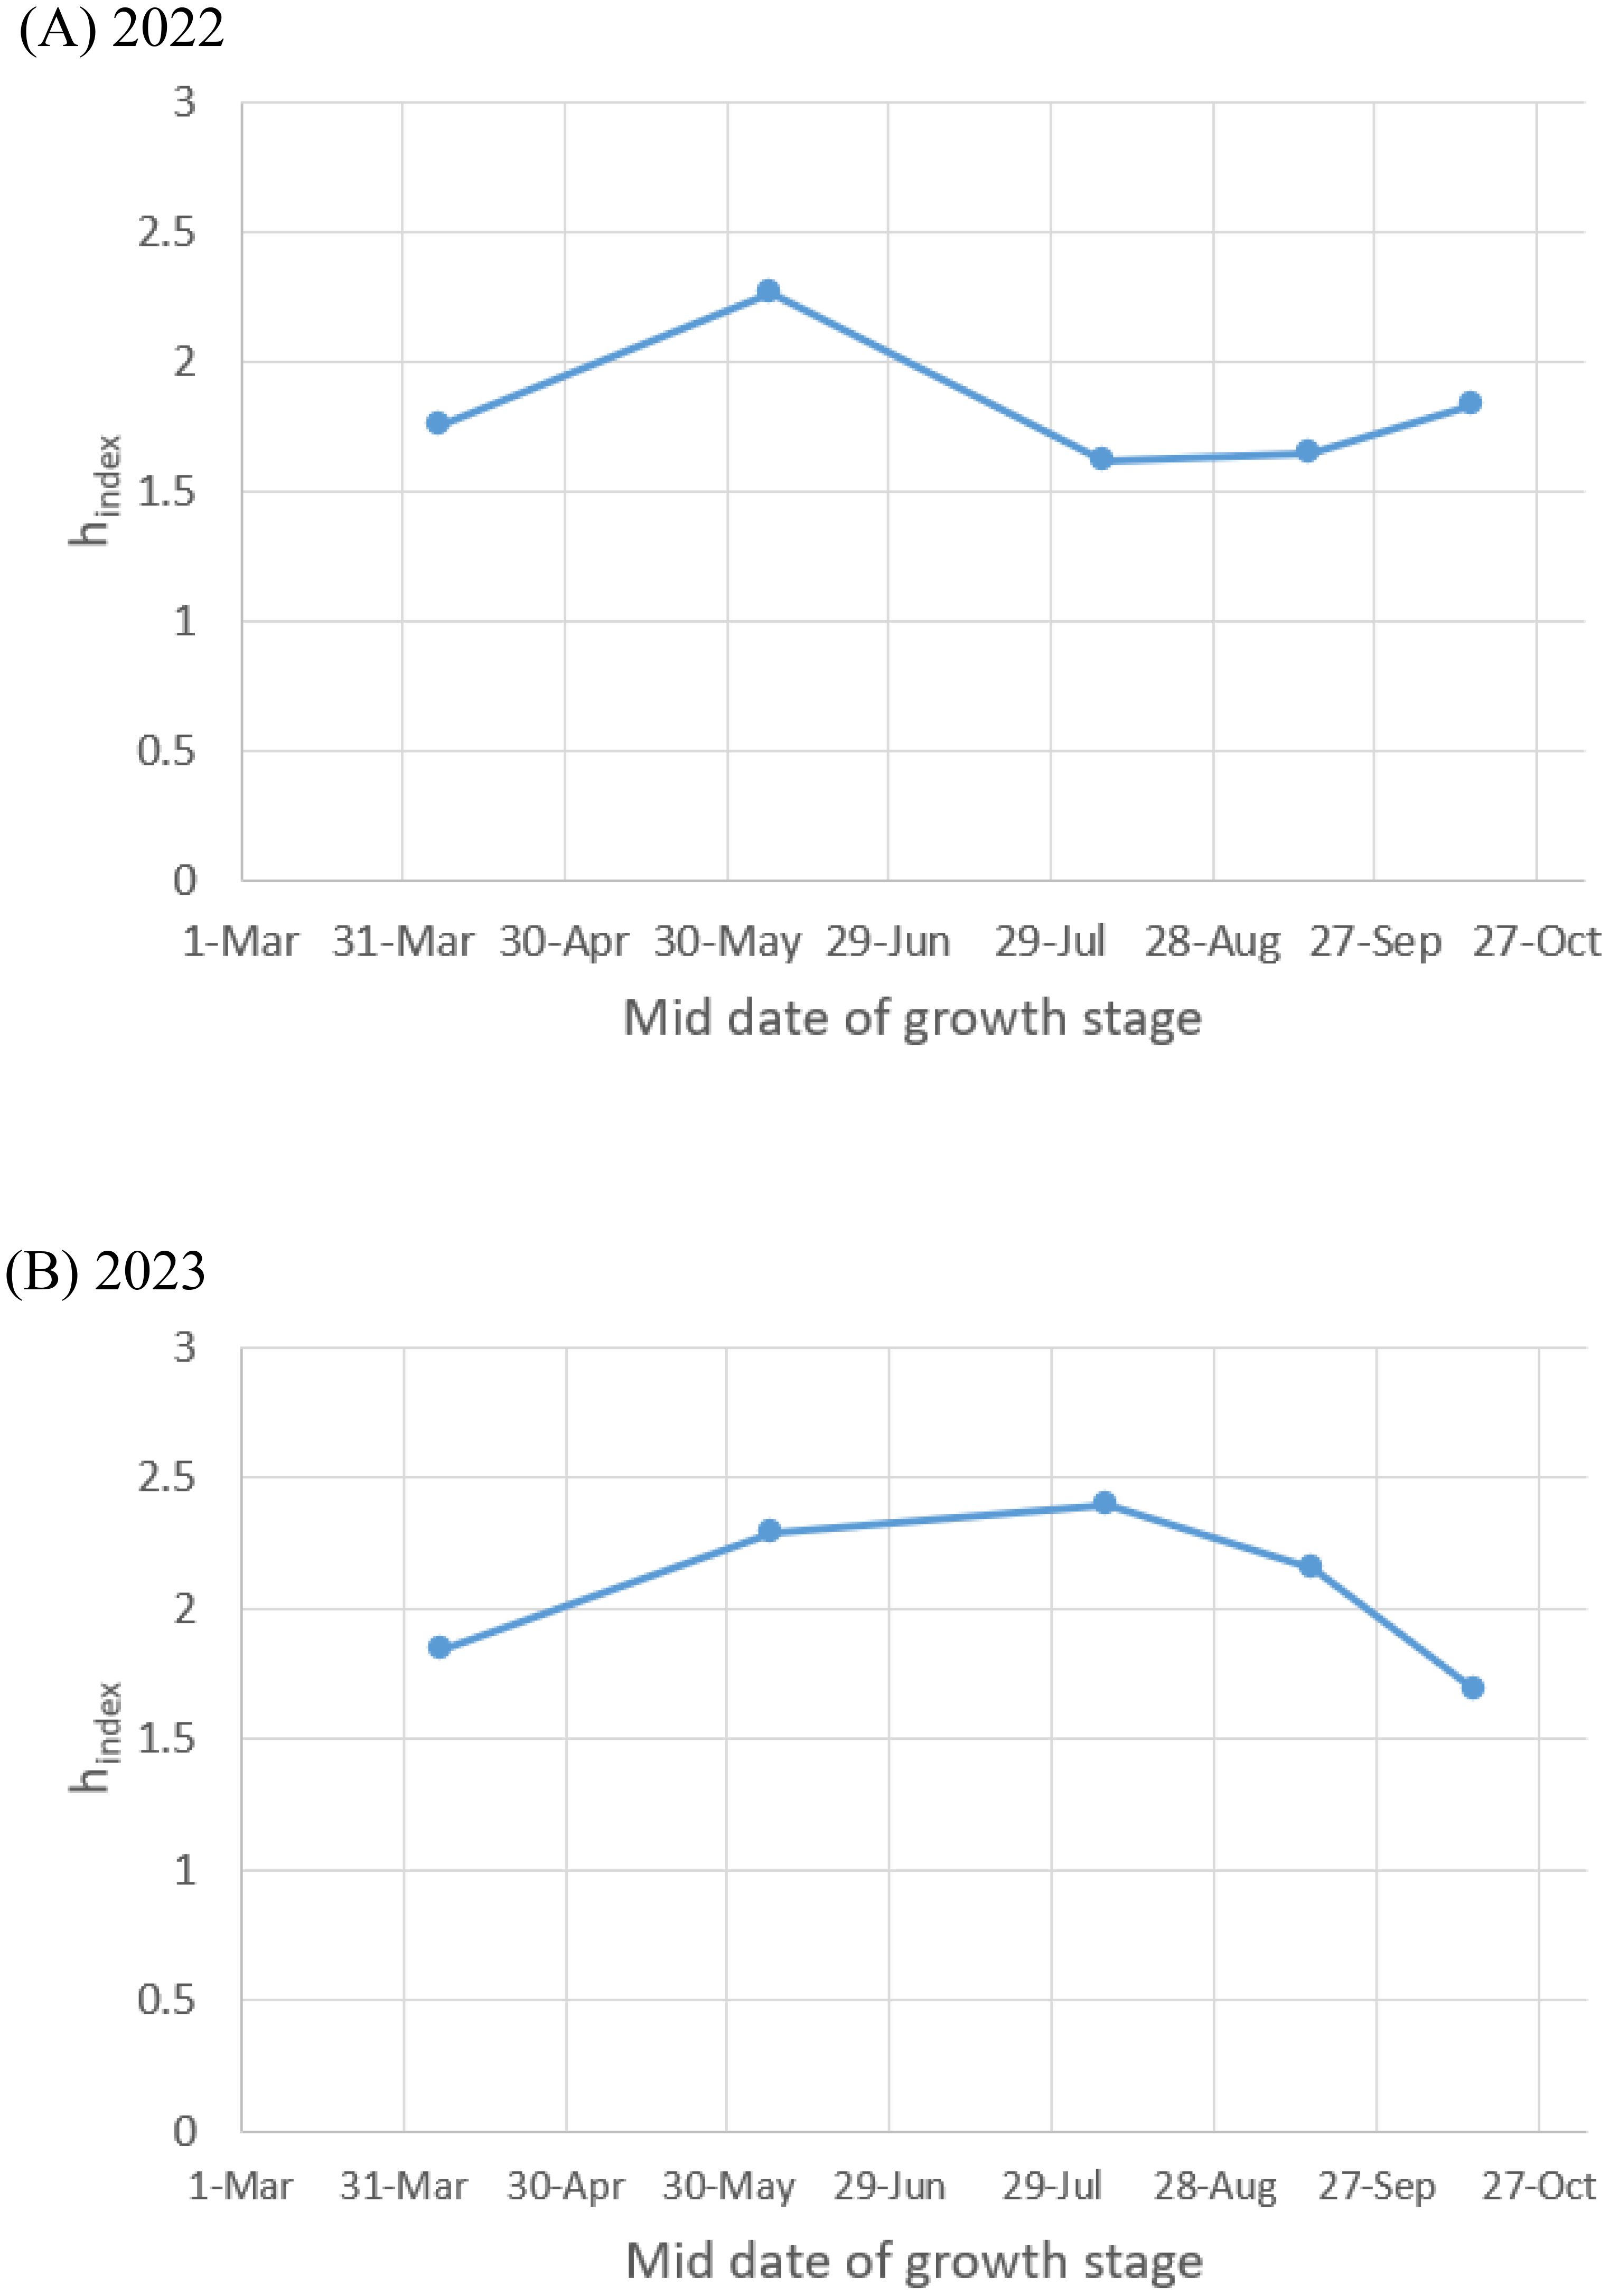
Figure 6. Seasonal variation of hysteresis strength of sub-diurnal sap flow density against VPD in (A) 2022 and (B) 2023.
4 Discussion
4.1 Diurnal and seasonal variations in sap flow density
The diurnal variation in sap flow density presented a similar pattern throughout all stages within the growing season, with the maximum sap flow occurring late in the morning in 2022 but early afternoon in 2023. Sorensen et al. (1999) examined the behavior of sap flow velocity in pecan trees of a commercial orchard of 15-20 yr old near Las Cruces, New Mexico. Similar to the present study, their maximum sap velocity occurred at about 11:00 in 1994 and at about 15:00 in 1995. Steinberg et al. (1990) reported that the sap flow density measured on a five-year-old pecan trunk at an outdoor weighing lysimeter facility in Stephenville, Texas, presented a maximum at around 15:00. Sakuratani et al. (1997) measured sap flow on a 10-yr old apple tree during a three-day period of Nov. 22-24 in 1995 in New Zealand and the trunk’s sap flow presented a maximum at noon or early in the afternoon, later than the maximum of solar radiation. The current study is also in general agreement with findings of the average sap flow density in forests in China by Liu et al. (2017) in that their sap flow density peak occurred at noon or in the afternoon, changing with forest species.
The difference in the time for the diurnal peak of sap flow density to occur between 2022 and 2023 is attributed largely to the difference in meteorological conditions during those times that trigger plant self-protection through stomatal control. Looking into growth stage 2, though solar radiation in 2022 was similar to that in 2023 (Figure 7A), air temperature and VPD were much higher than those in 2023. The 2022 air temperature and VPD in the morning even exceeded the 2023 maxima (Figures 7B, C). This likely triggered partial stomatal closure earlier. In turn, this partial closure led to earlier sap flow peak as stomatal closure reduces sap flow. During growth stage 3 in the morning, while both solar radiation and air temperature in 2022 were like those in 2023, the VPD in the morning in 2022 was larger than that in 2023. It makes sap flow increase faster reaching its maximum in the morning in 2022 than in 2023 (Figure 8). During other growth stages, VPD in the morning in 2022 was also larger than 2023 (data not shown). It seems the larger VPD in the morning was the main driving factor for sap flow to reach its maximum late in the morning in 2022.
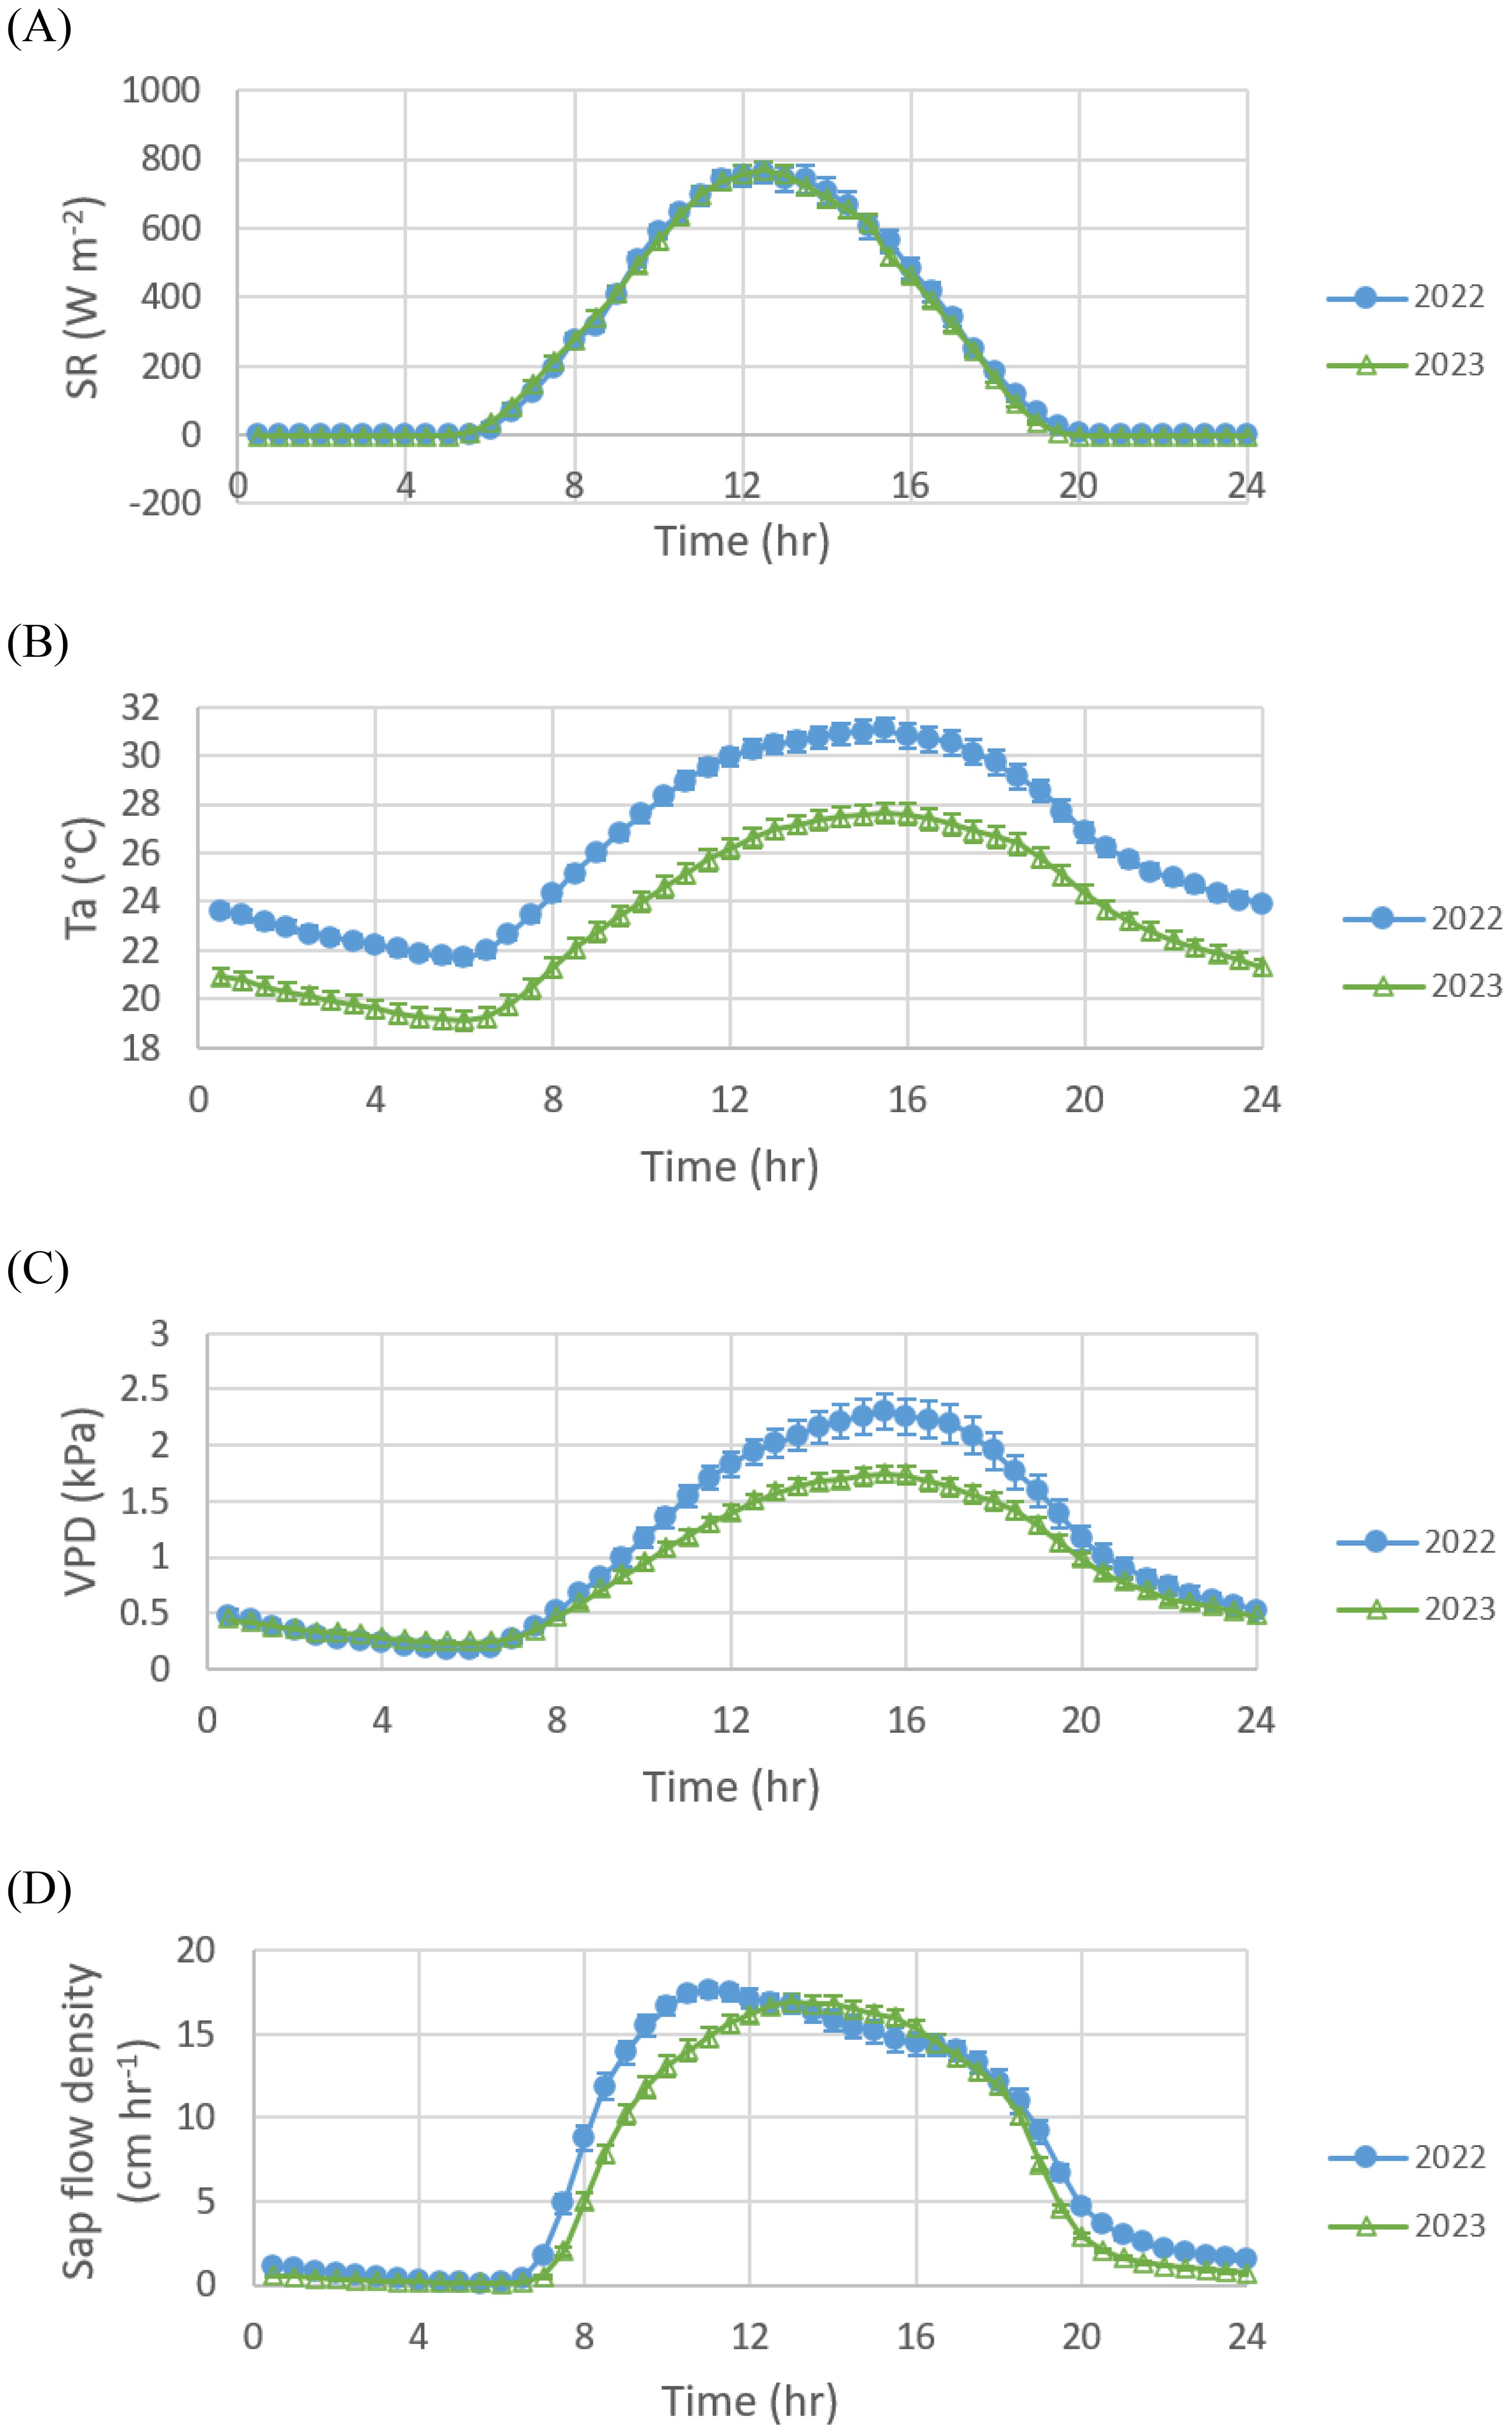
Figure 7. Asynchronous diurnal variations of (A) solar radiation, (B) air temperature, (C) vapor pressure deficit, and (D) sap flow density during the growth stage 2 with early nut sizing in 2022 (blue solid circle) and in 2023 (green empty triangle).

Figure 8. Asynchronous diurnal variations of (A) solar radiation, (B) air temperature, (C) vapor pressure deficit, and (D) sap flow density during the growth stage 3 with nut sizing and early kernel filling in 2022 (blue solid circle) and in 2023 (green empty triangle).
As to the seasonal variation, the maximum average sap flow in the current study occurred during growth stage 2 (early pecan sizing in May-July) in both 2022 and 2023, reaching about 17-18 cm hr-1 (Figure 2). That sap flow is considerably lower than the sap flow with a maximum of about 30 cm hr-1 during January – February (Summer) for a stand of native trees in Australia (Zeppel et al., 2004). The latter measured sap flow using four sensors installed on one tree trunk in an azimuthal interval of 90° between the sensors. Yet the peak values in the current study are considerably smaller than the sap velocity peak values of 0.16 mm s-1 or 57.6 cm hr-1 measured with 2-3 sensors per pecan tree of 15-20 years old near Las Cruces, New Mexico (Sorensen et al., 1999). In addition to the azimuthal variation in sap flow density (Kume et al., 2012; López-Bernal et al., 2010; Merlin et al., 2020; Shinohara et al., 2013), the difference may reflect the different water demand by the pecan tree in humid climates compared to semi-arid climates.
In the current two-year study, the sap flow peak in growth stages 2-5 varied in a range of 9-17 cm hr-1 (or 3810-7052 g hr-1). This is much larger than the sap flow peak of about 2400-2800 g hr-1 for poplar trees during May to September 1994 in Reading, UK (Zhang et al., 1997). On the other hand, the sap flow peak in growth stage 1 for pecan leaf and shoot development was 6-7 cm hr-1 (or 2142-2629 g hr-1) in the current study, a behavior comparable to the results by Zhang et al. (1997). The larger pecan sap flow peaks in stages 2-5 in our study than those of poplar trees likely reflects the extra water demand generated by the pecan crop load. Peak values of sap flow density measured in the current study are comparable to the sap flow density peaks of 10-40 cm hr-1 for various species of trees in Oak Ridge, TN (Wullschleger et al., 2001).
When stage-averaged, daily sap flow density in 2022 is higher than that in 2023 in all growth stages (Figure 9). While daily total solar radiation and daily average air temperature in earlier stages 1 and 2 and in late stage 5 in 2022 are higher than those in 2023, VPD in 2022 is higher than in 2023 in all growth stages except for stage 3 (Figure 9). Based on the behavior of the sap flow density during the two growing seasons, it appears that the VPD is the most important in these driving factors in controlling sap flow.
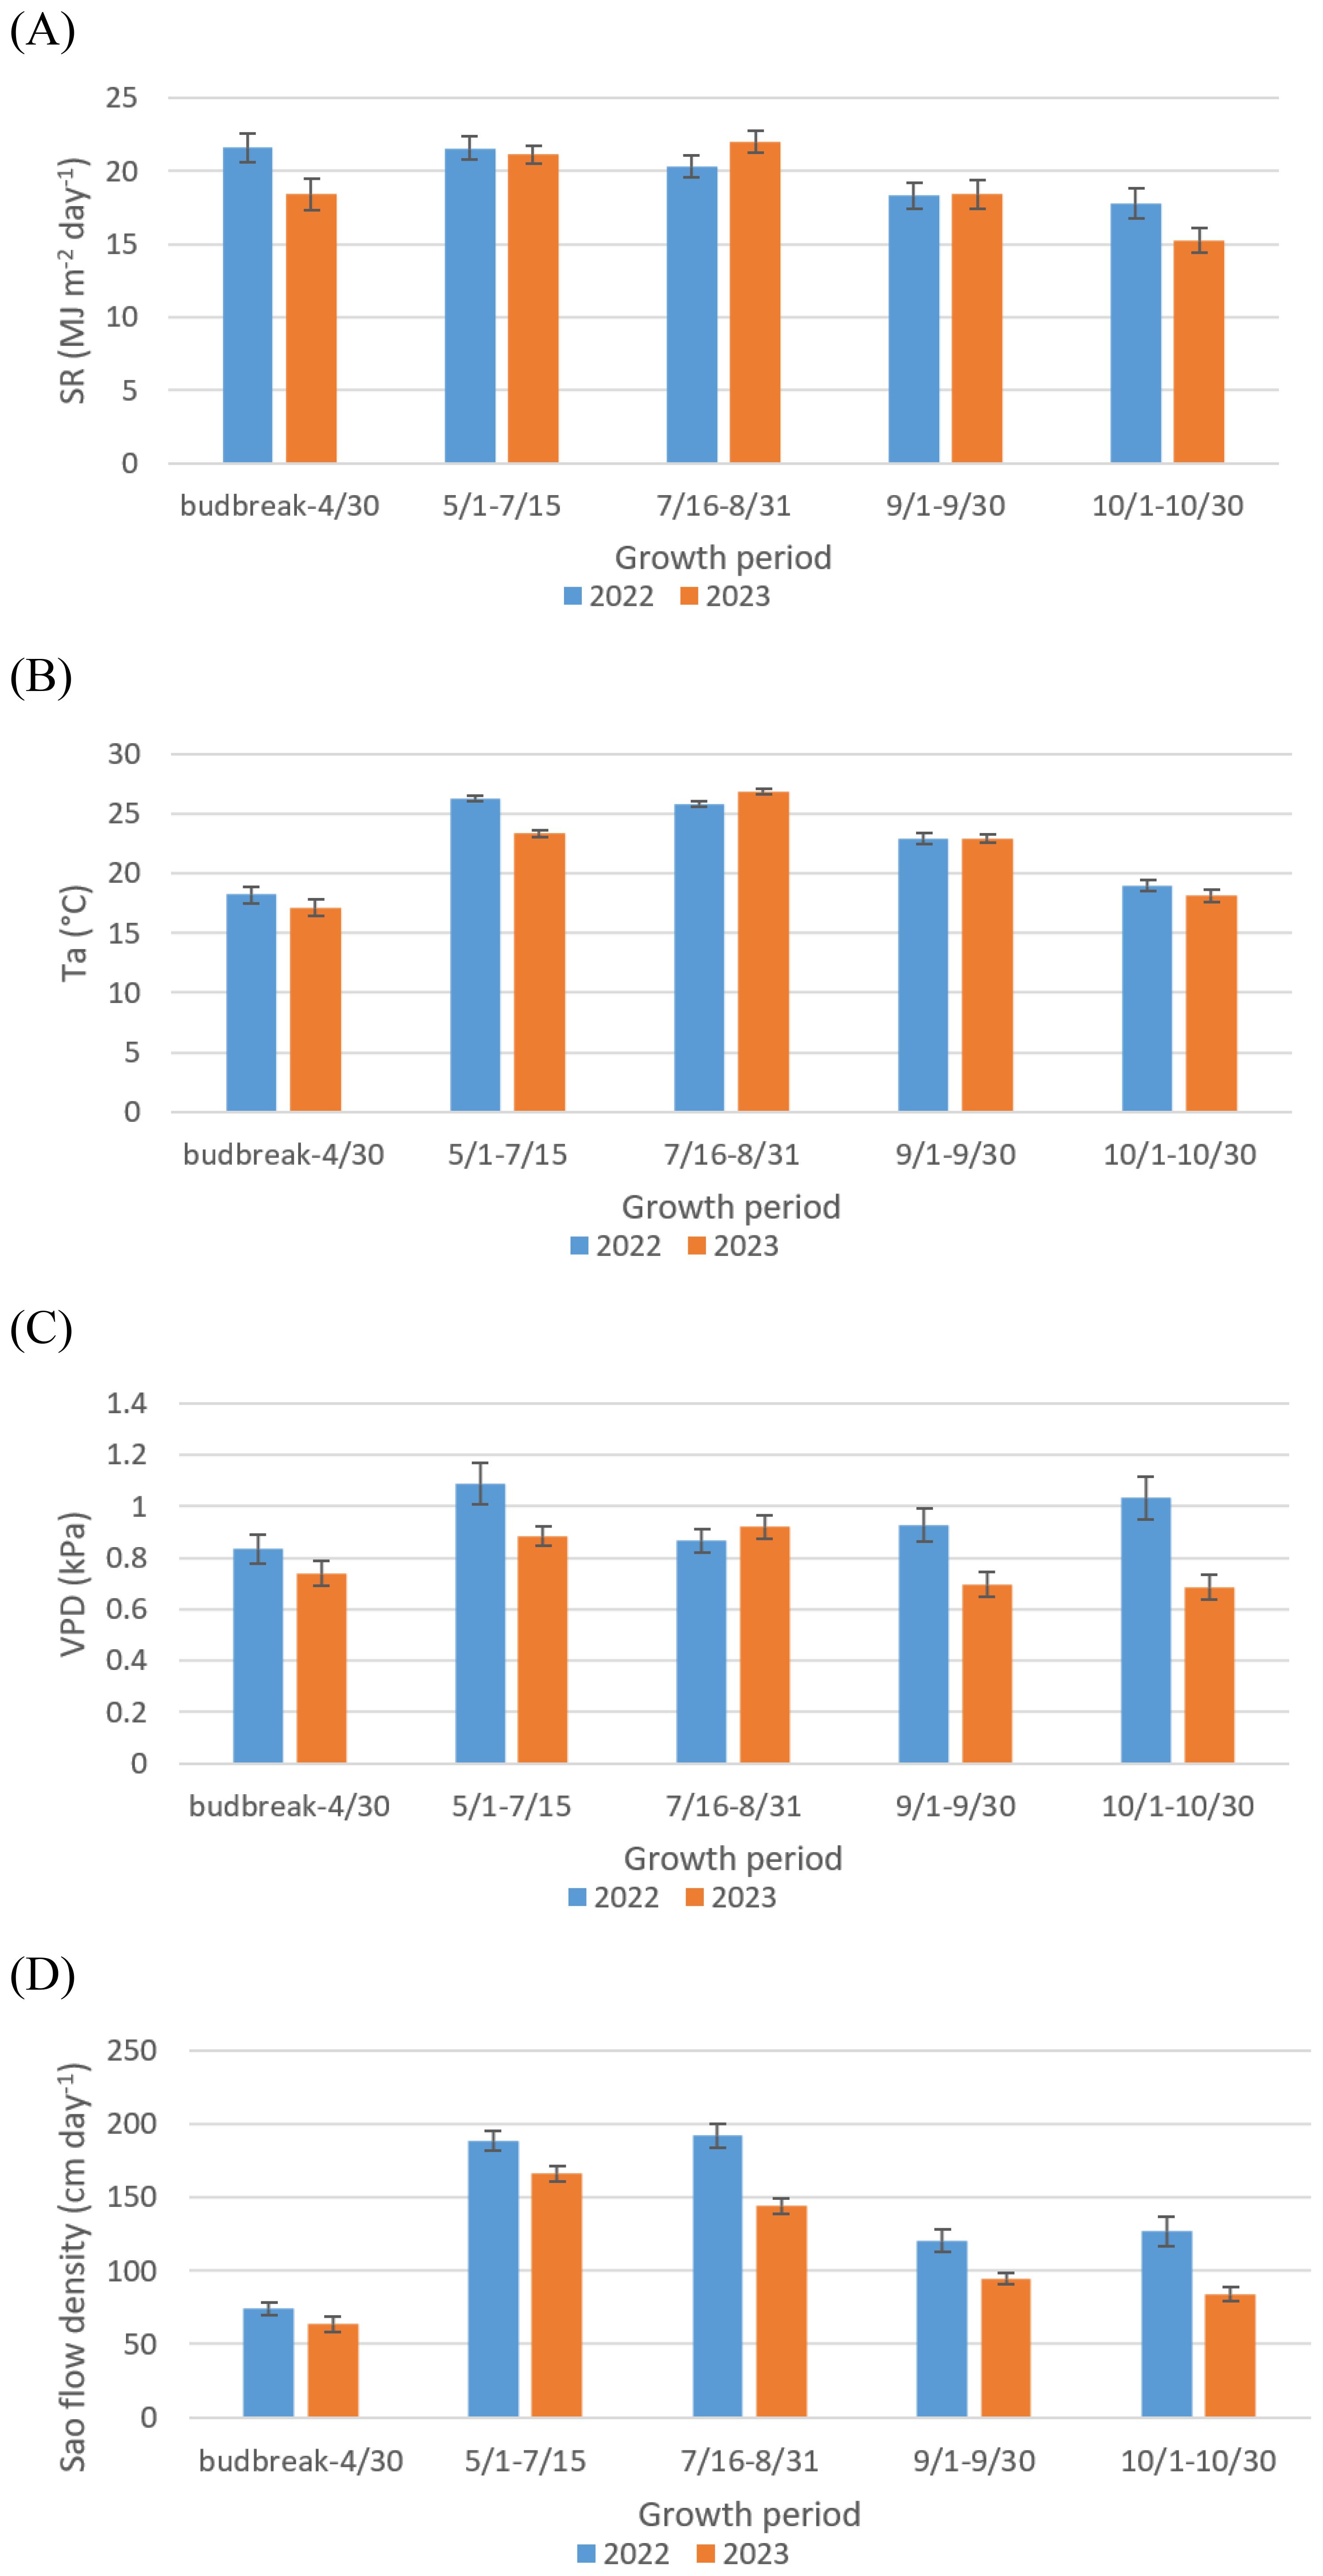
Figure 9. Comparison of stage-averaged (A) daily total solar radiation, (B) daily average air temperature, (C) daily average vapor pressure deficit, and (D) daily sap flow density along growing season in 2022 to those in 2023.
4.2 Hysteresis in the diurnal variation of sap flow density with weather conditions
In the current study, twin loops were observed in the hysteresis response of pecan sap flow density to solar radiation with a clockwise loop associated with high solar radiation and an anticlockwise loop with low solar radiation, especially during the 2022 summer months (Figure 3A), while single anticlockwise loops were observed for different stages throughout the 2023 season (Figure 4A). Single anticlockwise loops of hysteresis for sap flow varying with solar radiation were also observed in a stand of trees in Australia by Zeppel et al. (2004) and for two tree species Balsam fir and Black spruce in Canada reported by Oogathoo et al. (2020). The anticlockwise hysteresis was also reported in peanut net ecosystem CO2 exchange on clear days (Pingintha et al., 2010).
The hysteresis response of sap flow density to both air temperature and vapor pressure deficit was observed in a single clockwise loop in both 2022 (Figures 3B, C) and 2023 (Figures 4B, C) in the current study. This is because solar radiation in the morning is higher than that in the afternoon in similar air temperature or vapor pressure deficient conditions (Figures 3A1, B1, C1, 4A1, B1, C1). Zeppel et al. (2004) and Oogathoo et al. (2020) also reported clockwise hysteresis loop of sap flow with vapor pressure deficit.
The hysteresis in the current study reflects asynchrony in the diurnal variations of sap flow density and weather conditions (Xu, 2022; Xu et al., 2022; Zhang et al., 2014). As an example, for growth stage 2 with early nut sizing, the maximum of the diurnal solar radiation occurred at about 12:30 in both 2022 and 2023 while air temperature and VPD peaked at about 15:30 in both years (Figure 7). During the same period, the maximum sap flow density occurred at about 11:00 in 2022 and 13:00 in 2023, asynchronous to weather conditions. The timing of maximum sap flow density in relation to the timing of peaks in weather conditions determines the direction of the hysteresis loop.
Anticlockwise hysteresis was observed in the relationship of sap flow with solar radiation in 2023 (Figures 4A, 4A1) in the current study. This is consistent with earlier reports on the hysteresis of sap flow and solar radiation such as that found by Zeppel et al. (2004) and Oogathoo et al. (2020). In 2023, the maximum sap flow density occurred after that of solar radiation but before that of air temperature and VPD because of lower VPD in 2023 than in 2022 (Figures 7, 8). After the peak in solar radiation, the sap flow continued to increase with air temperature and VPD, reaching a maximum when any additional increase in air temperature and VPD would trigger stomatal closure. This thus leads to the anticlockwise hysteresis.
In 2022, the peaks of sap flow density occurred in the morning mainly due to high VPD as discussed above, peaking earlier than solar radiation. Once the sap flow density reached maximum, the further increase in solar radiation, air temperature, and VPD likely led to stomatal closure and reduced sap flow, creating the clockwise loop associated with higher solar radiation. The anticlockwise loop with lower solar radiation observed in 2022 (Figures 3A, 3A1), likely caused by lower temperature, VPD, and sap flow density early in the morning than later in the afternoon with the same solar radiation. Wang et al. (2019) also reported that consistent anticlockwise loops of hysteresis in sap flow to environmental factors of air temperature, VPD, and net radiation were observed in Scots pine in the Scottish Highlands. The anticlockwise loop of hysteresis was partly attributed to the environmental conditions of low net radiation with frequent summer rainfall events. In that environment, the increase in net radiation increased transpiration.
The clockwise hysteresis loops for sap flow density related to air temperature and VPD observed in both 2022 and 2023 in the current study (Figures 3, 4) are consistent with previous studies (Liu et al., 2017; Matheny et al., 2014; O’Grady et al., 2008; Oogathoo et al., 2020; Zeppel et al., 2004). The clockwise hysteresis loop is considered a mechanism for water conservation or plant self-protection through stomatal control (Wang et al., 2019; Zeppel et al., 2004). Sap flow density peaked earlier than air temperature and VPD in both 2022 and 2023 (Figure 7). This suggests that further increase in air temperature and VPD following the peak in sap flow does not lead to a larger sap flow density, presumably because the tree cannot draw water fast enough from the ground to cool the tree in the afternoon with higher temperatures than in the morning. This then triggers stomatal closure.
A hysteresis index hindex was applied to quantify the hysteretic strength of sub-diurnal sap flow density against VPD in this study. The hindex values vary in the ranges of 1.62-2.26 and 1.69-2.39 in 2022 and 2023 growth stages, respectively (Figure 6), larger than the hindex values (<1.6) for the hysteresis of the actual evapotranspiration against VPD (Xu et al., 2022). Like Xu et al. (2022), the hindex values in the current study increased with daily average VPD in both 2022 and 2023 (Figure 10). The larger hysteretic index value corresponds to the larger VPD value or drier weather conditions. It indicates that, the drier the air, the larger degree for the pecan tree sap flow late in the afternoon to be smaller than that in the morning.
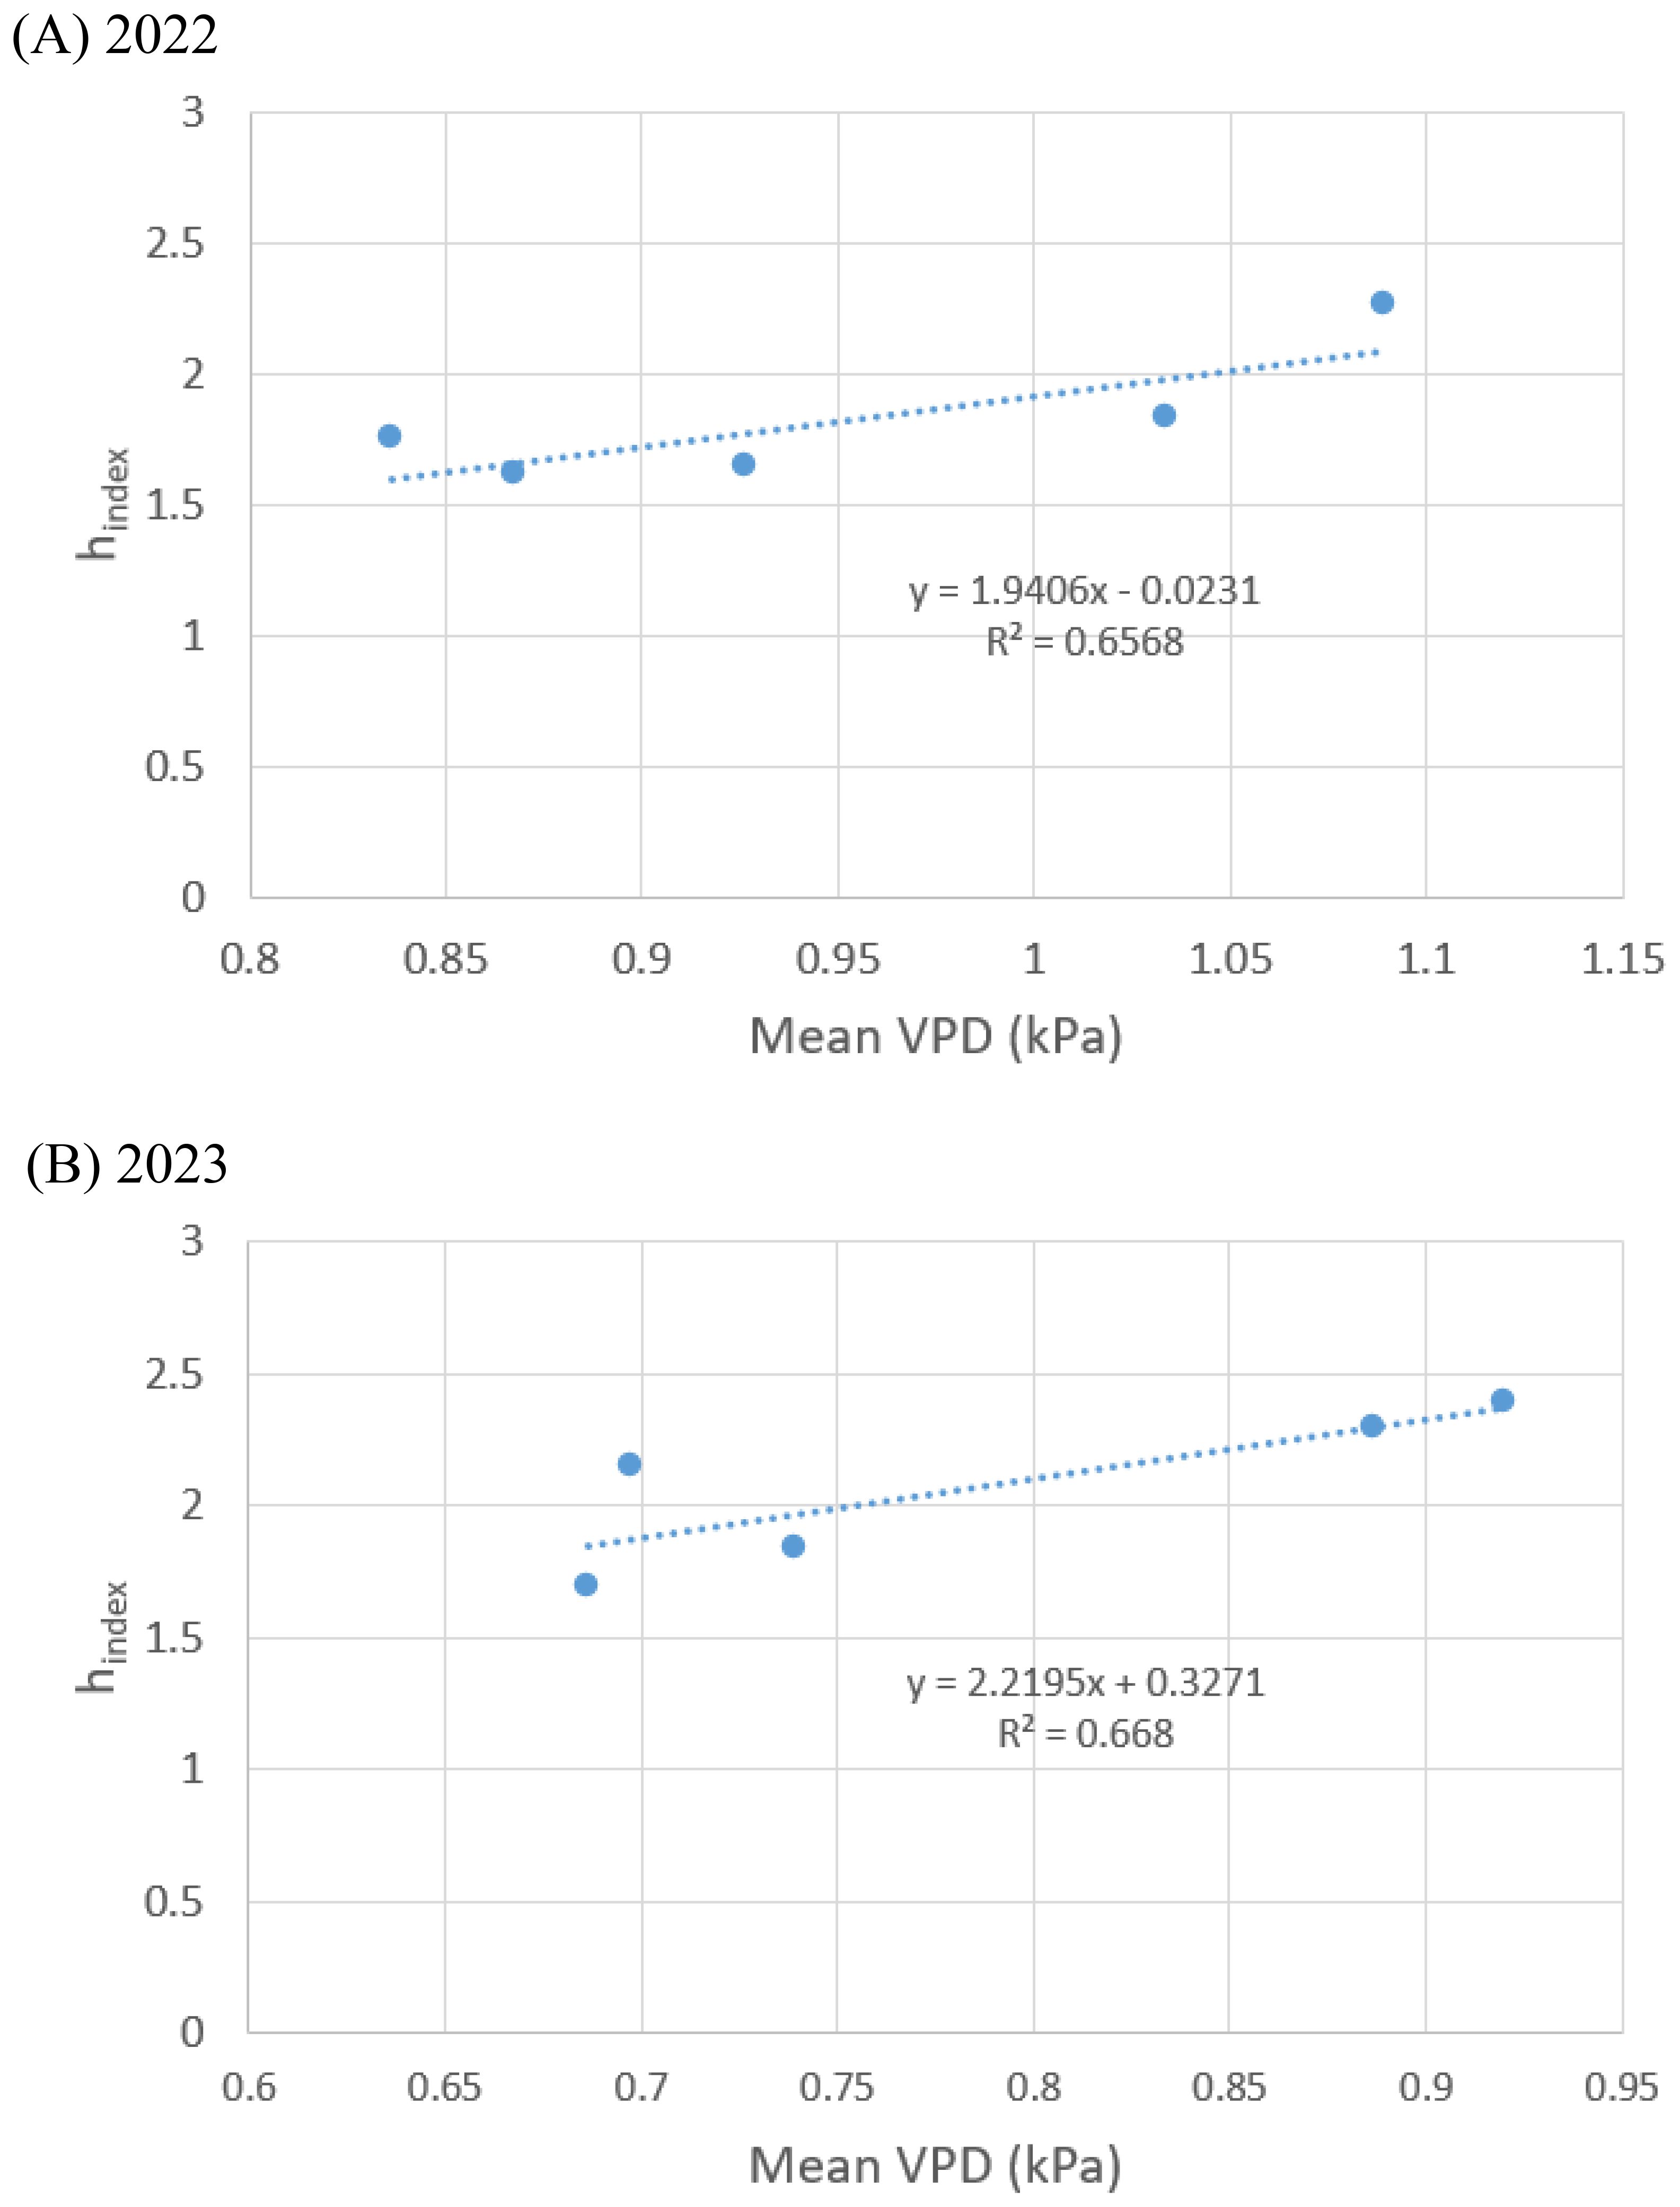
Figure 10. The influence of daily mean VPD on the hindex values for hysteresis of sap flow density against VPD in (A) 2022 and (B) 2023.
5 Conclusions
To understand the temporal variability in pecan water use in a long, hot and humid growing season, the tree sap flow was measured in a micro-irrigated orchard south-central GA, USA in 2022 and 2023. Its diurnal and seasonal responses to environmental factors were analyzed.
In general, sap flow increases quickly in the morning, reaches a maximum late in the morning (2022) or early afternoon (2023), to later decrease late in the afternoon and early evening. The peak in sap flow density occurred before (in 2022) and after the peak (in 2023) in solar radiation. This behavior may be attributed to a much higher morning vapor pressure deficit in 2022 than 2023. The peak in sap flow density occurred earlier than the air temperature and vapor pressure deficit peaks in both years.
The largest sap flow densities occurred during growth stage 2 with early nut sizing and growth stage 3 with nut sizing and early kernel filling in both years, likely reflecting the extra water demand generated by crop load for pecan. The lowest sap flow densities were presented in growth stage 1 from bud break to leaf and shoot development and expansion in early spring. The sap flow density in 2022 was higher than that in 2023 mainly due to higher vapor pressure deficit in 2022.
A twin loop of hysteresis was observed in the response of sap flow to solar radiation due to much higher morning vapor pressure deficit in 2022, with anticlockwise loop associated with low solar radiation and clockwise loop associated with high solar radiation. Single anticlockwise loops of hysteresis were observed for sap flow to be related to solar radiation due to lower morning VPD in 2023 as compared to 2022. Single clockwise loop hysteresis was observed for sap flow to be related to air temperature and vapor pressure deficit in both 2022 and 2023, because of sap flow density peaking earlier than both air temperature and vapor pressure deficit. This kind of hysteresis is partly explained by the resulting self-protection through stomatal control for water conservation.
Hysteretic strength for the sub-diurnal sap flow density against VPD was quantified with hysteresis index for the first time in Southeastern U.S. pecan. The index varied over a range of 1.62-2.39 in the present study. The index increases with VPD suggesting that the larger the VPD, the greater the difference in pecan sap flow between morning and late afternoon under the same VPD.
Hysteresis is an important phenomenon observed in the diurnal variation of pecan sap flow density as influenced by weather conditions such as solar radiation, air temperature, and vapor pressure deficit. Studying the phenomenon helps understand how the highly variable, hot, humid environmental conditions in the Southeastern region influence the sap flow and thus transpiration and water use of pecan trees.
Further study should be conducted to establish the relationship of sap flow with actual transpiration. Such information should prove useful in pecan water management in hot and humid climates.
Data availability statement
The raw data supporting the conclusions of this article will be made available by the authors, without undue reservation.
Author contributions
GZ: Conceptualization, Formal analysis, Methodology, Writing – original draft, Writing – review & editing. MYL: Conceptualization, Formal analysis, Funding acquisition, Methodology, Writing – review & editing. LW: Funding acquisition, Writing – review & editing.
Funding
The author(s) declare that financial support was received for the research, authorship, and/or publication of this article. Georgia Agriculture Commodity Commission for Pecans (GACCP) supported the research funding for this project.
Acknowledgments
The authors would appreciate graduate student Kriti Poudel for her contribution in field experiments and data collection. The authors would like to thank Mr. Cody Casey and his staff at the pecan orchard near Hawkinsville, GA for their multi-faceted cooperation. Also, the authors wish to thank to Mr. Samuel Wright for providing the weather station data from the Georgia Automated Environmental Monitoring Network by the University of Georgia.
Conflict of interest
The authors declare that the research was conducted in the absence of any commercial or financial relationships that could be construed as a potential conflict of interest.
Generative AI statement
The author(s) declare that no Generative AI was used in the creation of this manuscript.
Publisher’s note
All claims expressed in this article are solely those of the authors and do not necessarily represent those of their affiliated organizations, or those of the publisher, the editors and the reviewers. Any product that may be evaluated in this article, or claim that may be made by its manufacturer, is not guaranteed or endorsed by the publisher.
References
Cotrim C. E., dos Santos M. R., Filho M. A. C., Coelho E. F., da Silva J. A. (2019). Sap flow in ‘Tommy Atkins’ mango trees under regulated deficit irrigation. Rev. Ambient. Água 14, e2316. doi: 10.4136/ambi-agua.2316
Fernández J. E., Green S. R., Caspari H. W., Diaz-Espejo A., Cuevas M. V. (2008). The use of sap flow measurements for scheduling irrigation in olive, apple and Asian pear trees and in grapevines. Plant Soil 305, 91–104. doi: 10.1007/s11104-007-9348-8
Ferraz T. M., Netto A. T., De Oliveira Reis F., Peçanha A. L., De Sousa E. F., Filho J. A. M., et al. (2015). Relationships between sap-flow measurements, wholecanopy transpiration and reference evapotranspiration in field-grown papaya (Carica papaya L.). Theor. Exp. Plant Physiol. 27, 251–262. doi: 10.1007/s40626-015-0049-z
Flo V., Martinez-Vilalta J., Steppe K., Schuldt B., Poyatos R. (2019). A synthesis of bias and uncertainty in sap flow methods. Agric. For. Meteorology 271, 362–374. doi: 10.1016/j.agrformet.2019.03.012
Kokkotos E., Zotos A., Tsirogiannis G., Patakas A. (2021). Prediction of olive tree water requirements under limited soil water availability, based on sap flow estimations. Agronomy 11, 1318. doi: 10.3390/agronomy11071318
Langlois J. L., Johnson D. W., Mehuys G. R. (2005). Suspended sediment dynamics associated with snowmelt runoff in a small mountain stream of Lake Tahoe (Nevada). Hydrol. Process. 19, 3569–3580. doi: 10.1002/hyp.v19:18
Liu X., Zhang B., Zhuang J.-Y., Han C., Zhai L., Zhao W.-R., et al. (2017). The relationship between sap flow density and environmental factors in the Yangtze River Delta Region of China. Forests 8, 74. doi: 10.3390/f8030074
López-Bernal Á., Alcántara E., Testi L., Villalobos F. J. (2010). Spatial sap flow and xylem anatomical characteristics in olive trees under different irrigation regimes. Tree Physiol. 30, 1536–1544. doi: 10.1093/treephys/tpq095
Lu P., Urban L., Zhao P. (2004). Granier’s thermal dissipation probe (TDP) method for measuring sap flow in trees: theory and practice. Acta Botanica Sin. 46, 631–646.
Lu P., Woo K. C., Liu Z. T. (2002). Estimation of whole-plant transpiration of bananas using sap flow measurements. J. Exp. Bot. 53, 1771–1779. doi: 10.1093/jxb/erf019
Matheny A. M., Bohrer G., Vogel C. S., Morin T. H., He L., Frasson R. P. D. M., et al. (2014). Species-specific transpiration responses to intermediate disturbance in a northern hardwood forest. J. Geophys. Res. Biogeosciences 119, 2292–2311. doi: 10.1002/2014JG002804
Merlin M., Solarik K. A., Landhäusser S. M. (2020). Quantification of uncertainties introduced by data-processing procedures of sap flow measurements using the cut-tree method on a large mature tree. Agric. For. Meteorology 287, 107926. doi: 10.1016/j.agrformet.2020.107926
NRCS/USDA (2021). Soil survey geographic database (Georgia: Natural Resource Conservation Service, United States Department of Agriculture). Available at: https://websoilsurvey.sc.egov.usda.gov/App/WebSoilSurvey.aspx (Accessed on October 25, 2021).
O’Grady A. P., Worledge D., Battaglia M. (2008). Constraints on transpiration of Eucalyptus globulus in southern Tasmania, Australia. Agric. For. Meteorology 148, 453–465. doi: 10.1016/j.agrformet.2007.10.006
Oogathoo S., Houle D., Duchesne L., Kneeshaw D. (2020). Vapour pressure deficit and solar radiation are the major drivers of transpiration of balsam fir and black spruce tree species in humid boreal regions, even during a short-term drought. Agric. For. Meteorology 291, 108063. doi: 10.1016/j.agrformet.2020.108063
Paço T. A., Conceição N., Ferreira M. I. (2004). Measurements and estimates of peach orchard evapotranspiration in mediterranean conditions. Acta Hortic. 664 ISHS p, 505–512. doi: 10.17660/ActaHortic.2004.664.64
Pingintha N., Leclerc M. Y., Beasley J. P., Zhang G., Senthong C. (2010). Hysteresis response of daytime net ecosystem CO2 exchange during a drought. Biogeosciences 7, 1159–1170. doi: 10.5194/bg-7-1159-2010
Saitta D., Vanella D., Ramírez-Cuesta J. M., Longo-Minnolo G., Ferlito F., Consoli S. (2020). Comparison of orange orchard evapotranspiration by eddy covariance, dap flow, and FAO-56 methods under different irrigation strategies. J. Irrig. Drain Eng. 146, 05020002. doi: 10.1061/(ASCE)IR.1943-4774.0001479
Sakuratani T., Clothier B. E., Green S. R. (1997). Measurements of sap flow in the roots, trunk and shoots of an apple tree using heat pulse and heat balance methods. J. Agric. Meteorol. 53, 141–145. doi: 10.2480/agrmet.53.141
Shinohara Y., Tsuruta K., Ogura A., Noto F., Komatsu H., Otsuki K., et al. (2013). Azimuthal and radial variations in sap flux density and effects on stand-scale transpiration estimates in a Japanese cedar forest. Tree Physiol. 33, 550–558. doi: 10.1093/treephys/tpt029
Sorensen R. B., Jones T. L., Campbell G. S., Montes-Helu M. (1999). Heat pulse needles to measure pecan tree transpiration. Appl. Eng. Agric. 15, 651–657. doi: 10.13031/2013.5833
Sparks D., Yates I. E., Bertrand P. F., Brenneman T. B. (2009). The relative impacts of elevation and rainy days on the incidence of scab damage of pecan nuts in the southeastern USA. J. Hortic. Sci. Biotechnol. 84, 137–142. doi: 10.1080/14620316.2009.11512494
Stein L. A., McEachern G. R., Storey J. B. (1989). Summer fall moisture stress and irrigation scheduling influence pecan growth and production. HortScience 24, 607–611. doi: 10.21273/HORTSCI.24.4.607
Steinberg S. L., McFarland M. J., Worthington J. W. (1990). Comparison of trunk and branch sap flow with canopy transpiration in pecan. J. Exp. Bot. 41, 653–659. doi: 10.1093/jxb/41.6.653
Wang H., Tetzlaff D., Soulsby C. (2019). Hysteretic response of sap flow in Scots pine (Pinus sylvestris) to meteorological forcing in a humid low-energy headwater catchment. Ecohydrology 12, e2125. doi: 10.1002/eco.2125
Wells L. (2015). Irrigation water management for pecans in humid climates. Hortscience 50, 1070–1074. doi: 10.21273/HORTSCI.50.7.1070
Wells L. (2016). Pecan water requirements and irrigation scheduling, University of Georgia Extension, Circular 1106, Athens, GA, Available at: https://secure.caes.uga.edu/extension/publications/files/pdf/C%201106_2.PDF
Wells L. (2017). “Pecan physiology,” in Southeastern pecan growers’ Handbook. Ed. Wells L.. University of Georgia Extension, Bulletin 1327, Athens, GA, Page 1–8.
Worley R. E. (1982). Tree yield and nut characteristics of pecan with drip irrigation under humid conditions. J. Amer. Soc Hortic. Sci. 107, 30–34. doi: 10.21273/JASHS.107.1.30
Wullschleger S. D., Hanson P. J., Todd D. E. (2001). Transpiration from a multi-species deciduous forest as estimated by xylem sap flow techniques. For. Ecol. Manage. 143, 205–213. doi: 10.1016/S0378-1127(00)00518-1
Xu X. (2022). Global patterns and ecological implications of diurnal hysteretic response of ecosystem water consumption to vapor pressure deficit. Agric. For. Meteorology 314, 108785. doi: 10.1016/j.agrformet.2021.108785
Xu S., McVicar T. R., Li L., Yu Z., Jiang P., Zhang Y., et al. (2022). Globally assessing the hysteresis between sub-diurnal actual evaporation and vapor pressure deficit at the ecosystem scale: Patterns and mechanisms. Agric. For. Meteorology 323, 109085. doi: 10.1016/j.agrformet.2022.109085
Zeppel M. J. B., Murray B. R., Barton C., Eamus D. (2004). Seasonal responses of xylem sap velocity to VPD and solar radiation during drought in a stand of native trees in temperate Australia. Funct. Plant Biol. 31, 461–470. doi: 10.1071/FP03220
Zhang Q., Manzoni S., Katul G., Porporato A., Yang D. (2014). The hysteretic evapotranspiration-Vapor pressure deficit relation. J. Geophysical Research: Biogeosciences 119, 125–140. doi: 10.1002/2013JG002484
Keywords: pecan, sap flow, diurnal and seasonal variability, hysteresis, hysteresis index
Citation: Zhang G, Leclerc MY and Wells L (2025) Sap flow of pecan trees in a US Southeastern orchard. Front. Agron. 6:1513025. doi: 10.3389/fagro.2024.1513025
Received: 17 October 2024; Accepted: 19 December 2024;
Published: 17 January 2025.
Edited by:
Pratap Bhattacharyya, ICAR-NRRI, IndiaReviewed by:
Ted Cottrell, United States Department of Agriculture, United StatesDamaris Leopoldina Ojeda-Barrios, Autonomous University of Chihuahua, Mexico
Copyright © 2025 Zhang, Leclerc and Wells. This is an open-access article distributed under the terms of the Creative Commons Attribution License (CC BY). The use, distribution or reproduction in other forums is permitted, provided the original author(s) and the copyright owner(s) are credited and that the original publication in this journal is cited, in accordance with accepted academic practice. No use, distribution or reproduction is permitted which does not comply with these terms.
*Correspondence: Monique Y. Leclerc, TUxlY2xlcmNAdWdhLmVkdQ==
 Gengsheng Zhang
 Monique Y. Leclerc
 Lenny Wells