- 1College of Agronomy, Xinjiang Agricultural University, Urumqi, China
- 2College of Landscape Architecture and Art, Northwest Agricultural and Forestry (A&F) University, Yangling, China
- 3College of Resources and Environment, Xinjiang Agricultural University, Urumqi, China
Introduction: This study examined the impact of biochar application on agricultural productivity and greenhouse gas emissions in irrigated regions of northern Xinjiang. The objective of this study was to assess the impact of nitrogen fertilizer and biochar levels on soil respiration rate, enzyme activity, and spring wheat yield.
Materials and methods: The experiment employed a randomized block design comprising two nitrogen fertilizer levels (N1: 300 kg·hm-2 and N2: 255 kg·hm-2) and four biochar levels (B0: 0 kg·hm-2, B1: 10×103 kg·hm-2, B2: 20×103 kg·hm-2, and B3: 30×103 kg·hm-2). This resulted in eight groups (N1B0, N1B1, N1B2, N1B3, N2B0, N2B1, N2B2, and N2B3), each replicated three times.
Results and discussion: The findings indicated that the N2B2 group exhibited a reduction in soil CO2 emissions, with a cumulative decrease of 4.42% in CO2 emissions compared to the N2B0 control. The application of biochar and/or nitrogen fertilizer, particularly in combination, was observed to increase soil urease, sucrase, and catalase activities. The N2B2 group exhibited a spring wheat yield of 8301.35 kg·hm-2, representing a 22.1% increase over the N1B0 group. This improvement was attributed to the capacity of biochar to regulate soil water content variability, stabilize soil aggregate composition, mitigate organic carbon mineralization, and reduce farmland carbon emissions. Furthermore, biochar’s nitrogen fixation provided essential nutrients for soil microorganisms, thereby enhancing enzymatic reactions and promoting crop growth.
Conclusion: In conclusion, the N2B2 regime was determined to be the optimal approach for spring wheat cultivation in irrigated regions of northern Xinjiang, resulting in enhanced crop productivity and the mitigation of carbon emissions. Nevertheless, further investigation of its long-term impact on farmland is recommended.
1 Introduction
Biochar, an emerging eco-friendly organic carbon fertilizer, has attracted considerable attention due to its distinctive physicochemical properties and capacity to enhance soil quality and functionality (Agarwal et al., 2022). Studies have indicated that the high porosity and large specific surface area of biochar facilitate the adsorption of soil organic carbon, isolate microorganisms and their extracellular enzymes from this carbon, and decelerate decomposition (Palansooriya et al., 2019). Furthermore, biochar has been demonstrated to facilitate the formation of organic and inorganic complexes in soil, thereby enhancing the stability of organic carbon (Zhang et al., 2022). Although biochar may initially stimulate soil organic carbon, long-term studies indicate a positive impact on soil organic carbon content (Shi et al., 2021). Long-term biochar application has been demonstrated to increase soil organic carbon content and maintain stable crop yield and quality (Gu et al., 2022). However, it should be noted that some variability exists in its effects. Several integrated analyses have revealed that biochar application can increase soil organic carbon levels by 15.8%–82.2%. This demonstrates the potential of biochar to act as both a “carbon sequestration” and “carbon sink” agent within the soil biogeochemical cycle (Shi et al., 2021).
The irrigated area in northern Xinjiang can be considered a representative example of irrigated agriculture in the Xinjiang Oasis. Despite the region’s high grain productivity, it is facing challenges, including soil organic matter reduction and insufficient fertility to sustain yield growth. Nitrogen fertilizer, a primary crop nutrient, has been employed extensively to enhance yields. However, the excessive application of this substance has significantly reduced the efficiency of agricultural fields. The indiscriminate utilization of fertilizers by farmers has the additional effect of reducing the rates of nitrogen recycling, which in turn gives rise to a number of ecological and environmental issues, including soil acidification, fertility degradation, and increased greenhouse gas emissions. Consequently, considerable attention has been devoted to the investigation of soil fertility and organic carbon sequestration. A number of studies have investigated the impact of organic matter returned to irrigated fields on productivity, as well as the dynamics and preservation of soil organic carbon under various fertilizer management practices. The application of biochar to irrigated oasis farmland has been demonstrated to markedly elevate soil organic carbon content (Yang et al., 2024), facilitate soil aggregation, reduce bulk weight (Ma et al., 2016), augment nutrient levels, enhance water retention (Razzaghi et al., 2020; Hossain et al., 2020), enrich soil microbial communities, enhance N and P conversion, promote N and P uptake (Zhao et al., 2022; Li et al., 2019), and mitigate soil-borne diseases (Abid et al., 2023), thereby eliciting substantial increases in crop yield and biomass (Jeffery et al., 2011; Trupiano et al., 2017). Despite its widespread applications in enhancing soil fertility and crop yields in irrigated farmlands within oases, current studies on biochar are limited by numerous shortcomings. Specifically, the impact of biochar application on carbon sequestration and emissions remains uncertain.Thus, it is imperative that an exhaustive and unbiased evaluation of the potential applications of biochar in irrigated farmland ecosystems within oases be conducted. We conducted a biochar and nitrogen interaction field experiment in the northern Xinjiang China, the impacts of varying nitrogen fertilizer levels and biochar on soil respiration rate, enzyme activity, and wheat yield were developed. Based on existing knowledge, we hypothesized that the biochar can enhance soil quality and mitigate soil carbon emission substantially, which closely depend on the addition rate of biochar and nitrogen fertilizer. It has the potential to provide practical implications for the development of rational biochar application strategies and a comprehensive evaluation of its value in farmland across the region.
2 Materials and methods
2.1 Experimental plots
This study was performed in the Qitai Wheat Test Station in Xinjiang (longitude 89°13′ to 91°22′ east, latitude 42°25′ to 45°29′N). The study site has a temperate continental climate, with a mean annual temperature of 5.5°C, a mean temperature in July of 22.6°C, a maximum temperature of 39°C, a mean temperature in January of -18.9°C. The average annual relative humidity is 60%, and the mean frost-free season is 153 days spanning from late April to early October. The area revealed an average of 269.4 mm of precipitation annually. The soil at the test site was of a sandy loam variety, soil properties here are like: pH 8.3, salt content 1.4 g/kg, organic matter content 13.8 g/kg, total nitrogen content 2.2 mg/kg, rapidly available phosphorus content 11.4 mg/kg, rapidly available potassium content 147.0 mg/kg, and alkaline hydrolysis nitrogen content 128.7 mg/kg.
2.2 Materials
The biochar was applied by Jinhefu Shenyang agricultural technology development corporation, China. The biochar was made from corn straw after heating at 450°C for 4h without oxygen. The biochar had a pH of 9.3, total nitrogen of 21.8 g/kg, available nitrogen of 5.4 mg/kg, available phosphorus of 200.9 mg/kg. The spring wheat utilized in the experiment was the local staple variety, designated as “Xinchun 37”.
2.3 Experimental design
A randomized block design was employed, with two nitrogen fertilizer levels (N1: 300 kg·hm-2 and N2: 255 kg·hm-2) and four biochar levels (B0: 0 kg·hm-2, B1: 10×103 kg·hm-2, B2: 20×103 kg·hm-2, and B3: 30×103 kg·hm-2). This resulted in eight groups (N1B0, N1B1, N1B2, N1B3, N2B0, N2B1, N2B2, and N2B3), each replicated three times. Spring wheat was sown at a rate of 450×104/hm2 in 0.2 m equally spaced strips on April 12th 2021, with each plot measuring 9 m2 (3 m × 3 m). Both nitrogen fertilizer and biochar were manually applied prior to sowing and incorporated to a depth of 30 cm via tillage. No additional fertilizer was applied subsequently. A total of 400 m3 of water was applied on eight occasions throughout the entire reproductive period.
2.4 Measurement items and methods
2.4.1 Soil sampling
Soil samples were collected from the plow layer (0-20 cm) using a five-point scale during the spring wheat harvesting period. The samples were thoroughly mixed to remove roots and debris, the passed through a 0.2 cm sieve and air-dried prior to use.
2.4.2 Measurement
2.4.2.1 Measurement of respiration rate of soil
Three polyvinyl chloride (PVC) collars (10 cm in diameter and 5 cm in height) were vertically inserted 5 cm deep into the soil surface between crop rows in each plot three days before the first measurement. The soil around the outside wall of each PVC collar was tightly compacted to prevent gas leakage. Soil CO2 emission from each PVC collar was measured weekly at 9:00-11:00 a.m. using a LI-8100 automated soil CO2 flux system (LI-COR Inc., Lincoln, NE, USA) for the wheat growth period. Soil temperature at 5cm depth was measured using stem thermometers near the collar during CO2 flux measurements.
Cumulative CO2 emissions were the sum of the daily fluxes during the wheat growth season. The daily fluxes of unmeasured days were calculated by multiplying the mean of CO2 fluxes of two adjacent measurement days with the corresponding period. The yield-scaled CO2 emissions were calculated as cumulative CO2 emissions/wheat yield.
2.4.2.2 Determination of water content of soil
The water content of the soil was quantified through the implementation of the aluminum box drying and weighing method. For each measurement of soil respiration rate, five points were selected within the wheat rows that surrounded the respiration ring. Soil samples were obtained from the plowed layer (0-20 cm) using a soil auger, with five augers collected at each measurement point. Subsequently, the samples were placed in aluminum boxes and weighed in order to record their mass. Following a 8-hour drying period at 105°C, the samples were reweighed to obtain their dry weight, which was used to calculate soil water content.
2.4.2.3 Measurement of soil enzyme activity
The activities of urease, sucrose, and catalase were assessed using three distinct methods: the phenol-sodium hypochlorite colorimetric method, the dinitro-salicylic acid colorimetric method, and the KMnO4 titrimetric method, respectively (Trupiano et al., 2017; Wang et al., 2020).
2.4.2.4 Measurement of spring wheat yield
Once wheat maturity was reached, a 1 m² (1 m × 1 m) sample area exhibiting uniform growth was selected from each plot for the purpose of determining the effective spike count. Ten representative spring wheat plants were selected from each plot for seed testing purposes. Subsequently, the plants were harvested in order to ascertain the yield, determine the weight of 1,000 grains, and calculate the overall yield.
2.4.3 Calculations
2.4.3.1 Cumulative release of CO2
where M is the cumulative CO2 release flux by the soil, F is the CO2 release flux by the soil, I is the number of samples, and t is the sampling date.
2.4.3.2 Water content of soil extreme ratio
where Ka is the extreme ratio, Xmax is the maximum, and Xmin is the minimum.
The coefficient of variation of water content of soil can be calculated by
where Cv represents the coefficient of variation, σ represents the mean square deviation, and denotes the arithmetic mean.
2.4.3.3 General enzyme activity
2.5 Statistical analysis
The statistical software Excel 2019 and DPS 7.05 were employed to conduct a two-factor analysis. The obtained data were subjected to significance testing, and graphical representations were created using Origin 2021 software.
3 Results and analysis
3.1 Effects of nitrogen fertilizer and biochar level soil respiration rate
The soil respiration rate was monitored every seven days after the emergencing stage of the spring wheat. As illustrated in Figure 1, the soil respiration rate exhibited fluctuations throughout the observation period across all experimental groups, with the highest rates recorded during the early reproductive stage of wheat. Specifically, the soil respiration rates in groups N1B1, N1B2, and N1B3 were higher than those in group N1B0 (Figure 1A). However, no discernible trends were observed among these groups (Figure 1B). It is noteworthy that among all groups, N1B2 and N1B0 exhibited the highest (2.12 μmol·m-2·s-1) and lowest (1.38 μmol·m-2·s-1) average soil respiration rates, respectively.
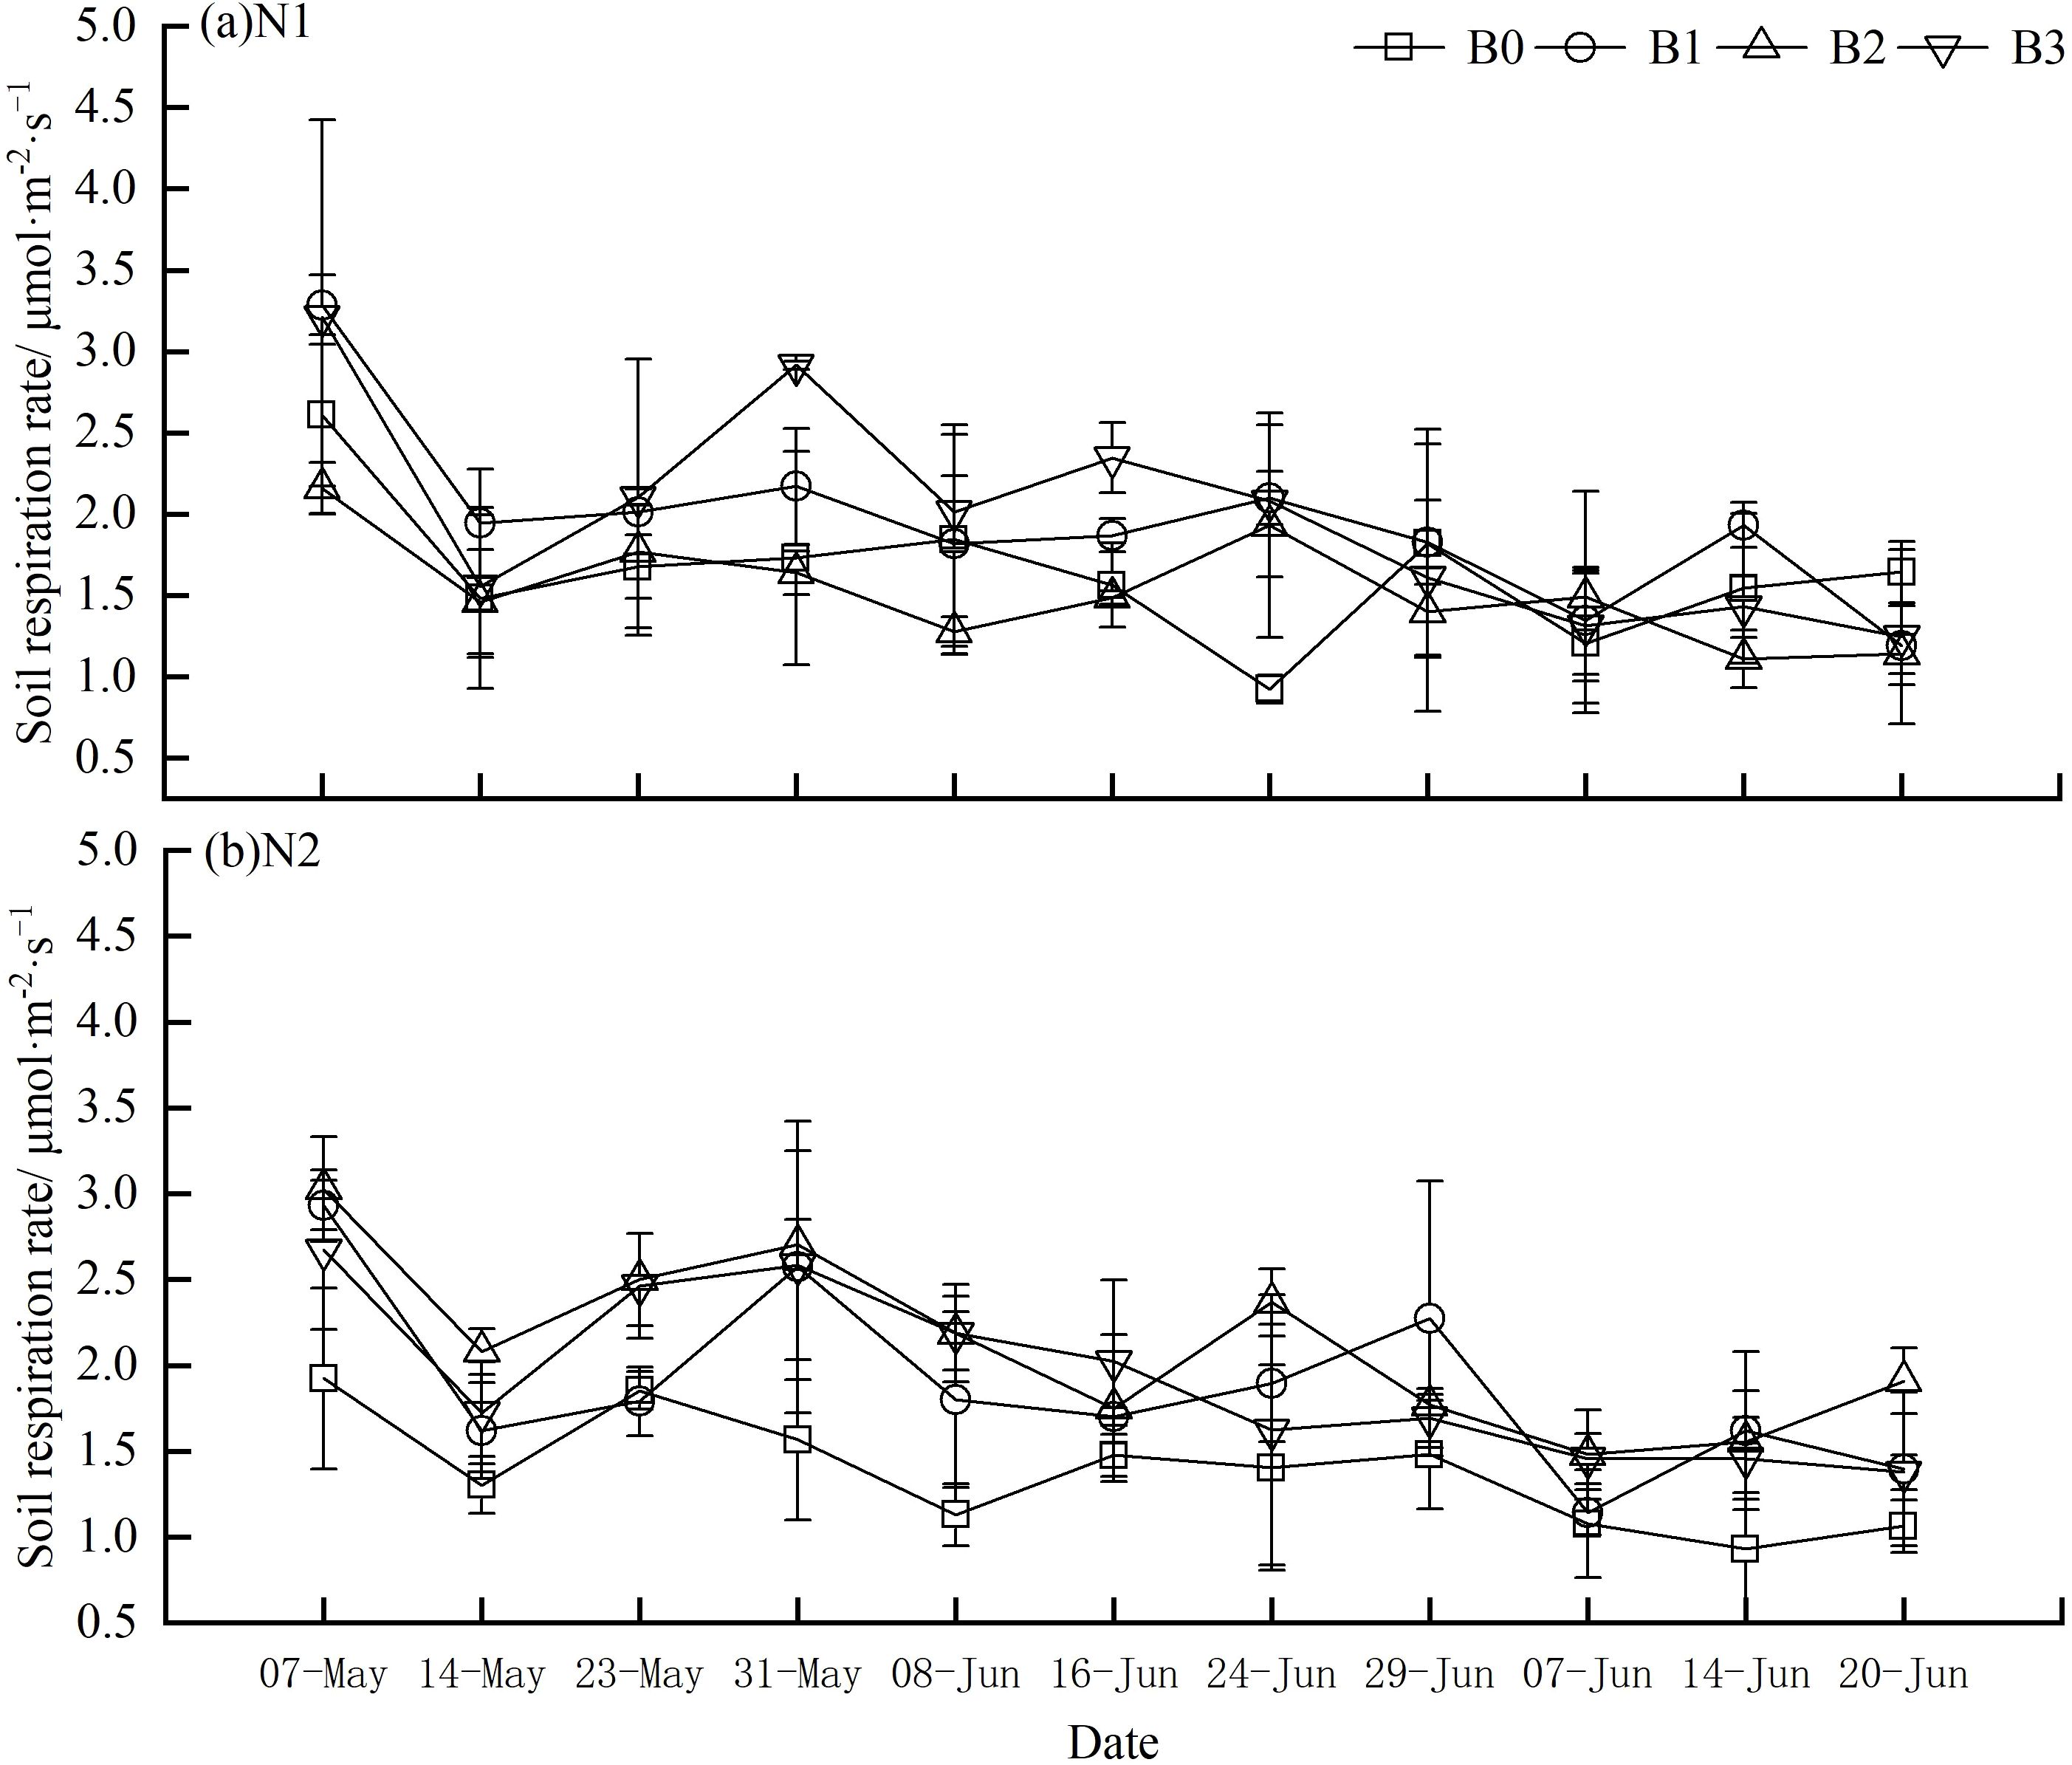
Figure 1. Variations of soil respiration rates in different groups. (A) N1:300 kg·hm−2; (B) N2: 255 kg·hm−2. Soil respiration was measured from the tillering stage (7th May) to the early filling stage (20th July), of which the early growth stage was from 7th May to 14 May, the medium term is from May 23th to June 16th and the latter from June 24th to July 20th. Lowercase letters indicate significant inter-group differences (P<0.05), with B0, B1, B2, and B3 in a descending order.
3.2 Effects of nitrogen fertilizer and biochar levels on cumulative CO2 emissions by soil
The application of nitrogen fertilizer and biochar resulted in a variation of cumulative CO2 emissions from the soil across the two stages (Figure 2). Soil CO2 emissions exhibited a rapid increase during the initial wheat fertility period (0-48 days) and a subsequent, slower increase during the subsequent fertility phase (48–84 days). In comparison to the N1 group, the N2 group demonstrated a notable increase in cumulative CO2 emissions from the soil. Similarly, a comparison of the N1B0 group with the other groups revealed that, with the exception of N1B0 and N2B0, cumulative CO2 emissions increased (Figure 2). The data indicate that within the N1B1, N1B2, and N1B3 groups, cumulative CO2 emissions increased with higher biochar levels (Figure 2A). The observed increases were 34.3% (P>0.05), 51.9% (P<0.05), and 41.2% (P<0.05), respectively, compared to the N1B0 group. The N2B1, N2B2, and N2B3 groups exhibited comparable trends to those observed in the N1B1, N1B2, and N1B3 groups (Figure 2B). It is noteworthy that the N2B2 group exhibited the lowest cumulative CO2 emissions from soil (429.45 g/m²), representing a 4.4% decrease compared to the N2B0 group.
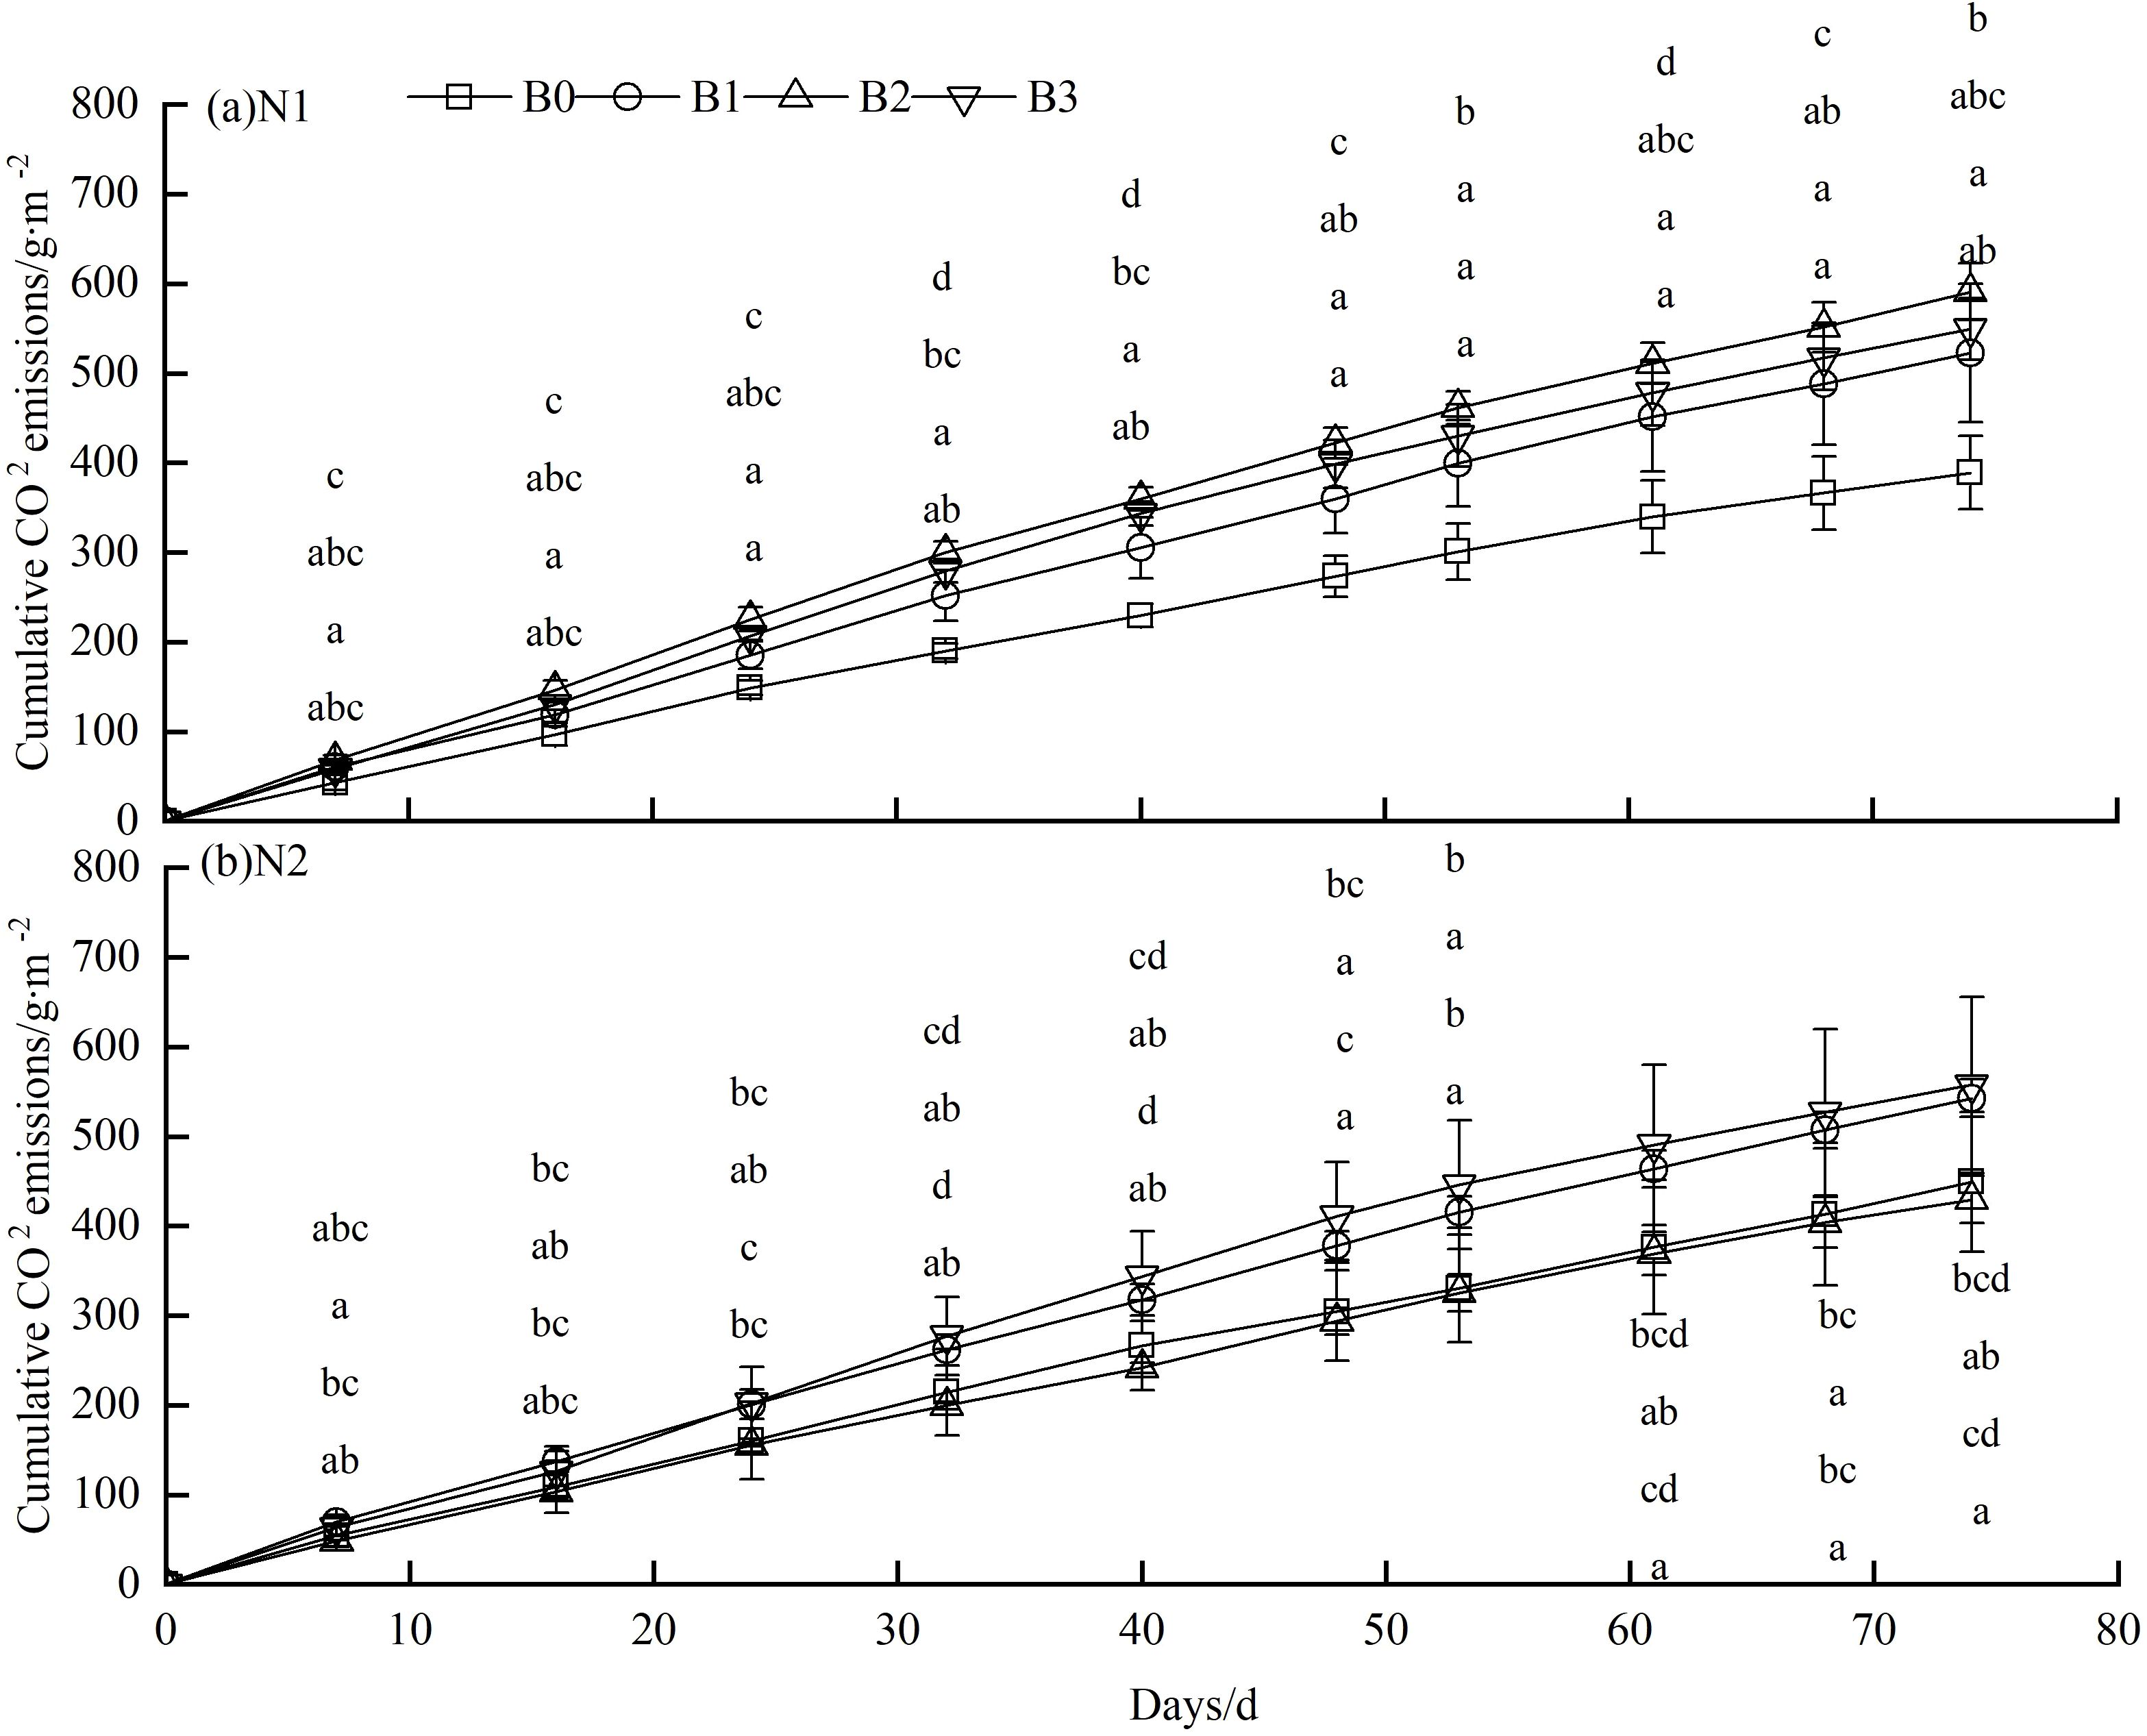
Figure 2. Cumulative CO2 emissions in different groups. (A) N1:300 kg·hm−2; (B) N2: 255 kg·hm−2. Lowercase letters indicate significant inter-group differences (P<0.05), with B0, B1, B2, and B3 in a descending order.
3.3 Effects of nitrogen fertilizer and biochar levels on soi water content
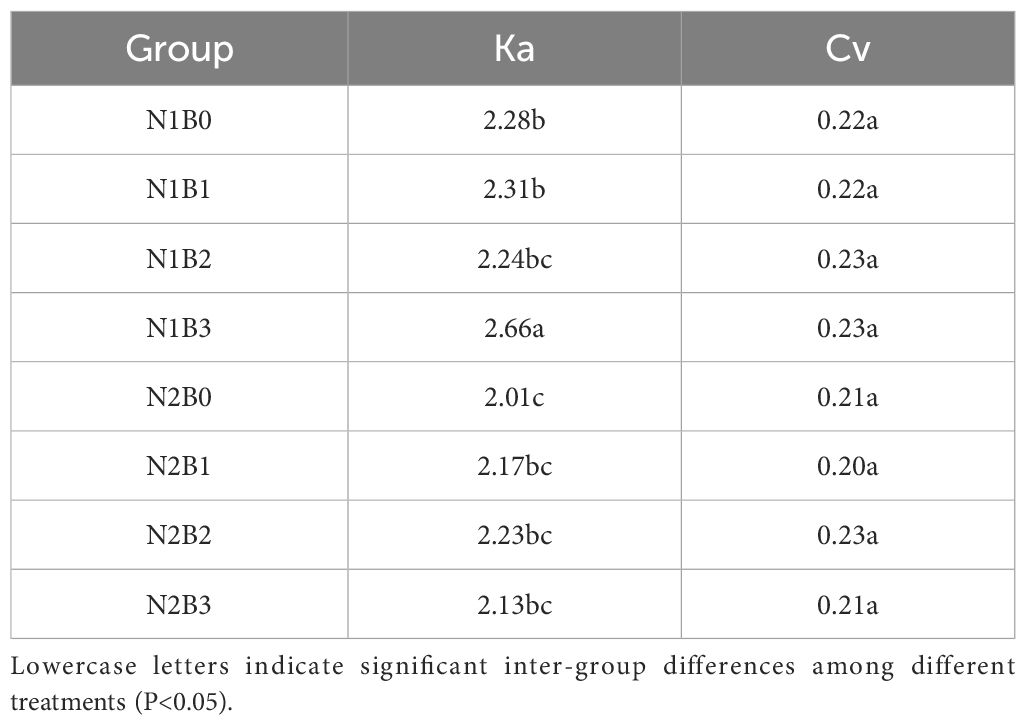
During the spring wheat growing season, soil water content decreased across all experimental groups, as illustrated in Figure 3. Specifically, the soil water content followed the order N1B1, N1B2, and N1B3 > N2B1, N2B2, and N2B3. The extreme ratios and coefficients of variation of soil water content were calculated and are presented in Table 1. In comparison to the N1B0 group, the extreme ratio of soil water content exhibited a decline in the remaining groups, with the exception of N1B2 and N1B3. Similarly, the coefficient of variation exhibited a decrease in N2B0, N2B1, and N2B3, while it demonstrated an increase in the remaining groups. The extreme ratio (Ka) and coefficient of variation (Cv) of soil water content exhibited a pattern whereby the groups N2B1, N2B2, and N2B3 were ranked in descending order, with the groups N1B1, N1B2, and N1B3 occupying the opposite position. Furthermore, the extreme ratio and coefficient of variation in the N2B1, N2B2, and N2B3 groups exhibited an initial increase followed by a subsequent decline with rising biochar levels.
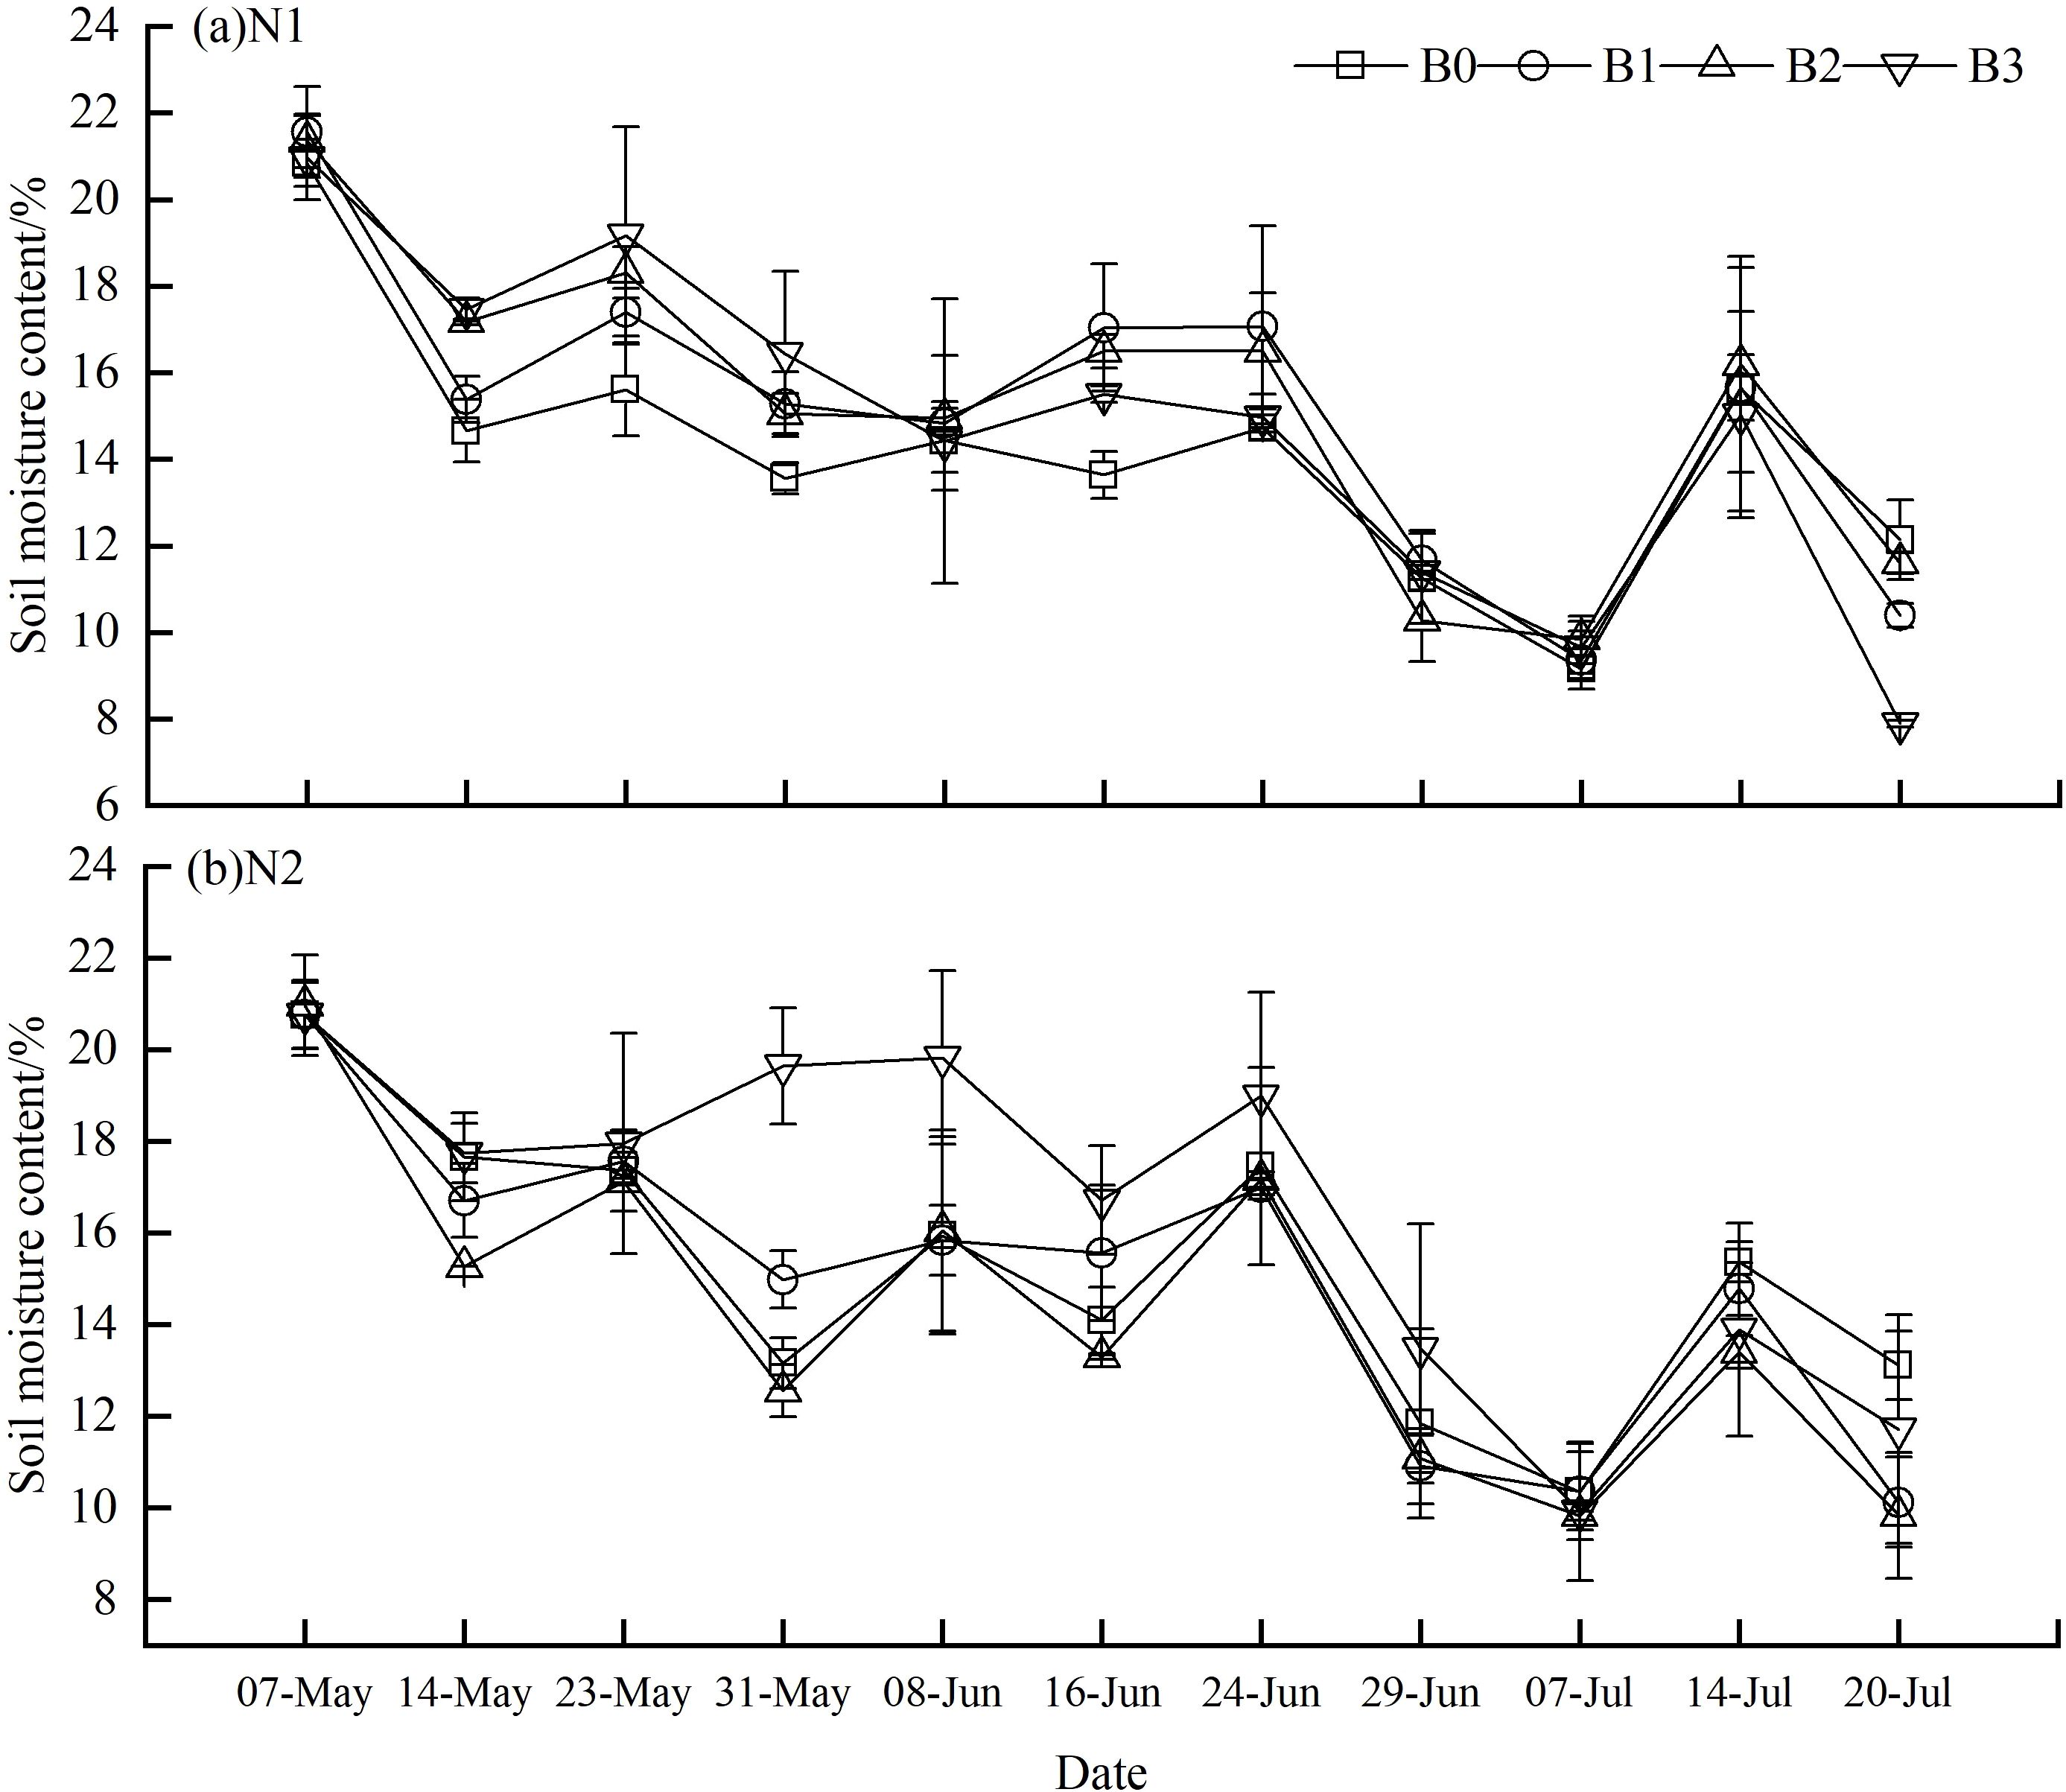
Figure 3. Variations of water contents of soil in different groups. (A) N1:300 kg·hm−2; (B) N2: 255 kg·hm−2. The soil moisture was measured from the tillering stage of wheat (May 7th) to the early stage of filling (July 20th), in which the early stage of wheat growth was from May 7th to May 14th, the middle stage was from May 23th to June 16th, and the late stage was from June 24th to July 20th. Lowercase letters indicate significant inter-group differences (P<0.05), with B0, B1, B2, and B3 in a descending order.
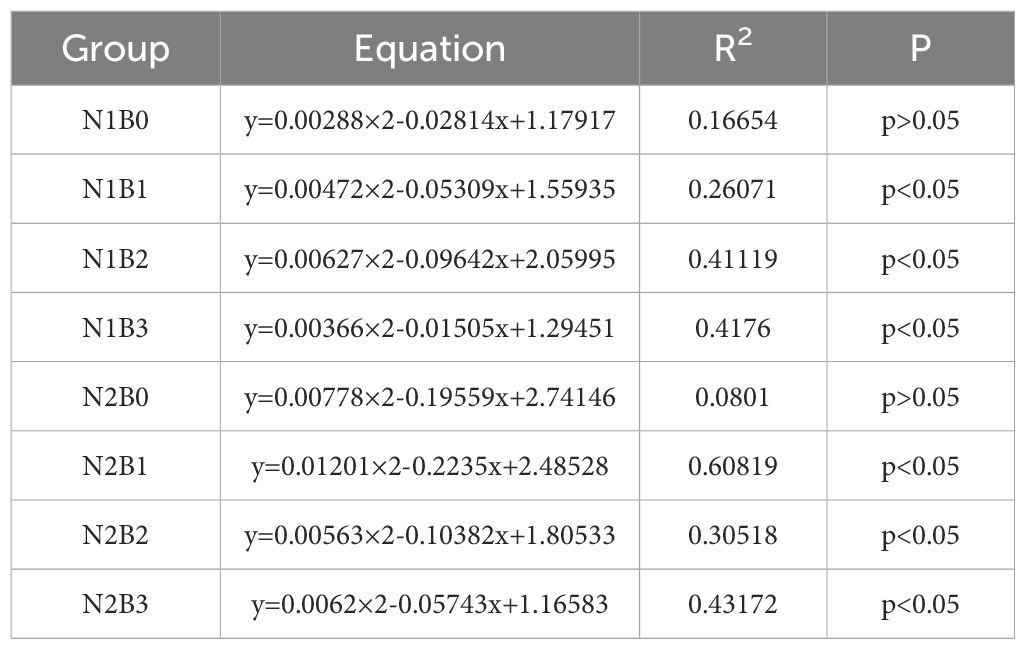
A binomial model was utilized to establish a correlation between the soil respiration rate and soil water content. As indicated in Table 2, a significant binomial functional relationship (P<0.05) was observed between the respiration rate and soil water content in all groups except N1B0 and N2B0, with the highest correlation coefficient noted in N2B1. In general, soil water content was found to account for a significant proportion of the variation in soil respiration rate, with values ranging from 22.1% to 60.8%.
3.4 Effects of nitrogen fertilizer and biochar levels on soil enzyme activity
As illustrated in Figure 4, notable inter-group differences (P<0.05) were identified in soil urease activity. In the N1B0 and N2B0 groups, soil urease activity demonstrated a positive correlation with increasing nitrogen fertilizer levels. The N2B0 group exhibited a 33.7% higher activity than the N1B0 group. The application of nitrogen fertilizer and biochar resulted in an enhancement of soil urease activity. In all experimental groups, the activity of soil urease initially increased and then decreased with increasing biochar levels. The N1B2 group exhibited the highest soil urease activity (45.84 mg·100g-1·3h-1), representing a 60.5% increase over the N1B0 group (P<0.05). In contrast, soil urease activity in the N2B2 and N2B3 groups was found to be 15.2% and 13.3% lower, respectively, than that observed in the N2B0 group (P<0.05).
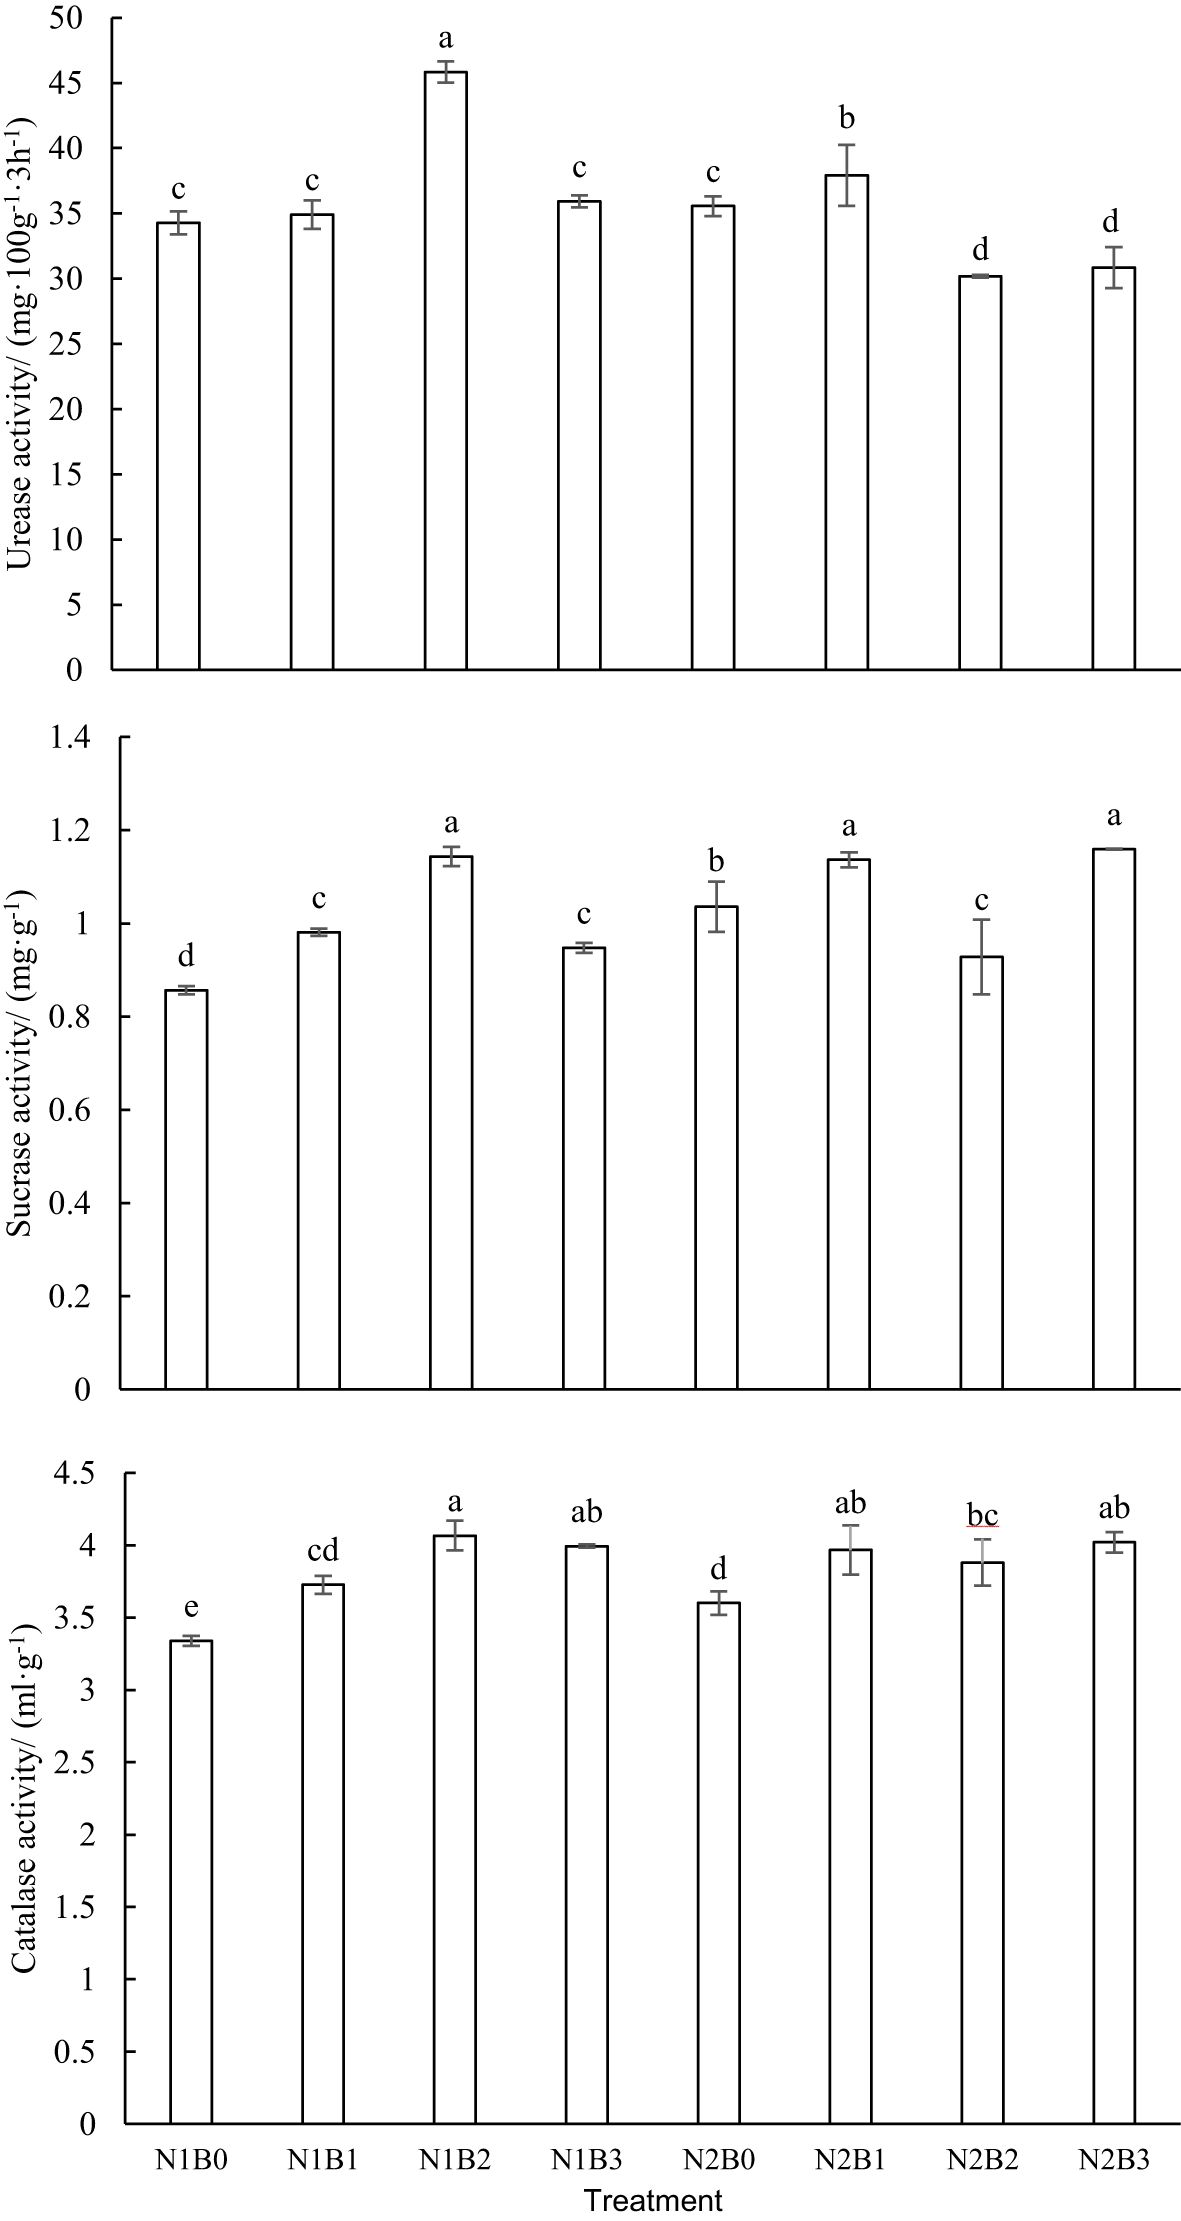
Figure 4. Variation soil enzyme activity in different groups. Lowercase letters indicate significant inter-group differences (P<0.05).
Significant inter-group differences (P<0.05) were observed in the soil sucrase activity. The soil sucrase activity in the N2B0 group was observed to be 17.2% higher than that in the N1B0 group. The combination of nitrogen fertilizer and biochar was found to enhance soil sucrase activity. In the N1B1, N1B2, and N1B3 groups, soil sucrase activity exhibited an initial increase followed by a subsequent decline with rising biochar levels. The highest activity was observed in the N1B2 group, reaching a peak of 1.14 m·g-1. In the N2B1, N2B2, and N2B3 groups, there was a decrease in soil sucrase activity followed by an increase with rising biochar levels. The soil sucrase activity in the N2B1 and N2B3 groups was observed to be 9.32% and 11.89% higher, respectively, than that in the N2B0 group (P<0.05).
Significant inter-group differences were observed in soil catalase activity. In comparison to the N1B0 group, the N2B0 group exhibited an increase in soil catalase activity by 7.8%. In the N1B1, N1B2, and N1B3 groups, soil catalase activity exhibited an initial increase followed by a subsequent decline with rising biochar levels, reaching a peak of 4.97 mL·g-1 in the N1B2 group. In the N2B1, N2B2, and N2B3 groups, soil catalase activity exhibited a decrease followed by an increase with increasing biochar levels. The soil catalase activity in the N2B1, N2B2, and N2B3 groups was observed to be 10.2%, 7.8%, and 11.7% higher, respectively, in comparison to the N2B0 group.
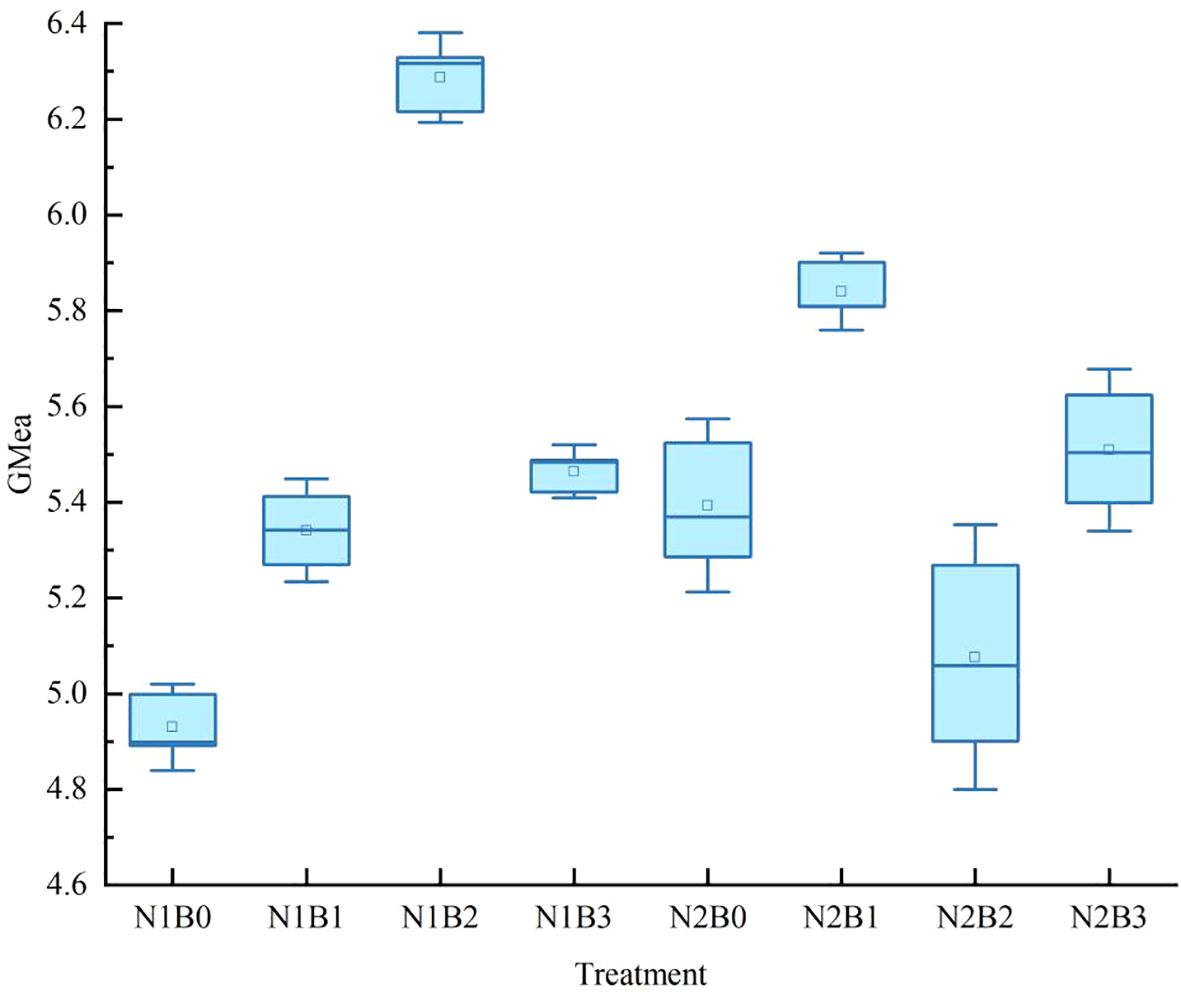
The geometric mean activity of the three enzymes across different groups was employed as the overall indicator of enzyme activity in the wheat field soil. As illustrated in Figure 5, in comparison to the N1B0 group, the overall soil enzyme activity exhibited an increase across all groups, with notable inter-group differences (P < 0.05). The N1B1, N1B2, and N1B3 groups exhibited relatively elevated geometric mean activity, with a notable peak of 5.97 observed in the N1B2 group.
3.5 Effects of nitrogen fertilizer and biochar levels on spring wheat yield
The levels of nitrogen fertilizer and biochar had a significant impact on spring wheat yield. In comparison to the N1B0 group, all groups demonstrated a notable enhancement in spring wheat yield (P < 0.05), with the N2B2 group attaining the highest yield of 8301.35 kg·hm-2, representing a 22.1% increase over the N1B0 group (Figure 6).
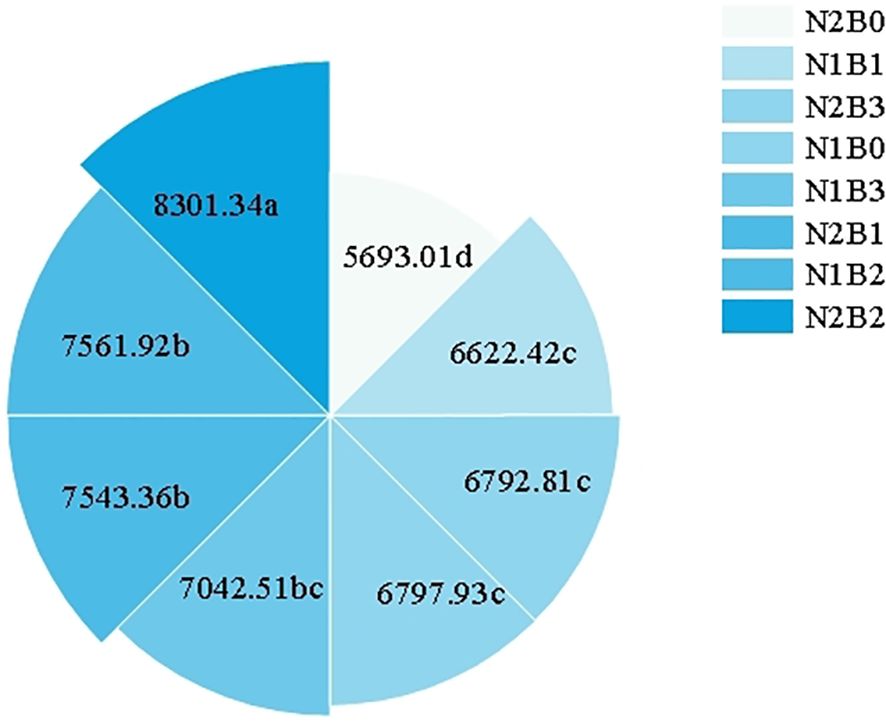
Figure 6. Variation of spring wheat yield in different groups (kg·hm-2). Different small letters in the figure indicate significant differences among different treatments (P<0.05).
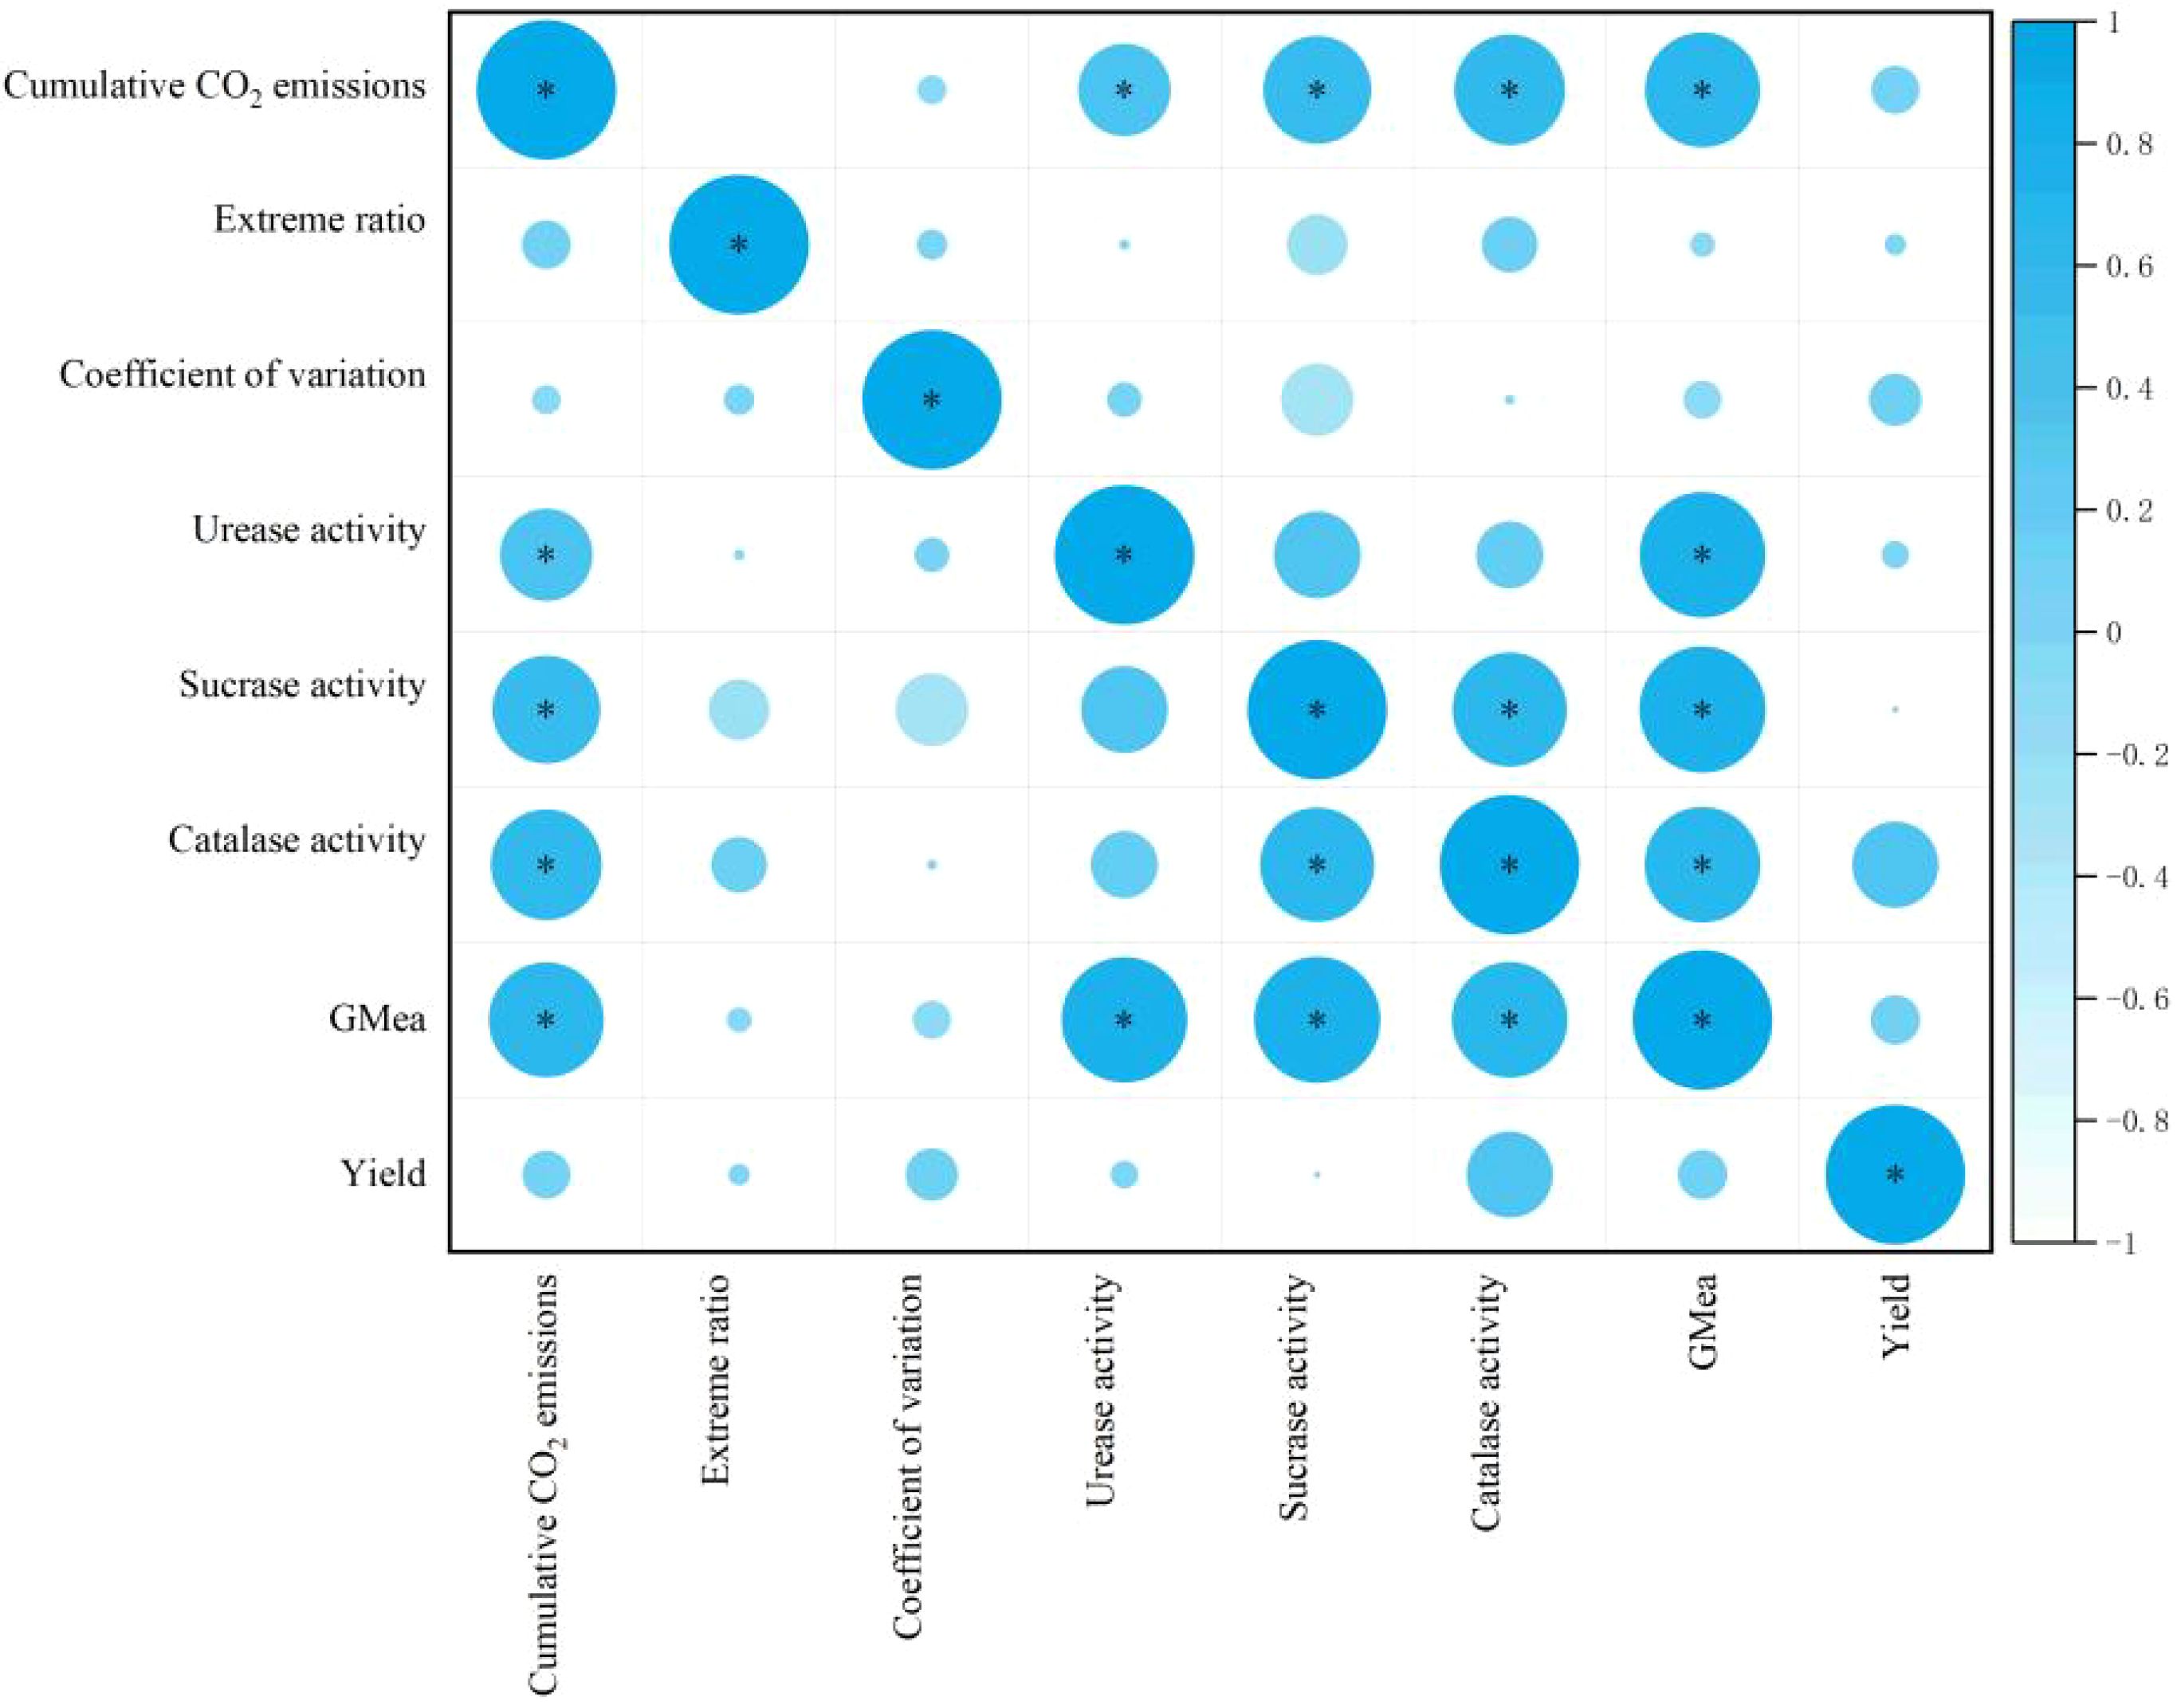
The results of the correlation analysis indicated that there were significant correlations (P < 0.05) between the cumulative CO2 emissions from the soil and the following variables: Cv, soil urease activity, soil sucrase activity, and soil catalase enzyme activity. The results demonstrated a positive correlation between the various indicators and wheat yield. Furthermore, a significant positive correlation was observed between soil catalase activity and soil sucrase activity (P < 0.05) (Figure 7).
4 Discussion
Soil respiration rate is defined as the production of CO2 from the subterranean components of soil organisms and plants, including root respiration and microbial respiration (Yu et al., 2015). The impact of biochar on soil CO2 emissions has been a topic of considerable debate in the scientific community (Wang et al., 2023, Xu P. et al., 2016; Qian et al., 2016). The present study demonstrated that nitrogen fertilizer and biochar levels influenced soil respiration, with conventional nitrogen fertilizer and biochar treatments resulting in elevated cumulative CO2 emissions (Han et al., 2022; Sui et al., 2016). The activated soil organic carbon can be regarded as a preferred carbon source for soil microorganisms, which are exposed to processes of mineralization, transport, and transformation. This has the potential to directly affect soil CO2 emissions (Rogovska et al., 2016; Chen et al., 2016). The application of biochar has been demonstrated to enhance soil porosity (Guo, 2016; Kumputa et al., 2019; Mohamed et al., 2015) and moisture content (Haider et al., 2017; Kannan et al., 2021), thereby increasing the readily mineralizable soluble organic matter and promoting mineralization (Liang et al., 2010). Moreover, the application of biochar has been shown to increase soil pH that may facilitate the conversion of native organic matter into soluble organic carbon and accelerates mineralization to some extent (Huang et al., 2023). In this study, the cumulative soil CO2 emissions initially decreased and then increased with the addition of biochar in the N2B1, N2B2, and N2B3 groups, which indicate a threshold effect on the soil respiration rate. It is noteworthy that the N2B2 group exhibited lower cumulative soil CO2 emissions than the N2B0 group, which is consistent with previous findings (Chen et al., 2015). Prior research has demonstrated that optimized biochar application can facilitate the decomposition of organic matter, with an increase in the ratio of soil macroaggregates to microaggregates resulting in elevated CO2 emissions (Xu N. et al., 2016; Yang et al., 2024; Wang et al., 2014; Gunina and Kuzyakov, 2014). At higher biochar levels, the large surface area and adsorption properties of biochar create a conducive environment for microbial activity (Yang et al., 2023), thereby increasing soil microbial respiration. While others have proposed that although biochar may not directly mineralize soil carbon, it can promote crop growth, offer physical protection to activated organic carbon in the soil, and enhance soil carbon utilization (Spokas et al., 2009; Castaldi et al., 2011; Liu et al., 2020), thus facilitating carbon sequestration.
The level of soil moisture is of great consequence with regard to the process of carbon mineralization. It has been demonstrated that the incorporation of biochar into the soil can serve to reduce soil water evaporation, thereby enhancing soil moisture levels (Liu et al., 2016). The highest rates of carbon mineralization were observed when the soil moisture content reached 70% in fields treated with biochar (Sun et al., 2016). In this study, a noteworthy correlation was observed between soil moisture content and soil respiration rates across all groups. The diffusion rate of CO2 in soil pores and its solubility in soil water are subject to influence from soil moisture content. Climate-induced variations, such as alternating wet and dry conditions and drought, have been observed to accelerate carbon mineralization and CO2 emissions (Sun et al., 2016; Domínguez et al., 2017). In comparison to consistent moisture levels, drought and alternating wet and dry conditions have been observed to promote the decomposition of native organic matter into soluble forms (Zhang et al., 2010). In conditions of drought, even a minimal quantity of water can stimulate the soil respiration rate (Wang et al., 2016). On the other hand, the wetting of soil can result in the disruption of soil aggregates, a reduction in biochar stability, an acceleration of mineralization, and an increase in CO2 release (Mitchell et al., 2015; Placella et al., 2012). It is essential to consider the characteristics of the carbon input, environmental factors, fertilizer usage, and land management practices in order to ensure the rationality and efficacy of such measures, particularly in irrigated farmland, if effective carbon sequestration and emission reduction via exogenous carbon inputs is to be achieved. Further investigation is therefore required to ascertain the potential for biochar application in farmland to reduce emissions under alternating dry and wet conditions.
The role of soil enzymes in microbial respiration is of significant importance. There is a positive correlation between enzyme activity and respiratory rates among soil microorganisms. The application of biochar has been demonstrated to enrich soil by increasing the nutrient and organic matter content, thereby promoting the growth, diversity, and enzymatic activity of soil microorganisms. Furthermore, biochar, which is distinguished by its high porosity and extensive specific surface area, provides an optimal environment for microbial colonization (Du et al., 2014). This results in an increase in microbial biomass, which in turn leads to an increase in soil enzyme activity involved in nutrient cycling, as evidenced by elevated soil enzyme activity (Palansooriya et al., 2019). Moreover, an increase in soil protein enzyme activity has been observed in treatments with high biochar levels in comparison to those with low biochar levels (Xie et al., 2015). The observed increase in microbial activity at low biochar levels can be attributed to the provision of a carbon source and the creation of a conducive habitat by the biochar pore structure. Nevertheless, as the dosage of biochar increases, the elevated pH has been observed to inhibit soil enzyme activity and reduce microbial respiration (Deng et al., 2020). The combination of nitrogen fertilizer and biochar compensated for the carbon deficiency of the former and the nitrogen deficiency of the latter, respectively. This combination enhanced soil enzyme reactions and increased soil microorganism activity in wheat fields, resulting in elevated levels of urease, sucrase, and catalase in the soil (Zhang et al., 2023). Furthermore, in the context of conventional nitrogen fertilizer application, soil enzyme activity demonstrated an initial increase, followed by a reduction, with rising biochar levels. This pattern indicated the presence of a threshold effect of biochar, which was likely attributable to its high salt content, including polycyclic aromatic hydrocarbons (PAHs). The application of an excessive quantity of biochar may result in the inhibition of soil microbial activity, a reduction in soil enzyme reactions, and a decline in overall soil enzyme activity.
Biochar has been demonstrated to enhance soil physical properties (Alghamdi, 2018), augment soil nutrient levels (Quilliam et al., 2012), and promote crop growth (Quilliam et al., 2012). In this study, the application of nitrogen fertilizer and biochar was found to increase spring wheat yield, with the N2B2 group exhibiting the highest yield (22.1% greater than that in the N1B0 group). Biochar could maintain a balanced carbon-to-nitrogen ratio that suppress the proliferation of harmful soil microorganisms (Abid et al., 2023; Li et al., 2022), elevate soil organic matter content, create a conducive microbial growth environment (Xu N. et al., 2016), slow soil nutrient release, and enhance crop nitrogen uptake, thereby promoting increased crop yield (Xu et al., 2021). Nevertheless, the outcomes are contingent upon the raw material of the biochar, the application methodology, the soil texture, the soil type, and the crop species (Ji et al., 2016).
5 Conclusions
The application of biochar has the potential to enhance the soil environment by modulating soil enzyme activity. The effect of biochar on soil CO2 emissions has been observed to vary depending on the level of biochar utilized. The short-term application of biochar did not result in a consistent reduction in CO2 emissions from farmland in irrigated areas of northern Xinjiang, while maintaining or even increasing yields. In the N2B2 group (nitrogen: 255 kg·hm-2, biochar: 20×103 kg·hm-2), spring wheat yields exhibited an increase concomitant with a reduction in soil CO2 emissions. In light of these findings, the N2B2 regimen may be considered an optimal approach for wheat cultivation in irrigated areas of northern Xinjiang, offering increased spring wheat yields and decreased carbon emissions. Nevertheless, further investigation is required to ascertain the long-term effects on farmlands.
Data availability statement
The raw data supporting the conclusions of this article will be made available by the authors, without undue reservation.
Author contributions
WY: Conceptualization, Data curation, Formal analysis, Funding acquisition, Investigation, Methodology, Project administration, Resources, Software, Supervision, Validation, Visualization, Writing – original draft, Writing – review & editing. LYZ: Formal analysis, Software, Writing – original draft. YC: Data curation, Formal analysis, Methodology, Software, Writing – original draft. LS: Data curation, Formal analysis, Methodology, Software, Writing – original draft, Writing – review & editing. LZ: Data curation, Formal analysis, Software, Writing – original draft. PL: Conceptualization, Formal analysis, Investigation, Methodology, Supervision, Validation, Writing – review & editing. HZ: Conceptualization, Data curation, Formal analysis, Investigation, Methodology, Software, Supervision, Validation, Visualization, Writing – review & editing. HJ: Project administration, Resources, Software, Supervision, Writing – review & editing.
Funding
The author(s) declare financial support was received for the research, authorship, and/or publication of this article. This project was financially supported by the Tianshan Talent Training Program (2023TSYCCX0085), the Regional Science Fund Project of the Natural Science Foundation of China (32260326), and the earmarked fund for the Xinjiang Agriculture Research System (XJARS-01).
Conflict of interest
The authors declare that the research was conducted in the absence of any commercial or financial relationships that could be construed as a potential conflict of interest.
Publisher’s note
All claims expressed in this article are solely those of the authors and do not necessarily represent those of their affiliated organizations, or those of the publisher, the editors and the reviewers. Any product that may be evaluated in this article, or claim that may be made by its manufacturer, is not guaranteed or endorsed by the publisher.
References
Abid F., Naz R., Asif T. (2023). “Biochar for crop protection from soil borne diseases,” in Sustainable agriculture reviews 61: biochar to improve crop production and decrease plant stress under a changing climate. (Cham: Springer International Publishing), 231–246. doi: 10.1007/978-3-031-26983-7_10
Agarwal H., Kashyap V. H., Mishra A., Bordoloi S., Singh P. K., Joshi N. C. (2022). Biochar-based fertilizers and their applications in plant growth promotion and protection. 3 Biotech. 12, 136. doi: 10.1007/s13205-022-03195-2
Alghamdi A. G. (2018). Biochar as a potential soil additive for improving soil physical properties-a review. Arabian J. Geosciences. 11, 766. doi: 10.1007/s12517-018-4056-7
Castaldi S., Riondino M., Baronti S., Esposito F. R., Marzaioli R., Rutigliano F. A., et al. (2011). Impact of biochar application to a Mediterranean wheat crop on soil microbial activity and greenhouse gas fluxes. Chemosphere. 85, 1464–1471. doi: 10.1016/j.chemosphere.2011.08.031
Chen J., Kim H., Yoo G. (2015). Effects of biochar addition on CO2 and N2O emissions following fertilizer application to a cultivated grassland soil. PloS One 10, e0126841. doi: 10.1371/journal.pone.0126841
Chen S., Xu C., Yan J., Zhang X., Zhang X., Wang D. (2016). The influence of the type of crop residue on soil organic carbon fractions: An 11-year field study of rice-based cropping systems in southeast China. Agriculture Ecosyst. Environment. 223, 261–269. doi: 10.1016/j.agee.2016.03.009
Deng B., Shi Y., Zhang L., Fang H., Gao Y., Luo L., et al. (2020). Effects of spent mushroom substrate-derived biochar on soil CO2 and N2O emissions depend on pyrolysis temperature. Chemosphere. 246, 125608. doi: 10.1016/j.chemosphere.2019.125608
Domínguez M. T., Holthof E., Smith A. R., Koller E., Emmett B. A. (2017). Contrasting response of summer soil respiration and enzyme activities to long-term warming and drought in a wet shrubland (NE Wales, UK). Appl. Soil Ecol. 110, 151–155. doi: 10.1016/j.apsoil.2016.11.003
Du Z., Wang Y., Huang J., Lu N., Liu X., Lou Y., et al. (2014). Consecutive biochar application alters soil enzyme activities in the winter wheat-growing season. Soil Science. 179, 75–83. doi: 10.1097/SS.0000000000000050
Gu W., Wang Y., Feng Z., Wu D., Zhang H., Yuan H., et al. (2022). Long-term effects of biochar application with reduced chemical fertilizer on paddy soil properties and japonica rice production system. Front. Environ. Science. 10. doi: 10.3389/fenvs.2022.902752
Gunina A., Kuzyakov Y. (2014). Pathways of litter C by formation of aggregates and SOM density fractions: implications from 13C natural abundance. Soil Biol. Biochem. 71, 95–104. doi: 10.1016/j.soilbio.2014.01.011
Guo M. (2016). Application of biochar for soil physical improvement. Agric. Environ. Appl. Biochar: Adv. Barriers. 63, 101–122. doi: 10.2136/sssaspecpub63.2014.0039.5
Haider G., Steffens D., Moser G., Müller C., Kammann C. I. (2017). Biochar reduced nitrate leaching and improved soil moisture content without yield improvements in a four-year field study. Agriculture Ecosyst. environment. 237, 80–94. doi: 10.1016/j.agee.2016.12.019
Han J., Zhang A., Kang Y., Han J., Yang B., Hussain Q., et al. (2022). Biochar promotes soil organic carbon sequestration and reduces net global warming potential in apple orchard: A two-year study in the Loess Plateau of China. Sci. Total Environment. 803, 150035. doi: 10.1016/j.scitotenv.2021.150035
Hossain M. Z., Bahar M. M., Sarkar B., Donne S. W., Ok Y. S., Palansooriya K. N., et al. (2020). Biochar and its importance on nutrient dynamics in soil and plant. Biochar. 2, 379–420. doi: 10.1007/s42773-020-00065-z
Huang K., Zhang J., Tang G., Bao D., Wang T., Kong D., et al. (2023). Impacts and mechanisms of biochar on soil microorganisms. Plant Soil Environment. 69, 45–54. doi: 10.17221/348/2022-PSE
Jeffery S., Verheijen F. G., van der Velde M., Bastos A. C. (2011). A quantitative review of the effects of biochar application to soils on crop productivity using meta-analysis. Agriculture Ecosyst. environment. 144, 175–187. doi: 10.1016/j.agee.2011.08.015
Ji Q., Zhao S. X., Li Z. H., Ma Y. Y., Wang X. D. (2016). Effects of biochar-straw on soil aggregation, organic carbon distribution, and wheat growth. Agron. J. 108, 2129–2136. doi: 10.2134/agronj2016.02.0121
Kannan P., Paramasivan M., Marimuthu S., Swaminathan C., Bose J. (2021). Applying both biochar and phosphobacteria enhances Vigna mungo L. growth and yield in acid soils by increasing soil pH, moisture content, microbial growth and P availability. Agriculture Ecosyst. environment. 308, 107258. doi: 10.1016/j.agee.2020.107258
Kumputa S., Vityakon P., Saenjan P., Lawongsa P. (2019). Carbonaceous greenhouse gases and microbial abundance in paddy soil under biochar and rice straw amendment. Agronomy. 9, 228. doi: 10.3390/agronomy9050228
Li F., Liang X., Niyungeko C., Li F., Liang X., Niyungeko C., et al. (2019). Effects of biochar amendments on soil phosphorus transformation in agricultural soils. Adv. agronomy. 158, 131–172. doi: 10.1016/bs.agron.2019.07.002
Li J., Ren T., Li Y., Chen N., Yin Q., Li M., et al. (2022). Organic materials with high C/N ratio: more beneficial to soil improvement and soil health. Biotechnol. Letters. 44, 1415–1429. doi: 10.1007/s10529-022-03309-z
Liang B., Lehmann J., Sohi S. P., Thies J. E., O’Neill B., Trujillo L., et al. (2010). Black carbon affects the cycling of non-black carbon in soil. Organic Geochemistry. 41, 206–213. doi: 10.1016/j.orggeochem.2009.09.007
Liu Z., Wu X., Liu W., Bian R., Ge T., Zhang W., et al. (2020). Greater microbial carbon use efficiency and carbon sequestration in soils: amendment of biochar versus crop straws. GCB Bioenergy. 12, 1092–1103. doi: 10.1111/gcbb.12763
Liu X., Zheng J., Zhang D., Cheng K., Zhou H., Zhang A., et al. (2016). Biochar has no effect on soil respiration across Chinese agricultural soils. Sci. Total Environment. 554, 259–265. doi: 10.1016/j.scitotenv.2016.02.179
Ma N., Zhang L., Zhang Y., Yang L., Yu C., Yin G., et al. (2016). Biochar improves soil aggregate stability and water availability in a mollisol after three years of field application. PloS One 11, e0154091. doi: 10.1371/journal.pone.0154091
Mitchell P. J., Simpson A. J., Soong R., Simpson M. J. (2015). Shifts in microbial community and water-extractable organic matter composition with biochar amendment in a temperate forest soil. Soil Biol. Biochem. 81, 244–254. doi: 10.1016/j.soilbio.2014.11.017
Mohamed E. M., El-Naggar A. H., Usman A. R., Al-Wabel M. (2015). Dynamics of CO2 emission and biochemical properties of a sandy calcareous soil amended with Conocarpus waste and biochar. Pedosphere. 25, 46–56. doi: 10.1016/S1002-0160(14)60075-8
Palansooriya K. N., Wong J. T., Hashimoto Y., Huang L., Rinklebe J., Chang S. X., et al. (2019). Response of microbial communities to biochar-amended soils: a critical review. Biochar. 1, 3–22. doi: 10.1007/s42773-019-00009-2
Placella S. A., Brodie E. L., Firestone M. K. (2012). Rainfall-induced carbon dioxide pulses result from sequential resuscitation of phylogenetically clustered microbial groups. Proc. Natl. Acad. Sc1qiences. 109, 10931–10936. doi: 10.1073/pnas.1204306109
Qian L., Zhang W., Yan J., Han L., Gao W., Liu R., et al. (2016). Effective removal of heavy metal by biochar colloids under different pyrolysis temperatures. Bioresource technology. 206, 217–224. doi: 10.1016/j.biortech.2016.01.065
Quilliam R. S., Marsden K. A., Gertler C., Rousk J., DeLuca T. H., Jones D. L. (2012). Nutrient dynamics, microbial growth and weed emergence in biochar amended soil are influenced by time since application and reapplication rate. Agriculture Ecosyst. Environment. 158, 192–199. doi: 10.1016/j.agee.2012.06.011
Razzaghi F., Obour P. B., Arthur E. (2020). Does biochar improve soil water retention? A systematic review and meta-analysis. Geoderma. 361, 114055. doi: 10.1016/j.geoderma.2019.114055
Rogovska N., Laird D. A., Karlen D. L. (2016). Corn and soil response to biochar application and stover harvest. Field Crops Res. 187, 96–106. doi: 10.1016/j.fcr.2015.12.013
Shi S., Zhang Q., Lou Y., Du Z., Wang Q., Hu N., et al. (2021). Soil organic and inorganic carbon sequestration by consecutive biochar application: Results from a decade field experiment. Soil Use Management. 37, 95–103. doi: 10.1111/sum.12655
Spokas K. A., Koskinen W. C., Baker J. M., Reicosky D. C. (2009). Impacts of woodchip biochar additions on greenhouse gas production and sorption/degradation of two herbicides in a Minnesota soil. Chemosphere. 77, 574–581. doi: 10.1016/j.chemosphere.2009.06.053
Sui Y., Gao J., Liu C., Zhang W., Lan Y., Li S., et al. (2016). Interactive effects of straw-derived biochar and N fertilization on soil C storage and rice productivity in rice paddies of Northeast China. Sci. Total Environment. 544, 203–210. doi: 10.1016/j.scitotenv.2015.11.079
Sun J., He F., Zhang Z., Shao H., Xu G. (2016). Temperature and moisture responses to carbon mineralization in the biochar-amended saline soil. Sci. Total Environment. 569, 390–394. doi: 10.1016/j.scitotenv.2016.06.082
Trupiano D., Cocozza C., Baronti S., Amendola C., Vaccari F. P., Lustrato G., et al. (2017). The effects of biochar and its combination with compost on lettuce (Lactuca sativa L.) growth, soil properties, and soil microbial activity and abundance. Int. J. Agron. 2017, 3158207. doi: 10.1155/2017/3158207
Wang L., Chen D., Zhu L. (2023). Biochar carbon sequestration potential rectification in soils: Synthesis effects of biochar on soil CO2, CH4 and N2O emissions. Sci. Total Environment. 904, 167047. doi: 10.1016/j.scitotenv.2023.167047
Wang D., Griffin D. E., Parikh S. J., Scow K. M. (2016). Impact of biochar amendment on soil water soluble carbon in the context of extreme hydrological events. Chemosphere. 160, 287–292. doi: 10.1016/j.chemosphere.2016.06.100
Wang Z., Li Y., Chang S. X., Zhang J., Jiang P., Zhou G., et al. (2014). Contrasting effects of bamboo leaf and its biochar on soil CO2 efflux and labile organic carbon in an intensively managed Chinese chestnut plantation. Biol. fertility soils. 50, 1109–1119. doi: 10.1007/s00374-014-0933-8
Wang H., Wu J., Li G., Yan L. (2020). Changes in soil carbon fractions and enzyme activities under different vegetation types of the northern Loess Plateau. Ecol. evolution. 10, 12211–12223. doi: 10.1002/ece3.6852
Xie J. Y., Xu M. G., Ciren Q., Yang Y. A. N. G., Zhang S. L., Sun B. H., et al. (2015). Soil aggregation and aggregate associated organic carbon and total nitrogen under long-term contrasting soil management regimes in loess soil. J. Integr. Agriculture. 14, 2405–2416. doi: 10.1016/S2095-3119(15)61205-9
Xu H., Cai A., Wu D., Liang G., Xiao J., Xu M., et al. (2021). Effects of biochar application on crop productivity, soil carbon sequestration, and global warming potential controlled by biochar C: N ratio and soil pH: A global meta-analysis. Soil Tillage Res. 213, 105125. doi: 10.1016/j.still.2021.105125
Xu P., Sun C. X., Ye X. Z., Xiao W. D., Zhang Q., Wang Q. (2016). The effect of biochar and crop straws on heavy metal bioavailability and plant accumulation in a Cd and Pb polluted soil. Ecotoxicology Environ. safety. 132, 94–100. doi: 10.1016/j.ecoenv.2016.05.031
Xu N., Tan G., Wang H., Gai X. (2016). Effect of biochar additions to soil on nitrogen leaching, microbial biomass and bacterial community structure. Eur. J. Soil Biol. 74, 1–8. doi: 10.1016/j.ejsobi.2016.02.004
Yang W., Wang Z., Guo S., Yang M., Zhao L., Zhao H., et al. (2023). Evaluation of soil fertility quality under biochar combined with nitrogen in an irrigated wheat field in Northern Xinjiang, China. Agronomy. 13, 2518. doi: 10.3390/agronomy13102518
Yang W., Wang Z., Zhao H., Li D., Jia H., Xu W. (2024). Biochar application influences the stability of soil aggregates and wheat yields. Plant Soil Environment. 70, 125–141. doi: 10.17221/199/2023-PSE
Yu L., Wang Y., Wang Y., Sun S., Liu L. (2015). Quantifying components of soil respiration and their response to abiotic factors in two typical subtropical forest stands, southwest China. PloS One 10, e0117490. doi: 10.1371/journal.pone.0117490
Zhang X., Gong Z., Allinson G., Li X., Jia C. (2022). Joint effects of bacterium and biochar in remediation of antibiotic-heavy metal contaminated soil and responses of resistance gene and microbial community. Chemosphere. 299, 134333. doi: 10.1016/j.chemosphere.2022.134333
Zhang X., Guan Q., Kong L., Yang R., Liu X., Qu J., et al. (2023). Composite organic amendment boosts soil remediation and cd detoxification to rape under different nitrogen level. Eur. J. Soil Biol. 114, 103463. doi: 10.1016/j.ejsobi.2022.103463
Zhang H., Lin K., Wang H., Gan J. (2010). Effect of Pinus radiata derived biochars on soil sorption and desorption of phenanthrene. Environ. Pollution. 158, 2821–2825. doi: 10.1016/j.envpol.2010.06.025
Keywords: biochar, CO2 emission, soil enzyme activity, spring wheat yield, nitrogen fertilizer
Citation: Yang W, Zhang L, Chen Y, Su L, Zhao L, Li P, Zhao H and Jia H (2024) Effects of nitrogen fertilizer and biochar levels on soil CO2 emission and wheat yield in irrigation region. Front. Agron. 6:1487500. doi: 10.3389/fagro.2024.1487500
Received: 28 August 2024; Accepted: 31 October 2024;
Published: 21 November 2024.
Edited by:
Hanuman Singh Jatav, Sri Karan Narendra Agriculture University, IndiaReviewed by:
Aung Zaw Oo, Japan International Research Center for Agricultural Sciences (JIRCAS), JapanGiradhari Lal Yadav, Sri Karan Narendra Agriculture University, India
Copyright © 2024 Yang, Zhang, Chen, Su, Zhao, Li, Zhao and Jia. This is an open-access article distributed under the terms of the Creative Commons Attribution License (CC BY). The use, distribution or reproduction in other forums is permitted, provided the original author(s) and the copyright owner(s) are credited and that the original publication in this journal is cited, in accordance with accepted academic practice. No use, distribution or reproduction is permitted which does not comply with these terms.
*Correspondence: Weijun Yang, MTk4NF95d2pAMTYzLmNvbQ==
 Weijun Yang
 Liyue Zhang1
 Hongtao Jia