 Huong T. X. Nguyen
 Matt Liebman
A Corrigendum on
Weed community composition in simple and more diverse cropping systems
By Nguyen HTX and Liebman M (2022). Front. Agron. 4:848548. doi: 10.3389/fagro.2022.848548
The Data Availability Statement has been updated to reflect errors in the original dataset. The statement originally read:
“The data from this present study is available at https://doi.org/10.25380/iastate.19111376.v1.”
(Note, the original dataset is still available at that link.)
The statement has been updated to read:
“The data from this present study is available at https://doi.org/10.25380/iastate.19111376.v2.”
In the published article, the models for oat and alfalfa yield data were not explicitly stated. The missing models were two reduced versions of the model described in Equation 2 to appropriately describe the whole-plot harvesting practice applied on oat and alfalfa as detailed in the Crop Yields section of the published article. The reduced models are provided below.
where,
is oat yield,
is the overall mean,
is the block,
is the year,
is the crop identity,
is the block within a year,
is the interaction between crop identity and year,
ϵil is the residual.
where,
R is alfalfa yield,
μ is the overall mean,
B is the block,
Y is the year,
ϵil is the residual.
These have been inserted in the Model Fitting section, after the sentence “R is the individual crop yield, andall the terms in the right-hand side of the model are as defined in Equation (1)”.
As a result of this addition, the text in this section “A different linear mixed-effects model was used to analyze corn, soybean, and oat yields (lme4 version 1.1-27.1, Bates et al., 2015):” has been replaced with “A different set of linear mixed-effects models was used to analyze corn, soybean, and oat yields (lme4 version 1.1-27.1, Bates et al., 2015):” and the text “With this model (Equation 2), we tested the hypothesis that the yield of the same crop species (corn, soybean, and oat) did not differ between rotations.” has been replaced with “With these models (Equations 2, 3, and 4), we tested the hypothesis that the yield of the same crop species (corn, soybean, and oat) did not differ between rotations.”
In the published article, there were 11 errors in Materials and Methods, Table 1.
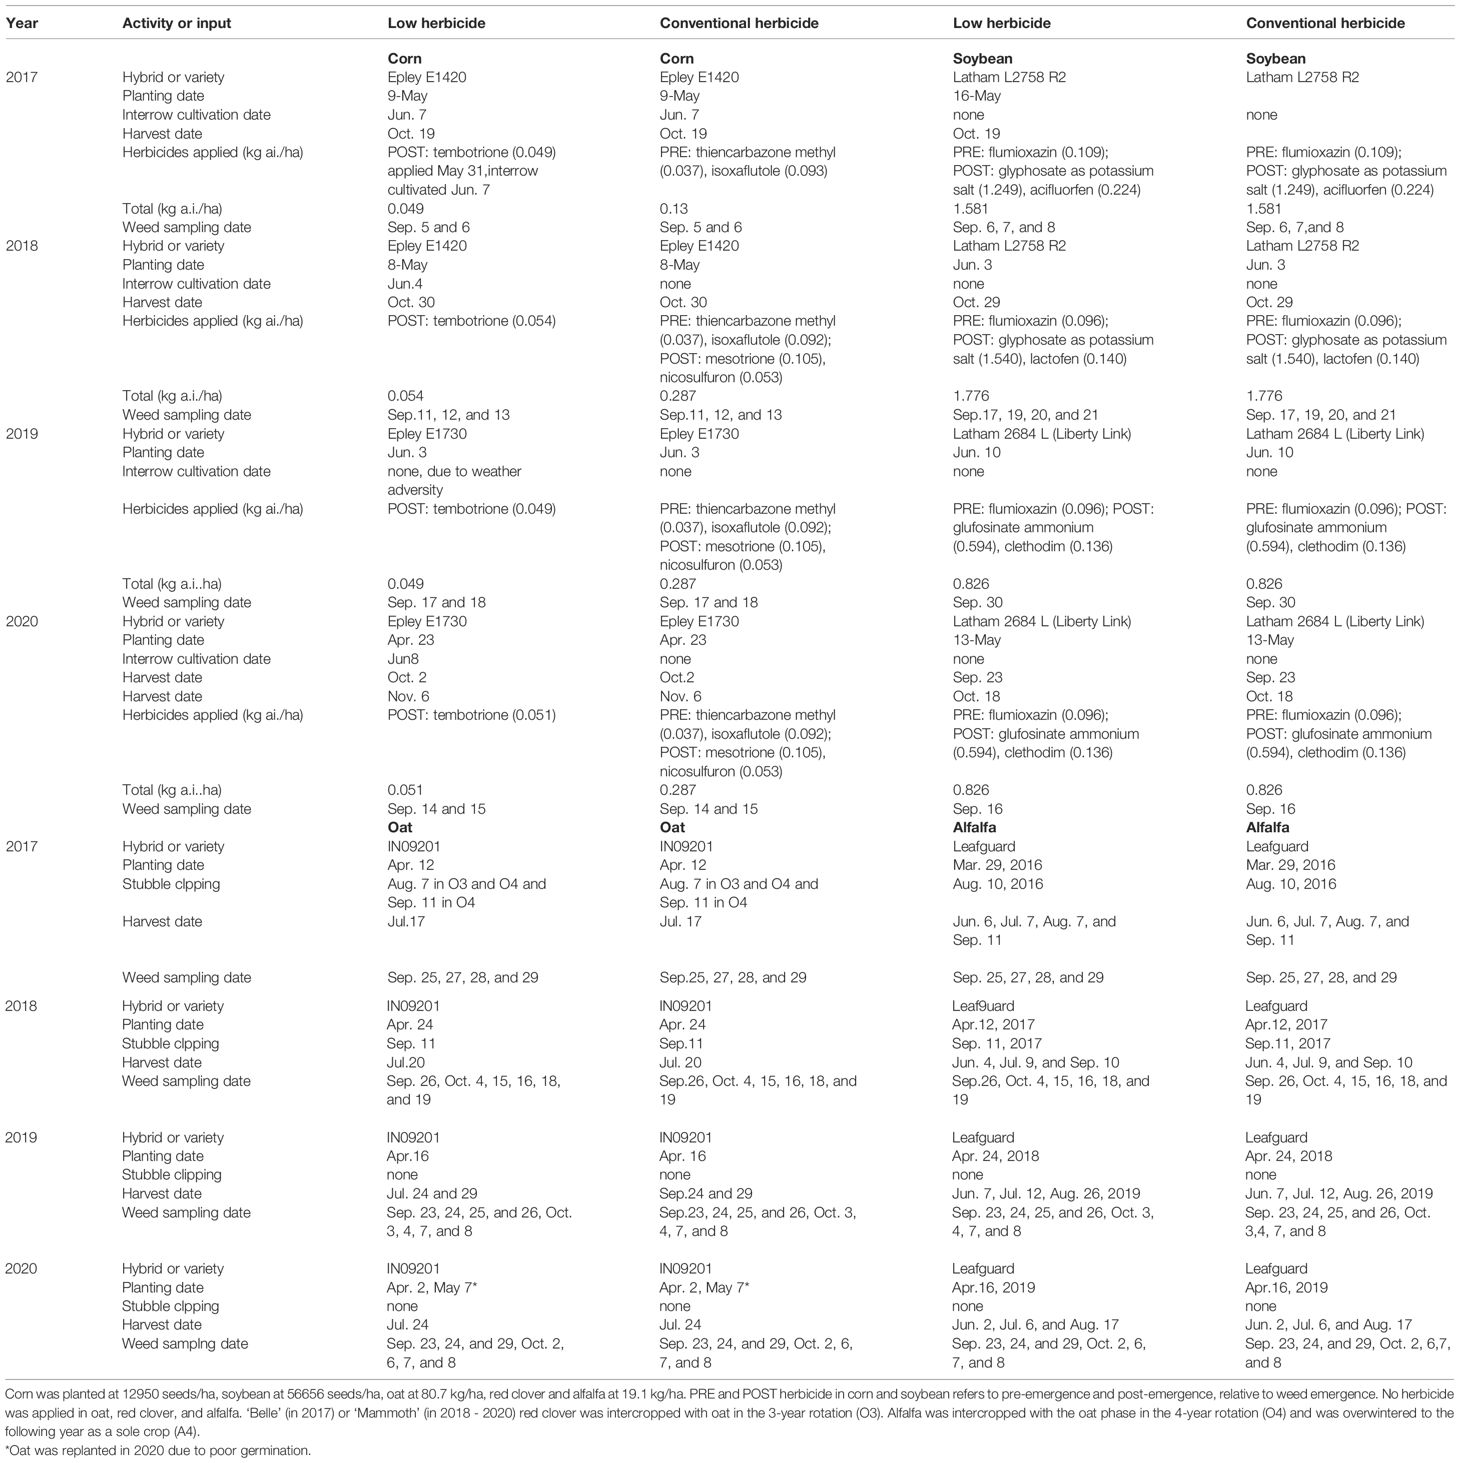
Table 1. Crop variety or hybrid and management from 2017 through 2020 field seasons.
Error 1: The harvest dates were not listed in chronological order relative to other field activities.
Error 2: Missing the herbicide application dates for corn and soybean.
Error 3: Inconsistent format in corn and soybean planting dates of 2017 and 2018 relative to the rest of the dates.
Error 4: Erroneous inclusion of interrow cultivation date of 2017 corn under conventional herbicide.
Error 5: Missing the harvest date of soybean following corn under conventional weed management in 2017.
Error 6: Rounding errors on isoxaflutole amount in 2018 through 2020.
Error 7: Wrong month of 2019 oat harvest.
Error 8: Missing the stubble clipping dates of 2019 oat and alfalfa.
Error 9: Missing three weed sampling dates of 2019 oat and alfalfa.
Error 10: Wrong first date of 2019 alfalfa harvest.
Error 11: Missing the stubble clipping date of 2020 alfalfa (for the oat intercrop that was harvested in 2019).
The updated version is shown below.
In the published article, the accompanying data set had three errors. The first error was with oat yield, in which the crop identity for oat yield data in Plot 47 in 2020 was mislabeled as O4 instead of O3. This error led to an inaccurate model output of oat yields in Table 2 (C) and the “oat grain” panel of Figure 1. In particular, the mean and 95% CI of O3 yield was 3.1 (2.5, 3.8) Mg ha−1 and the mean and 95% CI of O4 was 3.4 (2.7, 4.2) Mg ha−1. The second error was with alfalfa hay yield obtained from the National Agricultural Statistics Service (NASS). The hay yield, originally in ton acre−1 unit was converted to Mg ha−1 unit incorrectly, neglecting the area unit. As a result, the dashed and solid lines for Iowa and Boone yields in the “alfalfa hay” panel were plotted at 3.3 and 3.0 Mg ha−1, respectively. The third error was with alfalfa yield adjustment. The data were plotted in dry mass basis, instead of at 150 g H2O kg−1, as stated in the Crop Yields section in the published article. As a result, the yield at its 95% CI was plotted at 7.3 (3.9, 10.7) Mg ha−1, respectively. The data published at https://doi.org/10.25380/iastate.19111376.v1 has been updated and is available at https://doi.org/10.25380/iastate.19111376.v2.
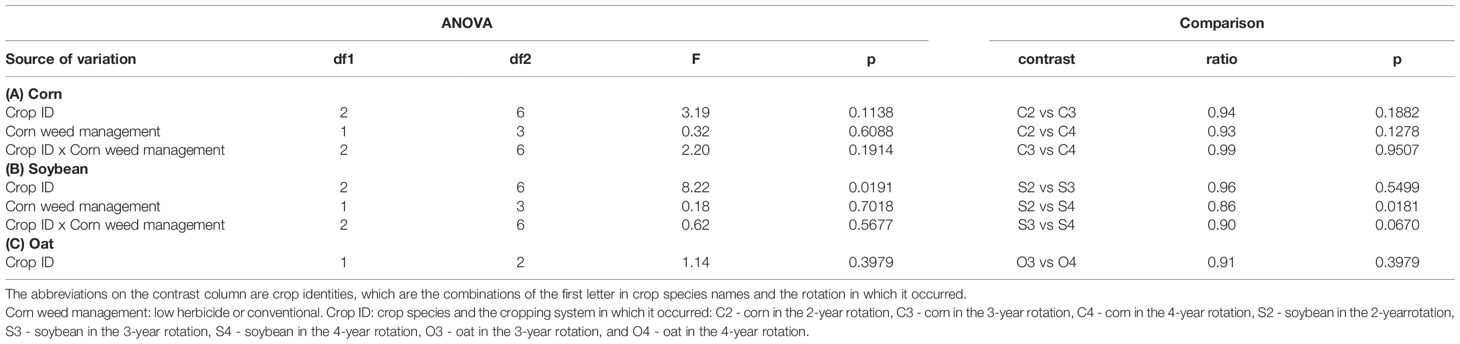
Table 2. Contrasts of rotation effect (expressed by Crop ID) on crop yields.
The updated version of Table 2 is shown below.
Figure 1 has been updated. The caption originally read “Mean crop yields by rotation from 2017 to 2020. The color-coded bars show crop yields (Mg ha−1) in the experiment plots. The error bars show the 95% confidence intervals. The solid horizontal lines show mean yields for Iowa and dashed lines show mean yields for Boone County. Corn, soybean, and alfalfa yields in the experiment were averaged over 4 years, oat grain yields in the experiment were averaged over 2017, 2019, and 2020 because in 2018 oat was harvested for hay. Boone County and Iowa hay yields were averaged over 2017 and 2018 because 2019 and 2020 yields were not available at this writing.” The corrected figure and its caption appear below. The updated caption explicitly states how Iowa and Boone County yields were compiled.
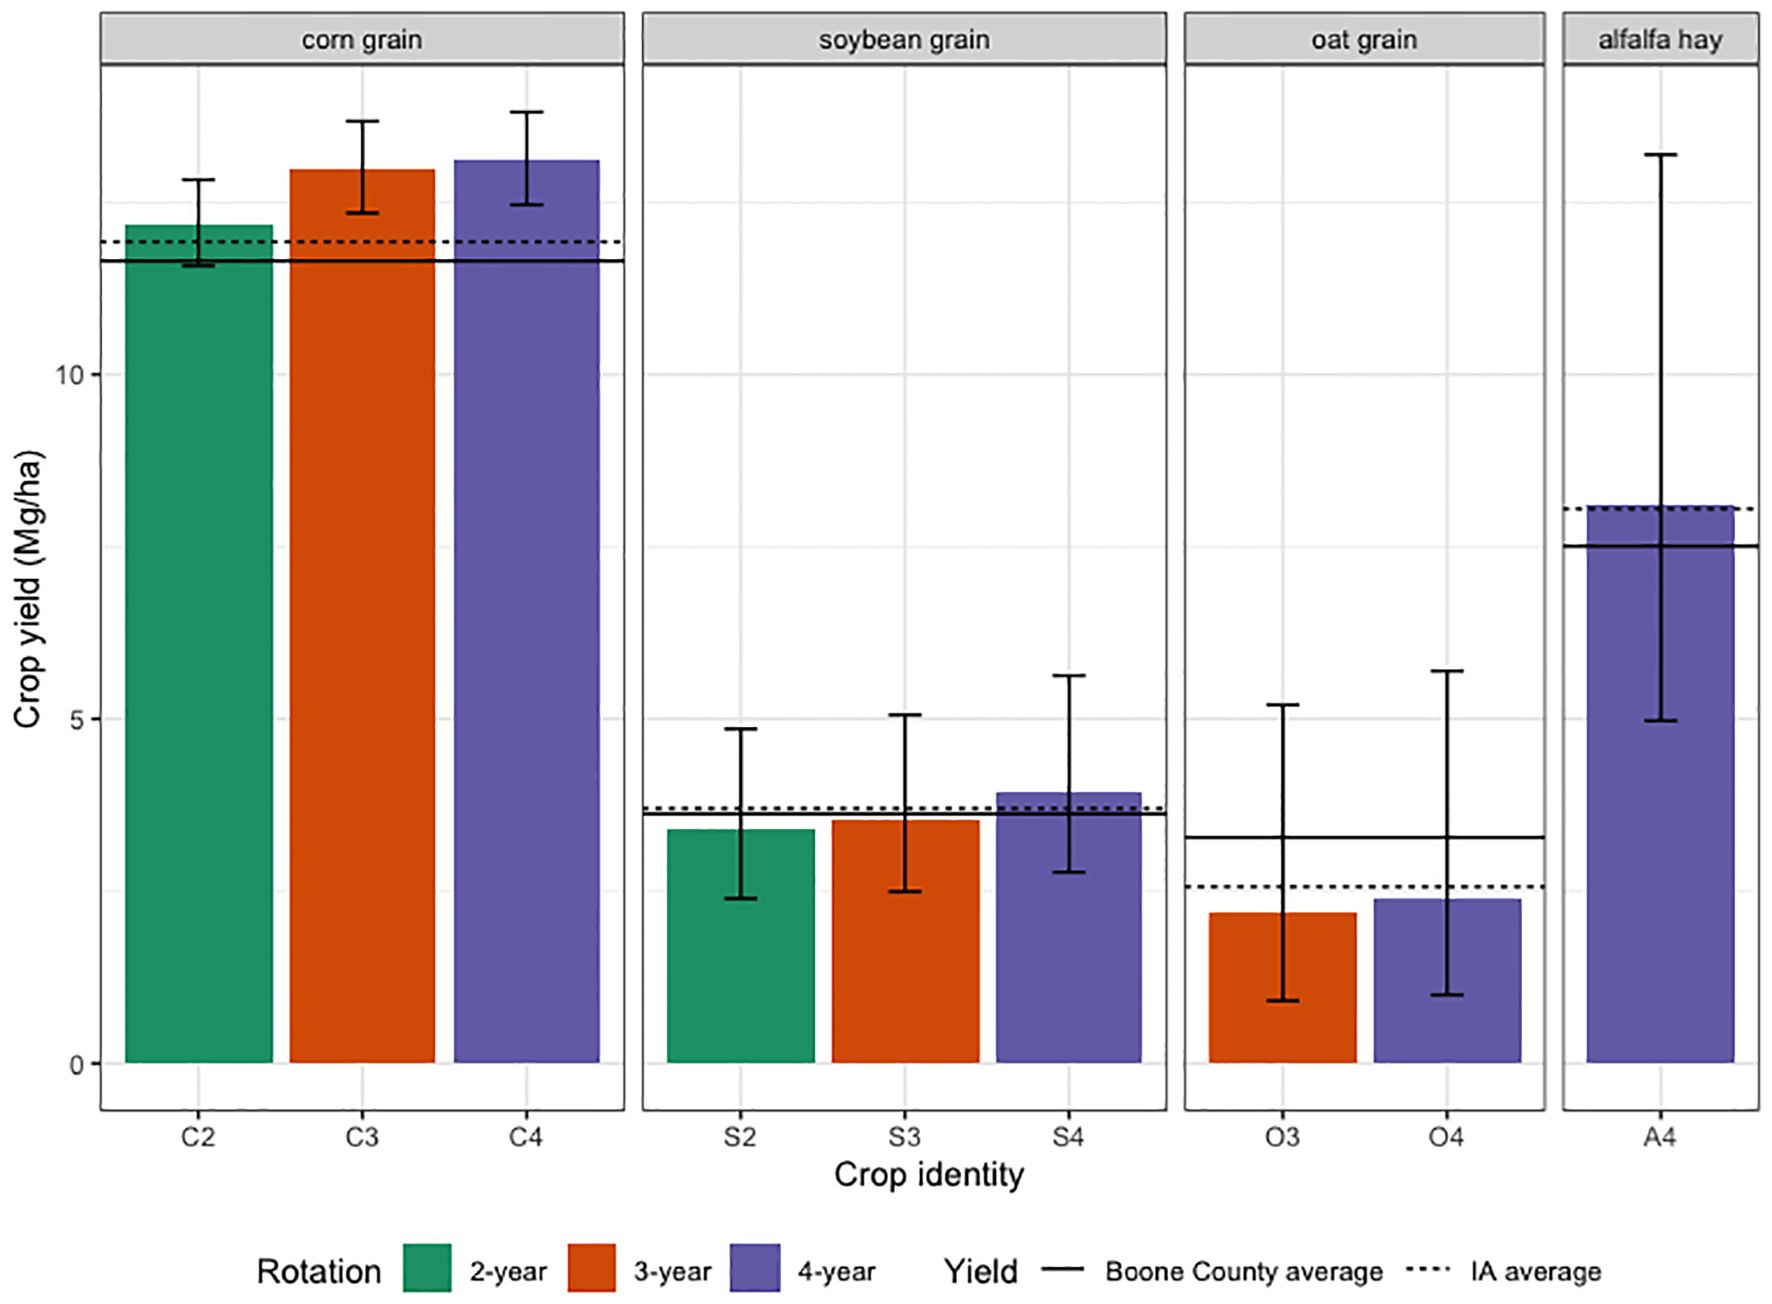
Figure 1. Mean crop yields by rotation from 2017 to 2020. The color-coded bars show crop yields (Mg ha−1) in the experiment plots. The error bars show the 95% confidence intervals. The solid horizontal lines show mean yields for Iowa and dashed lines show mean yields for Boone County. Corn, soybean, and alfalfa yields in the experiment were averaged over four years, oat grain yields in the experiment were averaged over 2017, 2019, and 2020 because in 2018 oat was harvested for hay. Because county-specific alfalfa hay yields in 2019 and 2020 were unavailable at this writing, Boone County alfalfa yield (solid line) was averaged over 2017 and 2018 and Iowa hay yield (dashed line) was averaged from all county-based values in 2017 and 2018 and two state-based values in 2019 and 2020.
The authors apologize for these errors and state that this does not change the scientific conclusions of the article in any way.
Publisher’s note
All claims expressed in this article are solely those of the authors and do not necessarily represent those of their affiliated organizations, or those of the publisher, the editors and the reviewers. Any product that may be evaluated in this article, or claim that may be made by its manufacturer, is not guaranteed or endorsed by the publisher.
Keywords: weed community composition, diversity, evenness, richness, Midwestern-United States, agroecology, integrated weed management
Citation: Nguyen HTX and Liebman M (2024) Corrigendum: Weed community composition in simple and more diverse cropping systems. Front. Agron. 6:1445641. doi: 10.3389/fagro.2024.1445641
Received: 07 June 2024; Accepted: 29 July 2024;
Published: 20 September 2024.
Edited and Reviewed by:
Lauren M. Lazaro, Blue River Technology Inc., United StatesCopyright © 2024 Nguyen and Liebman. This is an open-access article distributed under the terms of the Creative Commons Attribution License (CC BY). The use, distribution or reproduction in other forums is permitted, provided the original author(s) and the copyright owner(s) are credited and that the original publication in this journal is cited, in accordance with accepted academic practice. No use, distribution or reproduction is permitted which does not comply with these terms.
*Correspondence: Huong T. X. Nguyen, aHVvbmdAaWFzdGF0ZS5lZHU=