 Clara Lago
 Alberto Fereres
 Aránzazu Moreno
 Piotr Trębicki
- 1Institute of Agricultural Sciences, Spanish Research Council, Madrid, Spain
- 2Applied BioSciences, Macquarie University, Sydney, NSW, Australia
- 3Agriculture Victoria, Grains Innovation Park, Horsham, VIC, Australia
- 4School of Agriculture and Food, The University of Melbourne, Parkville, VIC, Australia
Introduction: Canola (Brassica napus L.) is one of the most important crops worldwide. Turnip yellows virus (TuYV), transmitted by aphids, is one of the most damaging viruses affecting canola crops and is challenging to control. With the prediction of more intense and prolonged drought events due to future climate change, an additional factor may extensively impact the epidemiology of plant diseases. This study aimed to understand the impact of drought on canola plants infected with TuYV and to explore the relationship between virus infection and drought.
Methods: Two glasshouse experiments were conducted: 1. Competition: Four plants (two infected, two non-infected) were grown in the same pot. 2. No Competition: One plant was grown per pot.
In both experiments, infected and non-infected canola plants were exposed to well-watered conditions, water stress (simulated drought), and terminal drought. Various plant traits were recorded, including biomass, leaf area, height, number of leaves, chlorophyll content, water use efficiency, and virus symptom expression.
Results: Both virus infection and water stress reduced dry biomass, leaf area, and height. Virus infection alone reduced canola biomass by up to 49% compared to non-infected, well-watered controls. Under water stress or terminal drought, the biomass of TuYV-infected plants was further reduced by up to 71% and 65%, respectively. Virus infection also reduced the number of leaves, although water treatment alone did not. Chlorophyll content was higher in water-stressed and terminal drought plants compared to well-watered ones, while virus infection reduced chlorophyll content. The impact of drought and virus infection was more pronounced when plants were under competition.
Discussion: Given the expected increase in prolonged and frequent droughts in many canola-growing regions due to climate change, a significant detrimental effect on canola production due to the combined influence of drought and TuYV is anticipated. This study underscores the need for developing mitigation strategies to protect canola production in a changing climate.
1 Introduction
The Earth’s environment currently faces a critical challenge due to persistent greenhouse gas emissions, amplifying several climatic threats. Since the industrial revolution, carbon dioxide (CO2) concentrations have surged to alarming levels, surpassing 400 μmol/mol, with projections anticipating a potential escalation beyond than double by the end of this century. This surge in greenhouse gas emissions triggers a cascade of events, not only impacting heat retention, but also increasing the frequency and intensity of extreme weather events, such as heatwaves, floods, and droughts. These factors exert a profound impact not only on the global climate but also on all living organisms (IPCC, 2023).
In this intricate framework, understanding the potential challenges that climate change might induce, along with the damage caused by plant diseases, becomes of paramount importance, as climate change directly impacts host plants, pathogens, insect vectors and the interactions between them (Trębicki, 2020). This urgency is driven by the need to ensure food security as the global population rises, while the capacity for increasing food production is projected to decline, undermining the human capacity for achieving global food security (Jones and Barbetti, 2012). Despite the efforts to implement control strategies, up to 40% of global crop yields are annually lost due to pests and plant diseases, costing around $220 billion to the global economy (FAO, 2021).
Several studies have explored how key climate change factors such as elevated temperatures, increased CO2 levels, and altered water availability, will impact plant pathogens across landscapes and crops (e.g. Chakraborty and Newton, 2011; Daugherty et al., 2017; DeLucia et al., 2012). Whether acting simultaneously or sequentially, plants may encounter multiple stresses from both combined abiotic factors (e.g. high temperatures, drought, elevated CO2) and biotic agents (pathogenic infections), noticeably, many epidemics represent scenarios where multiple stresses occur.
Among abiotic stressors predicted to intensify under climate change, droughts have emerged as a major threat to agriculture (Ebi et al., 2020; IPCC, 2023). Drought is characterized by a deficiency in precipitation and an imbalance between water supply and demand resulting in a deficiency in water availability for plants (Farooqi and Srinivasappa, 2012; Schulze et al., 2019). Drought is a major cause of yield losses, posing a great threat to food production worldwide (El-Badri et al., 2021). The plant stress hypothesis predicts that abiotic stresses by impacting plant physiology may reduce plant defence response towards pests and diseases (Joern and Mole, 2005). Drought reduces plant growth and affects plant physiology which can make plants more susceptible to pathogens, including viruses (Chaves et al., 2009). However, while some studies show that viruses have a detrimental impact on water stressed plants, others suggest that virus infection primes plants to cope better with drought. These contrasting results illustrate the complexity of the relationships between virus infected plants and drought stress. For example, Manacorda et al. (2021) observed that despite turnip mosaic virus (TuMV) induced stomatal closure on Arabidopsis thaliana, reducing water losses in infected plants, plant mortality was higher in TuMV-infected plants when subjected to drought stress. Similarly, Price et al. (2010) explored the impact of wheat streak mosaic virus (WSMV) on susceptible and resistant cultivars of Triticum aestivum subjected to three water regimes (30, 60 and 80% of soil saturation capacity). Root biomass and water use efficiency of inoculated susceptible plants was significantly lower than the noninoculated control plants in all water treatments. On the contrary, in the resistant cultivar, significance was only found in the 30 and 60% water regimes for root weight and water use efficiency, respectively. Furthermore, significant reductions in forage, grain yield, and crop water use efficiency were observed in the inoculated susceptible plots compared with the non-inoculated plots. In this context, it is worth mentioning that aphid performance was negatively affected under any level of plant water stress, but the correlated changes in plant quality are reliant on the intensity of water stress. Under mild levels of water stress, poor aphid performance was correlated with increased plant defences, but no change in plant nutritional quality (Kansman et al., 2022). Under high levels of water stress, poor aphid performance was correlated with lower amino acid concentrations, high sugar concentrations, and increased plant defences (Kansman et al., 2022).
On the contrary, other studies show neutral or even positive effects of viruses under drought stress. For example, Bergès et al. (2020) show that cauliflower mosaic virus (CaMV) was neutral or enhanced the survival rate of droughted Arabidopsis thaliana seedlings in comparison to well-watered controls. Furthermore, González et al. (2021) reported that TuYV-infected A. thaliana plants evolved under drought conditions were able to survive at a much higher rate than noninfected plants, suggesting that virus infection made plants more tolerant to drought. Similarly, Aguilar et al. (2017) observed that Nicotaniana benthamiana and A. thaliana improved drought tolerance when they were infected with plum pox virus (PPV) and potato virus X (PVX) on both, single and mixed infected plants.
Among oilseeds, canola (Brassica rapus L.) is a major crop cultivated worldwide (Friedt et al., 2018). Canola is highly susceptible to drought which reduces its growth, resulting in lower crop yields (Ahmar et al., 2019; Khanzada et al., 2020). Turnip yellows virus (TuYV) is an aphid-borne, circulative, non-propagative, and phloem-restricted virus that severely affects canola crops (Juergens et al., 2010), resulting on leaf yellowing and reduced growth (Coutts et al., 2010; Jones et al., 2007; Schwinghamer et al., 2009; Stevens et al., 2008). Considering the individual impacts of drought stress and TuYV infection on canola crops, and the complexity of the relationships between viruses and abiotic stresses, the combination of drought and TuYV in a climate change context may challenge canola crop production.
Therefore, the aim of the present work was to explore the effect of drought on canola plants previously infected with TuYV by measuring several traits of canola plants on isolated potted plants and plants growing together in the same pot.
2 Materials and methods
In this study, we investigated the impact of drought on canola plants infected with turnip yellows virus (TuYV). Two experiments were conducted to assess the effects of different irrigation regimes and virus infection on various growth factors of canola plants: A competition experiment and a no competition experiment. Both experiments were carried out under controlled conditions in a glasshouse with a temperature of 20°C and natural daylight. The experiments were conducted from 14th of December 2022 to 2nd February of 2023 in Horsham, VIC, Australia.
2.1 Experimental design for the competition and no competition experiments
2.1.1 Competition experiment
For this experiment, four canola plants were grown together in each pot (42 × 16 cm), with two plants inoculated with TuYV and two non-inoculated plants (Figure 1A). Each pot was divided into four sectors, and three canola seeds were sown in each sector. After germination, one seedling per sector was maintained, and the extra seedlings were removed (four plants per pot). A total of 40 pots were used in this experiment, 15 pots were maintained under well-watered conditions (100% capacity), 15 pots were subjected to water stress (60% capacity), and 10 pots to terminal drought (watering stopped after maintaining the plants at 100% capacity) (Figure 1A).
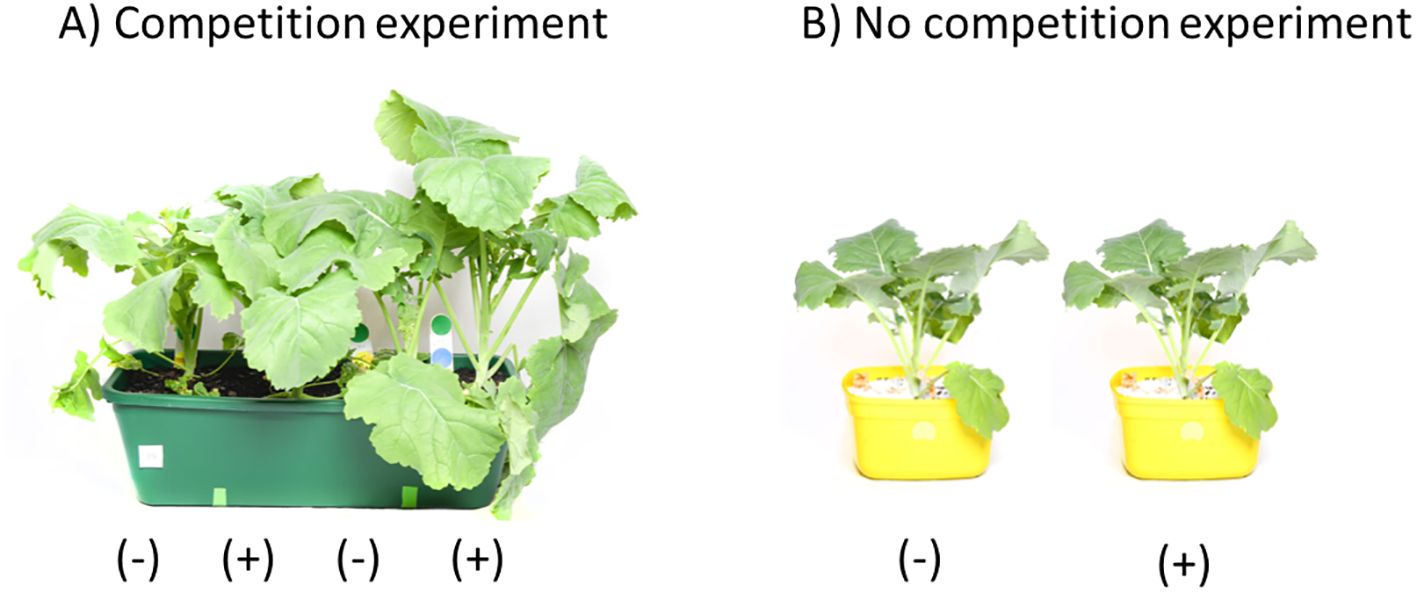
Figure 1. Experimental design (A) competition conditions and (B) no competition conditions.
2.1.2 No competition experiment
For this experiment, one canola plant was grown in each pot (15x15cm) (Figure 1B). Two seeds were sown per pot, and after germination, one seedling was maintained per pot and the other one was removed. A total of 90 pots were used in this experiment, with 36 pots maintained under well-watered conditions, 36 pots under water stress, and 18 pots subjected to terminal drought. Half of the plants in each water treatment were inoculated with TuYV, while the other half remained non-inoculated (Figure 1B).
2.2 Soil and plants
The substrate used consisted of an oil cereal potting mix, comprising various components, including osmoform (2 kg ICL group, Telaviv, Israel), osmocote (2 kg 8–9 ICL group, Telaviv, Israel), Macrocote Coloniser Plus (1 kg 3–4 Langley fertilizers, Western Australia), trace elements Micromax premium (225 g ICL group, Telaviv, Israel), iron Lib Fer SP (225 g BASF Ltd), soil saturator (2 kg Yates, DuluxGroup, Australia), lime, (10 kg Sibelco, Australia) and soil (1 m3). Canola seeds (Bonito Cultivar) were directly sawn into the potting mix. Bonito cultivar was selected since it is widely used in Australia and is susceptible to TuYV (Congdon et al., 2020). Pots were watered daily to maintain a humidity level of 75–80% until the initiation of the water treatments.
2.3 TuYV inoculation
Canola plants were inoculated with TuYV at the one-true-leaf stage (13 days after sowing) (Figure 2). The treatments included TuYV-inoculated plants and non-inoculated control plants. For the non-inoculated treatment, plants were covered with cups. In the inoculation treatment, five viruliferous aphids (Myzus persicae Sulzer) were placed on each plant. The plants were immediately covered with cups (as in non-inoculated treatment) to contain the aphids and prevent contamination of nearby plants. In the competition experiment, aphids were kept on the plants for an inoculation access period (IAP) of 72h. After removing the cups some seedlings died. Therefore, for the no competition experiment aphids were kept on the plants for an IAP of 48h. In both experiments, after the IAP the cups were removed, and all the plants were sprayed with pyrethrum (0.65 liters/ha Multicorp SL) and confidor (Dose: 200 g/L; Bayer ®) to eliminate the aphids. At harvest (Figure 2), three steams of each plant were randomly collected and tested for TuYV infection using tissue blot immunoassay (TBIA) as described by (Freeman et al., 2013).
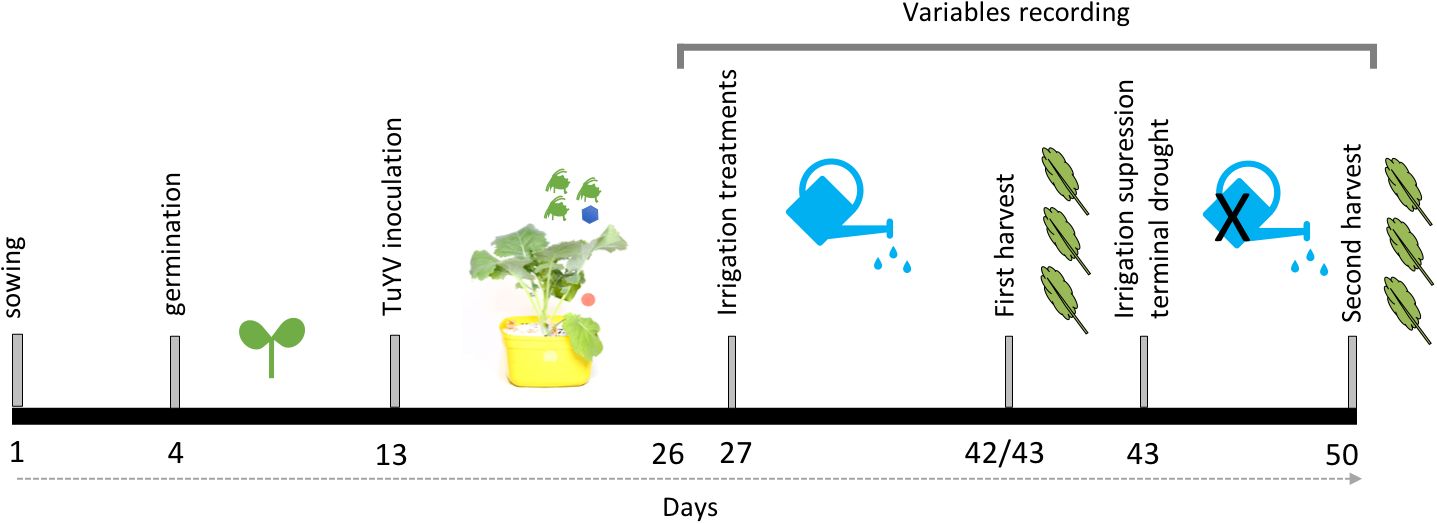
Figure 2. Timeline of experimental procedures.
2.4 Irrigation regime treatments
Three irrigation treatments were employed: 1) well-watered (control), maintaining plants at 100% field capacity since day 27; 2) water stress, maintaining plants at 60% field capacity since day 27; and 3) terminal drought, maintaining plants at 100% field capacity until day 42 (latest irrigation date) of the assay, after which watering was ceased (Figure 2). To determine the field capacity, paper bags filled with 500 g of potting mix were dried in an oven at 60°C until weight stabilization (72 h). The dry soil weight was recorded as the 0% mark. Water was added until saturation when liquid percolated and the wet saturated soil was weighed. By using dry and saturated weight, the final weights required to achieve 100% and 60% field capacity in each pot were calculated. The irrigation treatments commenced on day 27 of the assay, and the frequency of irrigation was adjusted to prevent plants from losing more than 20% of the required water for the specific irrigation regime (e.g., control plants always had water available above 80% of field capacity, and water-stressed plants had water above 40%).
2.5 Variables measured
Two types of measurements were recorded, continuous measurements and destructive measurements. The continuous measurements were recorded in all the plants twice a week from day 26 (one day before starting the irrigation treatments, see Figure 2) until the harvest (continuous measurements were evaluated a total of seven days), except for transpiration, which was recorded 3–4 times a week (transpiration was evaluated a total of 20 days). The following continuous measurements were recorded:
‐ Plant height: The height of each plant was measured from the ground to the top part of the uppermost leaf.
‐ Number of leaves: The number of true leaves was counted.
‐ Chlorophyll: Leaf chlorophyll content was measured using a SPAD-502 device. The SPAD index was measured in three fully expanded leaves from day 26 until day 41. Subsequently, chlorophyll measurements were taken on three newly expanded leaves and three old expanded leaves until harvest.
‐ Flowering: The number of flowers and inflorescences were recorded.
‐ Evaluation of TuYV symptoms: Plants were inspected visually for TuYV symptoms: i.e yellow or purple colors at the ends or edges of older leaves; yellowing in the middle of the leaf; petioles and leaf veins green or pale. Symptoms of TuYV infection were quantified using a visual scale ranging from 0 to 100 as a percentage of infected leaves and a percentage of infection per leaf.
‐ Transpiration: Pots were weighed each time plants were watered, and transpiration was calculated as the weight difference between two successive dates.
The destructive measurements were taken twice over the duration of the experiments. In the competition experiment, four pots of water stress and control treatments were selected for the first destructive sampling on day 42, resulting in eight non-inoculated and eight TuYV-inoculated plants per treatment. In the no competition experiment, ten plants of water stress and control treatments, half TuYV-inoculated and half non-inoculated, were selected for the first destructive sampling on day 43, resulting in five plants per treatment. In both assays, the remaining plants were subjected to destructive measurements at the end of the assay (Figure 2). The following destructive measurements were recorded:
‐ Leaf area: Leaves were removed from the plants and placed on a whiteboard containing a scale. Photos of excised leaves were taken using a camera mounted on a tripod at a fixed distance to the whiteboard. The leaf area was calculated from the photos using Fiji-Image J software (version: 1.54b 08).
‐ Dry biomass: The above-ground parts of the plants were cut and placed inside paper bags. The plants were dried in an oven at 60 °C until their weight stabilized (72 h). Subsequently, the dry plants were weighed.
2.6 Data analyses
We used SPSS 21.0 software (IBM Statistics SPSS Inc) to fit statistical models for the experimental sources of variation, virus treatment, water regime and their interaction for all plant traits: total dry biomass (g), and total leaf area (cm2), for plants harvested at the first and second destructive samplings; number of inflorescences, and flowers at the end of the assay; and plant height (cm), number of leaves, and chlorophyll (SPAD) measured during the experiment seven times. In the competition experiment Linear Mixed Models (LMMs) and Generalized Mixed Models (GLMMs) were fitted for all plant traits including infection and water treatment as fixed factor and pot as a random factor. We calculated the percentage change of dry biomass and leaf area per treatment using control (well water noninfected) as reference. For continuous measurements sampling date was included as fixed factors, also LMMs were fitted for each evaluation date. For the no competition experiments Linear Models (LMs) were fitted for all plant traits including infection and water treatment as fixed factors. For continuous measurements, sampling date was included as fixed factor and also LMs were fitted for each evaluation date. In both experiments, pairwise comparisons between treatments were assessed using t-tests and Kruskal Wallis pairwise comparisons. We analyzed statistically the relationship between virus and water treatment by considering the p-value for water-virus interactions by ANOVA (Sadras, 1997; Sadras et al., 2023). In addition, we calculated the actual-to-additive ratio (ATAR) by propagating the errors and calculated the 95% confidence interval for the ATAR for some relevant plant traits (dry biomass, leaf area, number of inflorescences and number of flowers) (Grace, 1995; Sadras, 1997). The actual-to-additive ratio, indicates the type of relationship between the two interacting factors (water stress and virus infection as follows: Ratio >1, synergistic; Ratio = 1, additive; Ratio <1, antagonistic (Sadras et al., 2023).
3 Results
3.1 Effect of water treatments on canola plants infected with TuYV under competition conditions
Out of the initial 160 seedlings, 13 plants (nine TuYV-inoculated and four non-inoculated) did not survive before the initiation of water treatments. Additionally, four pots contained two or more dead plants, leading to their exclusion from the analysis. Furthermore, based on TBIA virus testing, six non-inoculated plants tested positive for TuYV, while 13 TuYV-inoculated plants showed negative results. Consequently, these plants were excluded from further analyses. A total of 124 plants were considered for statistical analyses (well water (−)=22; well water (+)=24; water stress (−)= 28; water stress (+)= 20; terminal drought (−)= 16; terminal drought (+)= 18).
Under competition conditions, both water treatments and virus infection exhibited significant effects on several analysed factors. Overall, the growth of canola plants was substantially impaired when subjected to combined drought stress and viral infection. It is important to highlight that plants under terminal drought were watered until 100% of the field capacity, as well as the well-watered plants, until day 42 of the experiment, when plants were stop watered.
3.1.1 Impact of water treatments and virus infection on dry biomass and leaf area
3.1.1.1 Plants harvested during the first destructive sampling (day 42)
We calculated the reduction of dry biomass and leaf area (expressed as the percentage change) induced by water treatment and viral infection using control (well water noninfected) as reference: there was no substantial change in infected well water plants (−4.91%), but reduction in plant biomass in noninfected plants under water stress 17.33% and for infected plants under water stress 61.52% was recorded (Supplementary Figure 1). The percentage change of leaf area in infected well water plants was not recorded (0.29%), but reduced across noninfected plants under water stress 36.42% and in infected plants under water stress 66.92% (Supplementary Figure 1). When plants were under water stress, dry biomass and the leaf area were significantly lower on infected plants compared to noninfected plants (Figures 3A, B). In contrast, no significant differences were found between infected plants compared to noninfected plants under well-water conditions (Figures 3A, B). Furthermore, on infected plants, the dry biomass and the leaf area were significantly lower on plants under water stress compared to well-watered ones (Figures 3A, B). At the same time no differences were observed in noninfected plants between water-stressed and well-watered plants (Figures 3A, B). In addition, the effect of the water regime and virus inoculation was additive, i.e. p-value ≥ 0.05 for the interaction and ATAR values showing additivity (Supplementary Table 1). All the models are reported in Supplementary Table 1. No plants from terminal drought treatment were collected at this point of the experiment.
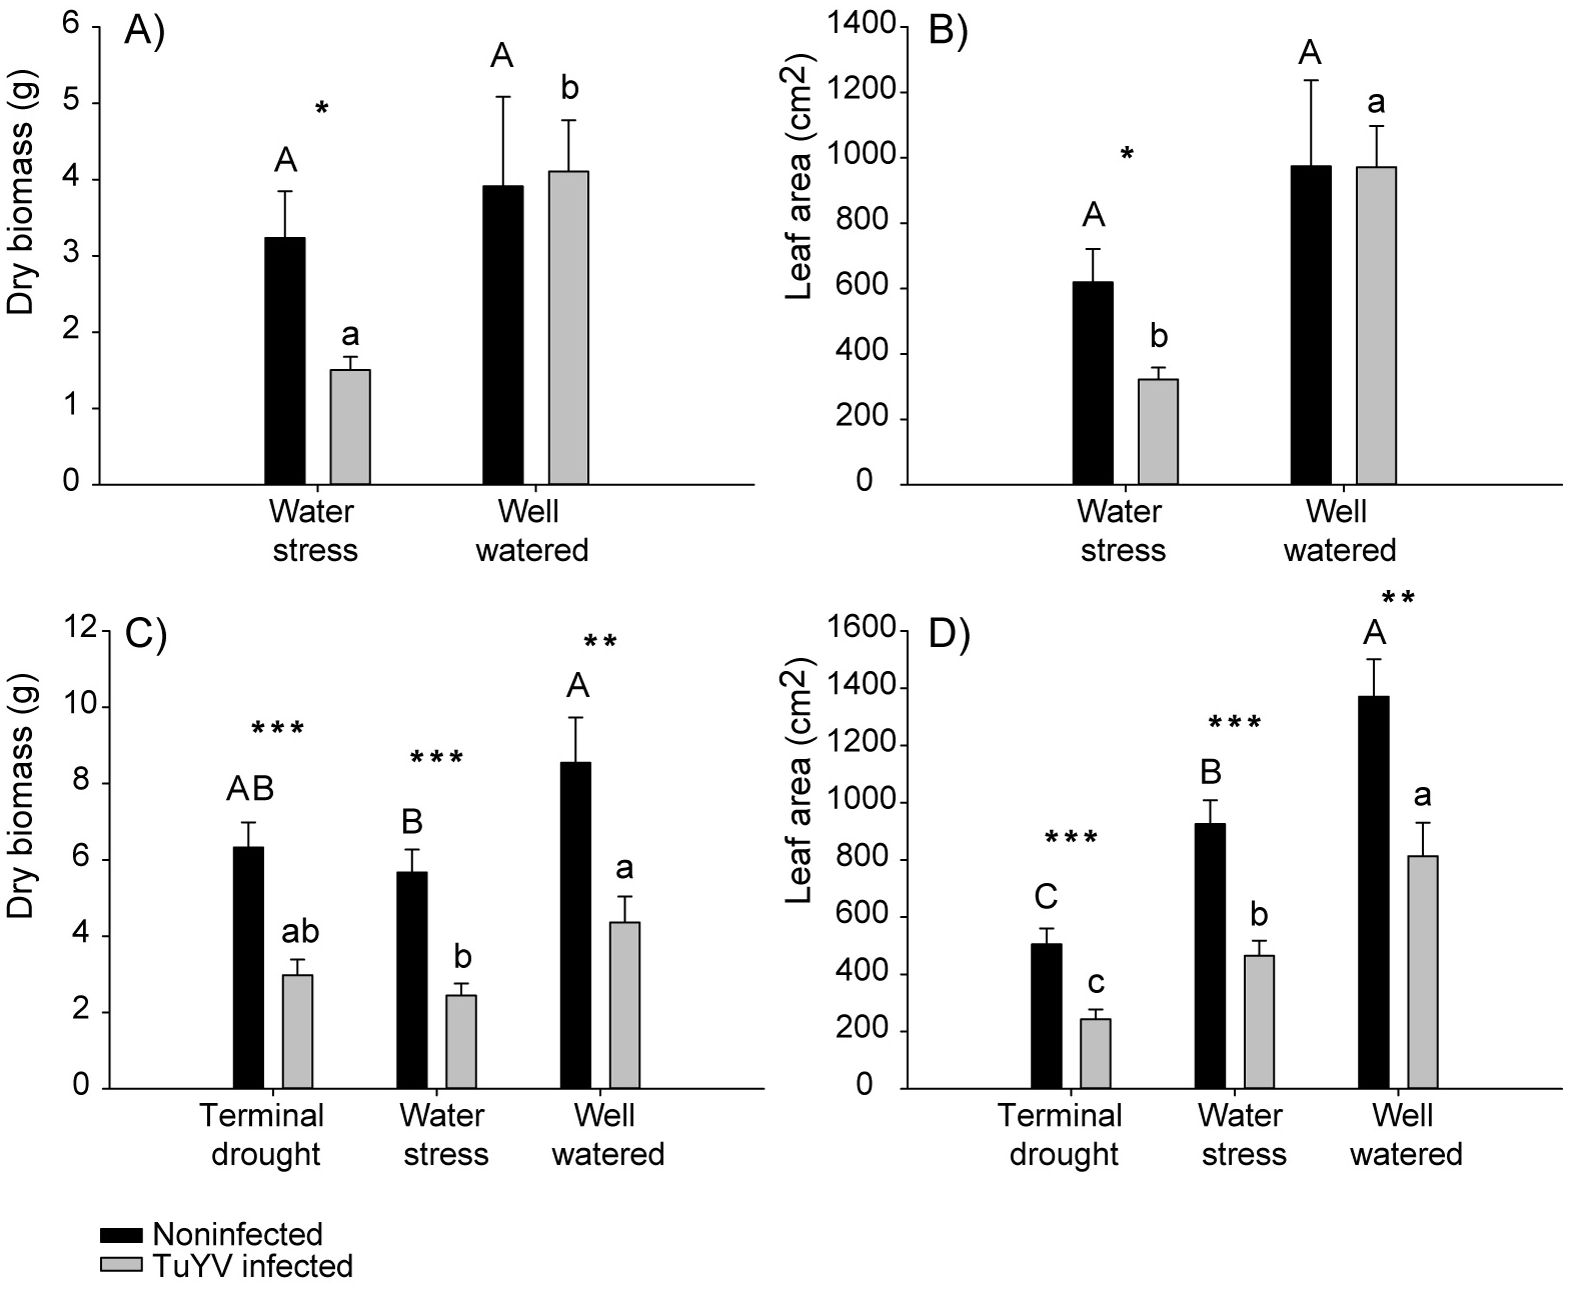
Figure 3. Competition experiment, impact of irrigation treatment and TuYV infection on dry biomass and leaf area. The capital letters refer to significant differences of non-infected plants between irrigation treatments and the lowercase letters refer to significant differences of TuYV infected plants between irrigation treatments. * indicates significant differences between TuYV-infected and non-infected plants within each irrigation treatment, with a p-value < 0.05, ** significant differences with a p-value < 0.01 and *** with a p-value < 0.001. Mean standard error bars are also shown. (A) Mean dry biomass from plants harvested on the first destructive sampling. (B) Mean leaf area (cm2) from plants harvested on the first destructive sampling. (C) Mean dry biomass from plants harvested on the second destructive sampling. (D) Mean leaf area (cm2) from plants harvested on the second destructive sampling.
3.1.1.2 Plants harvested during the second destructive sampling (day 50)
There was a substantial reduction in plant biomass, expressed as the percentage change. For infected plants in well-watered conditions, the reduction was 48.96% (Supplementary Figure 1). Noninfected plants under water stress experienced a reduction of 33.62%. Infected plants under water stress showed a reduction of 71.40%, while noninfected plants under terminal drought experienced a reduction of 25.97% (Supplementary Figure 1). For infected plants under terminal drought, the reduction was 65.12% (Supplementary Figure 1). The leaf area was reduced in infected well water plants by 40.65%, in noninfected plants under water stress by 32.48%, in infected plants under water stress by 66.10%, in noninfected plants under terminal drought by 63.19% and for infected plants under terminal drought by 82.26% (Supplementary Figure 1). The dry biomass was significantly lower on infected plants compared to noninfected ones in the three water treatments and the same result was obtained for leaf (Figures 3C, D). Furthermore, on infected plants, the dry biomass was significantly lower on plants under water stress compared to well-watered plants while no significant differences were found on infected plants subjected to terminal drought compared to water stress or well-watered plants (Figure 3C). Similarly, on noninfected plants, the dry biomass was significantly lower on plants under water stress compared to well-watered plants while no significant differences were found on infected plants subjected to terminal drought compared to water stress or well-watered plants (Figure 3C). Also, the leaf area on infected plants was significantly lower on plants under water stress and terminal drought compared to well-watered plants, and leaf area was significantly lower on plants under terminal drought compared to well-watered plants (Figure 3D). Similarly, leaf area on noninfected plants was significantly lower on plants under water stress and terminal drought compared to well-watered plants, and leaf area was significantly lower on plants under terminal drought compared to water stressed plants (Figure 3D). In addition, the effect of the water regime and virus inoculation was additive, i.e. p-value ≥ 0.05 for the interaction and ATAR values showing additivity (Supplementary Table 1). All the models are reported in Supplementary Table 1.
3.1.2 Impact of water treatments and virus infection on plant height, number of leaves and chlorophyll content
Plant height, number of leaves and SPAD (as a measure for chlorophyll content) changed during the experiment depending on the evaluation day and the treatment. In addition, the effect of water regime and virus inoculation was additive in the three plant traits in all evaluation dates, i.e. p-value ≥ 0.05 for the interaction (Supplementary Table 1). All the models are reported in Supplementary Table 1.
3.1.2.1 Plant height
For well-watered plants, plant height was significantly lower for infected plants compared to noninfected plants on days 41 and 45, while no significant differences were found on the rest of the evaluation days (Figure 4A). In contrast, under water stress, plant height was significantly lower for infected plants compared to noninfected plants on all the evaluation dates (Figure 4B). Under terminal drought, no significant differences between infected plants compared to noninfected were recorded during all sampling dates (Figure 4C). For noninfected plants plant height was significantly lower for plants under water stress compared to well water on days 38 and 41, it was also lower for plants under water stress compared to terminal drought from day 32 until day 45, and on day 48, after plants under terminal drought were stop watered no significant differences were found between water stress and terminal drought plants (Figures 4A–C). No significant differences were found between well-watered and terminal drought plants at any sampling dates, regardless the virus infection (Figures 4A, C). In contrast, for infected plants, the plant height was significantly lower for water stressed plants compared to well-watered ones from day 35 until the last evaluation date and was lower for plants under water stress compared to terminal drought plants from day 35 until day 45 (after watering of terminal drought plants stopped) (Figures 4A–C).
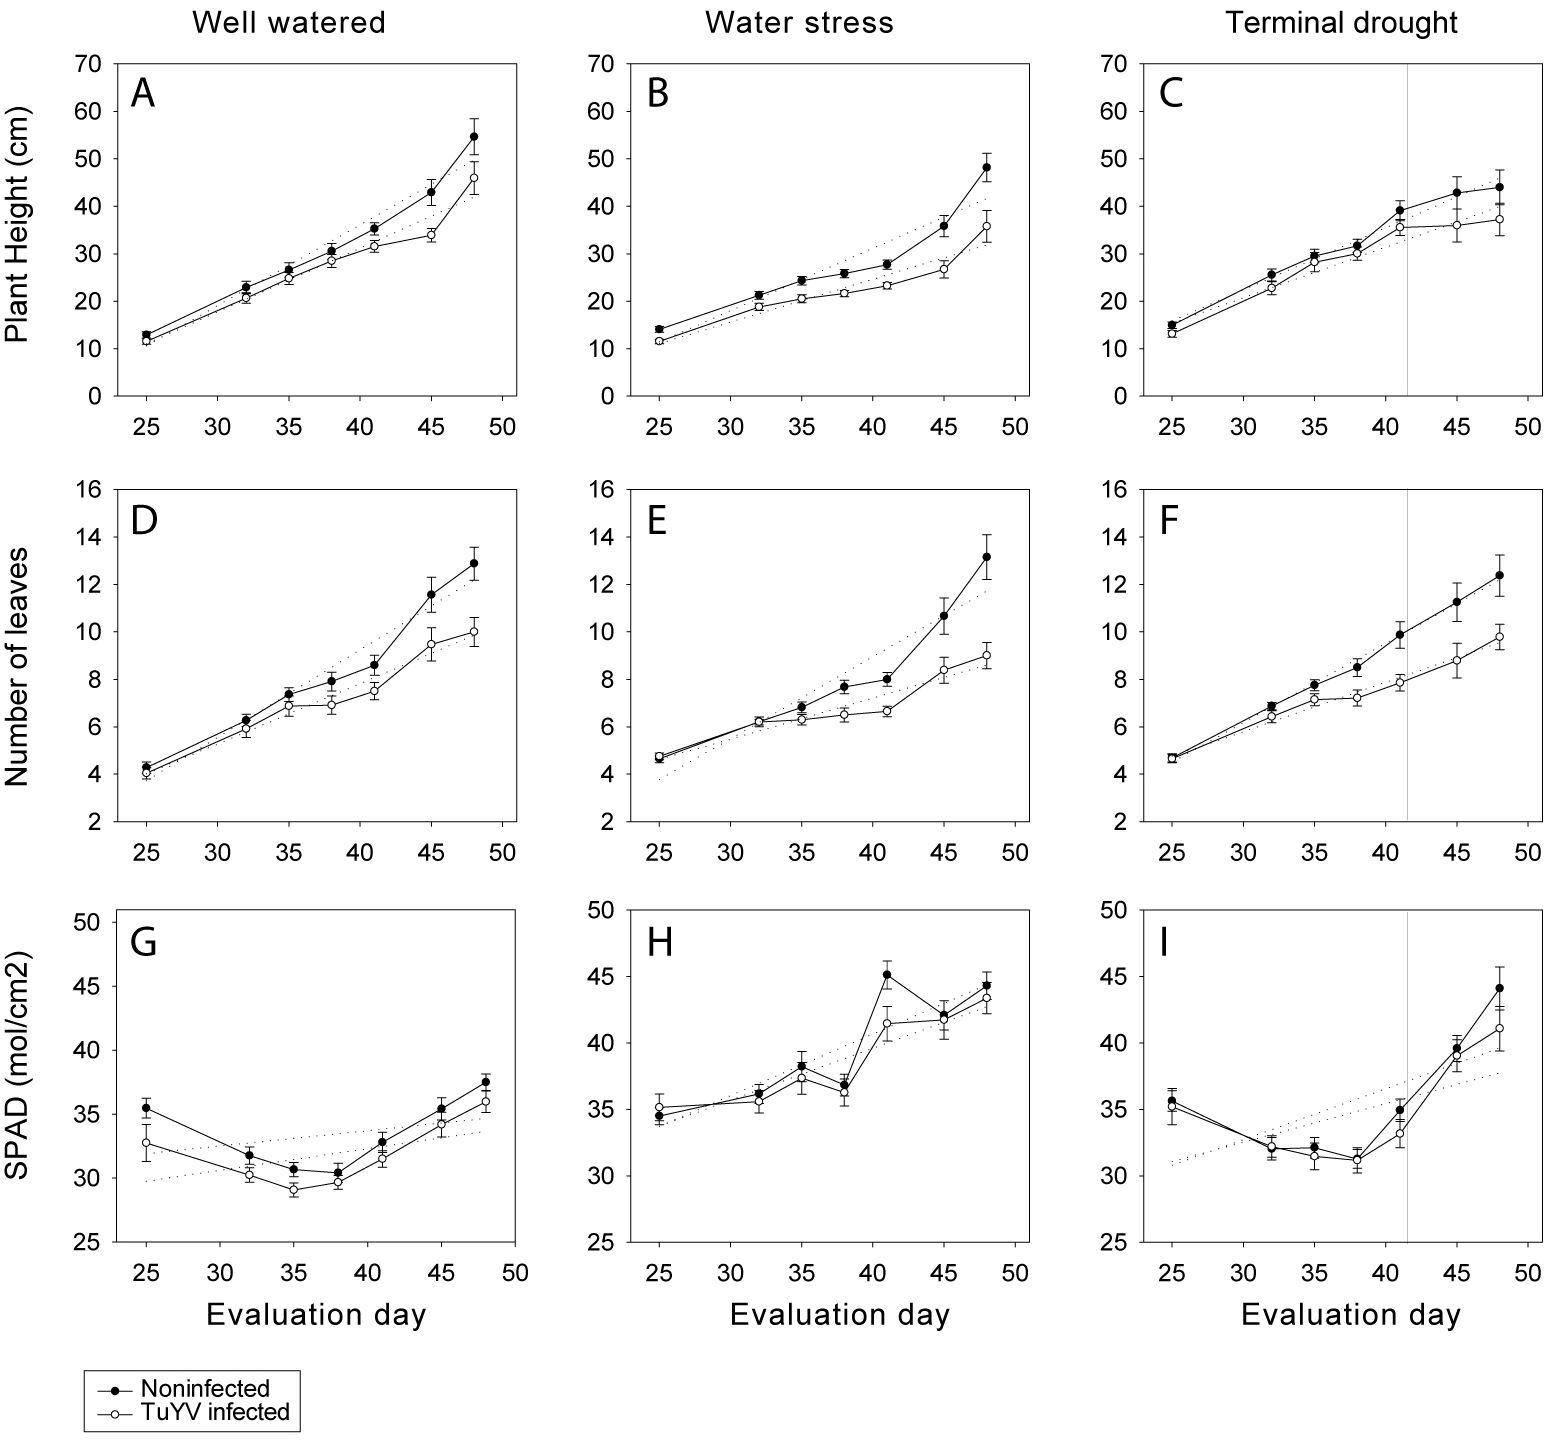
Figure 4. Competition experiment. Plant height (cm) (A–C), number of leaves (D–F) and SPAD (G–I) under well-watered, water stress, and terminal drought conditions. Mean values of different canola growth factors by different treatments on days 25 (10-01-2023), 32 (17-01-2023), 35 (20-01-2023), 38 (23-01-2023), 41 (26-01-2023), 45 (30-01-2023), and 48 (02-02-2023). Mean standard error bars are also shown.
3.1.2.2 Number of leaves
Number of leaves was significantly lower for infected plants compared to noninfected plants in the three water treatments (Figures 4D–F), from day 45 until 48 for well-watered (Figure 4D) plants and from day 38 until day 48 for water stressed (Figure 4E) and terminal drought plants (Figure 4F). For noninfected plants, number of leaves was significantly lower for plants under water stress compared to terminal drought on days 32, 35 and 39 (Figures 4E, F), while no significant differences were found between well-watered and water stressed (Figures 4D, E) plants or between well-watered and terminal drought plants on any sampling date (Figures 4D, F). For infected plants, the number of leaves was significantly lower for water stressed plants compared to well-watered plants on day 25 (Figures 4D, E), and it was also lower for water stressed plants compared to plants under terminal drought on days 35 and 41 (Figures 4E, F).
3.1.2.3 SPAD
No significant differences were found in chlorophyll content (SPAD) for any of the water treatments between infected and noninfected plants (Figures 4G–I), except on day 41 during which, the SPAD value of water stressed plants was significantly lower for TuYV infected compared to noninfected plants (Figure 4H). In contrast, water treatment significantly impacted the SPAD value regardless the virus infection. SPAD was significantly higher for plants under water stress compared to well-watered plants from day 32 until the end of the assay on both infected and noninfected plants (Figures 4G, H). Moreover, in both infected and noninfected plants, there were no significant differences between well-watered plants and terminal drought plants until stopping watering terminal drought plants (day 42) (Figures 4G, I). After stopping watering (evaluation days 45 and 48), SPAD was significantly higher for terminal drought plants compared to well-watered ones (Figures 4G, I). On the contrary, in both infected and noninfected plants, SPAD was significantly higher in water stress treatment compared to terminal drought plants from day 32 until day 41 (Figures 4H, I), while no significant differences were found on the SPAD valued between water stress and terminal drought plants on the sampling dates after stop watering terminal drought plants (days 45 and 48) (Figures 4H, I).
3.1.3 Impact of water treatments and virus infection on numbers of inflorescences and flowers
Inflorescences appeared on day 39 and flowers on day 46 in all of the treatments. We compared the impact of water treatment and infection on the total number of inflorescences and flowers counted at the end of the experiment. No significant differences were found in any of the pairwise comparisons performed.
3.2 Effect of water treatments on canola plants infected with TuYV under no competition conditions
From a total of 90 seedlings one died before starting the water treatments (TuYV inoculated). In addition, based on TBIA, four non-inoculated plants were positive and three TuYV-inoculated plants were noninfected, thus those plants were discarded and a total of 82 plants were used for analysis (well watered (−)=16; well watered (+)=17; water stress (−)=18; water stress (+)=16; terminal drought (−)=8; Terminal drought (+)= 7. Under no competition conditions, water treatment and virus infection significantly impacted some of the analysed factors. Despite the canola growth was reduced when subjected to drought stress and virus infection combined, the effect was greater compared to competition conditions.
3.2.1 Impact of water treatments and virus infection on dry biomass and leaf area
3.2.1.1 Plants harvested during the first destructive sampling (day 43)
The reduction of dry biomass in infected well water plants was 30.61%, for noninfected plants under water stress 38.93% and for infected plants under water stress 55.22% (Supplementary Figure 2). The reduction of leaf area change for infected well water plants was 15.75%, for noninfected plants under water stress 38.03% and for infected plants under water stress 52.17% (Supplementary Figure 1).
When plants were under well water conditions, dry biomass was significantly lower in infected plants compared to noninfected plants, while on water stressed plants no significant differences were found between TuYV infected and noninfected plants (Figure 5A). In addition, the dry biomass of noninfected plants was significantly lower for plants under water stress compared to well-watered plants while no significant differences in dry biomass were observed for infected plants between water stress compared to well-watered plants (Figure 5A). No significant differences were found in the leaf area between infected and noninfected plants, nor for well-watered or water stressed plants (Figure 5B). The leaf area was significantly lower for water stressed plants compared to well-watered plants on both infected and noninfected plants (Figure 5B). In addition, the effect of the water regime and virus inoculation was additive, i.e. p-value ≥ 0.05 for the interaction and ATAR values showing additivity (Supplementary Table 1). All the models are reported in Supplementary Table 1. No plants from terminal drought treatment were collected at this point of the experiment.
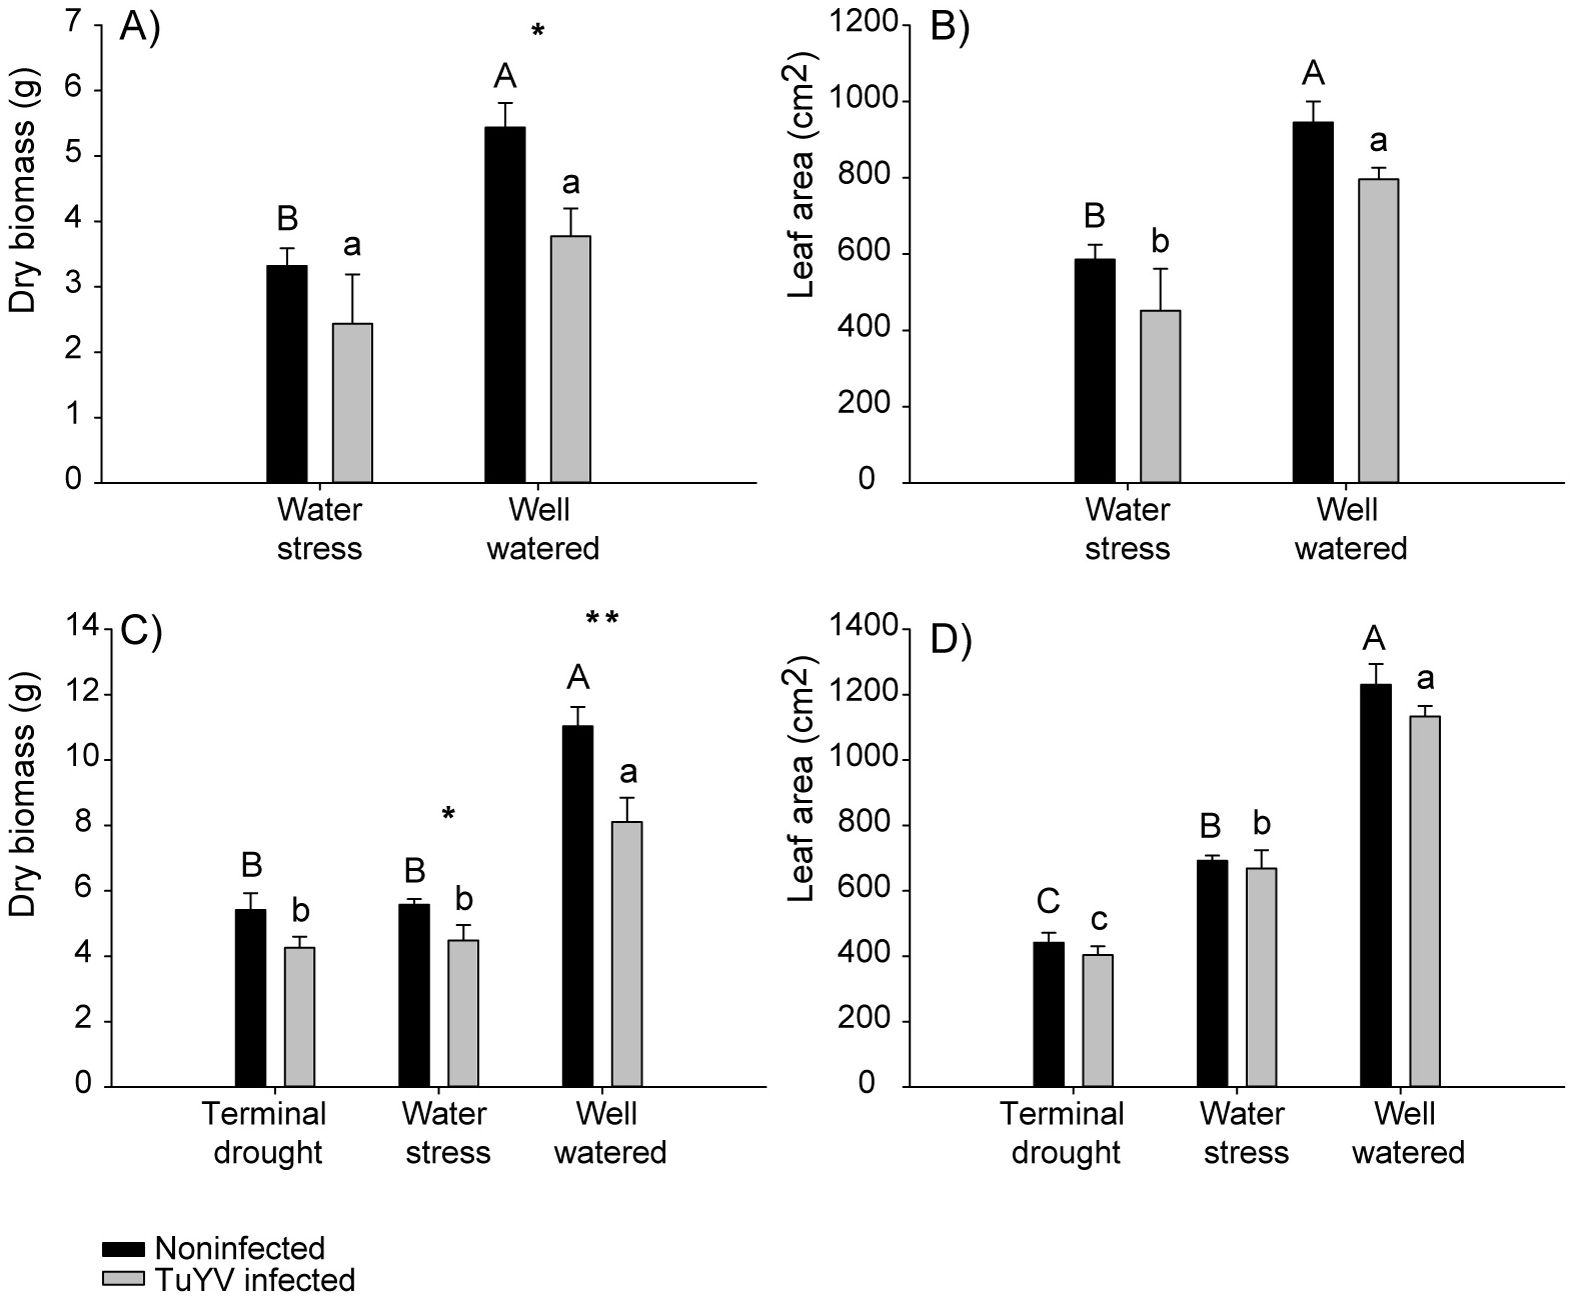
Figure 5. No competition experiment, impact of irrigation treatment and TuYV infection on dry biomass and leaf area. The capital letters refer to significant differences of non-infected plants between irrigation treatments and the lowercase letters refer to significant differences of TuYV-infected plants between irrigation treatments. * indicates significant differences between TuYV-infected and non-infected plants within each irrigation treatment, with a p-value < 0.05 and ** significant differences with a p-value < 0.01. Mean standard error bars are also shown. (A) Mean dry biomass from plants harvested on the first destructive sampling. (B) Mean leaf area (cm2) from plants harvested on the first destructive sampling. (C) Mean dry biomass from plants harvested on the second destructive sampling. (D) Mean leaf area (cm2) from plants harvested on the second destructive sampling.
3.2.1.2 Plants harvested during the second destructive sampling (day 50)
The reduction of dry biomass change for infected well water plants was 26.50%, for noninfected plants under water stress 49.48%, for infected plants under water stress 59.35%, for noninfected plants under terminal drought 50.90% and for infected plants under terminal drought 61.41% (Supplementary Figure 2). The percentage of leaf area change for infected well water plants was 7.88% for noninfected plants under water stress 43.77% for infected plants under water stress 45.69% for noninfected plants under terminal drought 64.12% and for infected plants under terminal drought 67.21% (Supplementary Figure 2).
The dry biomass was significantly lower in infected compared to noninfected ones when plants were well watered and water-stressed, but no significant differences were found on plants under terminal drought (Figure 5C). Moreover, for both infected and noninfected plants, dry biomass was significantly lower when plants were under water stress compared to well-watered plants (Figure 5C). Dry biomass was also lower for plants under terminal drought compared with well-watered on both infected and noninfected plants, while no significant differences were found between terminal drought and water stressed plants for infected, nor for noninfected plants (Figure 5C). Furthermore, no significant differences were found in the leaf area between infected and noninfected plants on any water treatments (Figure 5D). However, the leaf area of infected plants was significantly higher on well-watered plants compared to water stressed and terminal drought plants, and the leaf area of infected plants was higher on water stressed plants compared to terminal drought. Similarly, the leaf area of noninfected plants was significantly higher on well-watered plants compared to water stress plants and terminal drought plants, also leaf area of noninfected plants was significantly higher on water stressed plants compared to plants under terminal drought (Figure 5D). In addition, the effect of the water regime and virus inoculation was additive, i.e. p-value ≥ 0.05 for the interaction and ATAR values showing additivity (Supplementary Table 1). All the models are reported in Supplementary Table 1.
3.2.2 Impact of water treatments and virus infection on plant height, number of leaves, chlorophyll content and transpiration
Plant height, number of leaves, SPAD and transpiration, changed during the experiment depending on the evaluation day and the treatment. In addition, the effect of water regime and virus infection was additive in the three plant traits in all evaluation dates, i.e. p-value ≥ 0.05 for the interaction (Supplementary Table 1). All the models are reported in Supplementary Table 1.
3.2.2.1 Plant height
For well-watered plants, plant height was significantly lower in infected compared to noninfected plants during most of the evaluation day (except day 45) (Figure 6A). In contrast, in water stressed plants, the plant height was significantly lower in infected plants compared to noninfected plants from day 39 until the last evaluation date (48) (Figure 6B). In the terminal drought treatment, plant height was significantly lower in infected compared to noninfected plants from day 35 until the end of the experiment (Figure 6C). For infected and noninfected plants, plant height was significantly lower in plants under water stress compared to well-watered plants from the beginning until the end of the experiment (Figures 6A, B), while there was no significant difference between well-watered and terminal drought plants until the last evaluation day (day 48), in which the plant height was significantly lower on plants under terminal drought compared to well-watered (Figures 6A, C). In contrast, the plant height of noninfected plants was significantly lower for water stressed plants compared to terminal drought, while no significant differences were found between treatments from day number 45 (after stop watering the terminal drought treatment) until the end of the experiment (day 48) (Figures 6B, C). Similarly, infected plants’ height was significantly lower for water stressed plants compared to terminal drought, days 39 and 42, no significant differences were found between treatments on day number 45 (after stopping watering the terminal drought treatment) and plant height was significantly lower on terminal drought plants compared to water stressed ones at the end of the assay (day 48) (Figures 6B, C).
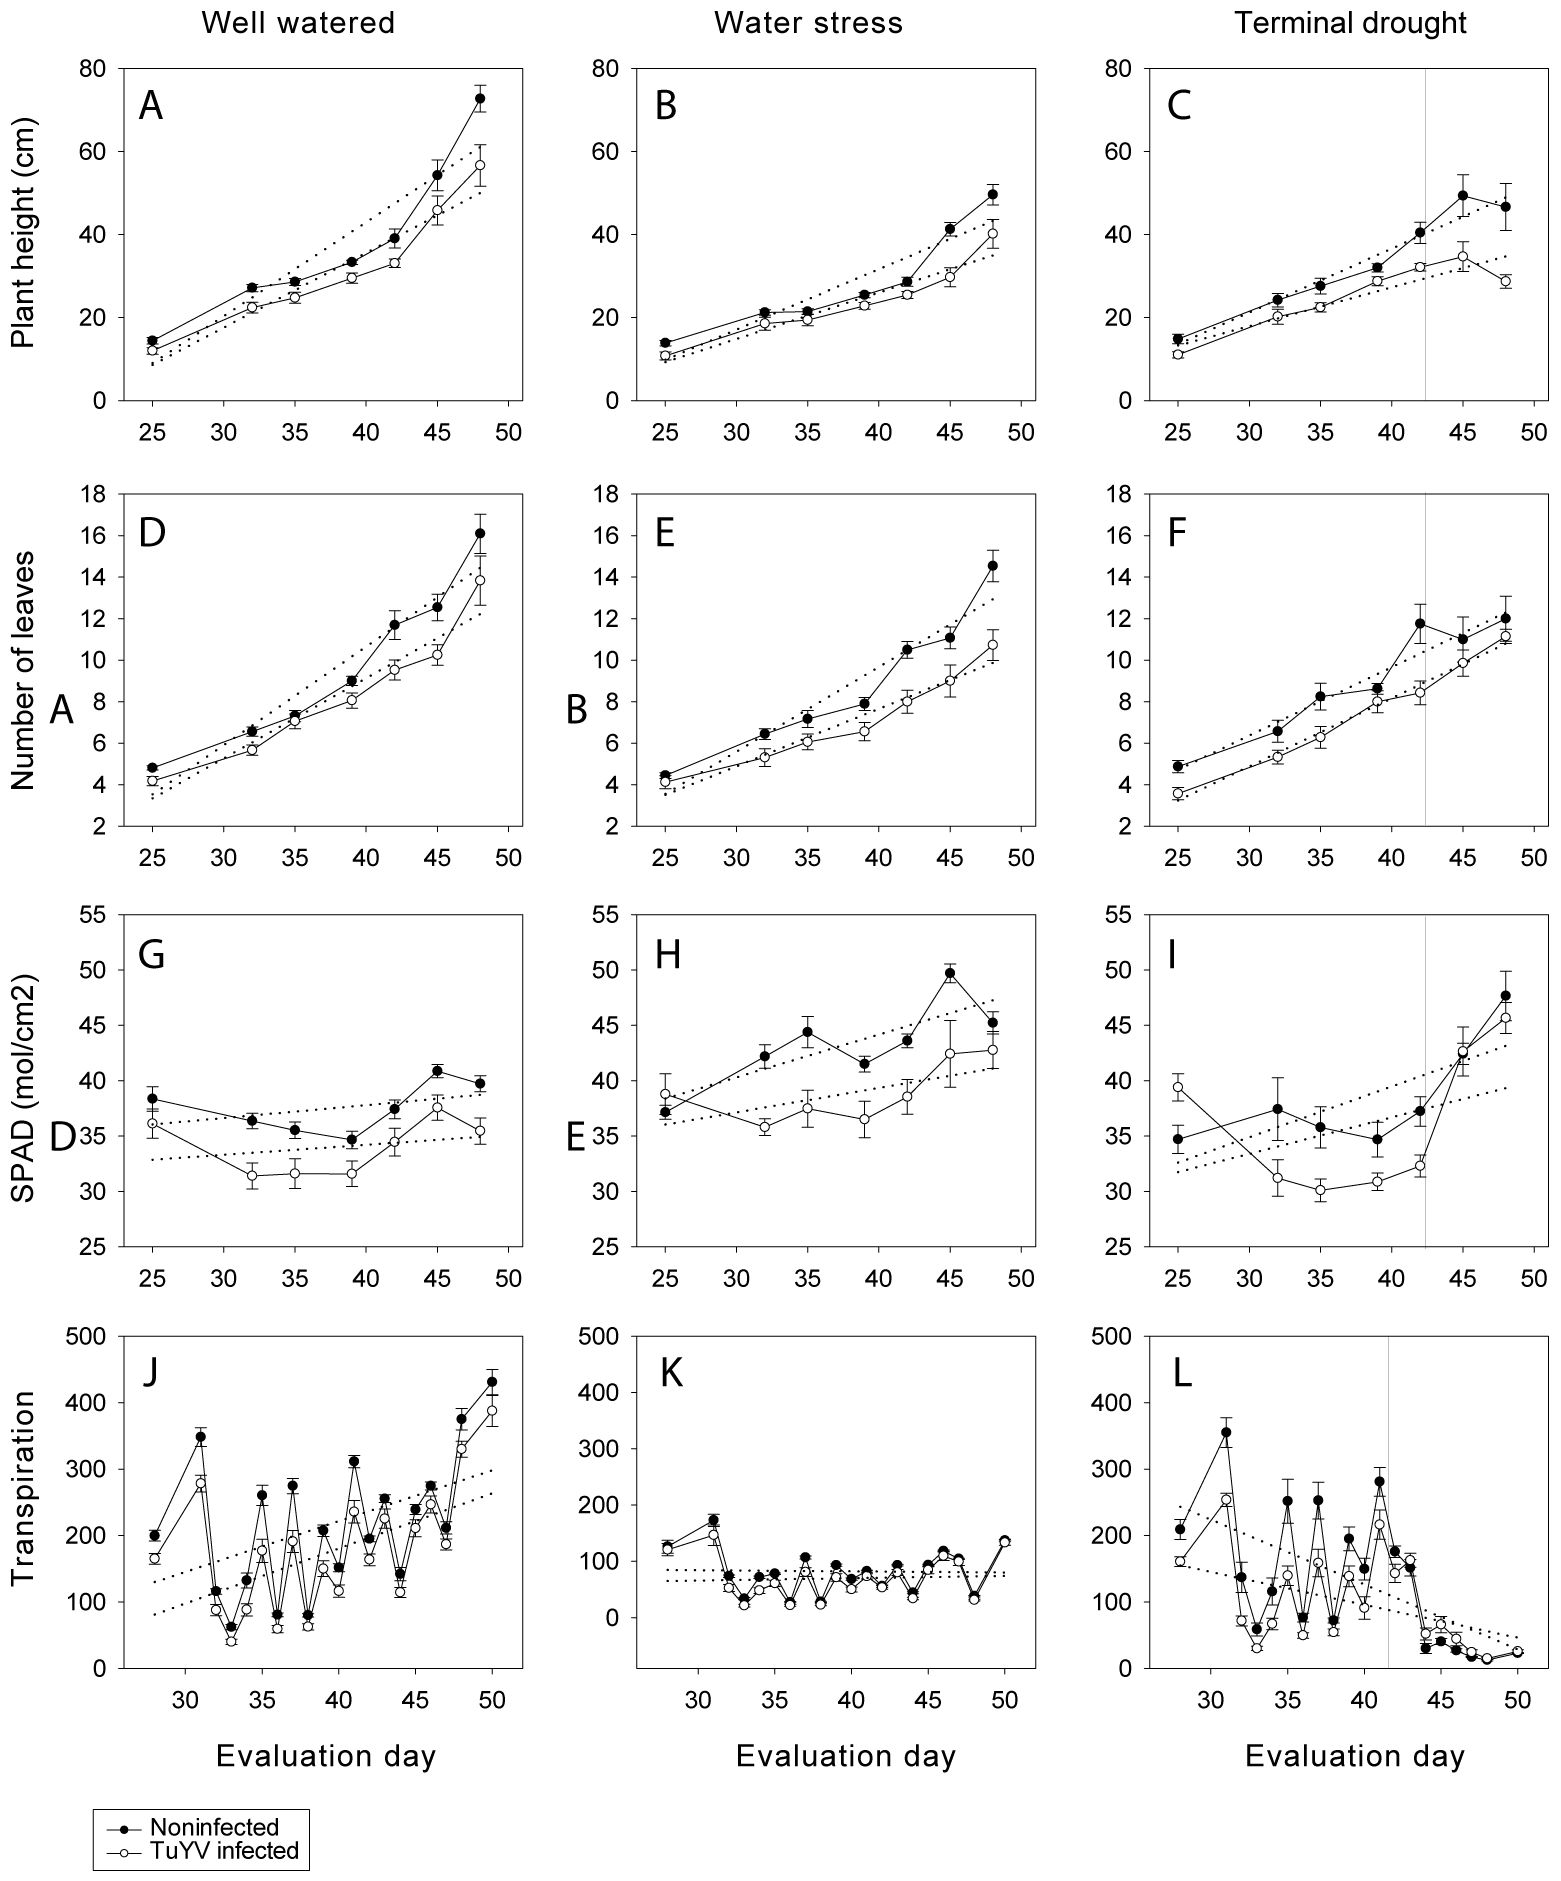
Figure 6. No competition experiment. Plant height (cm) (A–C), number of leaves (D–F) and SPAD (G–I) under well-watered, water stress, and terminal drought conditions. Mean values of different canola growth factors by different treatments on days 25 (10-01-2023), 32 (17-01-2023), 35 (20-01-2023), 39 (24-01-2023), 42 (27-01-2023), 45 (30-01-2023), and 48 (02-02-2023). Transpiration (ml) (J–L) under well-watered, water stress, and terminal drought conditions. Mean values of different canola growth factors by different treatments on days 28 (13-01-2023), 31 (16-01-2023), 32 (17-01-2023), 33 (18-01-2023), 34 (19-01-2023), 35 (20-01-2023), 36 (21-01-2024), 37 (22-01-2023), 38 (23-01-2023), 39 (24-01-2023), 40 (25-01-2023), 41 (26-01-2023), 42 (27-01-2023), 43 (28-01-2023), 44 (29-01-2023), 45 (30-01-2023), 46 (31-01-2023), 47 (01-02-2023), 48 (02-02-2023), 50 (04-02-2023). Mean standard error bars are also shown.
3.2.2.2 Number of leaves
The number of leaves of well-watered plants was significantly lower for infected plants compared to noninfected plants for most of the dates (no significant differences on days 35 and 48) (Figure 6D). Similarly, the number of leaves of water stressed plants was significantly lower in infected plants compared to noninfected plants during most of the dates (no significant differences days 25 and 35) (Figure 6E). In contrast for plants under terminal drought number of leaves was only significantly lower for infected plants on days 25, 35 and 42 (Figure 6F). For noninfected plants there were no significant differences between water treatments during most of the evaluation days, number of leaves was only lower for water stressed plants compared to well-watered on day number 42 and lower on terminal drought plants compared to well-watered on the last day (48) (Figures 6D–F). Similarly, for infected plants, the only differences found between water treatments were the number of leaves was lower for water stressed plants compared to well-watered ones on days number 39, 42 and 45 (Figures 6D–F).
3.2.2.3 SPAD
The SPAD of well-watered plants (Figure 6G), water stressed plants (Figure 6H) and terminal drought plants (Figure 6I) was significantly lower for infected plants compared to noninfected plants during most of the evaluation dates (for well-watered plants, no significant differences were found only on days 25 and 42, and for water stressed on days 25 and 48) (Figure 6G). For noninfected plants, the SPAD was significantly higher for plants under water stress compared to well-watered since day 32 until the end of the assay (Figures 6G, H), while no differences were found between plants under terminal drought and well-watered until the last day (day 48) (Figures 6G, I). For noninfected plants, the SPAD was significantly higher for plants under water stress compared to terminal drought from day 35 until the last day in which no significant differences were found (Figures 6H. I). For infected plants, the SPAD was significantly higher for water stressed plants compared to well-watered plants except on days 25, and 45 (Figures 6G, H), while no differences were found between well-watered and terminal drought plants until days 45 and 48 on which SPAD was higher for terminal drought plants (Figures 6G, I). In addition, infected SPAD was higher for plants under water stress compared to terminal drought from day number 32 until day number 42, while no significant differences were found on days 45 and 48 (Figures 6H, I).
3.2.2.4 Transpiration
The water use of infected plants was lower compared to noninfected plants in the three water treatments during most of the experiment (Figures 6J, K, L). For well-watered plants, transpiration was significantly lower in infected compared to noninfected plants on most of the dates (except on days 43, 45, 46, 47 and 50) (Figure 6J). For water stressed plants transpiration was significantly lower for infected plants compared to noninfected infected during most of the days (except on days 28, 31, 41, 42, 45, 46, 47, 50) (Figure 6K). For terminal drought plants, before stopping watering, transpiration was significantly lower for infected plants compared to noninfected during most of the days (except day 34) (Figure 6L). After stopping watering, no significant differences between infected and noninfected plants were found (from day 42 until day 50) (Figure 6L). When comparing between water treatments, in both infected and noninfected plants transpiration was significantly higher for well-watered plants during the whole period, while no differences were found between well-watered plants and terminal drought treatment, until stopping watering terminal drought plants. After stop watering, transpiration was significantly lower in plants under terminal drought compared to well-watered plants (Figures 6J–L). When comparing noninfected water stressed and terminal drought plants, the transpiration was significantly lower for water stressed plants during most of the days, until stop watering terminal drought plants. When stop watering terminal drought plants transpiration was significantly lower for plants under terminal drought compared to water stressed plants (for non-infected plants no significant differences were found on days 34 and 44; and for TuYV-infected plants on days 32, 33, 34 and 45) (Figures 6K, L).
3.2.3 Impact of water treatments and virus infection on number of inflorescences and flowers
Inflorescences appeared on day 36 in all treatments except of TuYV-infected plants under water stress and terminal drought, when inflorescences appeared on day 40. Flowers appeared on day 43 in all treatments except on TuYV–infected plants under water stress which appeared on day 46 and TuYV-infected plants under terminal drought which appeared on day 49. The number of inflorescences and flowers was significantly lower for TuYV-infected plants compared to noninfected plants in all water treatments (Figures 7A, B). The number of flowers of TuYV-infected plants was significantly lower for terminal drought plants compared to well-watered plants (Figure 7B). In addition, the effect of the water regime and virus inoculation was additive, i.e. p-value ≥ 0.05 for the interaction and ATAR values showing additivity (Supplementary Table 1). All the models are reported in Supplementary Table 1.
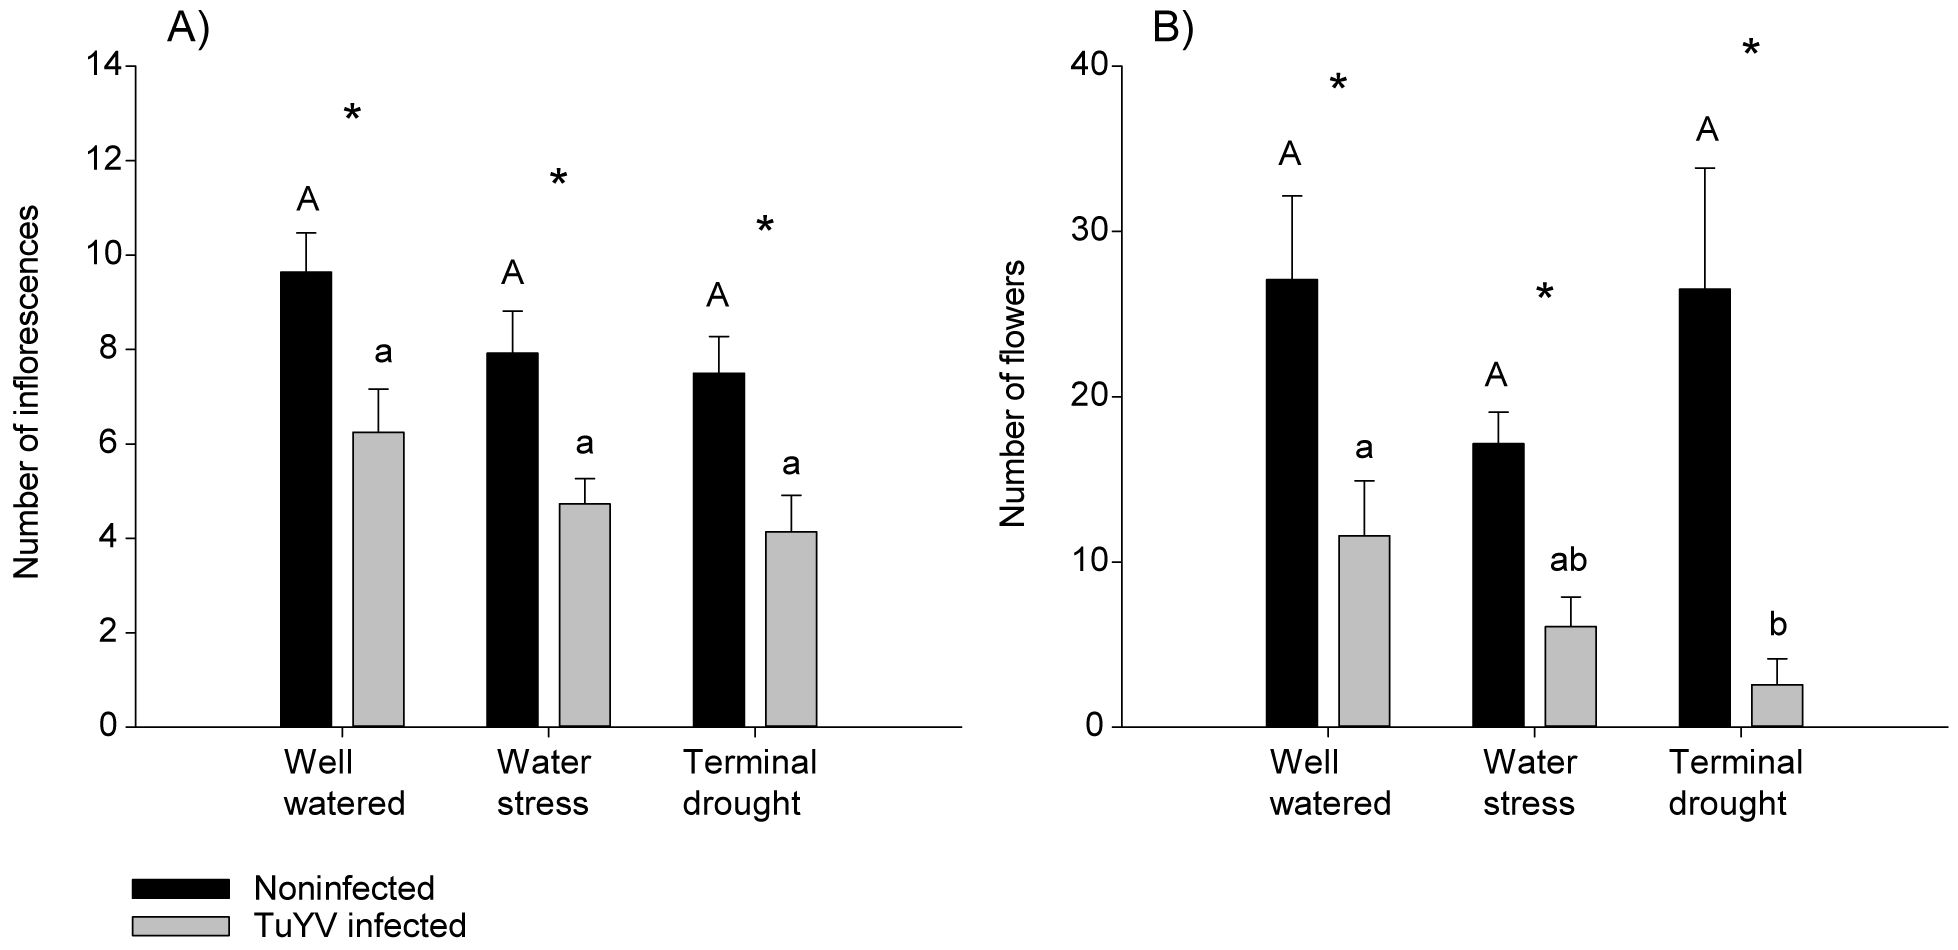
Figure 7. No competition experiment. Impact of irrigation treatment and TuYV infection on flowering. The capital letters refer to significant differences in non-infected plants between irrigation treatments, and * indicates significant differences between TuYV-infected and non-infected plants within each irrigation treatment, with a p-value < 0.05. Mean standard error bars are also shown. (A) Number of inflorescences at the end of the assay. (B) Number of flowers at the end of the assay.
3.3 Evaluation of TuYV symptoms in the competition and no competition experiments
Finally, TuYV infected plants didn’t show clear visual symptoms. On the contrary, water stress symptoms were observed.
4 Discussion
Our results show that drought stress and virus infection impaired overall plant performance, reducing several plant traits. In both experiments, the lowest values of dry biomass, leaf area and plant height were measured in virus infected plants subjected to water deprivation (water stress or terminal drought treatment). In the competition experiment, in the second destructive sampling, virus infected plants under water stress exhibited a reduction of the dry biomass by 71.40% and of the leaf area by 66.10%, and under terminal drought a reduction of the dry biomass by 65.12% and of the leaf area by 82.26%. In addition, in the competition experiment, the plant height of infected plants was lower than that of noninfected plants when subjected to water stress throughout the entire experiment. Under well-watered conditions, the plant height of infected plants was lower than that of noninfected plants starting from day 39. In the no competition experiment, in the second destructive sampling, virus infected plants under water stress experienced a 59.35% reduction in dry biomass and a 44.77% reduction in leaf area, while under terminal drought, the reduction in dry biomass was 61.41%, and in leaf area 67.21%.
Here we observed that the effects of drought and virus infection had a negative impact on canola performance (e.g. reduction in dry biomass and leaf area). However, in contrast to our results, some authors showed positive effects of drought on infected plants, which have been interpreted in terms of enhanced drought adaptation. For example, it has been reported that the survival rate of A. thaliana plants under drought was higher on TuMV infected plants compared to non-infected plants (González et al., 2021). Similarly, Xu et al. (2008) showed that BMV-infected rice and CMV-infected beet plants induced tolerance to drought and increased concentration of several osmoprotectants and antioxidants before and after drought stress. However, in both studies, authors irrigated virus infected and uninfected plants at a fixed rate without weighing the pots and without maintaining the same level of water stress in both infected and non-infected plants. Aguilar et al. (2017) and Davis et al. (2015) used similar approaches than the previously described studies when watering both virus-infected and uninfected plants. All these studies overlooked the fact that virus-infected plants usually consume less water (less evapotranspiration) than non-infected plants as virus infection often reduces plant growth and the leaf area (Doumayrou et al., 2013). Thus, it is not surprising that under their experimental conditions, non-infected plants suffered more from water stress than the ones that were virus-infected. In our view, the way that water management was handled in the above referred studies led to the wrong conclusion that virus infection helps plants to cope better with water stress conditions. In contrast, in the present work we aimed to ensure that we avoid introducing confounding errors that could be attributed to fluctuations in water usage efficiency linked to disparities in plant biomass as a result of virus infection compared to noninfected plants, and remaining soil water content. Thus, water was administered according to the soil water content relative to pot weight, rather than applying a constant amount for each treatment as it was conducted in the previously cited experiments.
In the present work, we reported additive effects of drought and virus infection on all analysed parameters, (e.g reduction in dry biomass and leaf area) when plants encounter both stressors. In contrast, several studies show antagonistic relationships between viruses and drought stress (Prasad et al., 2022; Szczepaniec and Finke, 2019; Van Munster, 2020). The interplay of multiple stresses is frequent in nature and is a fundamental driver of ecosystem complexity (Sadras et al., 2023). The relationships between these stressors can be additive but may be also synergistic or antagonistic, increasing or decreasing respectively the effects of the stressors (Fereres et al., 1996; Sih et al., 2004; Wootton, 2002). In their extensive review Sadras et al. (2023) reported 57% of antagonistic and 43% additive relationships between virus and drought in their sample of studies. For example, Sadras et al. (2023) reported antagonistic effects between barley yellow dwarf virus (BYDV) and drought stress on the growth and yield of glasshouse-grown wheat (data obtained from Davis et al., 2015). On the contrary, Sadras et al. (2023) reported that the relationship between cauliflower mosaic virus CaMV and drought stress, on seedling biomass, was additive for 13 accessions in Bergès et al. (2020). In a recently published study Jiménez et al. (2024) investigated the relationship between water regime and virus infection of cucumber mosaic virus (CMV) and cucurbit aphid-borne yellows virus (CABYV) in single and mixed infections of melon plants. Consistent with our findings, they reported that the relationship between water regime and virus infection was additive in 12 out of 15 traits at harvest. All these studies suggest that relationships between drought and virus infected plants depend on the cultivar, pathosystem, the measured trait and on the experimental set up. Furthermore, most of the studies, including the current work, applied two or three water treatments: one or two inducing water stress and the other maintaining well water conditions. However, the responses of infected plants to drought may not follow a linear pattern and future studies should include various levels of watering to elucidate the additive, antagonistic or synergistic relationships between plant viruses and drought. This reveals the complexity of the interplay between drought and plant viruses, thus we need to be careful when making general assumptions on how drought may affect plant virus interactions.
Interestingly, we observed that the impact of drought and virus infection was more noticeable when plants were under competition compared to non-competition, and that, under competition, virus impact appeared earlier on time when plants were subjected to water stress, compared to no competition. Under water stress, in the competition experiment, a reduction in dry biomass and leaf area at the first destructive sampling, and in plant height during all the experiment was reported for infected compared to noninfected plants. On the contrary, under no competition, no differences in the dry biomass were observed between infected and noninfected plants under water stress on the first destructive sampling, and for plant height differences were observed from 39 (water stress) and 35 (terminal drought) until the end of the assay. The differences observed between experiments may arise due to variations in features between isolated plants compared to plants subjected to competition conditions (Pedró et al., 2012; Sadras, 2021). Previous studies show that the regulation of the expression of genes related to plant response to abiotic stress can be density-dependent (Bowsher et al., 2017; Geisler et al., 2013), thus effects of these stressors observed in individualy potted plants cannot be extrapolated to plants when competing for resources. Indeed, in the context of plant virus relationships, genes involved on the response to abiotic stress, secondary metabolism and pathogen defence response exhibited downregulation in response to high plant population (Geisler et al., 2013).
Regarding effects of watering, plants under water stress and those under terminal had a higher SPAD index (as an indicator of leaf chlorophyll) than well-watered plants, while no virus effect was reported. Consistently, a negative correlation between leaf water potential and SPAD in Plantago ovata and Plantago psyllium has been previously reported (Rahimi et al., 2010). Regarding morphological traits, no clear visual symptoms of TuYV were observed in the experiment, but we observed a reduction in the number of leaves with no clear effect of water treatment. Foliar symptom expression of TuYV such as red, yellow or purple discoloration and stunned plants are not always obvious. Indeed, foliar symptom expression depends on environmental factors which can differ depending on the cultivar and other environmental factors (Jones et al., 2007). In addition, symptoms are sometimes “masked” and the amount of vegetative growth and light intensity can affect symptom development (Johnstone et al., 1984). Symptoms of TuYV infection in canola have also been shown to vary in severity with cultivar, with some canola cultivars appearing to be non-symptomatic when infected (Coutts et al., 2010). However, asymptomatic infection could also induce yield losses (Nancarrow et al., 2022).
Finally, it worth noting that a few non-inoculated plants tested positive (6 plants in the competition experiment and 4 plants in the no-competition experiment), while some inoculated plants did not test positive (13 in the competition experiment and 3 in the no-competition experiment). Although not as common as other methods for detecting virus presence, such as ELISA or PCR, TBIA is a serological test known for its simplicity and cost-effectiveness, which provides accurate estimates of virus incidence (Freeman et al., 2013). Therefore, the observed positives among non-inoculated plants and negatives among inoculated plants were likely due to contamination rather than flaws in the method itself. Such occurrences are not uncommon, since close proximity between plants can lead to unintended virus transfer. Additionally, the inoculation process may not be completely efficient, which can result in some plants not becoming infected. Consequently, we decided to exclude these plants from the statistical analysis to maintain the accuracy of our findings.
Water availability is the major driver of plant growth and is the critical factor in food production (El-Badri et al., 2021). Based on climate change models, we will expect increased uncertainties when it comes to water availability, meaning that in many parts of the world, we can expect prolonged drought or disparity between rainfall and water requirements for plant growth (IPCC, 2023). In addition, plant viruses are difficult to manage, and in order to control them, we need to implement multiple plant protection strategies. Vectors of plant viruses will be also directly and indirectly affected by climate change adding another layer of uncertainties when predicting virus incidence, outbreaks, severity and epidemiology (Trębicki, 2020). Several studies show that higher temperatures and elevated CO2 increase plant vulnerability to viruses, through greater virus amount in plant tissue and increased infection. Therefore, research exploring how climate change impacts plant virus epidemiology is critical for developing effective strategies to ensure global food production.
In conclusion, we provided empirical evidence that virus infection and water deprivation reduced canola growth. The two experiments conducted show that drought stress and virus infection were detrimental to canola performance and that impact was more noticeable when canola plants were competing for resources. Consequently, the combined effect of both stressors is predicted to significantly decrease canola yield. In contrast to reports on other pathosystems, under our experimental conditions, TuYV did not induce drought tolerance in canola plants. Based on those findings, we are concerned that canola production will face greater pressure due to virus infection in future climate, where droughts are predicted to rise and intensify. Besides, other factors such as elevated CO2 and temperature may impact canola yield, thus further research is critical. In addition, we need to be cautious when making general statements regarding how drought may affect plant virus interactions. The intricacy of these interactions can be applied to specific contexts, varying depending on plant and virus combinations, experimental conditions and on the analysed traits. Hence, further research is needed to acquire a comprehensive understanding of how the plant–virus interactions will be affected by the abiotic stressors in the context of climate change.
Data availability statement
The raw data supporting the conclusions of this article will be made available by the authors, without undue reservation.
Author contributions
CL: Conceptualization, Data curation, Formal analysis, Investigation, Methodology, Writing – original draft, Writing – review & editing. AF: Conceptualization, Funding acquisition, Methodology, Writing – review & editing. AM: Conceptualization, Funding acquisition, Writing – review & editing. PT: Conceptualization, Formal analysis, Funding acquisition, Investigation, Methodology, Writing – review & editing.
Funding
The author(s) declare financial support was received for the research, authorship, and/or publication of this article. This research was financially supported by the Ministerio de Ciencia e Innovación through fellowship PRE2018-083307, the project Multitrophic Interactions Between Plants, Viruses, Aphids and Natural Enemies in a Changing Climate (PID2020-117074RB-I00) as well as internal funds from Agriculture Victoria and Macquarie University.
Acknowledgments
The authors express their gratitude to our colleagues Kudzaishe Precious Mavende for her assistance in data collection, Narelle Nancarrow and Dr. Mohammad Aftab for their support with virus testing, and Laura Barrios for reviewing the statistical analysis. We also acknowledge the use of generative AI technologies in the preparation of this manuscript. Specifically, ChatGPT (GPT-4, OpenAI) was used for improving the English writing, and Elicit (Ought) assisted in the literature search and bibliography compilation.
Conflict of interest
The authors declare that the research was conducted in the absence of any commercial or financial relationships that could be construed as a potential conflict of interest.
Publisher’s note
All claims expressed in this article are solely those of the authors and do not necessarily represent those of their affiliated organizations, or those of the publisher, the editors and the reviewers. Any product that may be evaluated in this article, or claim that may be made by its manufacturer, is not guaranteed or endorsed by the publisher.
Supplementary material
The Supplementary Material for this article can be found online at: https://www.frontiersin.org/articles/10.3389/fagro.2024.1419002/full#supplementary-material
References
Aguilar E., Cutrona C., del Toro F. J., Vallarino J. G., Osorio S., Pérez-Bueno M. L., et al. (2017). Virulence determines beneficial trade-offs in the response of virus-infected plants to drought via induction of salicylic acid. Plant Cell Environ. 40, 2909–2930. doi: 10.1111/pce.13028
Ahmar S., Liaqat N., Hussain M., Salim M. A., Shabbir M. A., Ali M. Y., et al. (2019). Effect of abiotic stresses on brassica species and role of transgenic breeding for adaptation. Asian J. Res. Crop Sci. 3, 1–10. doi: 10.9734/ajrcs/2019/v3i130037
Bergès S. E., Vasseur F., Bediée A., Rolland G., Masclef D., Dauzat M., et al. (2020). Natural variation of Arabidopsis thaliana responses to Cauliflower mosaic virus infection upon water deficit. PloS Pathog. 16, 1–25. doi: 10.1371/journal.ppat.1008557
Bowsher A. W., Shetty P., Anacker B. L., Siefert A., Strauss S. Y., Friesen M. L. (2017). Transcriptomic responses to conspecific and congeneric competition in co-occurring Trifolium. J. Ecol. 105, 602–615. doi: 10.1111/1365-2745.12761
Chakraborty S., Newton A. C. (2011). Climate change, plant diseases and food security: An overview. Plant Pathol. 60, 2–14. doi: 10.1111/j.1365-3059.2010.02411.x
Chaves M. M., Flexas J., Pinheiro C. (2009). Photosynthesis under drought and salt stress: Regulation mechanisms from whole plant to cell. Ann. Bot. 103, 551–560. doi: 10.1093/aob/mcn125
Congdon B. S., Baulch J. R., Coutts B. A. (2020). Impact of Turnip yellows virus infection on seed yield of an open-pollinated and hybrid canola cultivar when inoculated at different growth stages. Virus Res. 277, 197847. doi: 10.1016/j.virusres.2019.197847
Coutts B. A., Webster C. G., Jones R. A. C. (2010). Control of Beet western yellows virus in Brassica napus crops: Infection resistance in Australian genotypes and effectiveness of imidacloprid seed dressing. Crop Pasture Sci. 61, 321–330. doi: 10.1071/CP09264
Daugherty M. P., Zeilinger A. R., Almeida R. P. P. (2017). Conflicting effects of climate and vector behavior on the spread of a plant pathogen. Phytobiomes J. 1, 46–53. doi: 10.1094/PBIOMES-01-17-0004-R
Davis T. S., Bosque-Pérez N. A., Foote N. E., Magney T., Eigenbrode S. D. (2015). Environmentally dependent host-pathogen and vector-pathogen interactions in the Barley yellow dwarf virus pathosystem. J. Appl. Ecol. 52, 1392–1401. doi: 10.1111/1365-2664.12484
DeLucia E. H., Nabity P. D., Zavala J. A., Berenbaum M. R. (2012). Climate change: Resetting plant-insect interactions. Plant Physiol. 160, 1677–1685. doi: 10.1104/pp.112.204750
Doumayrou J., Leblaye S., Froissart R., Michalakis Y. (2013). Reduction of leaf area and symptom severity as proxies of disease-induced plant mortality: The example of the Cauliflower mosaic virus infecting two Brassicaceae hosts. Virus Res. 176, 91–100. doi: 10.1016/j.virusres.2013.05.008
Ebi K. L., Vanos J., Baldwin J. W., Bell J. E., Hondula D. M., Errett N. A., et al. (2020). Extreme weather and climate change: population health and health system implications. Annu. Rev. Public Health 42, 293–315. doi: 10.1146/annurev-publhealth-012420-105026
El-Badri A. M., Batool M., Mohamed I. A. A., Wang Z., Khatab A., Sherif A., et al. (2021). Antioxidative and metabolic contribution to salinity stress responses in two rapeseed cultivars during the early seedling stage. Antioxidants 10 (8), 1227. doi: 10.3390/antiox10081227
FAO. (2021). Climate change fans spread of pests and threatens plants and crops, new FAO study. Pests destroy up to 40 percent of global crops and cost $220 billion of losses. Available online at: https://www.fao.org/newsroom/detail/Climate-change-fans-spread-of-pests-and-threatens-plants-and-crops-new-FAO-study/en/ (Accessed February 19, 2024).
Farooqi A. A., Srinivasappa K. N. (2012). Handbook of Herbs and Spices. Eds. Chervil E. N., Peter K. V. (Cambridge England: Woodhead Publishing), 268–274.
Fereres A., Avilla C., Collar J. L., Duque M., Fernandez-Quintanilla C. (1996). Impact of various yield-reducing agents on open-field sweet peppers. Environ. Entomol. 25, 983–986. doi: 10.1093/ee/25.5.983
Freeman A. J., Spackman M. E., Aftab M., McQueen V., King S., Van Leur J. A. G., et al. (2013). Comparison of tissue blot immunoassay and reverse transcription polymerase chain reaction assay for virus-testing pulse crops from a South-Eastern Australia survey. Australas. Plant Pathol. 42, 675–683. doi: 10.1007/s13313-013-0252-9
Friedt W., Tu J., Tingdong F. (2018). “Academic and Economic Importance of Brassica napus Rapeseed,” in The Brassica napus Genome. Eds. Liu E. S., Snowdon R., Chalhoub B. (Springer, Cham), 1–20. doi: 10.1007/978-3-319-43694-4_1
Geisler M., Gibson D., Lindsey K., Millar K., Wood A. (2013). Upregulation of photosynthesis genes, and downregulation of stress defense genes, is the response of arabidopsis thaliana shoots to intraspecific competition. Botanical Stud. 53, 86–97.
González R., Butkovic A., Escaray F. J., Martínez-Latorre J., Melero Í, Pérez-Parets E., et al. (2021). Plant virus evolution under strong drought conditions results in a transition from parasitism to mutualism. Proc. Natl. Acad. Sci. U.S.A. 118 (6), e2020990118. doi: 10.1073/pnas.2020990118
Grace J. B. (1995). On the measurement of plant competition intensity. Ecology 76, 305–308. doi: 10.2307/1940651
IPCC. (2023). Climate Change 2023: Synthesis Report. Contribution of Working Groups I, II and III to the Sixth Assessment Report of the Intergovernmental Panel on Climate Change [Synthesis Report]. Core Writing Team. Eds. Lee H., Romero J. (Interlaken Switzerland: Intergovernmental Panel on Climate Change (IPCC)), 35–115. doi: 10.59327/IPCC/AR6-9789291691647
Jiménez J., Sadras V. O., Espaillat N., Moreno A., Fereres A. (2024). Interplay between drought and plant viruses co-infecting melon plants. Sci. Rep. 14, 15833. doi: 10.1038/s41598-024-66344-y
Joern A., Mole S. (2005). The plant stress hypothesis and variable responses by blue grama grass (Bouteloua gracilis) to water, mineral nitrogen, and insect herbivory. J. Chem. Ecol. 31, 2069–2090. doi: 10.1007/s10886-005-6078-3
Johnstone G. R., Ashby J. W., Gibbs A. J., Duffus J. E., Thottappilly G., Fletcher J. D. (1984). The host ranges, classification and identification of eight persistent aphid-transmitted viruses causing diseases in legumes. Neth. J. Plant Pathol. 90 (6), 225–245. doi: 10.1007/BF01976381
Jones R. A. C., Barbetti M. J. (2012). Influence of climate change on plant disease infections and epidemics caused by viruses and bacteria. CAB Rev. 7 (22), 1–31. doi: 10.1079/PAVSNNR20127022
Jones R. A. C., Coutts B. A., Hawkes J. (2007). Yield-limiting potential of Beet western yellows virus in Brassica napus. Aust. J. Agric. Res. 58, 788–801. doi: 10.1071/AR06391
Juergens M., Paetsch C., Krämer I., Zahn M., Rabenstein F., Schondelmaier J., et al. (2010). Genetic analyses of the host-pathogen system Turnip yellows virus (TuYV)-rapeseed (Brassica napus L.) and development of molecular markers for TuYV-resistance. Theor. Appl. Genet. 120, 735–744. doi: 10.1007/s00122-009-1194-z
Kansman J. T., Basu S., Casteel C. L., Crowder D. W., Lee B. W., Nihranz C. T., et al. (2022). Plant water stress reduces aphid performance: exploring mechanisms driven by water stress intensity. Front. Ecol. Evol. 10. doi: 10.3389/fevo.2022.846908
Khanzada H., Wassan G. M., He H., Mason A. S., Keerio A. A., Khanzada S., et al. (2020). Differentially evolved drought stress indices determine the genetic variation of Brassica napus at seedling traits by genome-wide association mapping. J. Adv. Res. 24, 447–461. doi: 10.1016/j.jare.2020.05.019
Manacorda C. A., Gudesblat G., Sutka M., Alemano S., Peluso F., Oricchio P., et al. (2021). TuMV triggers stomatal closure but reduces drought tolerance in Arabidopsis. Plant Cell Environ. 44, 1399–1416. doi: 10.1111/pce.14024
Nancarrow N., Aftab M., Hollaway G., Rodoni B., Trębicki P. (2022). Symptomless turnip yellows virus infection causes grain yield loss in lentil and field pea: A three-year field study in south-eastern Australia. Front. Plant Sci. 13. doi: 10.3389/fpls.2022.1049905
Pedró A., Savin R., Slafer G. A. (2012). Crop productivity as related to single-plant traits at key phenological stages in durum wheat. Field Crops Res. 138, 42–51. doi: 10.1016/j.fcr.2012.09.016
Prasad A., Sett S., Prasad M. (2022). Plant-virus-abiotic stress interactions: A complex interplay. Environ. Exp. Bot. 199, 104869. doi: 10.1016/j.envexpbot.2022.104869
Price J. A., Workneh F., Evett S. R., Jones D. C., Arthur J., Rush C. M. (2010). Effects of wheat streak mosaic virus on root development and water-use efficiency of hard red winter wheat. Plant Dis. 94, 766–770. doi: 10.1094/PDIS-94-6-0766
Rahimi A., Madah Hosseini S., Pooryoosef M., Fateh I. (2010). Variation of leaf water potential, relative water content and SPAD under gradual drought stress and stress recovery in two medicinal species of Plantago ovata and P. psyllium. Plant Ecophysiol. 2, 53–60.
Sadras V. O. (1997). Effects of simulated insect damage and weed interference on cotton growth and reproduction. Ann. Appl. Biol. 130, 271–281. doi: 10.1111/j.1744-7348.1997.tb06832.x
Sadras V. O. (2021). Evolutionary and ecological perspectives on the wheat phenotype. Proc. R. Soc. B: Biol. Sci. 288, 20211259. doi: 10.1098/rspb.2021.1259
Sadras V. O., Guirao M., Moreno A., Fereres A. (2023). Inter-virus relationships in mixed infections and virus-drought relationships in plants: A quantitative review. Plant J. 117 (6), 1786–1799. doi: 10.1111/tpj.16516
Schulze E. D., Beck E., Buchmann N., Clemens S., Müller-Hohenstein K., Scherer-Lorenzen M. (2019). Plant Ecology, Second Edition (Berlin, Germany: Springer). doi: 10.1007/978-3-662-56233-8
Schwinghamer M. W., Nicholas A. H., Schilg M. A. (2009). Three aphid vectors of faba bean (Vicia faba) viruses in northern New South Wales and occurrence of Acyrthosiphon pisum-transmitted isolates of Soybean dwarf virus. Australas. Plant Pathol. 38, 262–269. doi: 10.1071/AP09001
Sih A., Bell A. M., Kerby J. L. (2004). Two stressors are far deadlier than one. Trends Ecol. Evol. 19, 274–276. doi: 10.1016/j.tree.2004.02.010
Stevens M., McGrann G., Clark B., Authority H. (2008). Turnip yellows virus (syn Beet western yellows virus): An emerging threat to European oilseed rape production. 26, 1–36.
Szczepaniec A., Finke D. (2019). Plant-vector-pathogen interactions in the context of drought stress. Front. Ecol. Evol. 7, 262. doi: 10.3389/fevo.2019.00262
Trębicki P. (2020). Climate change and plant virus epidemiology. Virus Res. 286, 198059. doi: 10.1016/j.virusres.2020.198059
Van Munster M. (2020). Impact of abiotic stresses on plant virus transmission by aphids. Viruses 12, 216. doi: 10.3390/v12020216
Wootton J. T. (2002). Indirect effects in complex ecosystems: Recent progress and future challenges. J. Sea Res. 48, 157–172. doi: 10.1016/S1385-1101(02)00149-1
Keywords: plant virus epidemiology, water stress, competition effect, plant virus interaction, phenology, potyvirus, aphid borne virus disease
Citation: Lago C, Fereres A, Moreno A and Trębicki P (2024) Assessing the impact of turnip yellows virus infection and drought on canola performance: implications under a climate change scenario. Front. Agron. 6:1419002. doi: 10.3389/fagro.2024.1419002
Received: 17 April 2024; Accepted: 15 August 2024;
Published: 16 September 2024.
Edited by:
Pei Li, Kaili University, ChinaReviewed by:
Torsten Will, Julius Kühn-Institut, GermanyYongju Huang, University of Hertfordshire, United Kingdom
Copyright © 2024 Lago, Fereres, Moreno and Trębicki. This is an open-access article distributed under the terms of the Creative Commons Attribution License (CC BY). The use, distribution or reproduction in other forums is permitted, provided the original author(s) and the copyright owner(s) are credited and that the original publication in this journal is cited, in accordance with accepted academic practice. No use, distribution or reproduction is permitted which does not comply with these terms.
*Correspondence: Clara Lago, Y2xhcmEubGFnb0BpY2EuY3NpYy5lcw==