 Walter Ocimati1*
 Geofrey Ogwal1
 Anthony Fredrick Tazuba1
 Jerome Kubiriba2Joab Tugume3Rockefeller Erima2Wilson Okurut2
 George Mahuku4David Kutunga3
 Guy Blomme5
- 1Pest and Disease Suppressive and Enhanced Production Systems, Alliance of Bioversity International and Center for International Tropical Agriculture (CIAT), Kampala, Uganda
- 2Banana Programme, National Agricultural Research Organization, Kampala, Uganda
- 3Crop Inspection and Protection, Ministry of Agriculture Animal Industry and Fisheries, Entebbe, Uganda
- 4Plant Pathology, International Institute of Tropical Agriculture, Kampala, Uganda
- 5Pest and Disease Suppressive and Enhanced Production Systems, Alliance of Bioversity International and Center for International Tropical Agriculture (CIAT), Addis Ababa, Ethiopia
Introduction: Banana bunchy top disease (BBTD) caused by banana bunchy top virus (BBTV) poses a significant threat to Uganda’s food and income security.
Methods: To map BBTD spread and inform its management, a delimiting survey was undertaken covering the high-risk zones bordering the Democratic Republic of Congo (DR Congo) in the west, Rwanda and Tanzania in the south, and South Sudan in the north. BBTD is endemic in the DR Congo and present in Tanzania and Rwanda. The survey and environmental data were then used to map the vulnerability of Uganda’s banana landscapes.
Results and discussion: BBTD was only confirmed on 9% of sampled farms in north- and midwestern Uganda, with yield losses of 75% to 100%. Farmers observed BBTD over a 0.5–4.4-year period, suggesting a delayed detection. Suckers were the predominate planting materials used, increasing the risk of disease spread. Landscape suitability for BBTD was influenced by precipitation of the driest month, banana presence in 2016, land surface temperature difference (LSTD), the interaction between wind speed and LSTD, isothermality, wind speed, and the normalized difference vegetation index. These variables affect either or both the virus and aphid vector populations. Altitude did not influence the model, possibly due to disease introduction at mid to high altitudes through infected planting materials. The low-lying zones (around River Nile and Lakes Albert, Edward, and Victoria) are highly vulnerable. BBTD risk was low in northeastern Uganda with low banana production. The prediction map shows some suitable landscapes in the southwest that can expose this major banana production zone to BBTD, necessitating proactive measures.
Introduction
Banana bunchy top disease (BBTD) is a viral disease of bananas and plantains (Musa spp.; hereafter, banana) caused by the banana bunchy top virus (BBTV) (Kumar et al., 2015; Qazi, 2016; Thomas, 2018). BBTD ranks among the top 100 invasive species in the world (Global Invasive Species Database, 2023). In Africa, BBTD was first observed in Egypt in 1900 (Magee, 1927). A second independent introduction happened in the late 1940s or early 1950s at the National Institute for Agronomic Study of the Belgian Congo Yangambi research station in the Democratic Republic of Congo (DR Congo) (Blomme et al., 2013; Wardlaw, 1961). By 1987, the disease was widely spread in the DR Congo, present in Burundi and Rwanda located in the east and central African regions. More recently, BBTD was confirmed in Uganda (Ocimati et al., 2021) and Tanzania (Shimwela et al., 2022), in the East African region.
Severe BBTV infection is characterized by stunted growth with distorted leaves having a bunchy and erect appearance in young plants, while bunches of mature plants fail to fill, as such fruits remain inedible (Magee, 1927; Niyongere et al., 2011). Banana productivity is severely affected, leading to significant yield and economic losses for farmers. The disease has been reported to cause significant yield losses of up to 100% (Caruana-Iskra, 2003; Kumar et al., 2015; Niyongere et al., 2011). In Australia, BBTD almost wiped out the banana industry between 1913 and 1920 (Magee, 1927), while in the 1990s, in Malawi, it reduced the banana production area from 3,500 ha to 800 ha (Soko et al., 2009).
In Uganda, bananas are a vital staple food for a significant proportion of the population, providing essential nutrients and contributing to food security. Uganda, with a daily per capita consumption of approximately 0.7 kg/person, ranks highest in the consumption of bananas in the world (Kilimo Trust, 2012). Additionally, bananas serve as an important source of income for smallholder farmers, supporting their livelihoods and fostering economic development in rural communities. Uganda, with a production of 9.2 to 9.4 million tons between 2019 and 2021 ranks fourth in the production of bananas and plantains combined globally and first in Africa (FAO, 2023; UBOS, 2020). The spread of BBTD into Uganda is thus a serious concern because it can cause significant economic losses and food insecurity, negatively impacting the livelihoods of smallholder farmers and other people depending on this crop along the banana value chain. Following the first report of the disease in the northwestern region of Uganda (Ocimati et al., 2021), further incursions have been confirmed in the Kasese district (Rwenzori subregion) bordering the DR Congo (Ocimati, unpublished results). In affected landscapes within Uganda, individual smallholder farms have reported up to 100% loss in yields and incomes (Ocimati, unpublished results).
The risk of BBTD spread to other banana production zones within Uganda remains high due to several factors including the lack of awareness on BBTD, its symptoms, epidemiology, and control; heavy reliance on suckers sourced from farmers’ own or neighboring farms for planting materials; lack of proper quarantine measures; and limited resources for implementing appropriate control measures. BBTV is known to spread through infected planting materials and via the aphid vector Pentalonia nigronervosa (Magee, 1927) that are omnipresent in all banana-growing regions. The ability of the disease to entrench itself within a landscape given deployment of proper management practices is dependent upon the opportunity for the survival of infective aphids to spread the virus, susceptibility of host plants, and efficiency in detection of infected plants before they become a source of inoculum. In addition to crop management practices, multiple environmental factors including temperature, altitude, precipitation, wind speed, and abundance of the host influence the vulnerability of landscapes to BBTD (Bouwmeester et al., 2023; Niyongere et al., 2013; Raymundo and Pangga, 2011).
In Uganda, management of the disease in currently infected landscapes and prevention of further spread into new production zones require a proper understanding of the vulnerability of the different banana production landscapes to disease introduction and/or establishment. Thus, mapping of the vulnerability of banana production landscapes to BBTD is an essential step toward developing targeted management strategies and implementing preventive measures. By identifying areas at higher risk of disease introduction and/or establishment, stakeholders can prioritize resources and interventions, thereby reducing the overall impact of BBTD on banana production systems. Moreover, mapping vulnerability will aid in decision-making processes, such as implementing disease surveillance programs, designing strategies for disease containment and eradication, and prioritization of limited resources.
This study highlights the findings of initial diagnostic studies conducted on sampled farms in the affected regions and provides a prediction of the risk/vulnerabilities of the different banana production landscapes in Uganda to the establishment and local spread of BBTD. The study utilized a combination of field diagnostic surveys and spatial analysis, to assess past distribution patterns and factors influencing the vulnerability of the banana ecosystem in Uganda to BBTD.
Materials and methods
This study builds on the first report of BBTD in the West Nile region of Uganda (Ocimati et al., 2021). The study comprised i) field surveys in high-risk zones of Uganda, that either border or are close to the borders of the DR Congo, Rwanda, and Tanzania that are either hot spots or have reported cases of BBTD; and ii) mapping of the disease risk [introduction and spread] for the Ugandan banana-producing landscapes using statistical tools.
Field surveys to characterize banana farms
Diagnostic surveys were conducted in 46 districts of Uganda located in the border zones with South Sudan, the DR Congo, Rwanda, and northwestern Tanzania (Figure 1).
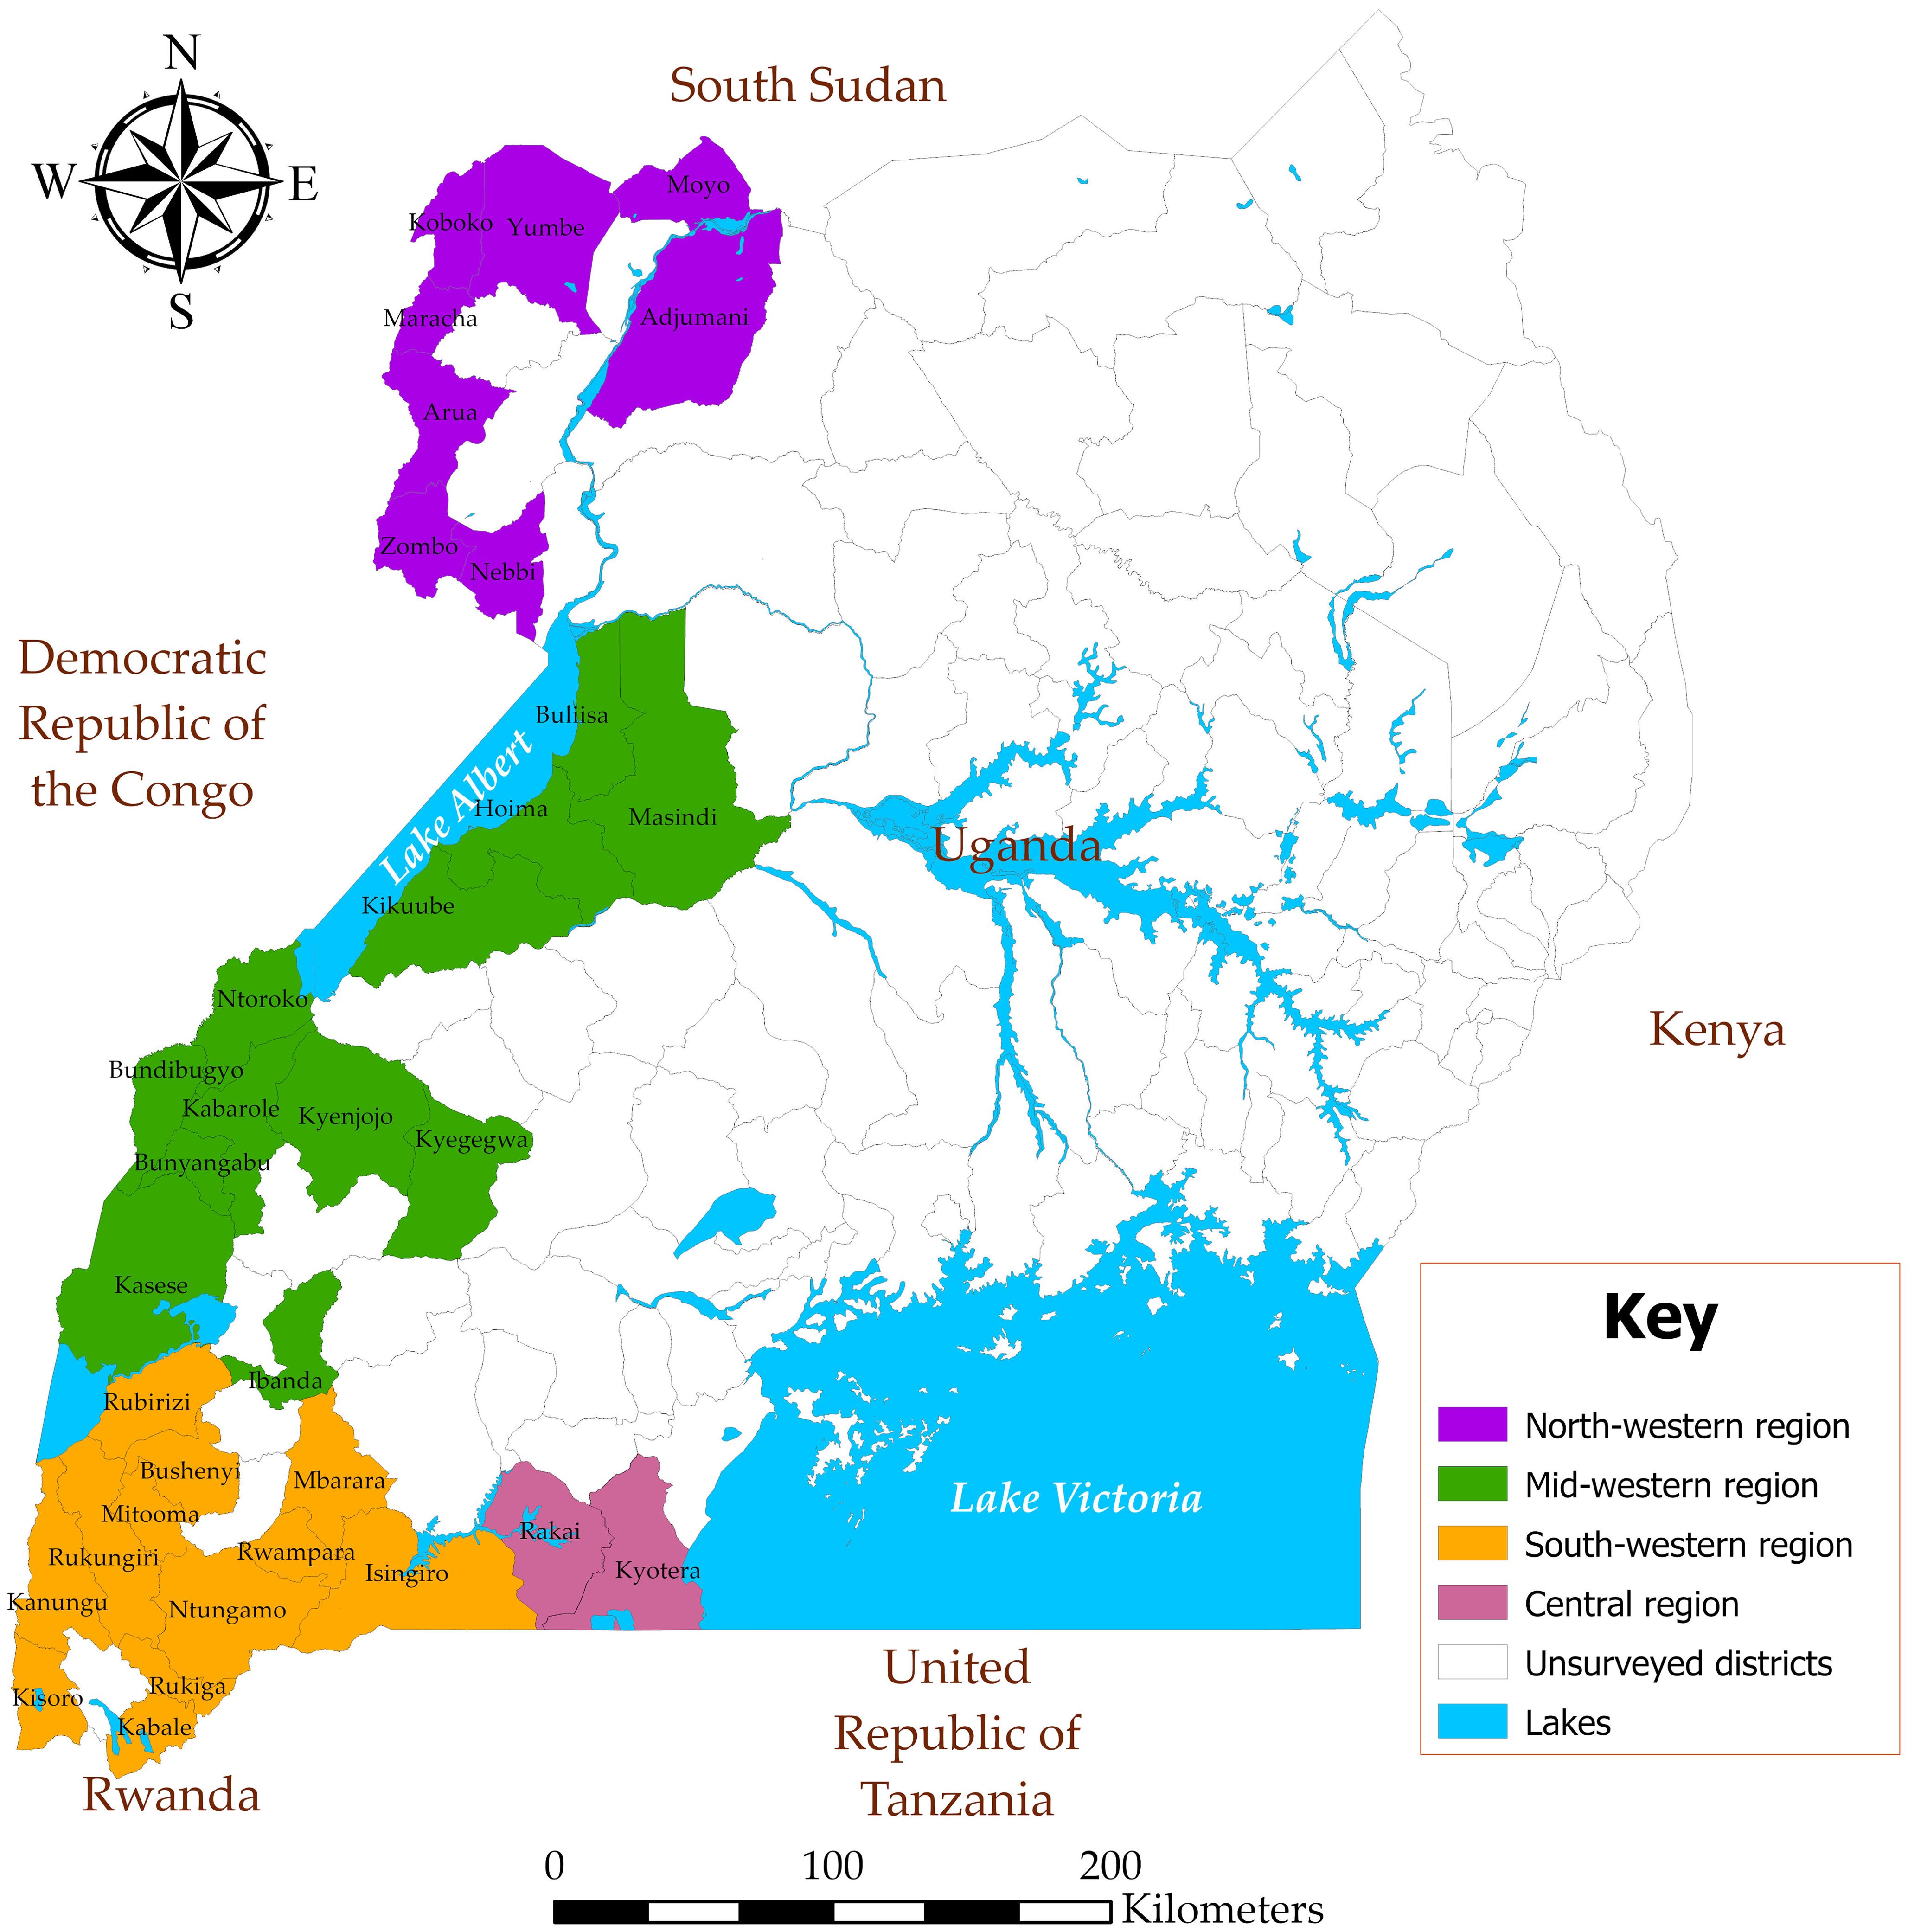
Figure 1. Uganda map showing the surveyed regions and districts.
A combination of stratified purposive sampling and respondent-driven snowball sampling techniques was employed in this study. A stratified purposive sampling was attained by selecting, with guidance from the district and subcounty agricultural extension staff, subcounties, and parishes with high banana production and/or bordering BBTD hot spots. Farms in these subcounties were randomly visited and sampled through the snowball sampling technique. Snowball sampling is a recruitment technique through which research participants assist in identifying or enlisting other potential subjects (Naderifar et al., 2017). In each visited farm, a simple interview schedule administered by trained agricultural personnel was used to capture information relevant to BBTD establishment and spread. This included the geographical location of the farm (altitude, latitude, and longitude), presence or absence of BBTD, first year of disease observation if present on farm, management practices on the field (e.g., intercropping vs. monoculture, source and type of planting material used), age of banana plantations and the applied management practices, and Musa diversity and affected varieties (Bouwmeester et al., 2023; Niyongere et al., 2013). The interviewers used photos to show the characteristic symptoms of BBTD such as different levels of rosetting and Morse codes, i.e., dark green streaks on the leaves, petioles, midribs, and leaf lamina (Figure 2) to help farmers confirm the presence of symptomatic plants on their farms or in the neighborhood.
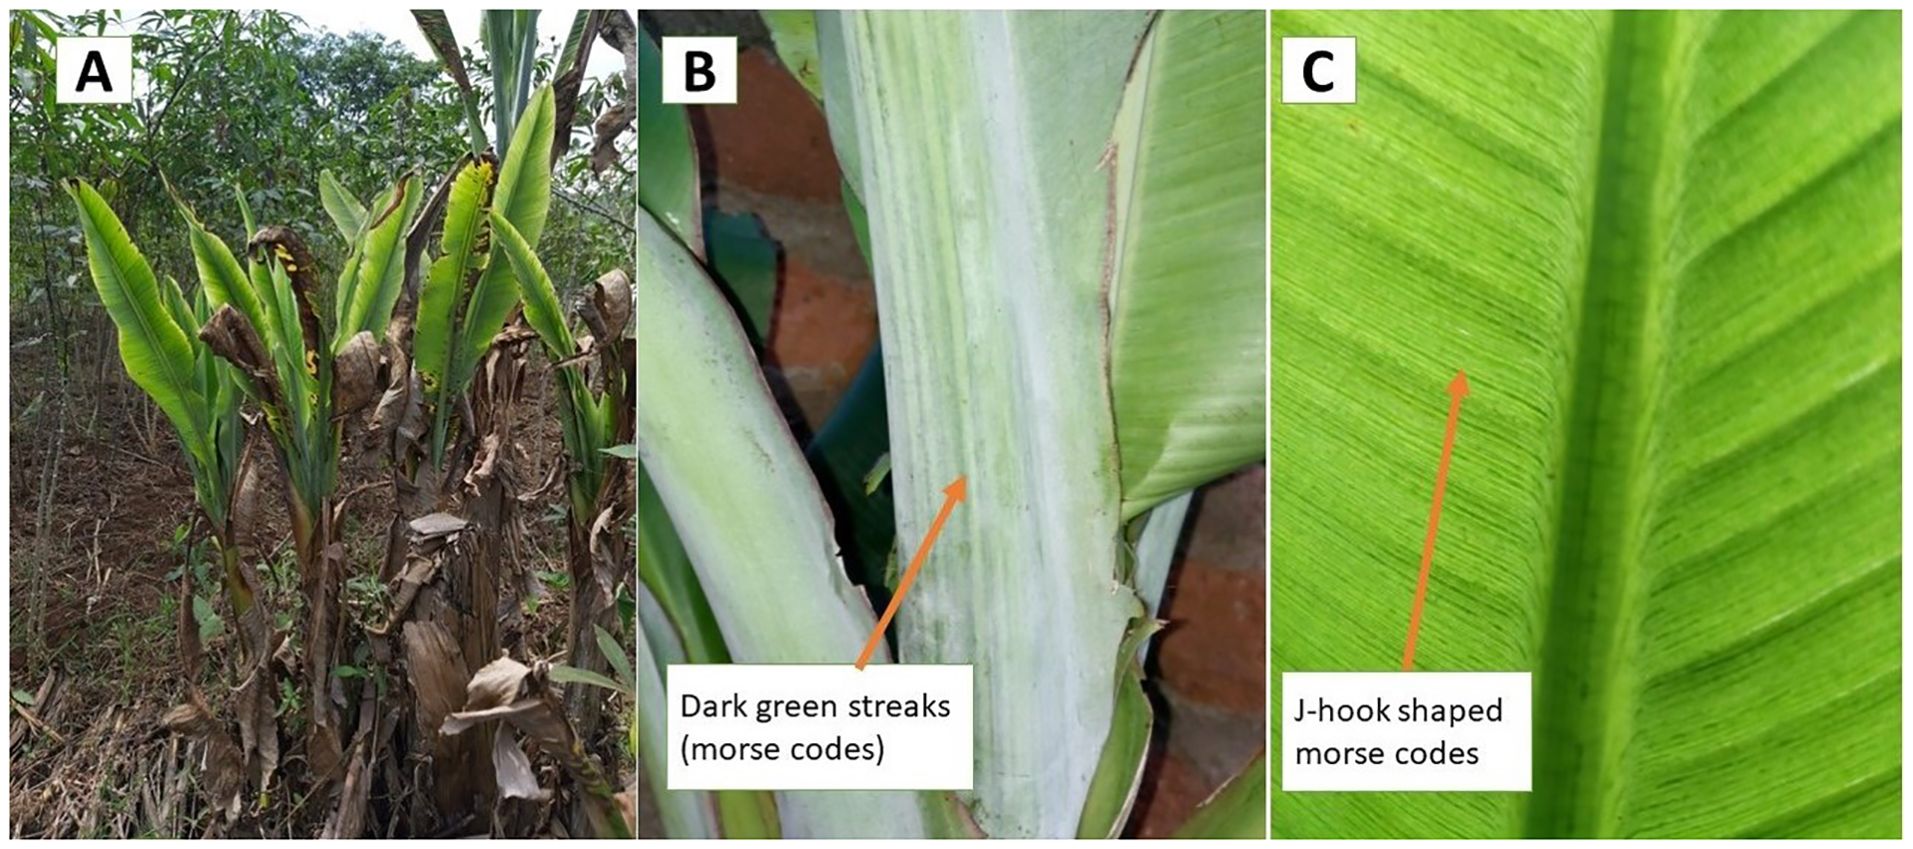
Figure 2. Banana plants with typical banana bunchy top disease symptoms. (A) Rosetted plants with a bunchy appearance and marginal leaf yellowing, (B) Morse codes on the petiole of infected plants, and (C) Morse codes in the form of J-shaped hooks on banana leaf lamina.
The interviewers examined plants within the fields to confirm the presence or absence of the disease. Where the disease was observed or reported in the neighborhood by farmers, through the snowball approach, these suspected farms were also visited. Samples were collected from plants with characteristic BBTD symptom(s) for laboratory analysis to confirm the presence of the BBTV. BBTV was confirmed with the help of a PCR using primers that amplify a 240-bp conserved domain in the BBTV DNA-mRep segment (Mansoor et al., 2005).
The datasets were cleaned and preprocessed in Microsoft Excel (version 2302, build 16130.20332), and ANOVA determined using RStudio software (version 2023.3.0.386; RStudio Team, 2023) was used to compare means across sites. R statistical package was also used to generate visuals.
Mapping the risk of BBTD spread and establishment in Uganda
For BBTD risk mapping, the entire country of Uganda, covering an area of approximately 241,038 km2, was used. Uganda borders South Sudan in the north, Kenya in the east, Tanzania and Rwanda in the south, and the DR Congo in the west.
Datasets for disease risk mapping
Datasets used for BBTD risk mapping consisted of field survey results and maps/databases of key covariates known to influence BBTD spread. Data from three field surveys conducted between 2020 and 2022 that determined the presence and/or absence of BBTD along high-risk banana-producing areas in Ugandan districts bordering the DR Congo, South Sudan, Rwanda, and Tanzania were used. The first two surveys concentrated on the northwestern region of Uganda that already had reported BBTD cases, while the third survey stretched from the border regions with South Sudan in the north, DR Congo in the west, and Rwanda and Tanzania in the south. The three surveys generated a total of 630 survey data points. All plants reported to have BBTD were checked for BBTV using PCR, and only farms with plants confirmed as infected were retained as positive. The field survey datasets were subjected to cleaning and preprocessing using Microsoft Excel (version 2302, build 16130.20332), while shape files were processed using QGIS (version 3.30.0, Hertogenbosch).
Predictor variables (covariates) for mapping BBTD risk
The covariate datasets were downloaded as raster files (“.tiff”) from publicly available databases (Table 1). The environmental characteristics, banana production statistics, and other socioeconomic covariates that influence both the banana aphid vector and the virus (Bouwmeester et al., 2023; Niyongere et al., 2013; Raymundo and Pangga, 2011) were used in a model to predict the presence of BBTD or the likelihood (risk) of disease spread to unsurveyed locations (Bouwmeester et al., 2023).
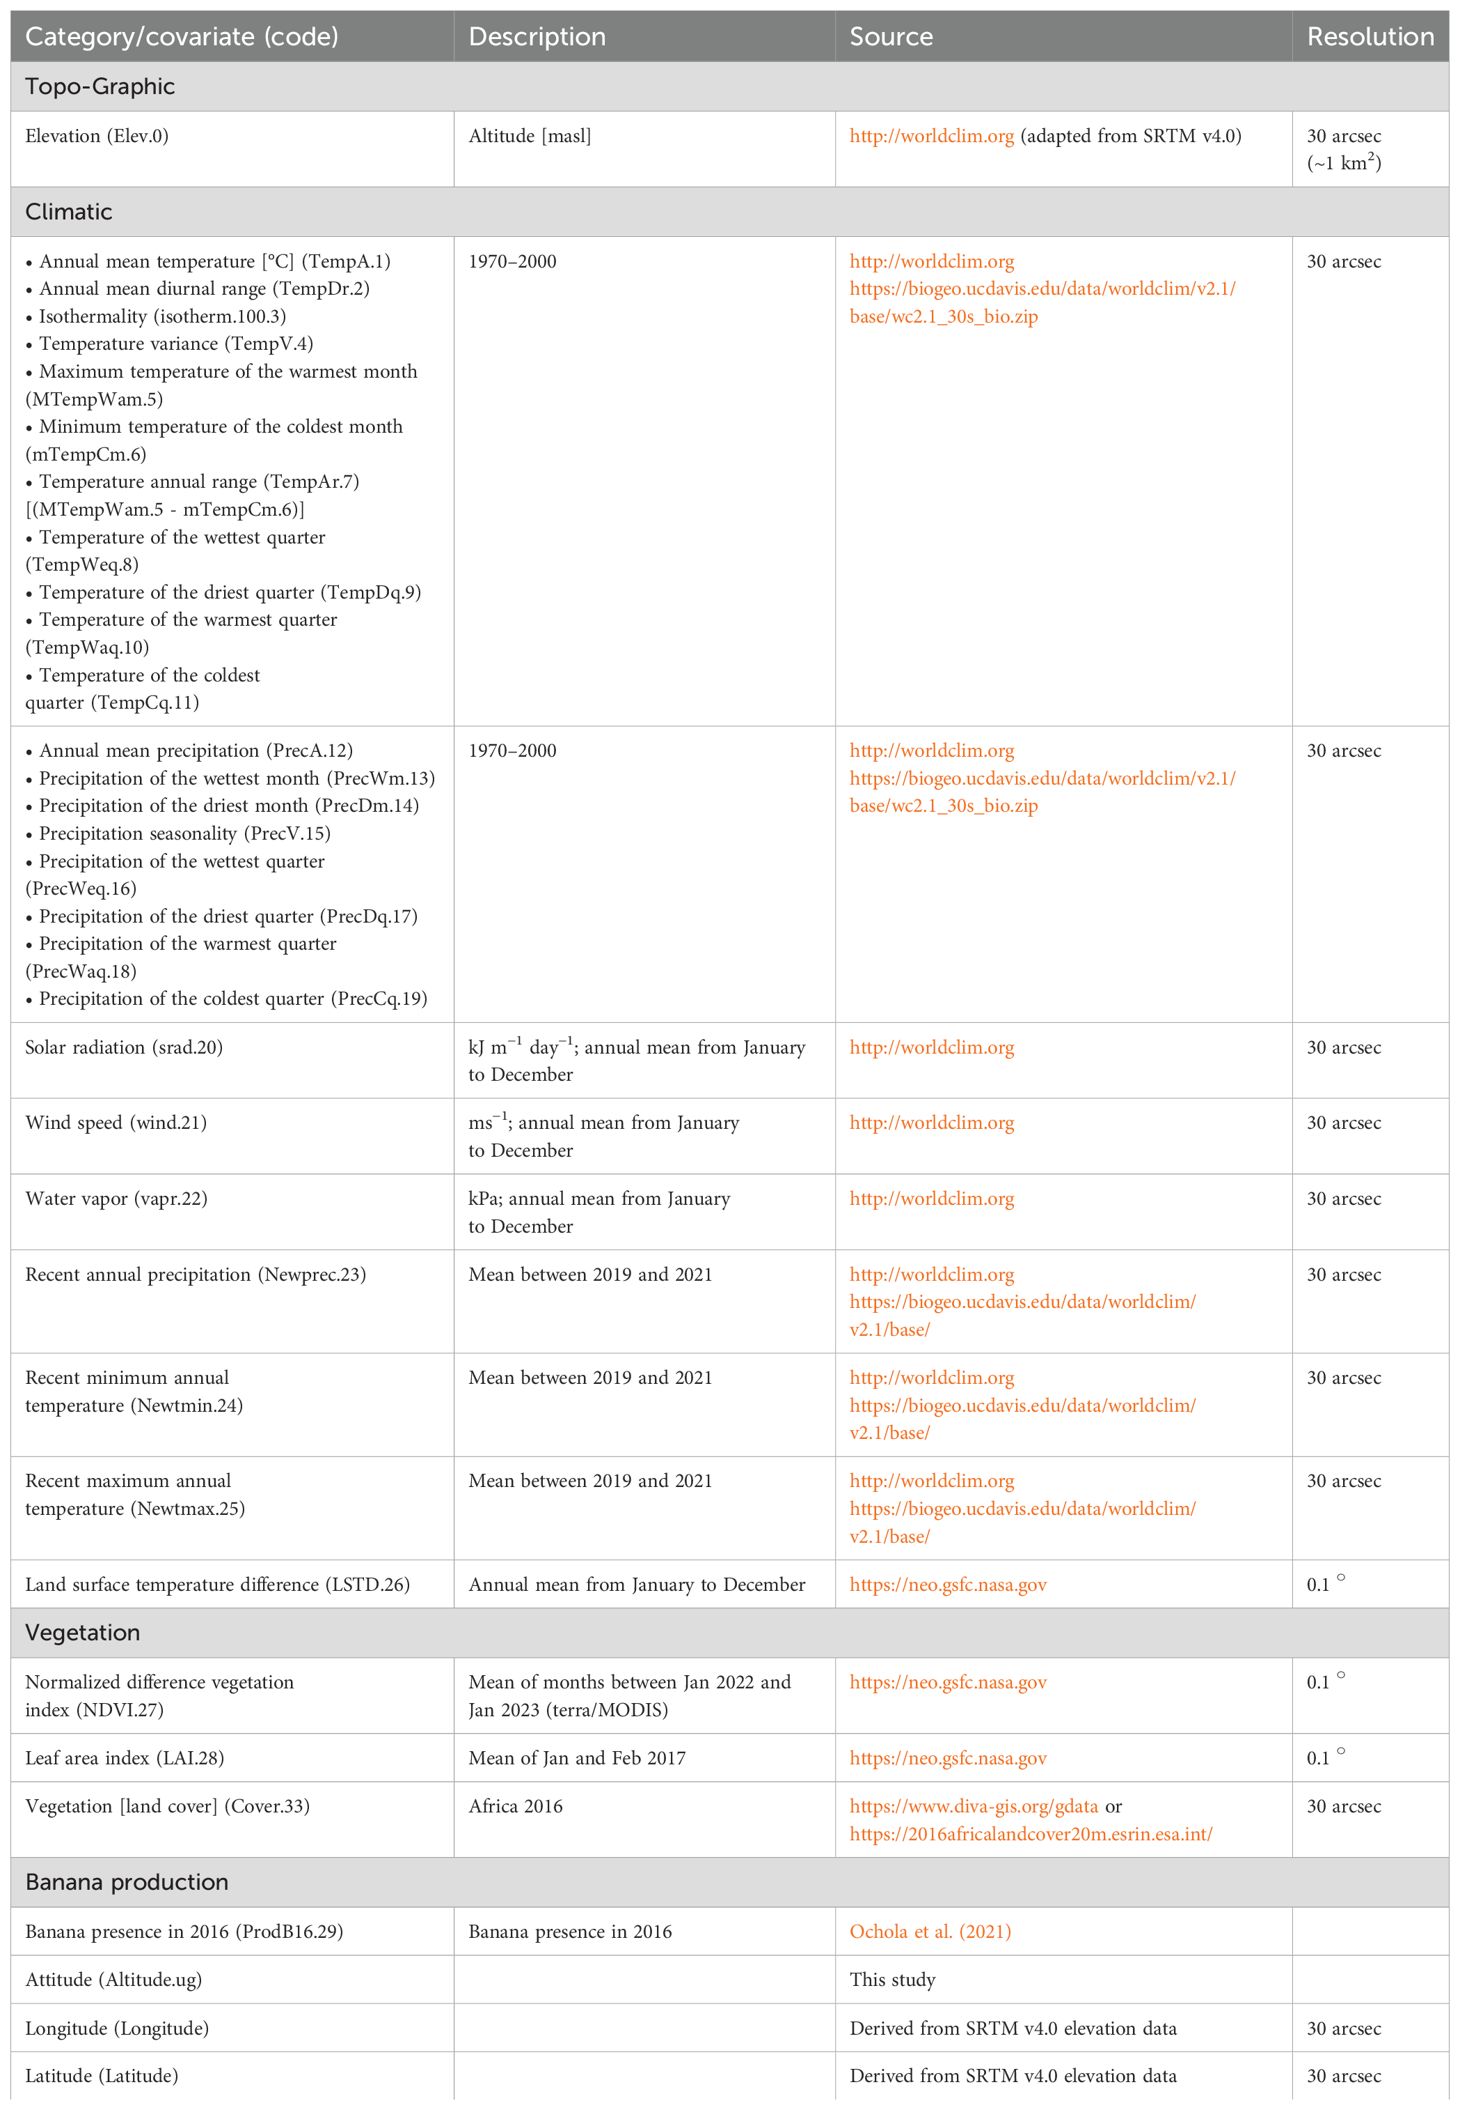
Table 1. Initial 33 covariates used in the study.
Covariate processing and data analysis were done in RStudio software (version 2023.3.0.386; RStudio Team, 2023), using R programming language (version 4.2.3; R Core Team, 2023). Meanwhile, mapping was done in ArcGIS Pro software (version 3.0.0; Esri, 2023).
Most of the covariates were imported as objects into RStudio at a resolution of 30 arcsec (~1 km2). Those that were not to this projection were first re-projected to the elevation using the “projectRaster” function of R. Banana presence raster of 2016 (Ochola et al., 2021, 2022) was used for banana production data.
All variables were masked to the Ugandan polygon shape which is in the WGS 1984 coordinate system and then to the elevation raster to ensure a similar extent, with a bilinear method. The cropped and masked rasters were written as rasters (“writeRaster” function) for future use as Ugandan raster files for plotting covariate maps.
Variable omissions using correlation and regression analysis
The data points of each covariate at the surveyed location were first extracted by transforming the surveyed datasets into a data frame of a coordinate system (longitude, latitude, and altitude) using the “extract” function of the raster package in R. The Pearson correlation analysis was performed to establish correlations between all the variables. Correlation analysis was performed to select a single covariate to represent those that are highly correlated or collinear (r ≥ 0.95). A univariate logistic regression analysis of the remaining independent variables (covariates) against disease presence or absence (dependent variable) was then carried out to remove covariates with p-values greater than or equal to 0.25 (p ≥ 0.25). Thus, a combination of causal reasoning, omission of variable with very high collinearity (>95%), and use of information criterion (regression) analysis were used to deal with collinearity or near collinearity between covariates and reduce the number of covariates. Gregorich et al. (2021) suggest the use of casual reasoning and information criterion in dealing with collinearity as the best approaches to prevent the generation of models of little or no practical use and misleading interpretations.
Model fit in a logistic regression model
Regression models use the relationship between the dependent variable and the covariates to predict at the unobserved locations. The covariates from the univariate logistic regression analysis with a probability significance of p ≤0.25 were cropped, and their masked raster files were exported to ArcGIS software and each was plotted to the Uganda boundary shape (Figure 3).
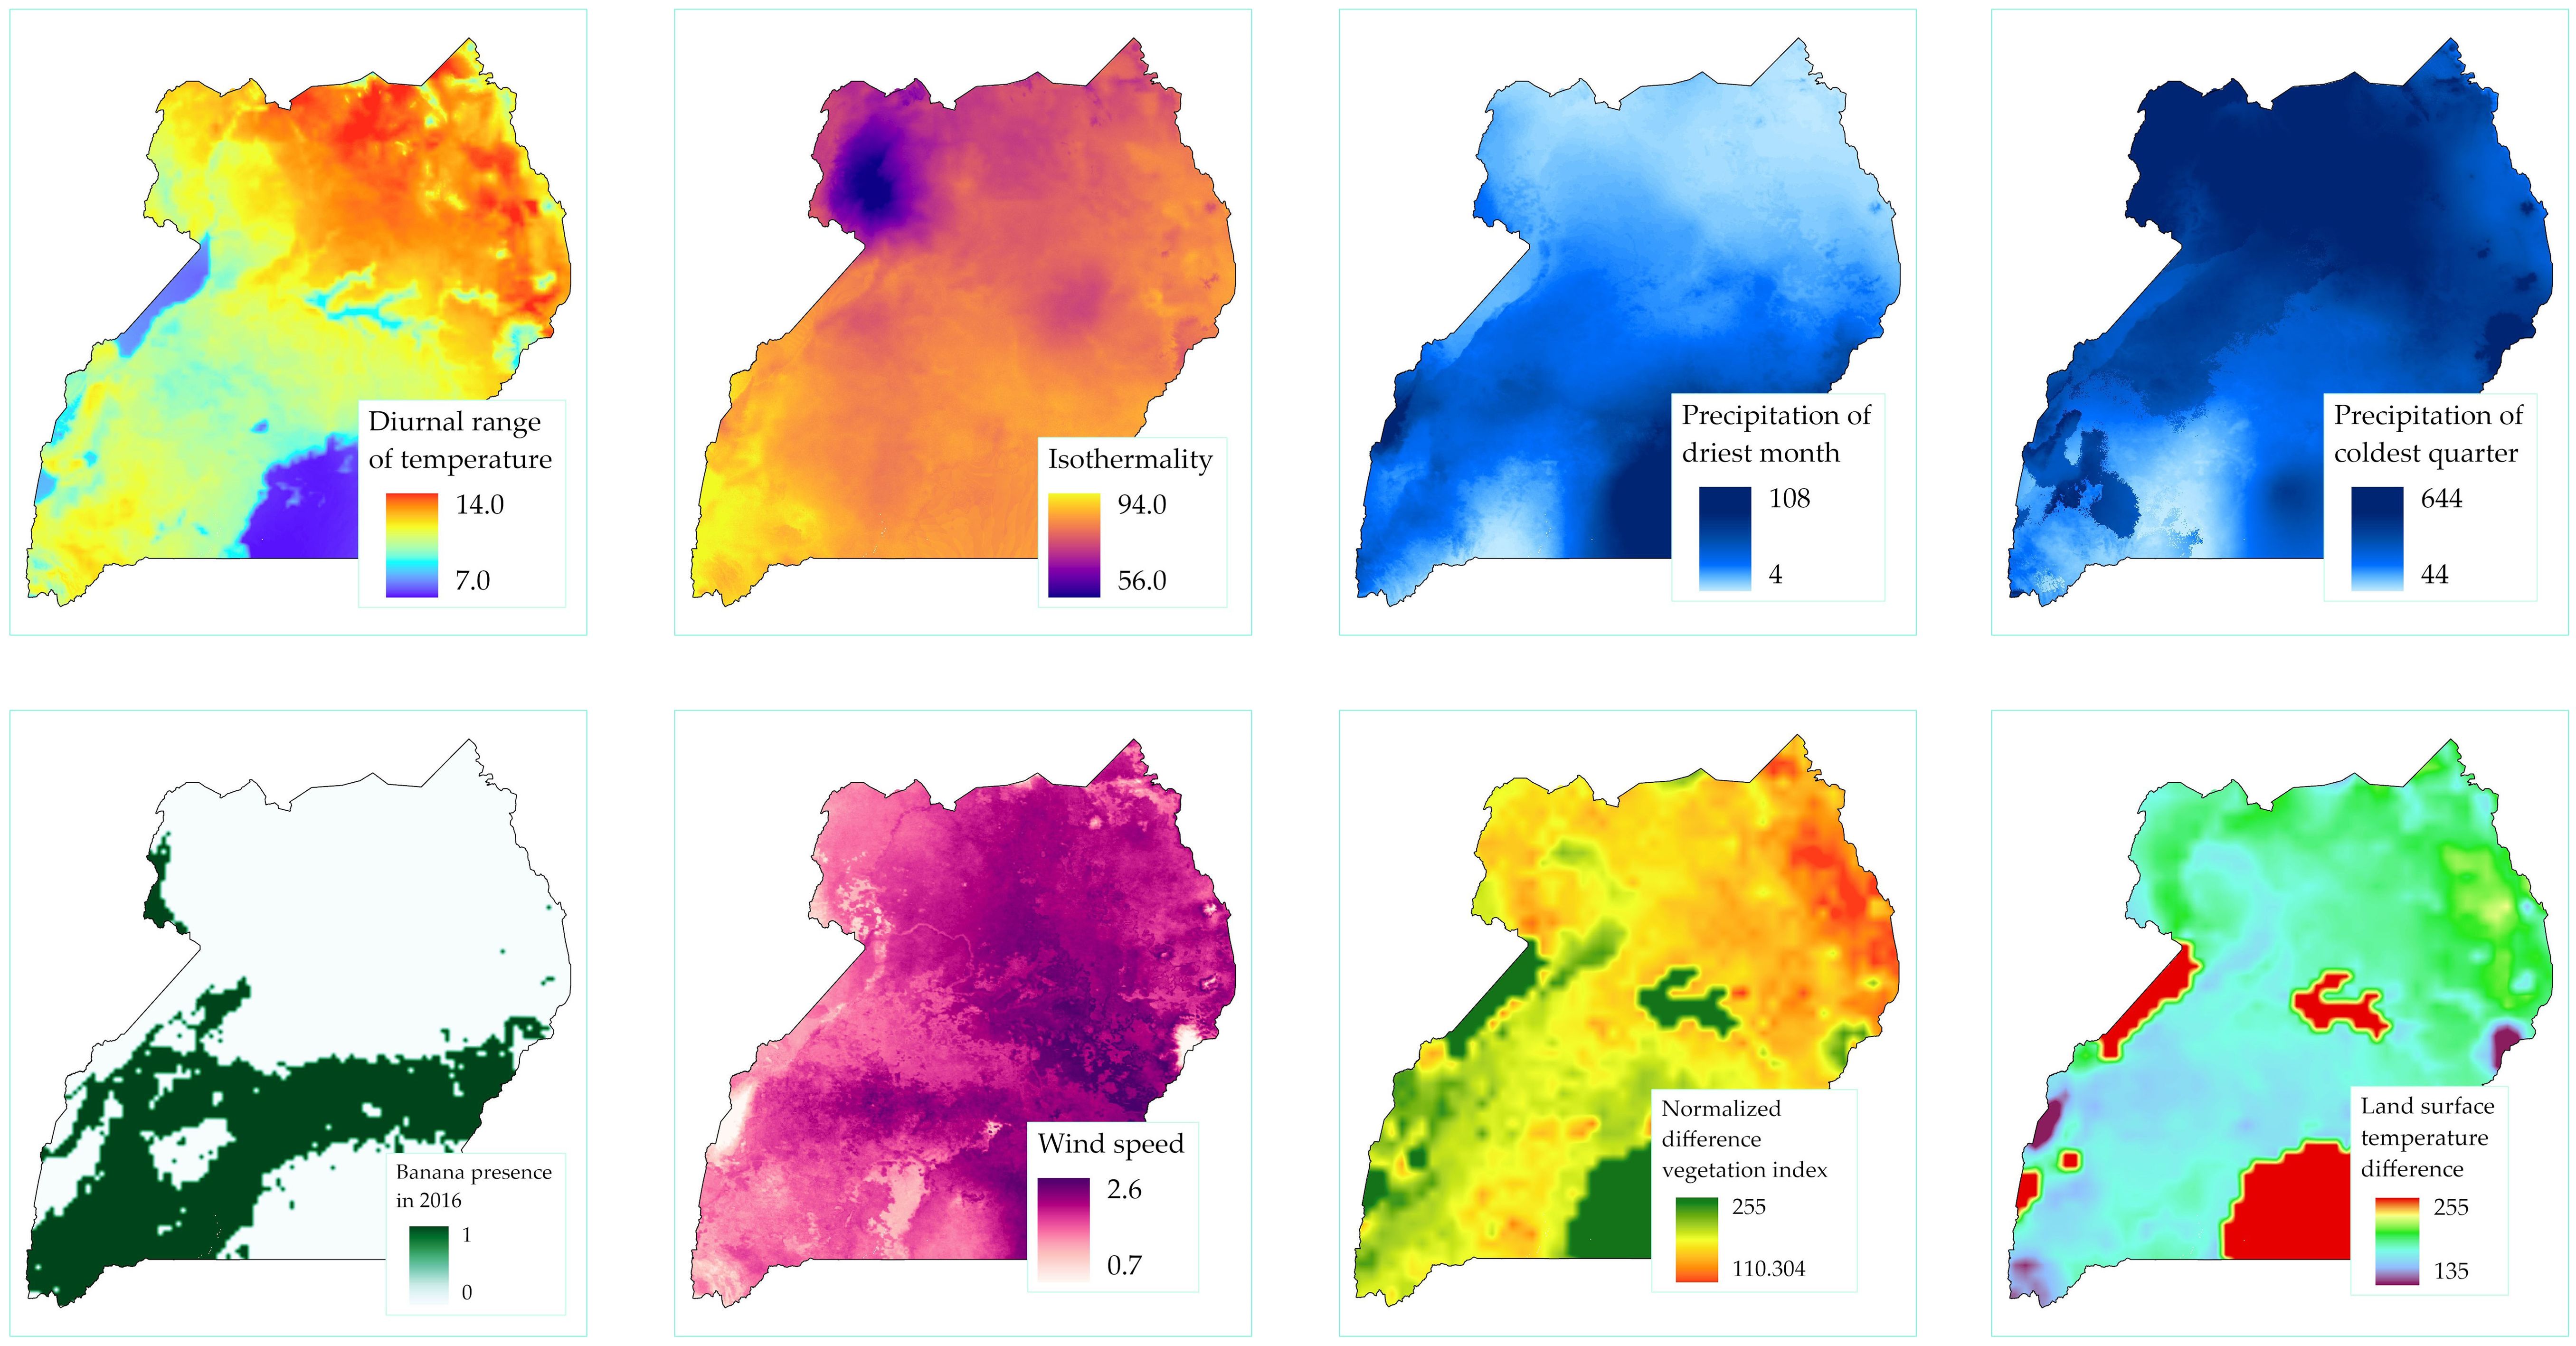
Figure 3. Covariate maps for the eight variables used in the multivariate regression analysis.
These covariates were then entered into a multivariate logistic regression model using the glm function with the method of “logit.” Using stepwise regression, on both forward and reverse directions, the covariates that were not significant at 5% (p ≤ 0.05) were removed one at a time. In addition, two-way interactions between covariates were included to check for those interaction effects that could improve the likelihood ratio. All significant (p ≤ 0.05) covariates from the first stepwise regression and all significant interactions at p ≤0.001 were included in the final multivariate regression model as above to explain the relationship between BBTD presence or absence with the predictor variables (covariates). The final goodness-of-fit model is expressed as:
and
Where P is the likelihood of BBTD presence; z is the linear combinations of and Xi, is the intercept, and ,…, to are the coefficients of the covariate factors X1, X2, X3,…, to Xn that influence the presence, distribution, and risk of spread of BBTD; and is the error term.
The final derived logistic regression model was stacked or applied to the final covariate maps to obtain the regression prediction map showing the risk of spread/environmental suitability of Ugandan landscapes to the spread and establishment of BBTD. The risk of BBTD spread and/or likely distribution in the logistic regression model was therefore expressed by the binary response variable of “1”s and “0”s representing BBTD presence and absence, respectively, regressed to other covariates.
Results
Characteristics of banana farms in Uganda’s high-risk zones
A total of 630 banana farms were surveyed across four study regions (i.e., northwestern, midwestern, southwestern, and central regions) of Uganda. The mean area under banana production across the study sites was 0.4 ha. The sampled farms were located at varying altitudes, from as low as 604 meters above sea level (masl) to as high as 2,044 masl (Supplementary Figure 1A). A significant difference (p < 2.2e−16) was observed in altitude across farms in the four study regions of Uganda. The southwestern farms had the highest mean altitude (1,496 masl) with the lowest in the midwestern region (1,159.7 masl). Farms in the south- and northwestern regions were also more diverse in terms of the altitudes. The age of banana fields also differed across the regions (p < 1.062e−05) with plantations above 20 years of age being common. The northwestern region, with an average age of approximately 7.8 years had the lowest plantation age, while the southwestern region had the oldest plantations with an average age of approximately 15 years (Supplementary Figure 1B).
Banana field management practices significantly differed (p < 0.0007 to p < 2.2e−16) across the study regions. Banana intercropping was predominant across the study sites, except in southwestern Uganda where the proportion of those who are intercropping or sole cropping did not differ significantly (p > 0.05) (Figure 4A). Suckers are the predominant planting materials used to establish new plantations and for gap filling (Figure 4B) across the study sites. These planting materials were mainly obtained from the farmers’ own farms and/or from within their communities (Figure 4C). Few farmers, predominantly in north- and midwestern Uganda, planted materials from outside their communities. Outside community sources included other subcounties, districts, and the neighboring countries.
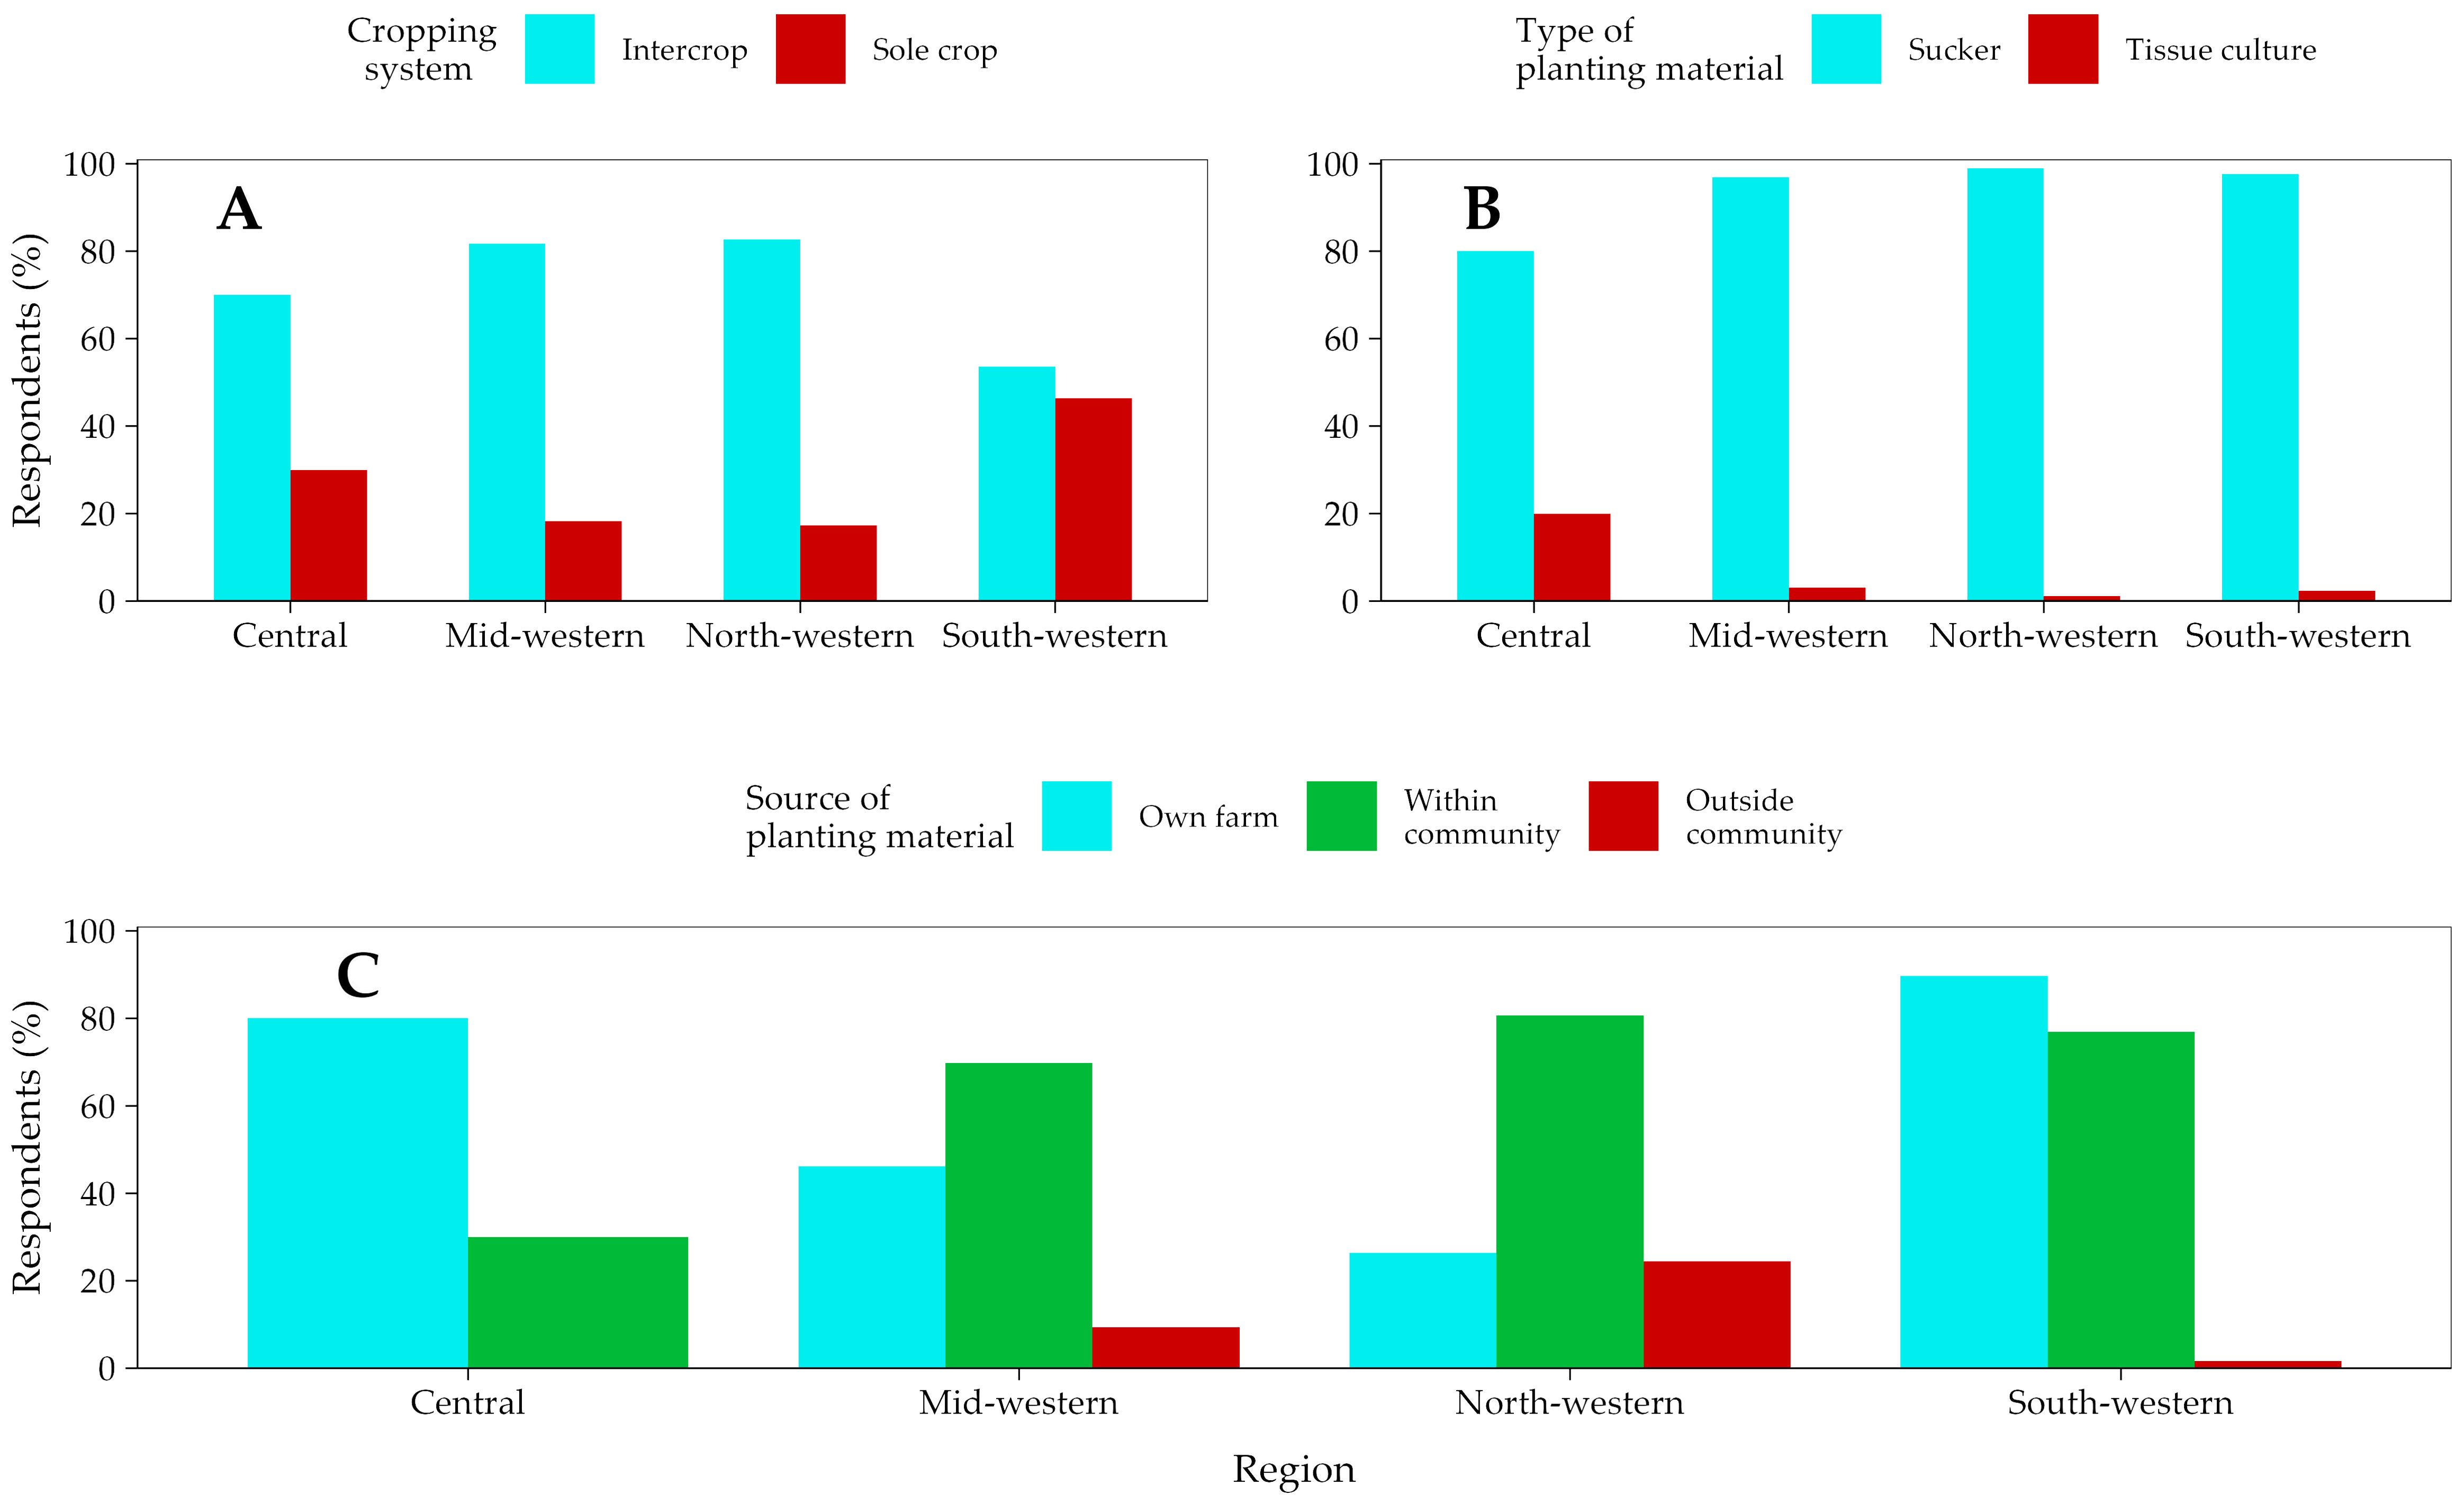
Figure 4. Respondents using different cropping systems (A), types of planting materials (B), and sources of planting materials (C) across the study regions along the western border region of Uganda.
Banana bunchy top disease was observed on approximately 9% of visited farms in the northwestern and midwestern regions. No BBTD was confirmed in the other study regions (Figure 5). Farmers reported to have first observed the disease over a period of 0.5 to 3.35 years (mean = 1.8 years) from the time of the surveys in the northwestern region and over a period of 1.35 to 4.4 years (mean = 2.6 years) in the midwestern region. Mean yield losses between 75% and 91% (mean loss of 89%) were reported by farmers in the northwestern region. High disease severity with losses of up to 100% were also observed on the affected farms in Kasese district, midwestern region. The East African highland bananas (genome AAA) predominate across all the study landscapes. Other banana varieties observed included ‘Bluggoe’ (ABB), ‘Cavendish’ (AAA), apple banana (AAB), FHIA hybrids (AAAB, AAAA), and ‘Pisang Awak’ (ABB). All these banana varieties were observed to succumb to the disease.
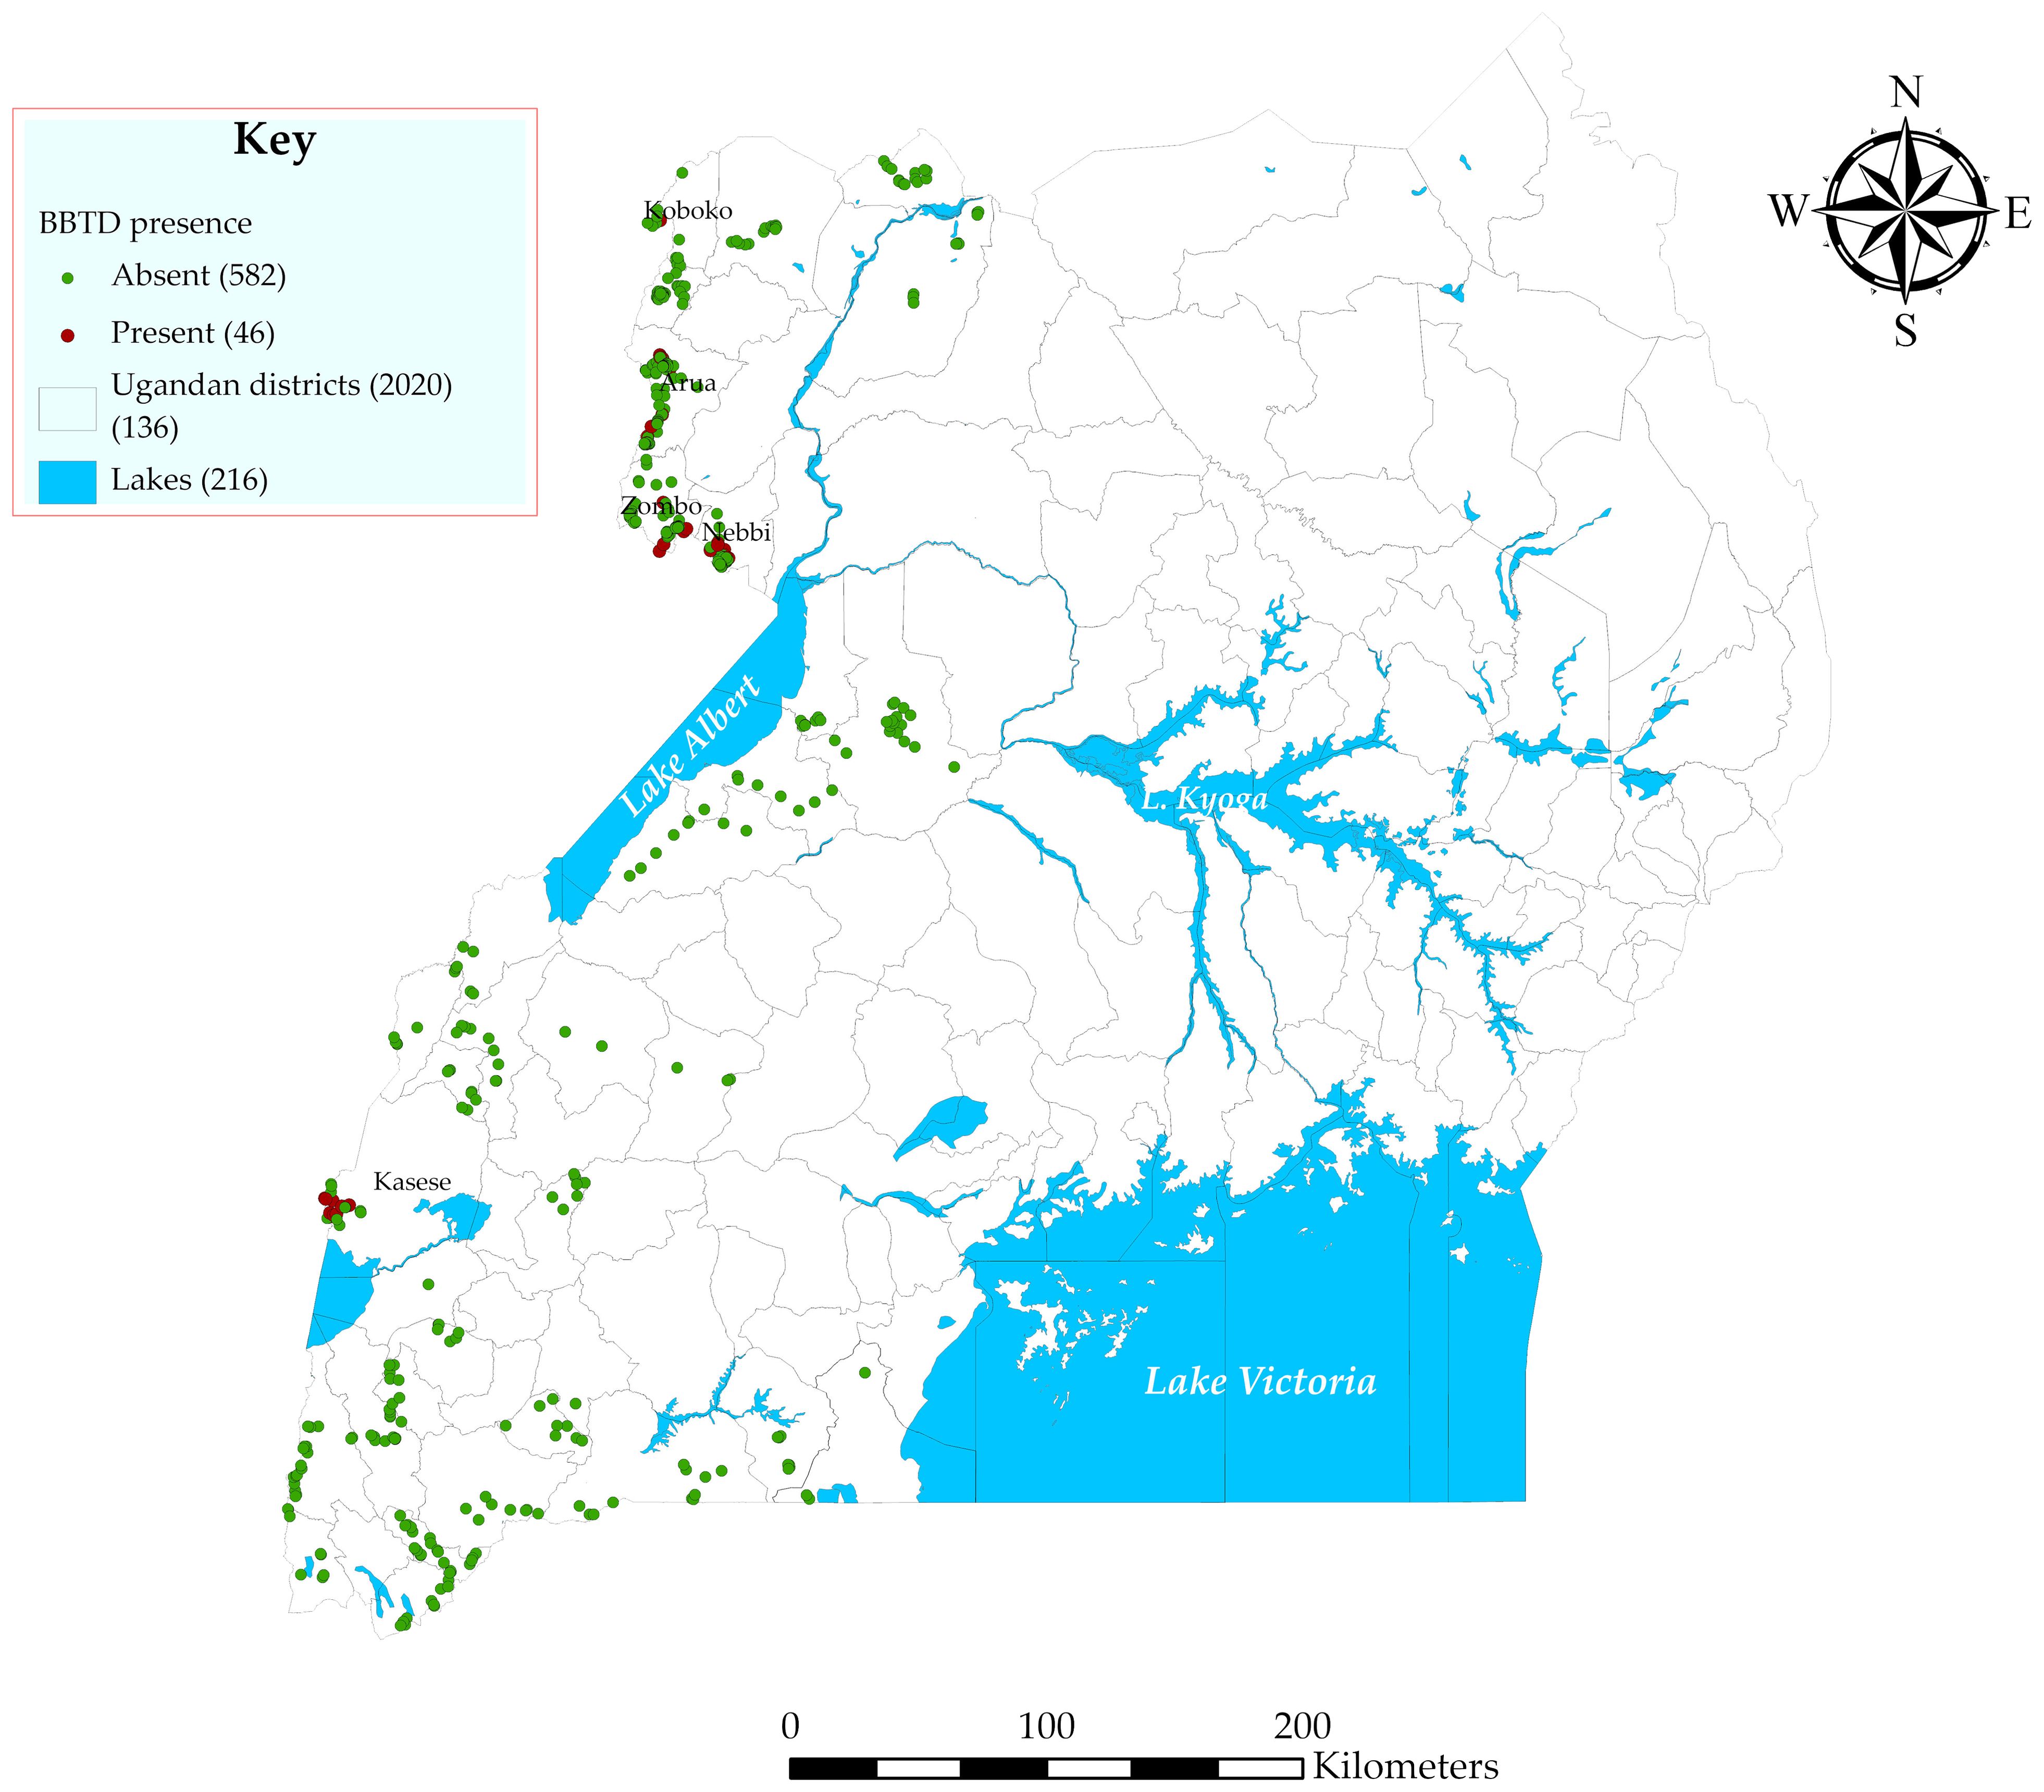
Figure 5. Map showing the presence (red dots) and absence (green dots) of BBTD in the surveyed districts in Uganda.
Farmers responded differently to banana diseases across the study regions. Cutting single diseased stems was the commonest response to diseases on banana farms and was applied on 57%, 91%, and 100% of the farms in the north-, south- and midwestern regions, respectively (Figure 6). Rouging of entire mats was also applied on some farms, predominantly (78% of farms) in southwestern Uganda. Approximately 57% of the farmers in the northwestern region left infected plants on the farm compared to <7% in the mid- and southwestern regions. A small proportion of farmers also abandoned entire fields in the northwestern region of Uganda (Figure 6).
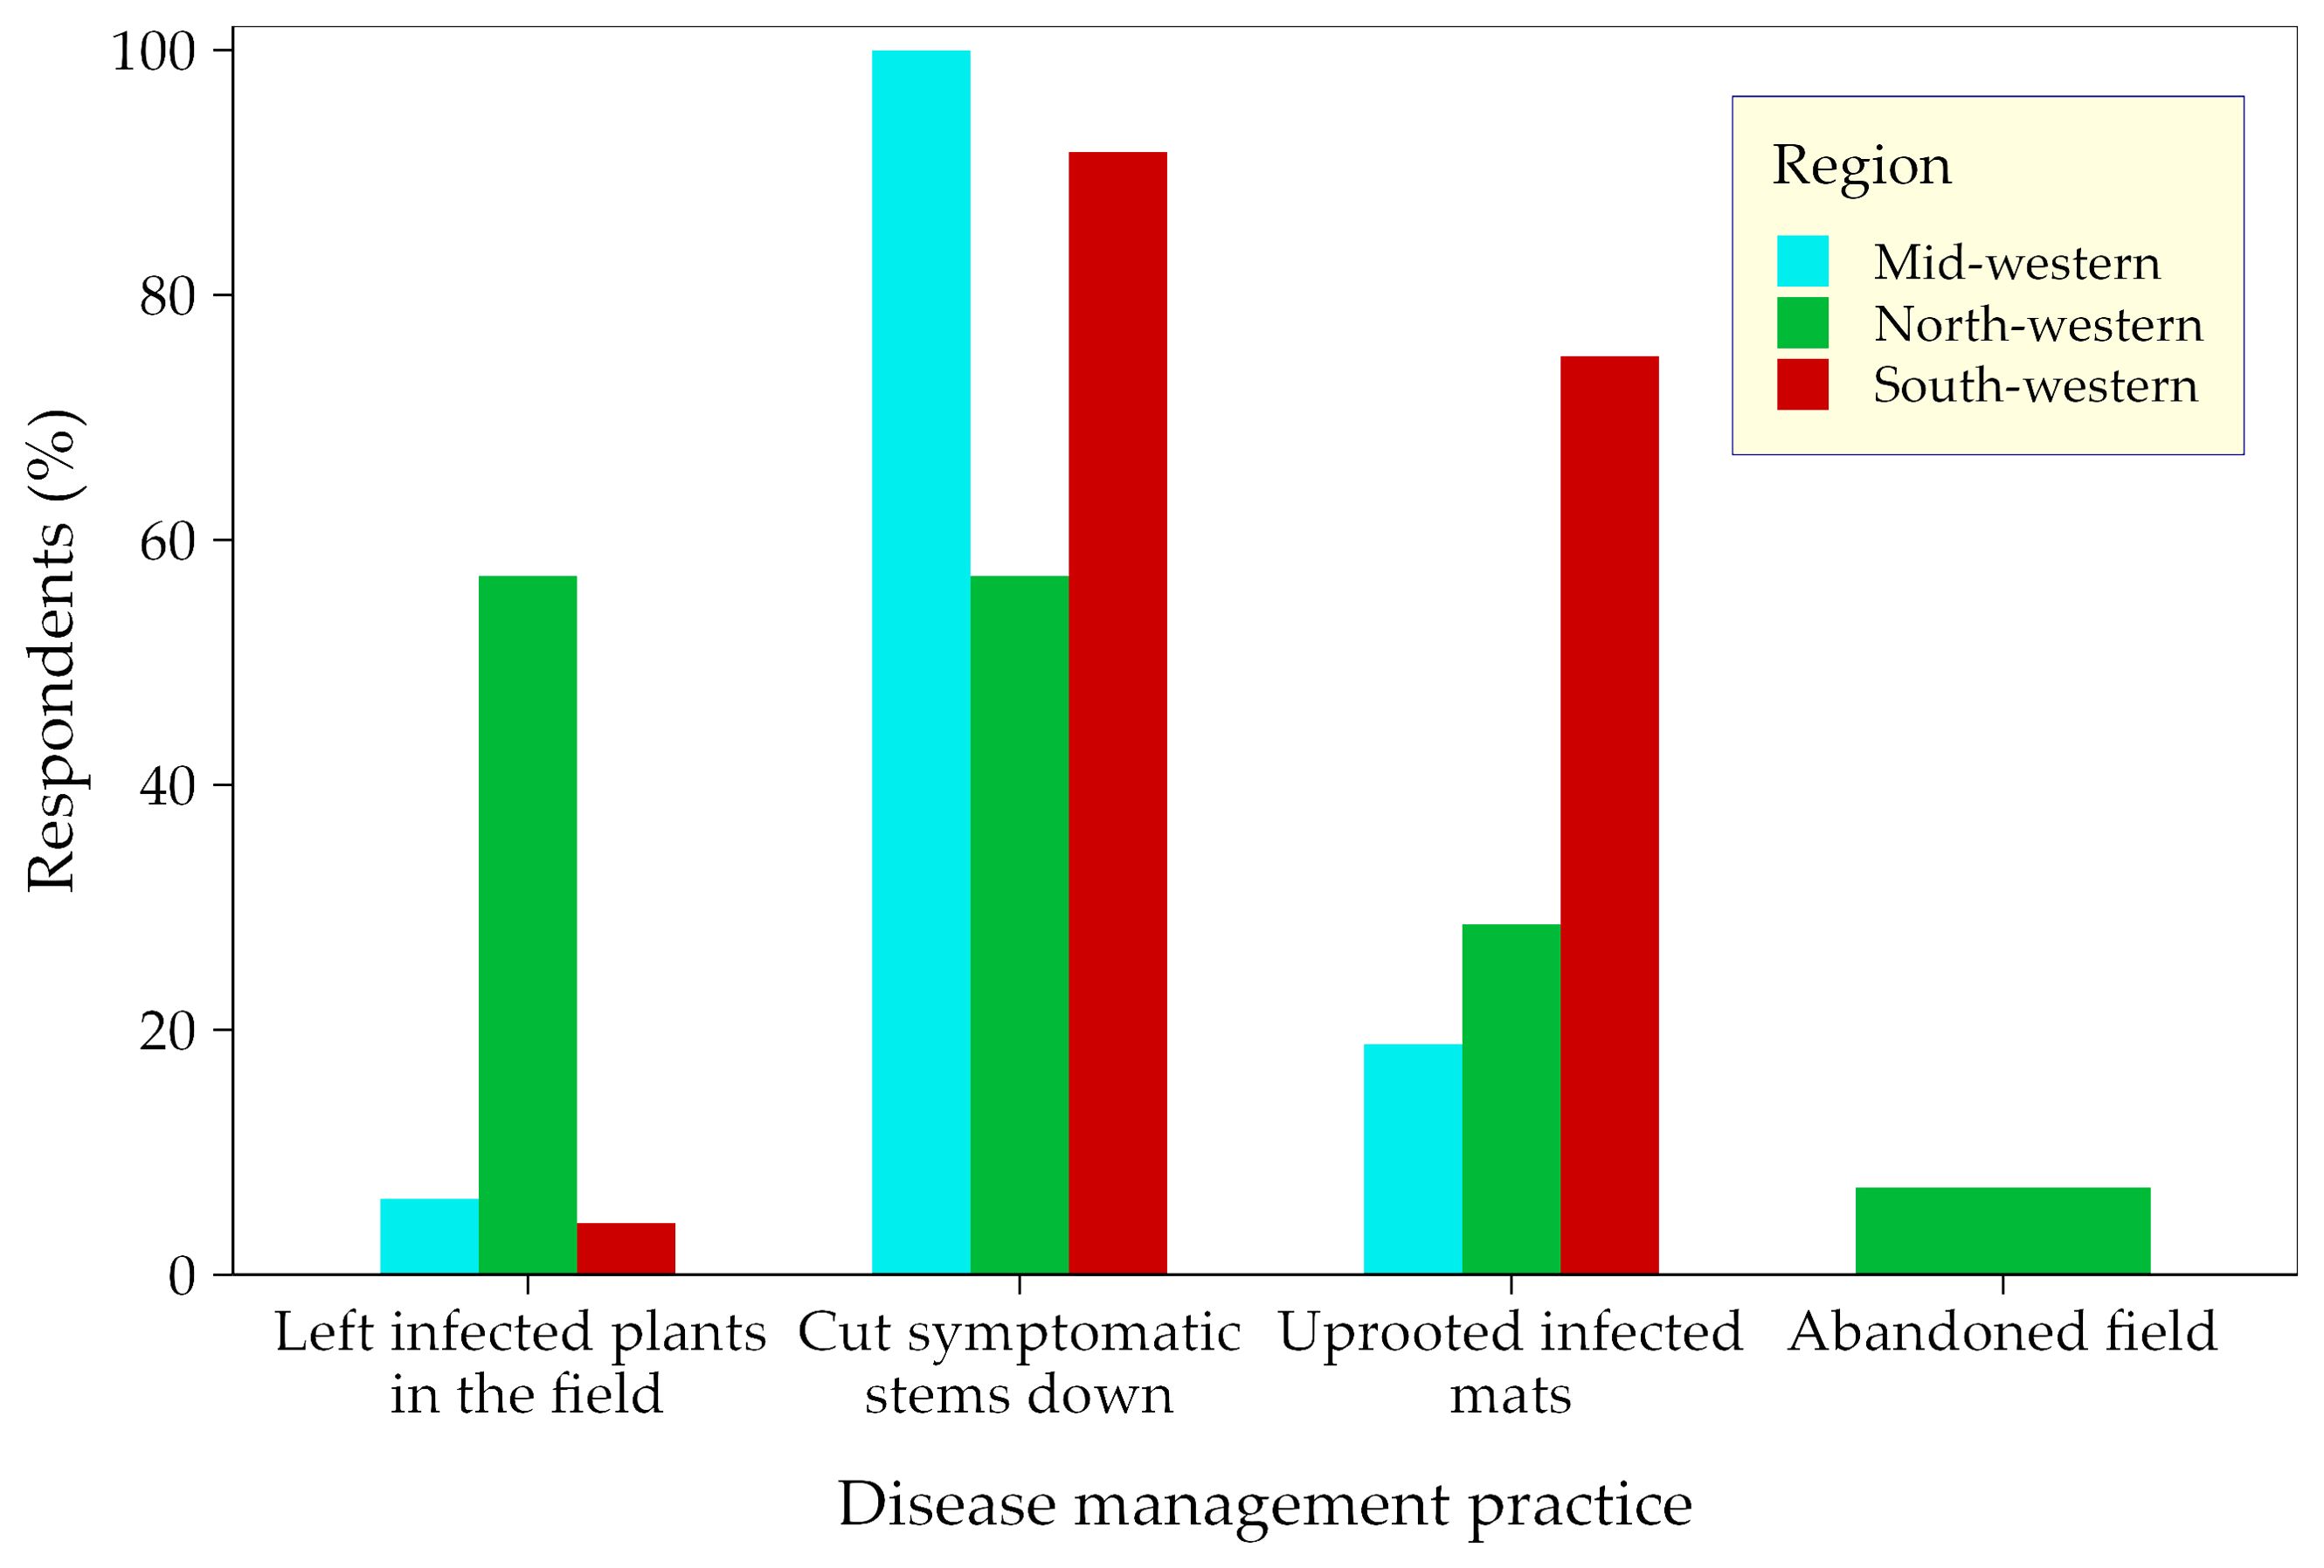
Figure 6. The response of farmers to banana diseases across the surveyed banana landscapes in Uganda.
The risk of BBTD spread and establishment in Uganda
Variable omissions using correlation and regression analysis
Pearson correlation coefficients between the covariates were generally high, especially within covariates that measured a common variable, e.g., temperature and precipitation (Figure 7). For such very high correlations, representative variables were selected for subsequent analysis using the ‘caret’ package in R (Kuhn et al., 2020), reducing the covariates to 21 from an initial 33 covariates. The correlation scores between the covariates and BBTD presence or absence were low, varying between 0 with temperature of the wettest quarter and 0.17 with wind speed (Figure 7). Despite the low loadings, the correlations were highly significant at p <0.05 for seven of the covariates (Supplementary Table 1). Two temperature variables (i.e., annual mean diurnal temperature range and isothermality) had a negative correlation to disease presence, while others were positive. Except for precipitation in the driest month, mean annual precipitation, and coldest quarter, other precipitation variables were negatively correlated to BBTD presence. Wind speed and the normalized difference vegetation index (NDVI) were negatively correlated, while the banana production covariate had a positive correlation (Figure 3). Out of 21 covariates, eight (c.f. Figure 3) had probability values less than 0.25 (p ≤ 0.25) following a univariate logistic regression against disease presence or absence (dependent variable). These eight were retained for the multivariate logistic regression and disease mapping.
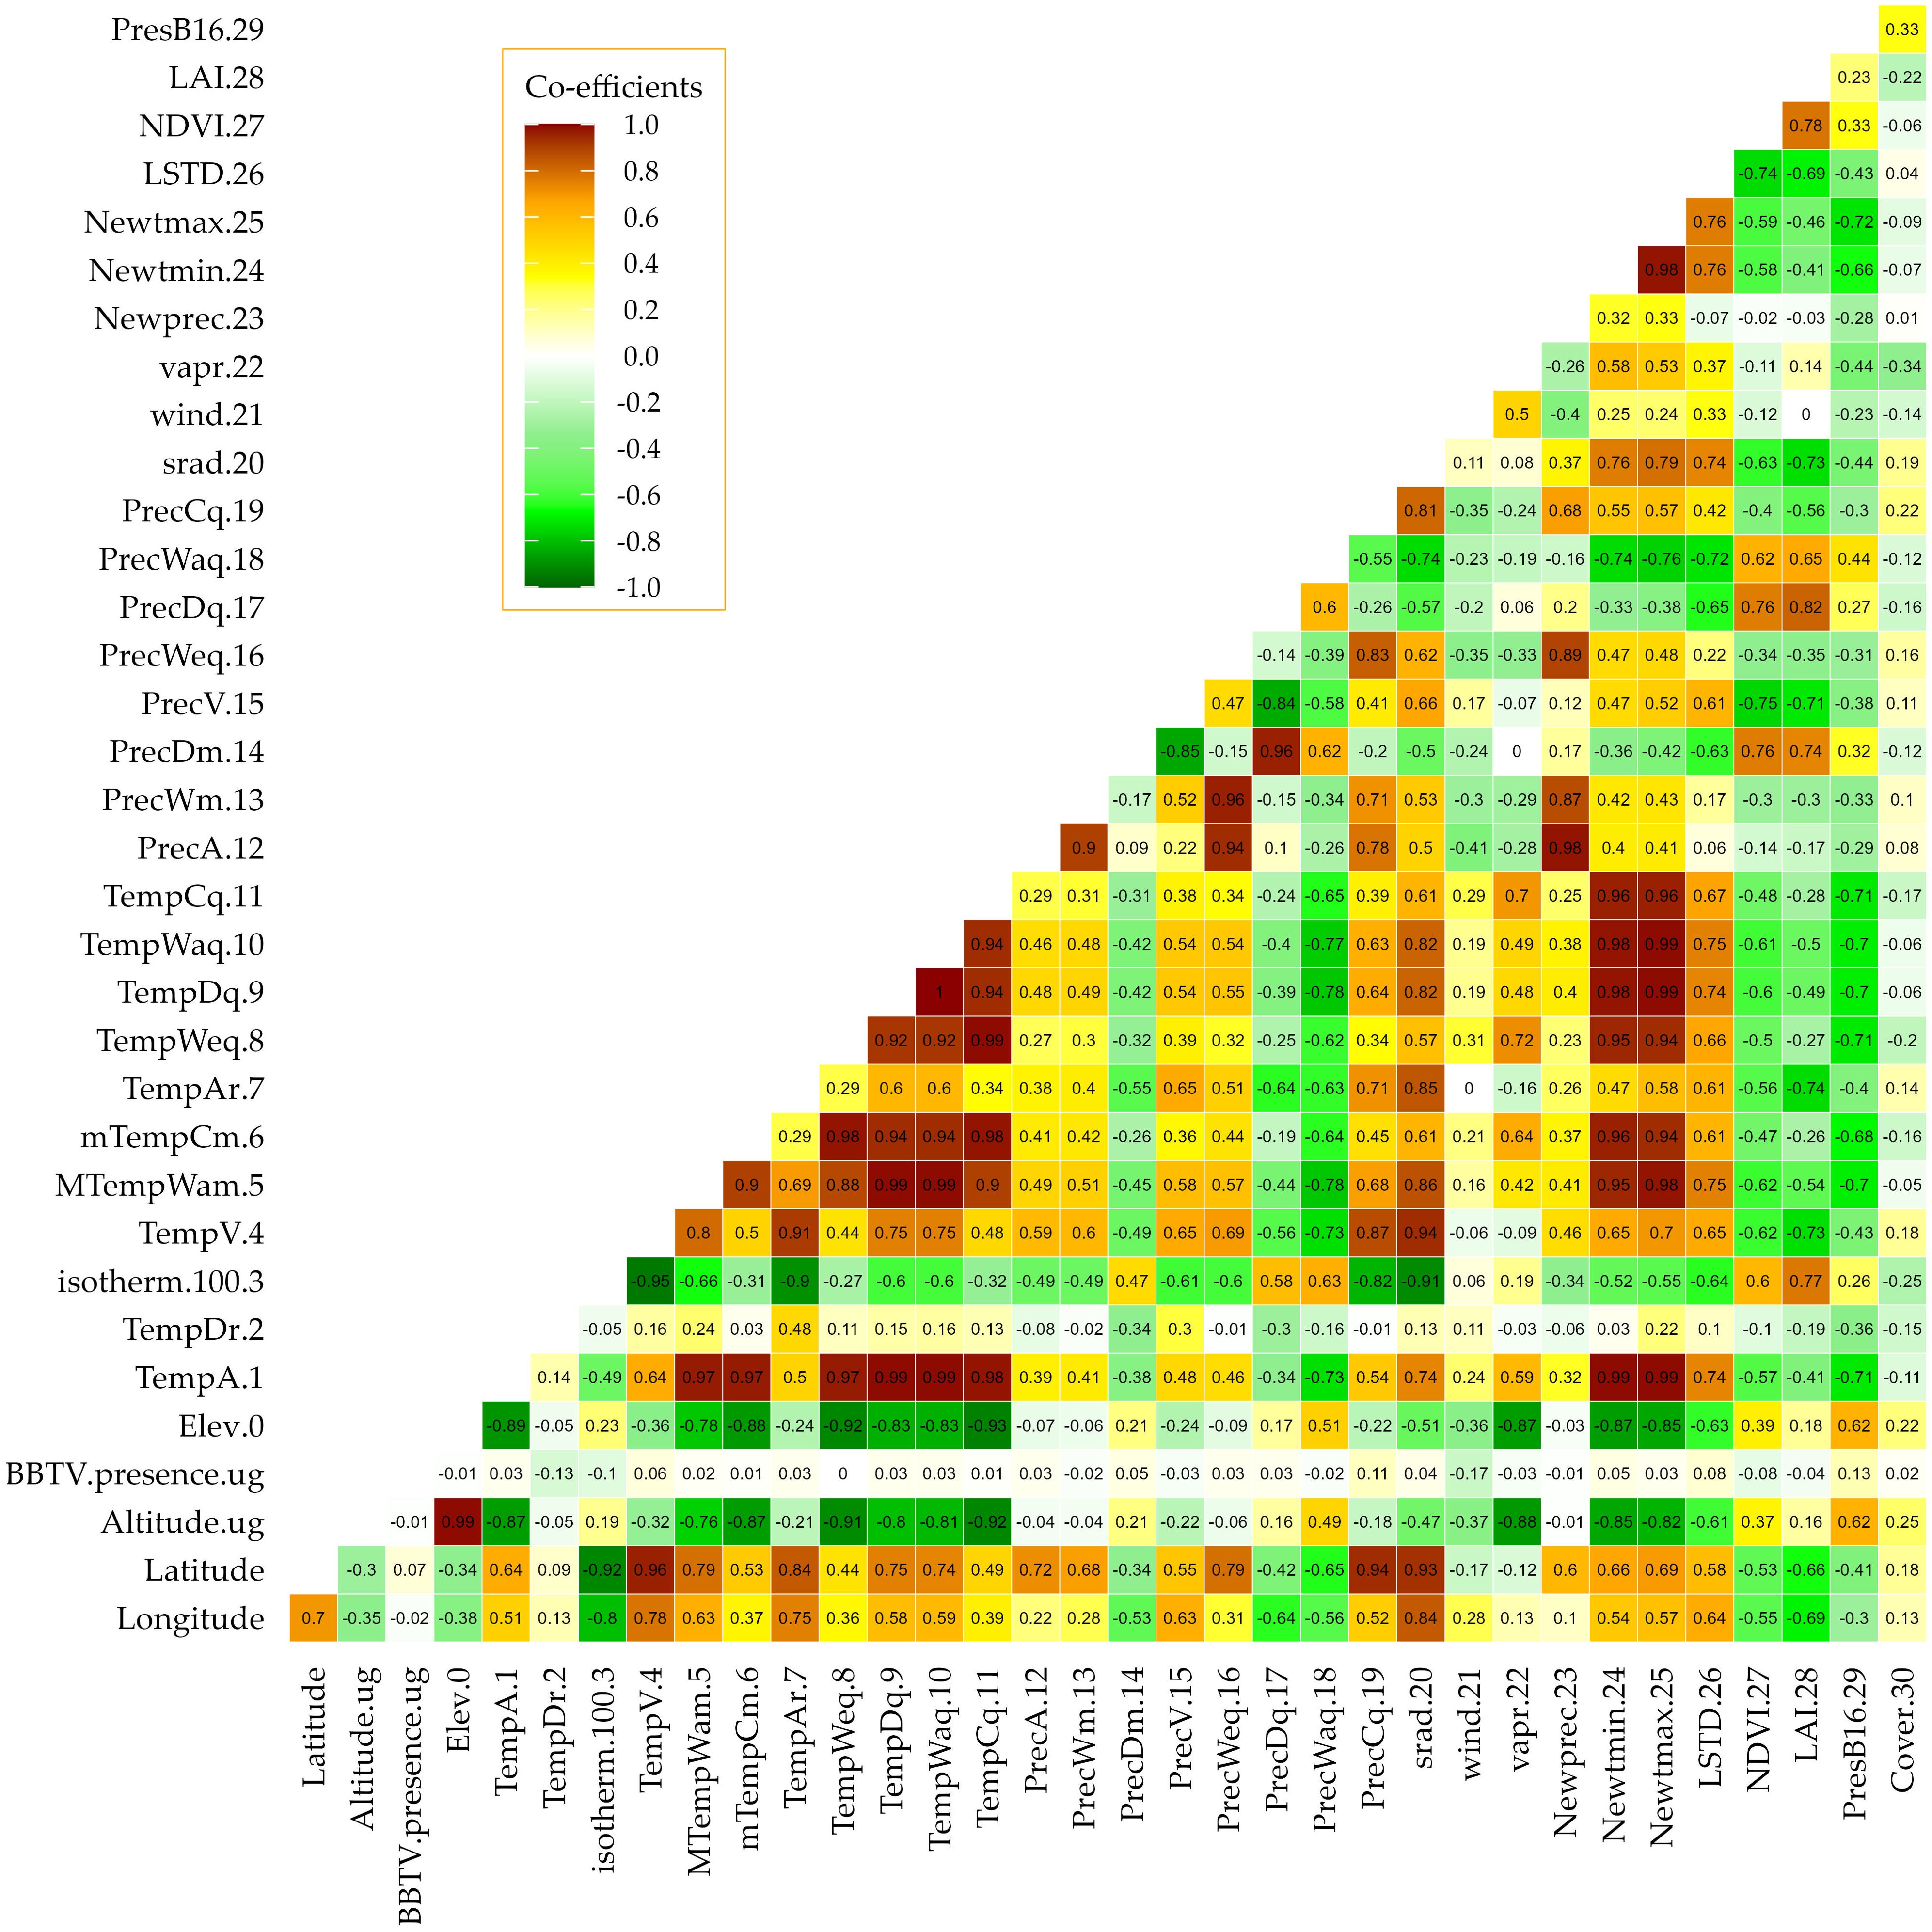
Figure 7. Correlation analysis of all 33 covariates and the dependent variable (disease presence/absence) using Pearson’s method. TempDr.2, annual mean diurnal range; isotherm. 100.3, isothermality; TempAr.7, temperature annual range; TempWeq.8, temperature of the wettest quarter; PrecA.12, annual mean precipitation; PrecWm.13, precipitation of the wettest month; PrecDm.14, precipitation of the driest month; PrecV.15, precipitation seasonality; PrecWaq.18, precipitation of the warmest quarter; PrecCq.19, precipitation of the coldest quarter; srad.20, solar radiation; wind.21, wind speed; vapr.22, water vapor; LSTD.26, average land surface temperature; NDVI.27, normalized difference vegetation index; LAI.28, leaf area index; ProdB16.29, banana presence (Ochola et al., 2021); and Cover.33, vegetation [land cover].
Multivariate logistic regression analysis
A total of eight covariates were entered into a multivariate logistic regression with BBTD presence/absence. Of the eight covariates, two covariates (annual mean diurnal temperature range, precipitation of coldest quarter) were dropped because they did not contribute enough to lowering the deviance of the model. The model was explained by six covariates and one interaction between two covariates (Table 2). Of the six covariates, three, i.e., precipitation of the driest month, the land surface temperature difference (LSTD), and banana presence in 2016, and the interaction between wind speed and LSTD had significant contributions to the model at p = 0.05 (Table 2). Precipitation in the driest month, LSTD, and banana presence in 2016 positively influenced BBTD presence or development, whereas the interaction between wind speed and LSTD negatively influenced BBTD. Isothermality (extent of day-to-night temperature oscillations) (r = 0.081; p = 0.0527) negatively impacted BBTD presence, while wind speed had a positive (r = 88.7381; p = 0.0554) influence on BBTD presence (Table 2). The residual deviance (245 on 614 df) of the model was significantly smaller (p < 0.001) than the null deviance (323 on 621 df), suggesting that the covariates explained a large part of the variation in the model.
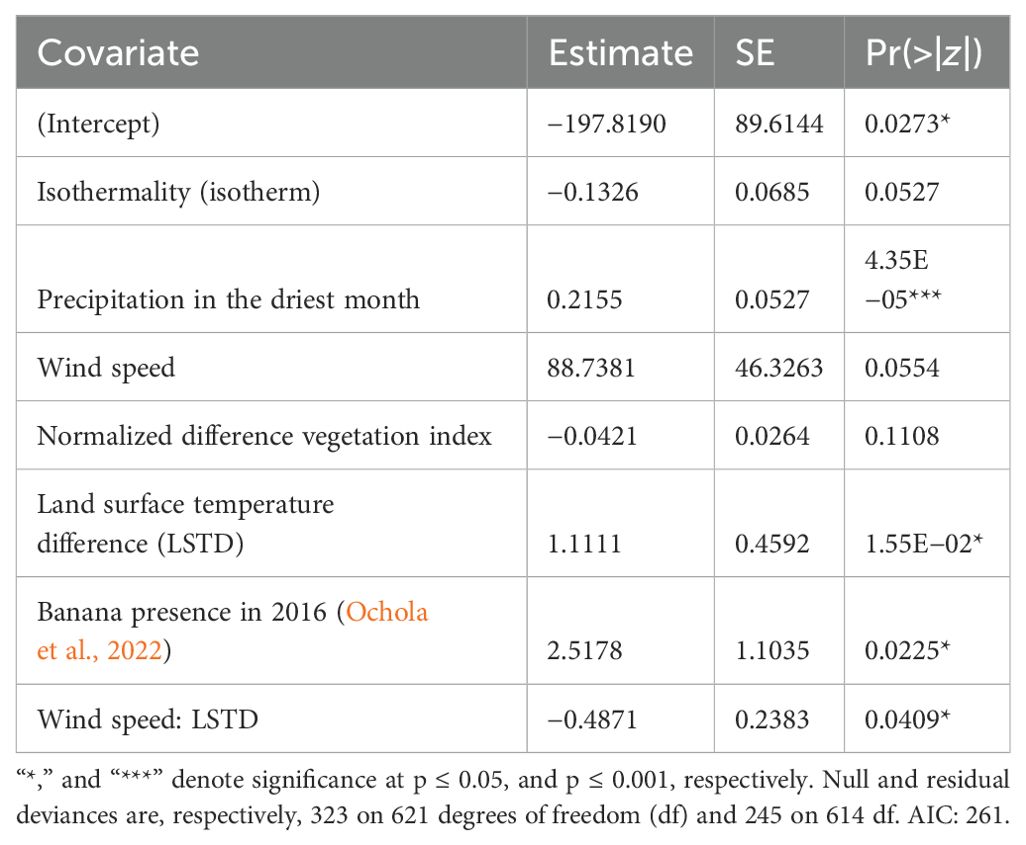
Table 2. Estimates, standard errors, and p-values of covariates in multivariate logistic regression with banana bunchy top disease presence or absence on farms.
The risk map for BBTD spread and establishment in Uganda
The BBTD risk map (Figure 8) was finally obtained by regressing the multivariate logistic regression model in Table 2 to the covariate maps in Figure 3. The map reflects the potential of the disease to spread and entrench itself within a banana production landscape. The values in the figure reflect the likelihood for BBTD to establish itself and spread following the introduction of the inoculum (Figure 4). High values in the figure suggest a high suitability for BBTD, while a low value suggests a low suitability. The low-lying zone of northwestern Uganda (west of the River Nile); areas next to Lakes Albert, Edward, and George; and the zones west and north of L. Victoria are highly suitable for BBTD establishment. Most of the production zones in the midwestern part of Uganda are moderately suitable for BBTD establishment. Some suitable landscapes are also visible in the main banana production zones of western and southwestern Uganda. BBTD risk is observed to be low or non-existent in most of northern and northeastern Uganda, possibly due to the low suitability of the landscapes for the establishment of the aphid vector and/or the virus, as these areas rank low in banana production.
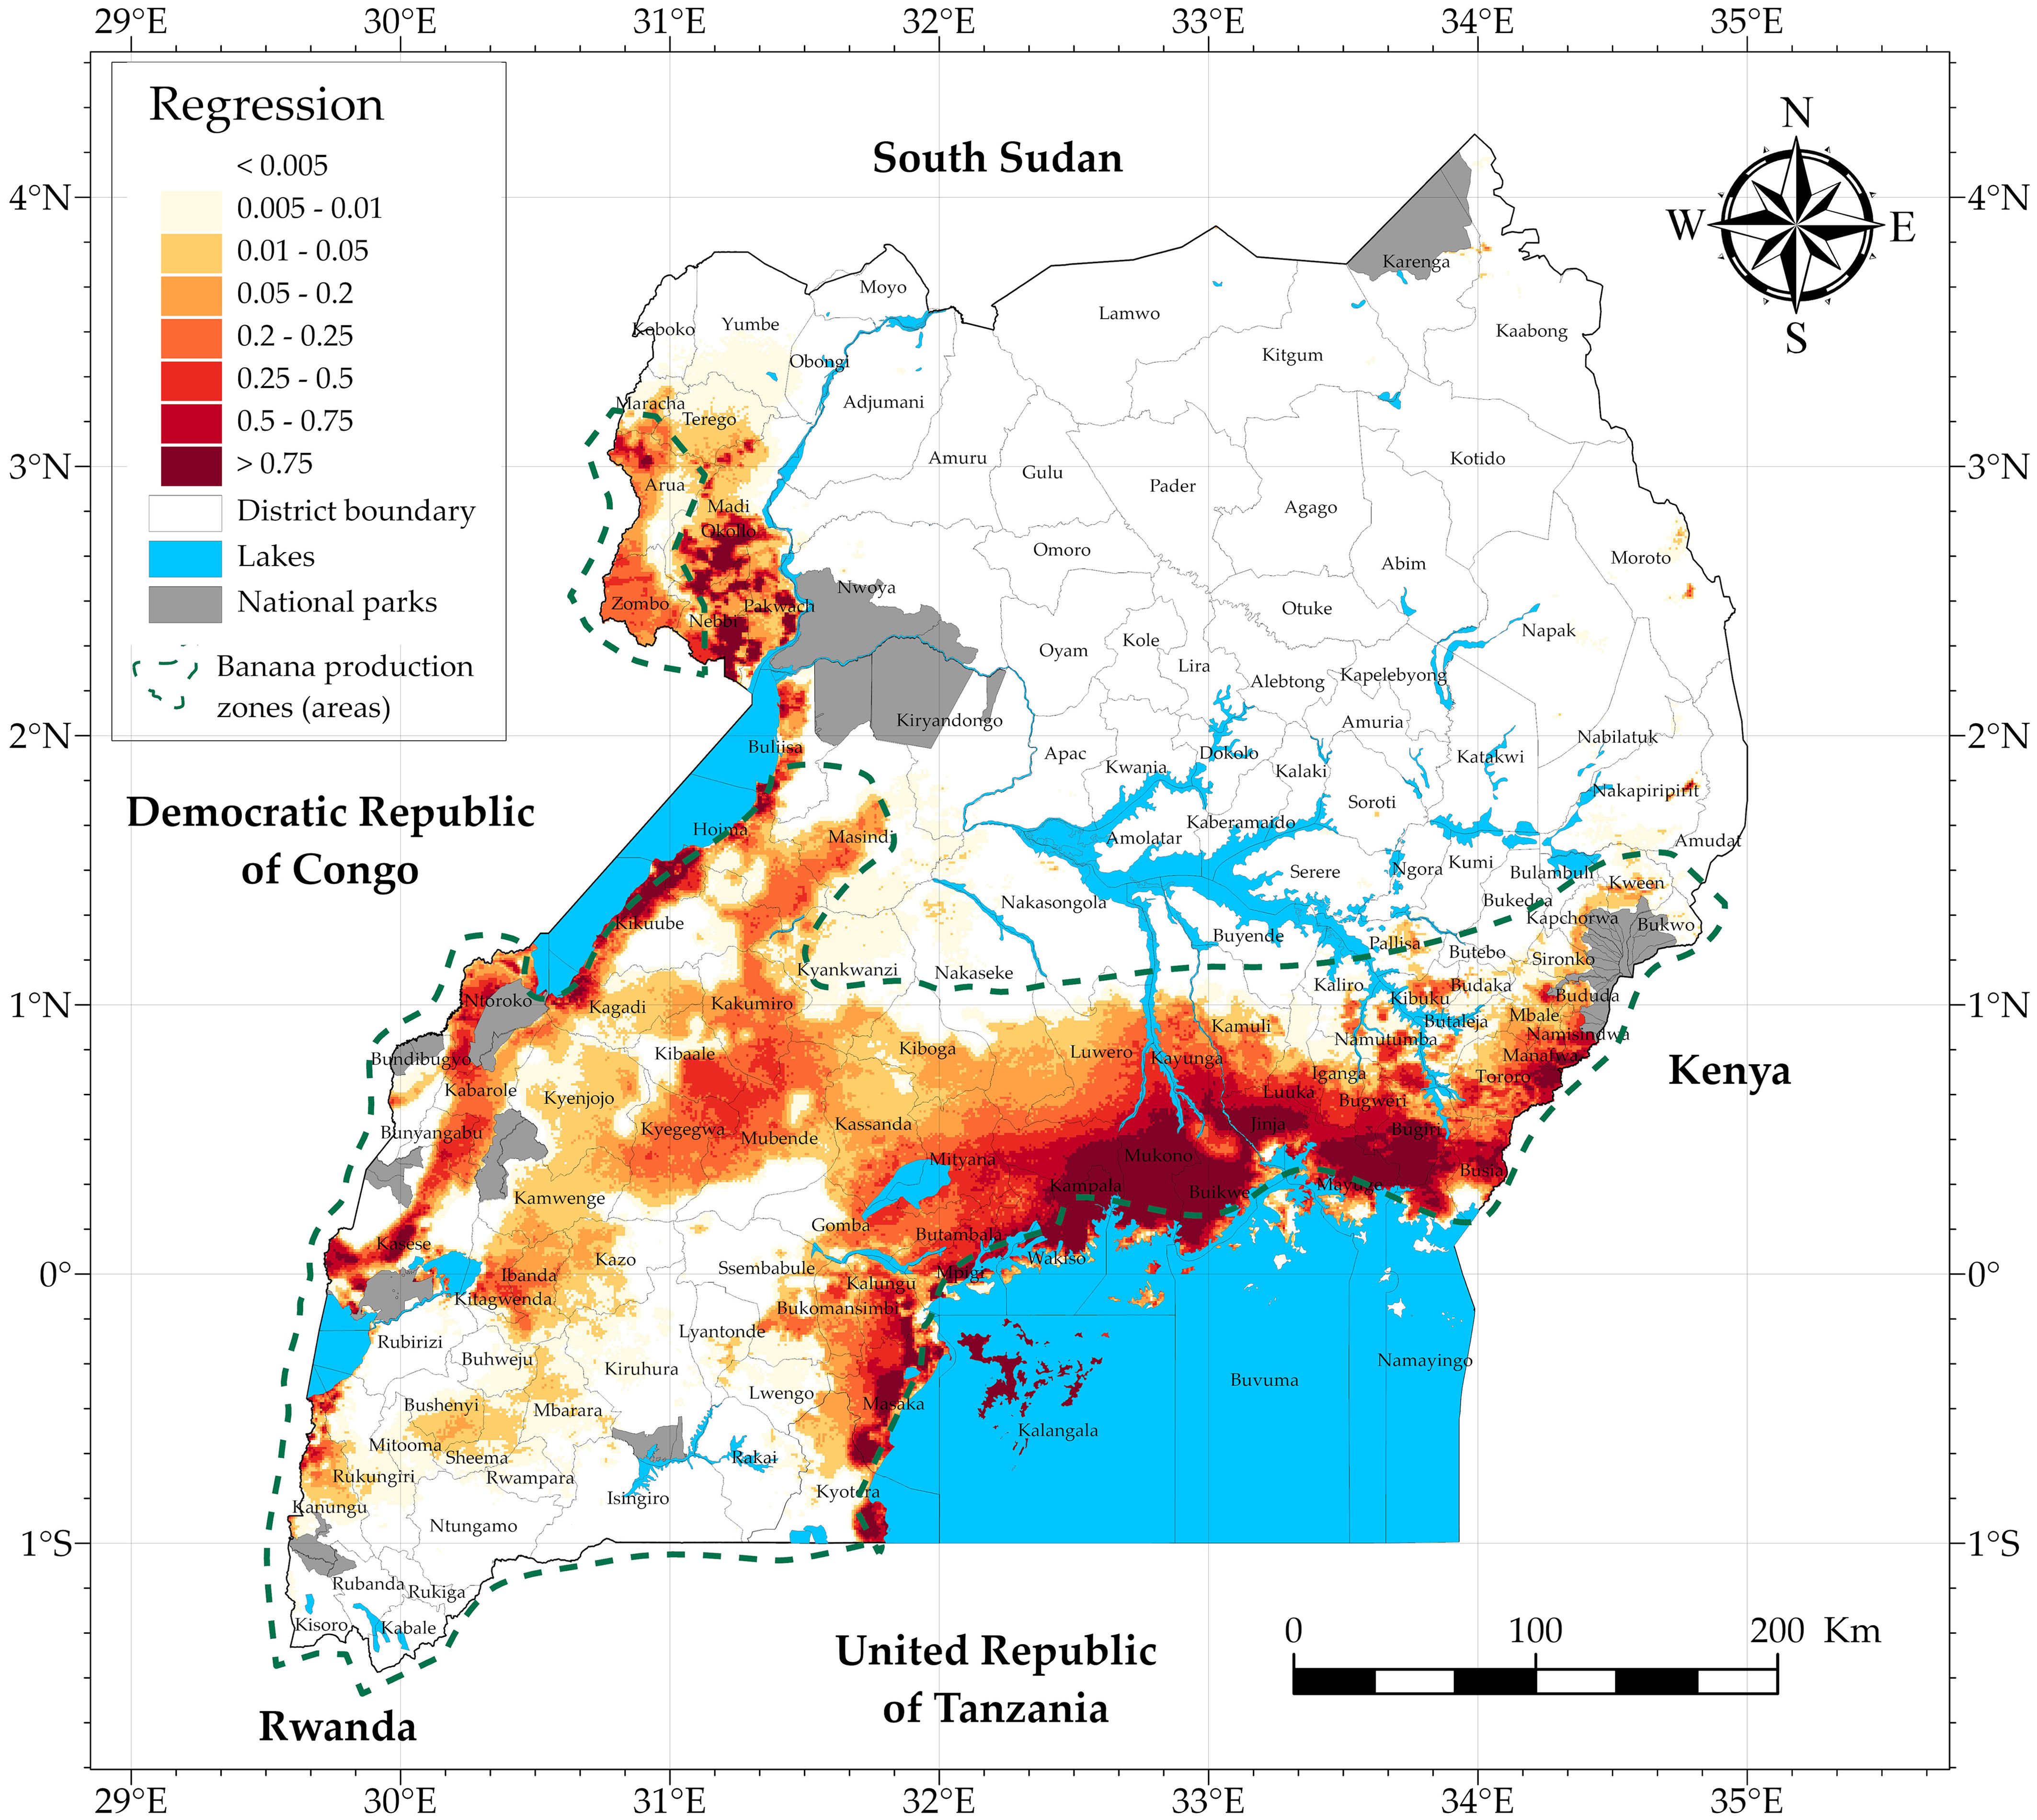
Figure 8. Likelihood of establishment and spread of BBTD within different landscapes in Uganda.
Discussion
Bananas are an important food and income crop in Uganda with high production concentrations, respectively, in the southwestern, midwestern, and central regions of Uganda. Banana production in the country has been greatly constrained by Xanthomonas wilt of banana, a bacterial disease. The report of BBTD in the northwestern part of the country (Ocimati et al., 2021) and the mid-southwestern district of Kasese (Ocimati, unpublished results) puts more strain on the banana production systems. This study documents the potential spread factors of BBTD at the farm level, delimits the geographical spread of the disease, and maps the vulnerability of the production systems across Uganda, as a basis for proactive interventions to contain its spread.
The banana production systems were dominated by smallholders with a mean farm area of 0.4 ha. Natural capital such as access to land greatly influences the farmers’ decisions to adopt or dis-adopt innovations and may have implications on future efforts to manage BBTD. Deressa et al. (2009) and Langyintuo and Mulugetta (2008) associated larger farms with greater wealth and thus larger-scale farmers to have the means to adapt and the capacity to bear risks. Thus, most farmers in the studied regions could be constrained by resources to manage BBTD in case of an outbreak. Pagnani et al. (2021) observed that the farmers’ willingness to eradicate the banana bacterial disease was subject to the importance they attribute to bananas as a food and income crop, whereas the adoption of the full package may be too demanding for farmers who have extensive banana production.
The farms in the midwestern and central regions and much of northern Uganda are in low to mid altitudes which are suitable for aphid-vectored BBTV transmission (c.f. Supplementary Figure 1A). High BBTV transmission efficiency and banana aphid survival have been reported at lower altitudes with warmer conditions (Niyongere et al., 2013). The high variability in altitude within the southwestern sites (c.f. Supplementary Figure 1A) suggests the presence of niches that could still harbor the inoculum in case of disease introduction. The northwestern region that has been confirmed to have BBTD (Ocimati et al., 2021) had the youngest plantations. This region is traditionally a non-banana-growing area. Over the past decade, there has been an increasing interest in banana production in the region. The search for banana planting materials for new fields, with farmers going beyond their communities to other districts and even to neighboring DR Congo, makes this landscape vulnerable to new disease introductions and could partly explain the current introduction and rapid spread of BBTD in the region.
Intercropping though at differing levels of intensity dominated across the studied zones. This could benefit the landscapes through suppression of the BBTV aphid vector. Crop diversification through, e.g., intercrops promote the buildup of a high functionally diverse population of natural enemies, reducing pest densities (Estrada-Carmona et al., 2022; Greenop et al., 2020; Jaworski et al., 2023). High crop species diversity alters crop signals like leaf/stem color and volatile organic compounds necessary for pests to identify their host plants or host patches, reducing pest burden on crops (Cook et al., 2007; Doring and Kirchner, 2022). High levels of monocultures were observed in southwestern Uganda and could increase the risk of BBTD spread across these farms in case of disease introduction.
The presence of BBTD over a period of 0.5 to 4.4 years on at least 9% of the farms in the northwestern and mid-southern region suggests that the disease was within the landscapes for a long period of time before detection and official reporting. The fact that some farms had just observed the disease is evidence that the disease is actively spreading within landscapes. This coupled with the observed high yield losses (75% to 91%) highlights the need for urgent action to contain the disease. Symptoms were observed in diverse banana varieties and genotypes including the East African highland banana that are the most important and cultivated group in East Africa. Though the survey did not exhaustively observe all the banana varieties in the country, Ferreira et al. (1997), Niyongere et al. (2011), and Ngatat et al. (2017) reported all banana varieties to be susceptible, with susceptibility varying from one variety to another. Genotypes with A genomes are reported to be more susceptible, while those with at least one or two B genomes are more tolerant to BBTV (Hapsari and Masrum, 2012; Niyongere et al., 2011).
Farmers’ responses to diseases including BBTD were documented as a measure for their likelihood to adopt BBTD control measures. Cutting of single disease stems was common across the study sites. This can be attributed to the wide promotion of the practice for managing banana bacterial wilt disease, which is prevalent in the region (Blomme et al., 2014; Kikulwe et al., 2022; Ocimati et al., 2019). Rouging of entire banana mats, which is also an important IPDM component for managing BBTD, was common though more widely used in the southwestern region. Rouging is a cumbersome exercise and the fact that farms are already using it could suggest a possible positive response toward the practice for managing BBTD in affected landscapes. The northwestern region had over 60% of the farmers abandoning diseased plants or entire farms and would thus need more effort in terms of training, awareness creation, and motivation to manage the disease.
In line with earlier reports (Anhalt and Almeida, 2008; Bouwmeester et al., 2023; Niyongere et al., 2013), BBTD presence on farms was influenced by temperature variables, wind speed, precipitation variables, presence of the susceptible host, and NDVI (c.f. Figure 3).
Temperature affects the aphid vector biology and movement, virus spread and transmission efficiency, and the rate of disease symptom development (Allen, 1978; Anhalt and Almeida, 2008; Raymundo and Pangga, 2011; Robson et al., 2007). Temperatures between 25°C and 30°C have been reported to be ideal for aphid population buildup, declining with increasing or decreasing temperatures, respectively, above and below this optimum temperature range (Anhalt and Almeida, 2008; Robson et al., 2007; Wu and Su, 1990). For cereal aphids, low temperatures of approximately 14°C to 15°C (Walters and Dixon, 1984) and high temperatures of approximately 31°C (Robert, 1987) and above have been shown to inhibit or delay migration. Wu and Su (1990) reported no BBTV transmission at 16°C. Temperature variables also had a strong correlation to solar radiation that affects the BBTV aphid vector due to its effects through heat (see discussions on temperature above) and visible light. Slosser et al. (1992) reported a significant, negative correlation between solar radiation and the population of cotton aphids. Auclair (1967) observed a higher feeding and survival of cotton aphids under low light intensity, while Hoyt and Madsen (1960) observed the highest migration of the first instar nymphs of the woolly apple aphid in the late afternoon when there is less light. Solar radiation also influences the activity of natural enemies of the BBTV aphid vectors. For example, Elliott et al. (2012) reported an increase in the number of aphids predated upon per minute by adult convergent lady beetles, Hippodamia convergens with increasing intensity of solar radiation.
High precipitation, despite improving the suitability of the host to the BBTV aphid vectors, raindrops, and runoff water directly dislodge aphids off the plants, thus reducing their populations on plants (Kaakeh and Dutcher, 1993). Niyongere et al. (2013), for example, observed a higher aphid population in the dry season months. Thus, production zones with higher precipitation will have a lower buildup and BBTV spread relative to those with drier conditions. The increase of BBTD presence with precipitation in the driest months suggests that extreme dryness, which could be associated with high temperatures and desiccation, is detrimental to the aphids and the virus. This agrees with the findings of Anhalt and Almeida (2008); Robson et al. (2007), and Wu and Su (1990) who reported high temperatures above the optimal to deter aphid buildup. Thus, precipitation in dry periods moderates the environment making it suitable for the aphid and the virus.
The negative association of BBTD presence with wind speed could be attributed to the direct dislodgement of BBTV aphid vectors by wind. Previous studies, however, paint a mixed picture of the effect of wind on aphids. Singh et al. (1986) reported a negative effect of wind speed on the population of mustard aphid (Lipaphis erysimi). Devegili et al. (2019) observed wind to trigger the detachment of aphids and their movement toward the unexposed side of the stems; thus, a non-windy condition could expand aphid foraging and infestation rates. Thus, production zones exposed to higher wind speeds could experience lower rates of BBTD spread by banana aphids. In contrast, Singh et al. (2007) only reported a negative wind effect in the declining phase of aphid infestation. Barton (2014) reported wind speed to indirectly lead to an increased aphid density due to alteration of aphid predator behavior. Wind has also been reported to support the dispersal of the alate (winged) aphids over both short and long distances, though wind speeds higher than 8 km h−1 delay or deter aphid migration (Haine, 1955).
As expected, disease presence was positively correlated to the banana production variable, i.e., banana presence in 2016. The high presence of the host plant creates a suitable environment for the BBTV aphid vector to thrive and thus a higher chance for BBTV spread. Normalized difference vegetation index had a strong negative correlation with BBTD presence. NDVI quantifies the health and density of vegetation and could reflect the role of a healthy and diverse vegetation in creating a suppressive landscape toward the aphid vector. This result, however, contrasts with the findings of Bouwmeester et al. (2023) who found a positive correlation between NDVI and BBTD presence. It is thus possible that the current BBTV infections occur in poorly managed production systems that reflect a lower NDVI score.
Unexpectedly, a weak negative correlation was observed with altitude (c.f. Figure 3), as altitude has been shown to negatively affect the aphid vector’s virus transmission efficiency and disease expression in banana plants. This can be attributed to the presence of BBTD-affected plants/mats at high-altitude locations of the northwestern region, possibly introduced through infected planting materials sourced from BBTD-affected farms and landscapes.
Only six covariates and the interaction between wind speed and LSTD had a significant (i.e., p < 0.05) contribution to the model for BBTD suitability. The effect of the five covariates in the model is generally consistent with the correlations. Isothermality quantifies the extent of day-to-night temperature oscillations relative to the annual temperature oscillations. Its negative association with BBTD presence can be attributed to its effect on the survival, life cycle, and feeding behavior of the BBTV aphid vector. For example, in comparison to constant temperature conditions, oscillating temperature conditions did not affect pea aphid populations under cooler temperature (20°C vs. 16°C/24°C) conditions, whereas smaller populations were produced under warmer (28°C vs. 24°C/32°C) conditions (Valls, 2018). In a separate study, Chen et al. (2013) observed that aphids under oscillating temperature conditions developed slowly with longer generation times despite having a higher net reproductive rate.
The LSTD had a strong and positive influence on BBTD presence. Uganda experiences moderate temperatures throughout the year, with monthly minimum air temperatures of 16.6°C to 18.1°C, monthly maximum of 28.0°C to 31.2°C, and monthly average air temperature varying between 22.3°C and 24.3°C. These temperature conditions are within the conducive range for the survival and spread of BBTV and its aphid vector (Wu and Su, 1990; Robson et al., 2007; Anhalt and Almeida, 2008). The significant negative effect of the interaction between wind speed and LSTD on BBTD presence (c.f. Table 2) can be attributed to the increase in temperatures with declining wind speeds, reducing the suitability of landscapes to the banana aphid and BBTV. An inverse relationship has been reported between wind speed and LSTD (Back et al., 2023).
Though altitude did not contribute to the final model, it is highly and negatively correlated to the temperature covariates including LSTD (Figure 3 and Table 2). As explained above, BBTD was observed at high altitudes, possibly transmitted through the introduction of externally sourced infected planting materials. The weak negative association between BBTD and altitude could be suggestive of improvements in the suitability of the mid- to high-altitude landscapes for BBTV transmission by the aphid vector and virus within plant proliferation. This is supported by the fact that several studies have reported temperature increases of up to 1.5°C across most of Uganda, with characteristic rates of warming approximately 0.2°C per decade (Funk et al., 2012; Egeru et al., 2019). A more recent study in Burundi similarly reported BBTD-infected fields at higher altitudes of up to 2,000 masl (Nakato et al., 2023), whereas a decade ago, BBTD-infected mats were only observed up to 1,600 masl.
The BBTD risk map shows swaths of production zones in the northwestern and central Uganda to be suitable for the disease to establish itself. The low-lying production zones with higher temperatures along the River Nile and around Lake Victoria are highly prone to BBTD. Potential BBTD hot spots also exist in the western and southwestern districts that account for the highest banana production in Uganda. Bouwmeester et al. (2023) ranked these production zones of Uganda as highly prone and of high priority due to their adjacent location and high connectivity to eastern DR Congo, a large hot spot for BBTD, and their favorable climatic conditions for BBTD establishment and spread. The observed presence of potential hot spots in the southwestern region and BBTD at higher altitudes and the current trends in global warming also suggest that the higher production zones in the country, especially in the southwest, are increasingly vulnerable to this disease. Despite the lower transmission efficiency at high altitudes, the aphid vectors have been shown to acquire the virus at mid- and high-altitude areas with lower temperatures (Niyongere et al., 2013). Temperature increases of 1.8°C to 2.1°C between 1940 and 2069 and 2.2°C to 4.0°C by the end of the century under different representative concentration pathways have been projected for Uganda (Egeru et al., 2019). These projections suggest that the suitability of key Ugandan banana landscapes for BBTD establishment is likely to improve.
BBTD control has been reported to be extremely challenging once established due to the lack of easy environmentally and economically sound control measures and the omnipresence of the BBTV aphid vector in all banana production landscapes (Omondi et al., 2020). It is also difficult to detect the early stages of infection, especially when dealing with a large number of mats on farms. Given the high production zone connectivity within the country, overreliance on suckers as planting materials, and rising temperatures, the risk for disease spread to new production zones from the current locations in the north- and midwestern regions remains high. Proactive surveillance, quarantines, and safe and sustainable seed systems are thus urgently needed for protecting the currently BBTD-free production zones. Measures to eliminate or reduce the inoculum in the affected areas also need to be urgently rolled out.
Data availability statement
The raw data supporting the conclusions of this article will be made available by the authors, without undue reservation.
Author contributions
WOc: Conceptualization, Data curation, Formal analysis, Investigation, Methodology, Project administration, Resources, Software, Supervision, Validation, Visualization, Writing – original draft, Writing – review & editing. GO: Data curation, Formal analysis, Methodology, Software, Visualization, Writing – original draft, Writing – review & editing. AT: Data curation, Investigation, Writing – review & editing. JK: Conceptualization, Investigation, Methodology, Project administration, Resources, Supervision, Writing – review & editing. JT: Conceptualization, Investigation, Methodology, Resources, Supervision, Writing – review & editing. RE: Data curation, Investigation, Writing – review & editing. WOk: Data curation, Investigation, Writing – review & editing. GM: Conceptualization, Methodology, Writing – review & editing. DK: Investigation, Writing – review & editing. GB: Conceptualization, Funding acquisition, Project administration, Resources, Supervision, Writing – review & editing.
Funding
The author(s) declare financial funding was received for the research, authorship, and/or publication of this article. This study was conducted with the financial support from the One CGIAR Initiative on Plant Health and Rapid Response to Protect Food Security and Livelihoods (Plant Health Initiative). We would like to thank all funders who have supported this research through their contributions to the CGIAR Trust Fund: www.cgiar.org/funders/.
Acknowledgments
The authors are grateful for the funding from the One CGIAR Initiative on Plant Health and Rapid Response to Protect Food Security and Livelihoods. The logistical support from the Ministry of Agriculture, Fisheries and Animal Industry (MAAIF) – Uganda and the National Agricultural Research Organization (NARO) of Uganda are also acknowledged. The authors also acknowledge the support from district- and subcounty-level agricultural officers and the banana farmers who willingly participated in this study.
Conflict of interest
The authors declare that the research was conducted in the absence of any commercial or financial relationships that could be construed as a potential conflict of interest.
Publisher’s note
All claims expressed in this article are solely those of the authors and do not necessarily represent those of their affiliated organizations, or those of the publisher, the editors and the reviewers. Any product that may be evaluated in this article, or claim that may be made by its manufacturer, is not guaranteed or endorsed by the publisher.
Supplementary material
The Supplementary Material for this article can be found online at: https://www.frontiersin.org/articles/10.3389/fagro.2024.1401478/full#supplementary-material
Supplementary Figure 1 | Altitude at which sampled farms are located (A) and the age of banana plantations (B) across study regions along the western border region of Uganda. The triangles and horizontal lines within the boxes denote the mean and median values, respectively. The lower and upper boundaries of the boxes are respectively, the 25th and 75th percentiles; the bars/whiskers below and above, respectively, the 10th and 90th percentiles and the points beyond the 10th and 90th percentiles are outliers.
References
Allen R. N. (1978). Spread of bunchy top disease in established banana plantations. Aust. J. Agric. Res. 29, 1223. doi: 10.1071/AR9781223
Anhalt M. D., Almeida R. P. P. (2008). Effect of temperature, vector life stage, and plant access period on transmission of banana bunchy top virus to banana. Phytopathol 98, 743–748. doi: 10.1094/PHYTO-98-6-0743
Auclair J. L. (1967). Effects of light and sugars on rearing the cotton aphid, Aphis gossypii, on a germ-free and holidic diet. J. Insect Physiol. 13, 1247–1268. doi: 10.1016/0022-1910(67)90097-2
Back Y., Kumar P., Bach P. M., Rauch W., Kleidorfer M. (2023). Integrating CFD-GIS modelling to refine urban heat and thermal comfort assessment. Sci. Total Environ. 858, 159729. doi: 10.1016/j.scitotenv.2022.159729
Barton B. T. (2014). Reduced wind strengthens top-down control of an insect herbivore. Ecol 95, 2375–2381. doi: 10.1890/13-2171.1
Blomme G., Jacobsen K., Ocimati W., Beed F., Ntamwira J., Sivirihauma C., et al. (2014). Fine-tuning banana Xanthomonas wilt control options over the past decade in East and Central Africa. Eur. J. Plant Pathol. 139, 271–287. doi: 10.1007/s10658-014-0402-0
Blomme G., Ploetz R., Jones D., De Langhe E., Price N., Gold C., et al. (2013). A historical overview of the appearance and spread of Musa pests and pathogens on the African continent: highlighting the importance of clean Musa planting materials and quarantine measures. Ann. Appl. Biol. 162, 4–26. doi: 10.1111/aab.12002
Bouwmeester H., Blomme G., Omondi A. B., Ocimati W. (2023). Banana bunchy top disease in Africa—Predicting continent-wide disease risks by combining survey data and expert knowledge. Plant Pathol. 00, 1–15. doi: 10.1111/ppa.13764
Caruana-Iskra M. L. (2003). “Analyse du risque phytosanitaire (ARP),” in Organisme nuisible, banana bunchy top babu virus-BBTV zones ARP (Martinique: CIRAD (Centre de coopération internationale en recherche agronomique pour le développement)), 7–14.
Chen C. Y., Chiu M. C., Kuo M. H. (2013). Effect of warming with temperature oscillations on a low-latitude aphid, Aphis craccivora. Bull. Entomol. Res. 103, 406–413. doi: 10.1017/S0007485312000867
Cook S. M., Khan Z. R., Pickett J. A. (2007). The use of push-pull strategies in integrated pest management. Annu. Rev. Entomol. 52, 375–400. doi: 10.1146/annurev.ento.52.110405.091407
Deressa T. T., Hassan R. M., Ringler C., Alemu T., Yesuf M. (2009). Determinants of farmers’ choice of adaptation methods to climate change in the Nile Basin of Ethiopia. Global Environ. Change 19, 248–255. doi: 10.1016/j.gloenvcha.2009.01.002
Devegili A. M., Alma A. M., Lescano M. N., Farji-Brener A. G. (2019). Wind matters: Asymmetric distribution of aphids on host plants can be explained by stems functioning as windbreaks. Austral Ecol. 44, 1187–1195. doi: 10.1111/aec.12796
Doring T. F., Kirchner S. M. (2022). A model for colour preference behaviour of spring migrant aphids. Philos. Trans. R. Soc B. 377, 20210283. doi: 10.1098/rstb.2021.0283
Egeru A., Barasa B., Nampijja J., Siya A., Makooma M. T., Majaliwa M. G. J. (2019). Past, present and future climate trends under varied representative concentration pathways for a sub-humid region in Uganda. Climate 7, 35. doi: 10.3390/cli7030035
Elliott N. C., Kieckhefer R. W., Phoofolo M. W. (2012). Foraging by hippodamia convergens1 for the aphid sitobion avenae2 on wheat plants growing in greenhouse plots. Southwestern Entomol. 37, 467–474. doi: 10.3958/059.037.0404
Esri. (2023). ArcGIS Pro (Version 3.0) [Software]. Available online at: https://www.esri.com/en-us/arcgis/products/arcgis-pro/overview.
Estrada-Carmona N., Sanchez A. C., Remans R., Jones S. K. (2022). Complex agricultural landscapes host more biodiversity than simple ones: a global meta-analysis. Proc. Nat. Acad. Sci. U.S.A. 119, e2203385119. doi: 10.1073/pnas.2203385119
FAO. (2023). Crops and livestock products. Available online at: https://www.fao.org/faostat/en/#data/QCL (Accessed September 19, 2023).
Ferreira S. A., Trujillo E. E., Ogata D. Y. (1997). Banana bunchy top virus. In: CTAHR, PD-12. Available online at: https://www.ctahr.hawaii.edu/oc/freepubs/pdf/PD-12.pdf (Accessed 14/11/2023).
Funk C., Rowland J., Eilerts G., White L. (2012). “Famine early warning systems network- informing climate change adaptation series: A climate trend analysis of Uganda,” in Famine early warning systems network. (Reston, Virginia, USA: United States Geological Survey (USGS)). Available online at: https://pubs.usgs.gov/fs/2012/3062/FS2012-3062.pdf.
Global Invasive Species Database. (2023). Species profile. In: Banana bunchy top virus (BBTV). Available online at: http://www.iucngisd.org/gisd/species.php?sc=141 (Accessed 24 April 2023).
Greenop A., Cook S. M., Wilby A., Pywell R. F., Woodcock B. A. (2020). Invertebrate community structure predicts natural pest control resilience to insecticide exposure. J. Appl. Ecol. 57, 2441–2453. doi: 10.1111/1365-2664.13752
Gregorich M., Strohmaier S., Dunkler D., Heinze G. (2021). Regression with highly correlated predictors: variable omission is not the solution. Int. J. Environ. Res. Public Health 18, 4259. doi: 10.3390/ijerph18084259
Hapsari L., Masrum A. (2012). Preliminary screening resistance of musa germplasms for banana bunchy top disease in purwodadi botanic garden, pasuruan, east jawa. Buletin Kebun Raya 15, 57–70. Available online at: https://media.neliti.com/media/publications/55107-EN-preliminary-screening-resistance-of-musa.pdf (Accessed August 30, 2024).
Hoyt S. C., Madsen H. F. (1960). Dispersal behavior of the first instar nymphs of the woolly apple aphid. Hilgardia 30, 267–299. doi: 10.3733/hilg.v30n10p267
Jaworski C. C., Thomine E., Rusch A., Lavoir A. V., Wang S., Desneux N. (2023). Crop diversification to promote arthropod pest management: a review. Agric. Commun. 1, 100004. doi: 10.1016/j.agcom.2023.100004
Kaakeh W., Dutcher J. D. (1993). Effect of rainfall on population abundance of aphids (Homoptera: Aphididae) on pecan. J. Entomol. Sci. 28, 283–286. doi: 10.18474/0749-8004-28.3.283
Kikulwe E., Asindu M., Ocimati W., Ajambo S., Tinzaara W., Iradukunda F., et al. (2022). “Scaling banana bacterial wilt management through single diseased stem removal in the great lakes region,” in Root, tuber and banana food system innovations: value creation for inclusive outcomes (Springer International Publishing, Cham), 289–317.
Kilimo Trust. (2012). Analysis of the Banana Value Chains in Tanzania and Uganda: Consumption, Productivity and Challenges. Available online at: https://kilimotrust.org/analysis-of-the-banana-value-chains-in-uganda-and-tanzania-2/.
Kuhn M., Wing J., Weston S., Williams A., Keefer C., Engelhardt A., et al. (2020). Package ‘caret’. R J. 223, 48. doi: 10.32614/CRAN.package.caret
Kumar P. L., Selvarajan R., Iskra-Caruana M. L., Chabannes M., Hanna R. (2015). Biology, etiology, and control of virus diseases of banana and plantain. Adv. Virus Res. 91, 229–269. doi: 10.1016/bs.aivir.2014.10.006
Langyintuo A., Mulugetta M. (2008). Assessing the influence of neighborhood effects on the adoption of improved agricultural technologies in developing agriculture, Mozambique. Afr. J. Agric. Resour. Econom. 2, 151–169.
Magee C. J. (1927). Investigation on the bunchy top disease of bananas. Bulletin of the Council for Scientific and Industrial Research in Australia No. 30. (Melbourne, Australia: Council for Scientific and Industrial Research).
Mansoor S., Qazi J., Amin I., Khatri A., Khan I. A., Raza S., et al. (2005). A PCR-based method, with internal control, for the detection of Banana bunchy top virus in banana. Mol. Biotechnol. 30, 167–169. doi: 10.1385/MB:30:2:167
Naderifar M., Goli H., Ghaljaie F. (2017). Snowball sampling: A purposeful method of sampling in qualitative research. Stride. Dev. Med. Educ. 14, e67670. doi: 10.5812/sdme
Nakato G. V., Okonya J. S., Kantungeko D., Ocimati W., Mahuku G., Legg J. P., et al. (2023). Influence of altitude as a proxy for temperature on key Musa pests and diseases in watershed areas of Burundi and Rwanda. Heliyon 9, e13854. doi: 10.1016/j.heliyon.2023.e13854
Ngatat S., Hanna R., Kumar P. L., Gray S. M., Cilia M., Ghogomu R. T., et al. (2017). Relative susceptibility of Musa genotypes to banana bunchy top disease in Cameroon and implication for disease management. Crop Prot 101, 116–122. doi: 10.1016/j.cropro.2017.07.018
Niyongere C., Ateka E., Losenge T., Blomme G., Lepoint P. (2011). Screening Musa genotypes for banana bunchy top disease resistance in Burundi. Acta Hortic. 897, 439–447. doi: 10.17660/ActaHortic.2011.897.60
Niyongere C., Losenge T., Ateka E. M., Ntukamazina N., Ndayiragije P., Simbare A., et al. (2013). Understanding banana bunchy top disease epidemiology in Burundi for an enhanced and integrated management approach. Plant Pathol. 62, 562–570. doi: 10.1111/j.1365-3059.2012.02676.x
Ochola D., Boekelo B., van de Ven G., Taulya G., Kubiriba J., van Asten P., et al. (2021). “Accompanying data and R scripts: Mapping the spatial distribution and geographic shift of East African highland banana (Musa sp.) cropping systems in Uganda (Version 2) [Data set],” in 4TU. Research data. (The Netherlands: 4TU. Research Data). doi: 10.4121/16908469.V2
Ochola D., Boekelo B., van de Ven G. W., Taulya G., Kubiriba J., van Asten P. J., et al. (2022). Mapping spatial distribution and geographic shifts of East African highland banana (Musa spp.) in Uganda. PloS One 17, e0263439. doi: 10.1371/journal.pone.0263439
Ocimati W., Schagen B. V., Kozicka M., Kikulwe E. M., Gotor E., Blomme G. (2019). Banishing banana wilt: can it get any easier. Available online at: https://cgspace.cgiar.org/server/api/core/bitstreams/e0358af3-af29-4eae-b264-e31571786421/content (Accessed 21/02/2024).
Ocimati W., Tazuba A. F., Tushemereirwe W. K., Tugume J., Omondi B. A., Acema D., et al. (2021). First report of banana bunchy top disease caused by Banana bunchy top virus in Uganda. New Dis. Rep. 44, e12052. doi: 10.1002/ndr2.12052
Omondi B. A., Soko M. M., Nduwimana I., Delano R. T., Niyongere C., Simbare A., et al. (2020). The effectiveness of consistent roguing in managing banana bunchy top disease in smallholder production in Africa. Plant Pathol. 69, 1754–1766. doi: 10.1111/ppa.13253
Pagnani T., Gotor E., Kikulwe E., Caracciolo F. (2021). Livelihood assets’ influence on Ugandan farmers’ control practices for Banana Xanthomonas Wilt (BXW). Agric. Food Econ. 9, 1–19. doi: 10.1186/s40100-021-00192-6
Qazi J. (2016). Banana bunchy top virus and the bunchy top disease. J. Gen. Plant Pathol. 82, 2–11. doi: 10.1007/s10327-015-0642-7
RStudio Team. (2023). RStudio: Integrated Development Environment for R RStudio, PBC, Boston, MA. Available online at: http://www.rstudio.com/.
Raymundo A. D., Pangga I. B. (2011). Simulation modeling of bunchy top epidemics in a changing climate. J. Environ. Sci. Manage. 14, 13–20.
Robert Y. (1987). “Aphids and their environment: dispersion and migration,” in Aphids: Their biology, natural enemies and control, vol. 299 . Eds. Minks A. K., Harrewijn P. (Elsevier, Amsterdam), 313.
Robson J. D., Wright M. G., Almeida R. P. P. (2007). Biology of Pentalonia nigronervosa (Hemiptera, Aphididae) on banana using different rearing methods. Environ. Entomol. 36, 46–52. doi: 10.1603/0046-225X(2007)36[46:BOPNHA]2.0.CO;2
Shimwela M. M., Mahuku G., Mbanzibwa D. R., Mkamilo G., Mark D., Mosha H. I., et al. (2022). First report of banana bunchy top virus in banana and plantain (Musa spp.) in Tanzania. Plant Dis. 106, 1312. doi: 10.1094/PDIS-07-21-1387-PDN
Singh H., Singh Z., Naresh J. S. (1986). Path coefficient analysis of abiotic factors affecting the aphid populations on rapeseed. Indian J. Entomol. 48, 156–161. Available online at: https://www.entomoljournal.com/archives/2018/vol6issue3/PartL/6-2-169-501.pdf (Accessed August 30, 2024).
Singh R., Singh D., Rao V. U. M. (2007). Effect of abiotic factors on mustard aphid (Lipaphis erysimi kalt.) on Indian brassica. Indian J. Agric. Res. 41, 67–70. Available online at: https://arccarticles.s3.amazonaws.com/webArticle/articles/ijar2411013.pdf (Accessed August 30, 2024).
Slosser J. E., Pinchak W. E., Rummel D. R. (1992). “Population development and regulation of the cotton aphid,” in Proceedings of the Beltwide Cotton Conference. (Memphis, Tenn: Nat. Cotton Council Amer.). 2, 1065–1067.
Soko M. M., Dale J., Kumar P. L. (2009). Banana bunchy top disease survey reports, previous control efforts and the way forward (Limbe, Malawi: Agricultural Research Station).
Thomas J. E. (2018). “Diseases caused by viruses - Banana bunchy top,” in Handbook of diseases of banana, abacá and enset. Ed. Jones D. (CAB International, Wallingford, Oxfordshire, UK), 362–376.
Valls A. (2018). Effects of temperature on pea aphids, their host plants, and their parasitoids. (Fargo, North Dakota, USA: North Dakota State University).
Walters K. F. A., Dixon A. F. G. (1984). The effect of temperature and wind on the flight activity of cereal aphids. Ann. Appl. Biol. 104, 17–26. doi: 10.1111/j.1744-7348.1984.tb05582.x
Wardlaw C. W. (1961). The virus diseases: bunchy top. Banana diseases, including plantains and abaca (London, UK: Longman), 68–115.
Wu R. Y., Su H. J. (1990). Transmission of banana bunchy top virus by aphids to banana plantlets from tissue culture. Bot. Bull. Acad. Sin. 31, 7–10. Available online at: https://ejournal.sinica.edu.tw/bbas/content/1990/1/bot311-02.pdf.
Keywords: banana aphid, banana bunchy top virus, mapping, Pentalonia nigronervosa, smallholder farmers, spatial analysis, Uganda, vulnerability
Citation: Ocimati W, Ogwal G, Tazuba AF, Kubiriba J, Tugume J, Erima R, Okurut W, Mahuku G, Kutunga D and Blomme G (2024) Mapping the vulnerability of banana production landscapes in Uganda to banana bunchy top disease. Front. Agron. 6:1401478. doi: 10.3389/fagro.2024.1401478
Received: 15 March 2024; Accepted: 15 August 2024;
Published: 12 September 2024.
Edited by:
Giovanni Bubici, National Research Council (CNR), ItalyReviewed by:
Renata Retkute, University of Cambridge, United KingdomNaitong Yu, Chinese Academy of Tropical Agricultural Sciences, China
A/Prof. Thomas, University of Queensland, Australia
Copyright © 2024 Ocimati, Ogwal, Tazuba, Kubiriba, Tugume, Erima, Okurut, Mahuku, Kutunga and Blomme. This is an open-access article distributed under the terms of the Creative Commons Attribution License (CC BY). The use, distribution or reproduction in other forums is permitted, provided the original author(s) and the copyright owner(s) are credited and that the original publication in this journal is cited, in accordance with accepted academic practice. No use, distribution or reproduction is permitted which does not comply with these terms.
*Correspondence: Walter Ocimati, dy5vY2ltYXRpQGNnaWFyLm9yZw==