- 1Department of Plant and Soil Sciences, College of Agriculture and Life Sciences, Mississippi State University, Starkville, MS, United States
- 2Department of Administration, International Institute and Programs, Mississippi State University, Starkville, MS, United States
- 3Department of Crop Breeding and Agronomy, Council for Scientific and Industrial Research (CSIR)-Savanna Agricultural Research Institute (SARI), Tamale, Ghana
- 4Department of Crop Science, Faculty of Agriculture, Food and Consumer Sciences, University for Development Studies, Tamale, Ghana
- 5Department of Agricultural and Consumer Economics, College of Agricultural, Consumer and Environmental Sciences, University of Illinois at Urbana-Champaign, Champaign, IL, United States
Introduction: Phosphorus (P) and potassium (K) deficiencies are increasingly being reported in Ghana’s interior savanna soils. Smallholder farmers consider soybeans as a “zero-input” crop resulting in low yields and profitability. Studies indicate a positive response to P application; however, knowledge of the synergistic effect of P and K in soybeans is limited. A six-site year experiment was conducted to evaluate the synergy of P and K for soybean yield, partial factor productivity (PFP), agronomic efficiency (AE), rain-use efficiency (RUE), and variable-cost ratio (VCR).
Materials and methods: The treatments were 4 × 4 factorial combinations of P at 0, 25, 50, and 100 P2O5 (kg ha−1) and K at 0, 25, 50, and 100 K2O (kg ha−1), and their combinations laid out in a randomized complete block design with four replications. The soybean cultivar “Favor” (TGx 1844–22E), released and registered by the Savanna Agricultural Research Institute (SARI), was used as the test crop.
Results and discussion: Flowering time was reduced at Nyankpala and Dokpong by 0.2 and 0.4 (days), while plant height was increased by 4%–18% over control. Yield and RUE increased as P and K rates increased, with the greatest yield from T15 (P100K50) in Manga (2.34 t ha−1) and Nyankpala (2.37 t ha−1), T16 (P100K100) at Dokpong (2.68 t ha−1), and RUE from T15 across locations. The PFP, AE, and VCR values decreased with increasing P and K rates, with the greatest PFP, AE, and VCR from T5 (P25K0) at Manga and Dokpong and T2 (P0K25) at Nyankpala. All treatments exceeded the VCR > 2.0 threshold, except T12 (P50K100) across locations, and T16 at Manga and Nyankpala. The greatest economic returns are T5 at Manga and Dokpong and T2 at Nyankpala.
Conclusion: By all indications, the study justified the use of nutrient input in soybeans of P and K to enhance grain yield and profitability. Avoiding broadcast applications and adopting precision placement using the 4R nutrient principles of right placement, right fertilizer source, right rate, and the right time is key. The study recommends further experiments on different combinations of P and K in a long-term residual study.
1 Introduction
Food security is rapidly becoming a major issue as the global population continues to surge exponentially. Drought and heat stress from climate change are major stressors on crop production (Lamaoui et al., 2018), with predicted potential consequences on major crops and food security in Ghana’s interior savanna (Dankwa et al., 2021). Hence, there is a need for enhanced crop management strategies in smallholder agriculture to increase crop yields per unit area using indigenous knowledge and industrial fertilizers. Nitrogen (N), phosphorus (P), and potassium (K) are the three most important nutrients required in crop plants. Plants require these nutrients in large quantities for growth and development.
Soybean [Glycine max (L.) Merrill] is the most important economic crop cultivated globally for oilseed and livestock feed, used in multiple food, feed, and industrial products. Soybeans are the fourth largest field crop by volume accounting for nearly 9% of the total value of global agricultural trade (Valdes et al., 2023). The crop contributes significantly to global food security in nutrition, poverty alleviation, and economic growth (Sinclair et al., 2014; Akakpo et al., 2020; Ntiamoah et al., 2022). The three largest soybean-producing countries are the United States, Brazil, and Argentina with yield averages of 3.45, 3.41, and 2.81 t ha−1, respectively (Ritchie et al., 2023). Arguably, the inherent yield potential of soybeans is high (Vogel et al., 2021), but growth limiting factors, mainly biotic and abiotic, and low knowledge of soybean agronomic practices pose significant challenges to achieving high yields in several soybean production regions (Vogel et al., 2021).
Soybean production in sub-Saharan Africa (SSA) is increasing at a rate of 6.84% annually (Sedibe et al., 2023), mainly under increased area production and not from yield per unit area. Sub-Saharan Africa (SSA) accounts for only 1.26% (4.68 MT) of the global (371.69 MT) soybean production (Ritchie et al., 2023). In descending order, South Africa, Nigeria, Zambia, Benin, Malawi, Ghana, Ethiopia, and Mozambique are the most important soybean-producing countries in SSA. Therefore, Ghana is the sixth soybean producer, in volume and yield per unit area with 190,000 t annually and 1.65 t ha−1 average yield (Ritchie et al., 2023). Over 90% of the country’s soybeans are produced in the interior savanna by smallholder farmers as a cash crop (Ocran et al., 1998; MoFA-SRID, 2019) but produce mainly staple cereal crops (Ocran et al., 1998; Dankwa et al., 2021). In cereal crop production, soybeans reduce the infestation of witchweed, Striga hermonthica, a highly virulent root parasitic cereal crop pathogen in northern Ghana (Stoop et al., 1983; Abdulai et al., 2006). The soybean crop enriches soil fertility through biological nitrogen fixation (BNF) in a symbiotic relationship with root-colonizing soil bacteria. The BNF process harnesses atmospheric nitrogen in inexpensive and readily available forms in soybean root-forming nodules that not only meet crop N demands but also provide residual N for use in subsequent rotation crops in smallholder cropping systems. Soybean cultivars have been reported to contribute up to 371 kg ha−1 of atmospheric nitrogen into the soils of Ghana’s interior savannas (Matey and Alidu, 2023).
Most crop yields in Ghana are low, with a yield gap between 20% and 60% (Bationo et al., 2018). The yield gap for soybeans is estimated at 55.0% based on the reported national attainable yield average of 1.65 t ha−1 compared to the national estimated yield potential of 3.0 t ha−1 (MoFA-SRID, 2019; Ritchie et al., 2023). However, less than 1.0 t ha−1 of soybean yield was reported on average in smallholder farms (Aidoo et al., 2014; World Bank, 2017), representing a 67% yield gap. This yield gap is attributed to a combination of factors including low seeding density (Aidoo et al., 2014), lack of sustainable crop management practices (Tetteh et al., 2016), soil acidity (Buri et al., 2005), erratic weather patterns (Dankwa et al., 2021), limited availability of high-yielding cultivars (Tefera, 2011), and pests and diseases (Abudulai et al., 2012). The acidic soils of Ghana’s interior savanna provide additional nutrient challenges due to P fixation and availability of other nutrients such as K, boron (B), and molybdenum (Mo) (Buri et al., 2005). These nutrient deficits lead to inadequate nodulation, pod formation, and low soybean yield.
The most important soil nutrients for soybeans are phosphorus (P), potassium (K), Bradyrhizobium inoculum for nitrogen (N), and lime for marginal soils (Awuni et al., 2023). Lime plays an important role in maintaining adequate soil pH levels (6.0–6.5) for healthy soybean growth and development. The seed inoculation technology in soybean cropping systems is pivotal for smallholder farmers as a source of nitrogen (Kumar et al., 2021). The inoculant supports soybeans to increase biological nitrogen fixation (BNF), enhance and promote environmental stewardship, reduce production costs, and eliminate N-based fertilizer purchases (Gyogluu et al., 2018; Kumar et al., 2021; Kyei-Boahen et al., 2023).
Low soil P and K limit soybean grain yield (Brooker et al., 2017) and their deficiencies are increasingly reported in Ghana’s interior savanna soils (Awuni et al., 2020, 2023). Phosphorus deficiency is characterized by stunted growth, leaf cupping, and discoloration (APNI, 2022: Khan et al., 2023) and is common in acid soils (Khan et al., 2023). Potassium is required in relatively large amounts (Imas and Magen, 2008; APNI, 2022) but is often overlooked in smallholder cropping systems. Potassium increases root nodulation and enhances nitrogen fixation and plant resistance to pests and diseases (Imas and Magen, 2008; APNI, 2022), thus promoting crop health. Buernor et al. (2022) reported grain and biological yield increases with both P and K applications, but there is limited knowledge of the synergistic effect of P and K on soybeans. Several studies have shown a significant response of soybeans to P (Awuni et al., 2020, 2023; Adjei-Nsiah et al., 2019, 2022; Buernor et al., 2022; Kyei-Boahen et al., 2023). Efficient nutrient use ensures maximum crop yield per nutrient unit applied under defined soil and climatic conditions.
In Ghana, most soybean producers are subsistence farmers with limited resources and can barely afford high fertilizer input costs; thus, fertilizer used in crop production must be efficient and cost effective. Nutrient use efficiency can be reported using partial factor productivity (PFP), the ratio of output (yield) to a single factor input (fertilizer), and agronomic efficiency (AE), the ability of the applied nutrients to increase grain or biological yield as indicators of economic output (Dobermann, 2007; Amanullah and Almas, 2009). Improved nutrient management can maximize rainwater use efficiency (RUE) and grain yield (Rockström et al., 2003; Sharma et al., 2013) for farmers with limited resources under climate change conditions (Roy et al., 2006). This study hypothesized that smallholder farmers will use P and K fertilizers profitably and sustainably to enhance agronomic and soil management practices to achieve higher soybean yield in response to fertilizer utilization in nutrient-limiting environments.
The study investigated various P and K fertilizer rates to (i) determine crop phenology and plant height at flowering, (ii) measure grain and stover yield per unit of applied P and K fertilizer rate, (iii) determine the partial factor productivity (PFP), agronomic efficiency (AE), and rain use efficiency (RUE) metrics, and (iv) quantify the economic returns to soybeans.
2 Materials and methods
2.1 Site description
Field experiments were conducted for six site years in two cropping seasons (2021 and 2022) at three locations across three ecoregions of Ghana’s interior savannas. The locations were Manga (Binduri District), Nyankpala (Tolon District), and Dokpong (Wa Municipal). These locations were selected to represent the three ecoregions: the Eastern Sudan Savanna (ESS), Open Guinea Savanna (OGS), and Western Sudan Savanna (WSS) (CILSS, 2016) (Supplementary Figure S1). The field coordinates for Manga were 11.01712 N/−0.26173 W (2021) and 11.01778 N/−0.25885 W (2022) at 100 (m) AMSL; 9.40482 N/−0.95272 W (2021) and 9.40911 N/−0.97725 W (2022) at 165 (m) AMSL for Nyankpala; and 10.07748 N/−2.50582 W (2021) and 10.01778 N/−2.50582 W (2022) at 301 (m) AMSL at Dokpong. In general, the dominant soils were the Savanna Ochrosols developed from Birrimian and granitic parent material (Serno and Weg van der, 1985; Adjei-Gyapong and Asiamah, 2002) or Plinthosols (IUSS Working Group WRB, 2015). The study region has a single rainfall pattern usually from May to October annually. The main crops grown in Ghana’s interior savanna are maize, rice, sorghum, millet, groundnut, cowpea, cassava, yam, cotton, and vegetables with soybeans cultivated mainly as a commercial crop.
2.2 Soil sampling procedure and analysis
Soil samples were collected from each study location for selected physicochemical soil analysis before planting. A soil probe sampler was used to collect 15 core samples at random to 0–30 cm soil depth in a zigzag pattern. The soil samples were composited for each location, air-dried, and passed through a 2-mm mesh size. A sub-sample (1 kg) of each composite was taken for Mehlich-3 extractable P, K, Ca, and Mg (Mehlich, 1984). Soil pH, texture, organic matter (OM), and total nitrogen were analyzed using the recommended soil test procedures (Waypoint Analytical Laboratory, Memphis TN, USA).
2.3 Weather data and physio-chemical soil properties
Rainfall and temperature data were obtained from weather stations of the study regions. Rainfall was unimodal with some trace in March, peaked in August, and declined in October across the three locations (Supplementary Figure S2). The two-year seasonal rainfall averaged 918.9, 1117.1, and 1314.8 mm for Manga, Nyankpala, and Dokpong, respectively (Supplementary Table S1). The average maximum (Tmax) and minimum (Tmin) temperatures were highest in March and April and lowest in August in all locations. The Tmax was higher in Manga by 1.5°C and 1.1°C above Nyankpala and Dokpong, respectively, and Tmin was higher in Nyankpala by 0.2°C above Manga and Dokpong (Supplementary Table S1). The mean cumulative rainfall (CRF) was 584.2, 664.3, and 769.7 (mm) for Manga, Nyankpala, and Dokpong, respectively, while the mean crop growth periods (CGP) for the soybean cultivar (Favor) were 127, 123, and 125 days at Manga, Nyankpala, and Dokpong (Table 1).
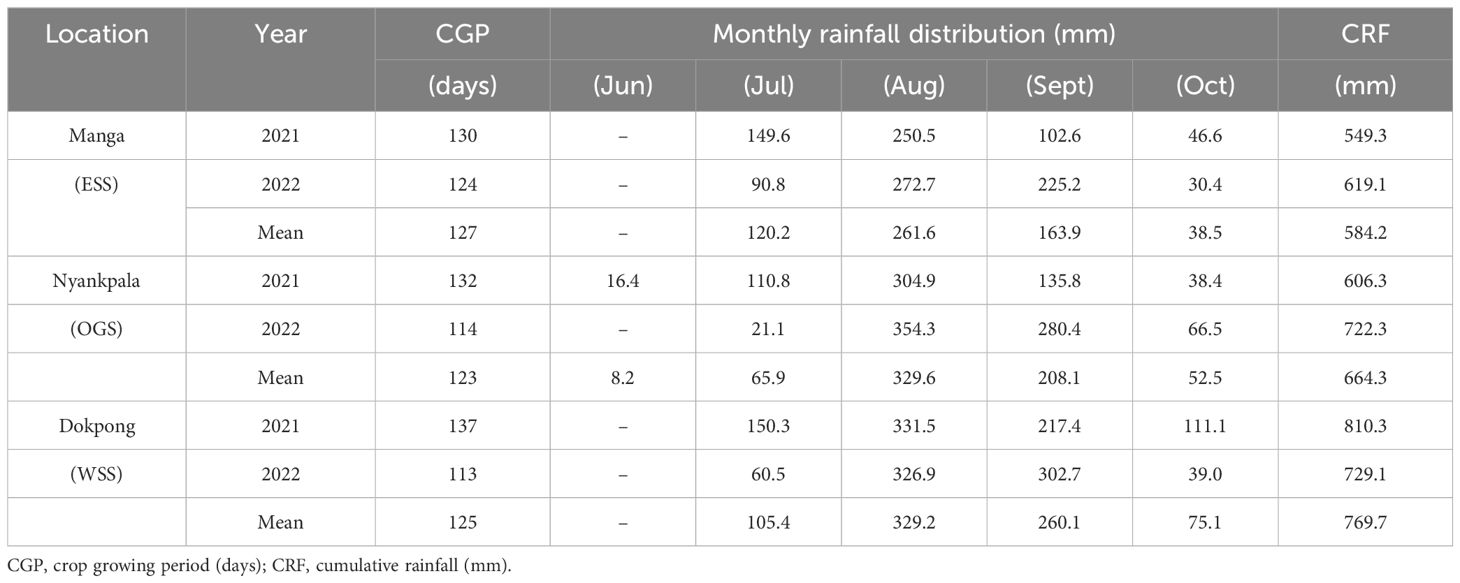
Table 1 Crop growing period and monthly rainfall distribution at Manga, Nyankpala, and Dokpong in Ghana’s interior savanna (2021–2022).
The soils were classified as sandy loam, moderately acidic (6.2 pH) at Manga, and strongly acidic at Nyankpala (5.4 pH) and Dokpong (5.5 pH) (Table 2). The available P was low (10.3–13.2 mg kg−1) and very low (35.0–44.0 mg kg−1) extractable K across locations. The extractable Ca was low (395.0 mg kg−1) at Manga and medium at Nyankpala (430.0 mg kg−1) and Dokpong (441.0 mg kg−1). The extractable Mg was medium (104.0–128.5 mg kg−1), with very low (0.7–0.9%) OM content, and low (7–12 mg kg−1) NO3–N across locations.
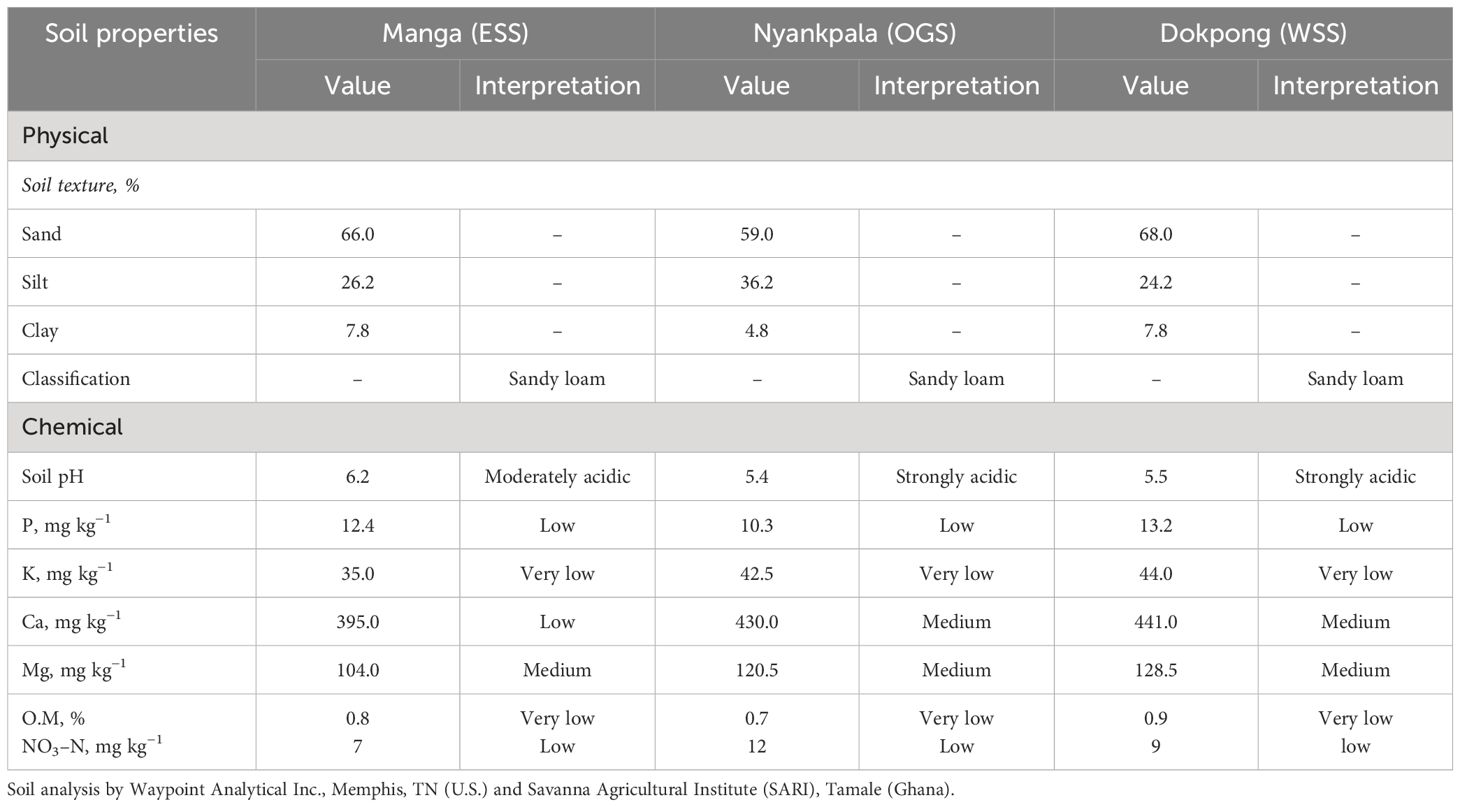
Table 2 Physical and chemical soil properties (0–30 cm depth) at Manga, Nyankpala, and Dokpong in Ghana’s interior savanna (2021–2022).
2.4 Treatment design and experimental procedure
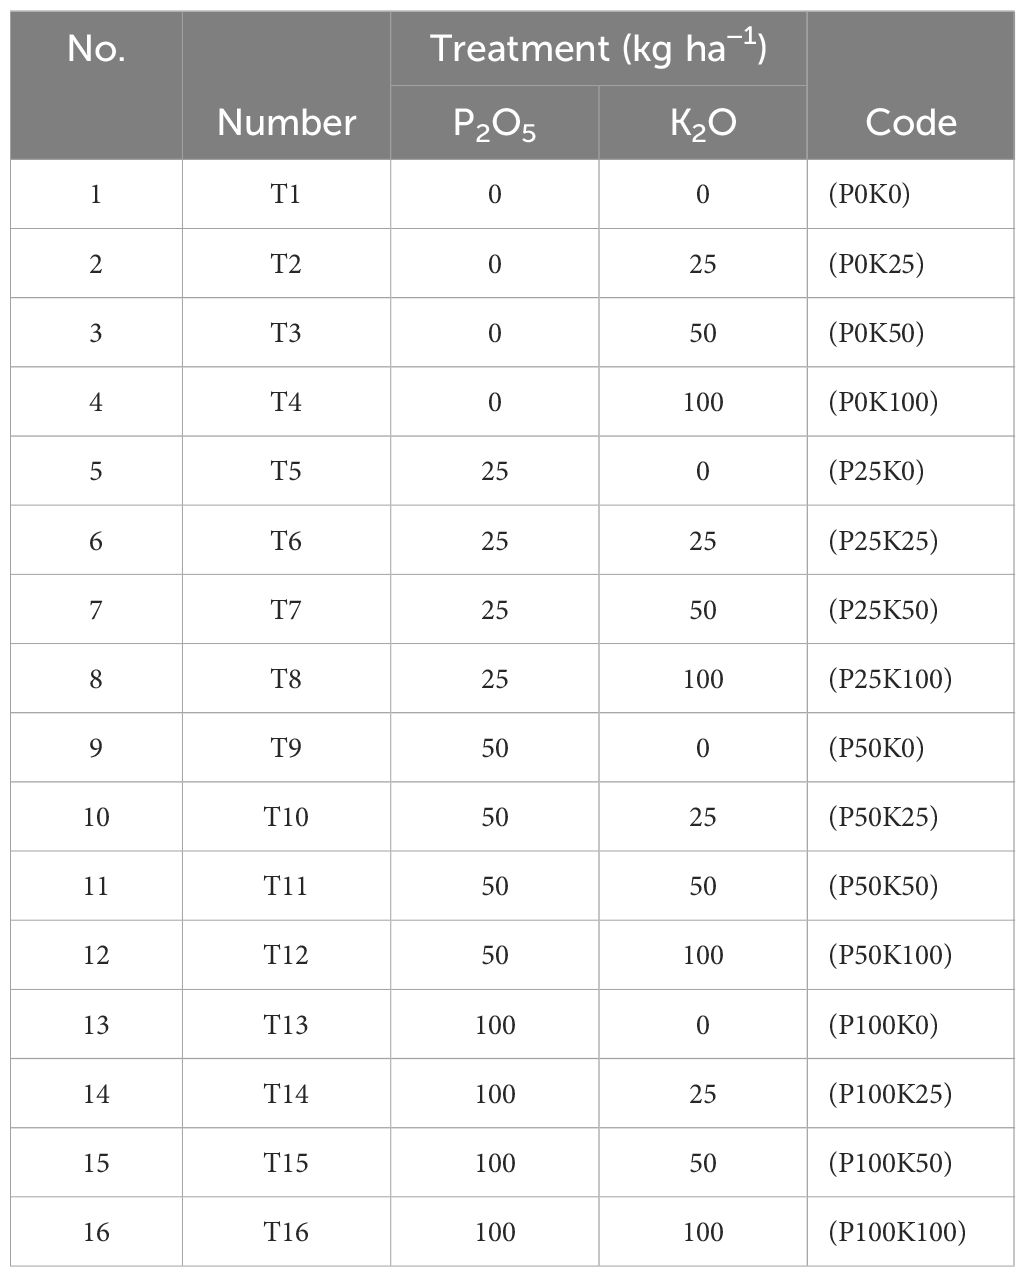
The experiment was a 4 × 4 factorial combination of four rates of P at 0, 25, 50, and 100 P2O5 (kg ha−1); K at 0, 25, 50, and 100 K2O (kg ha−1); and combinations (Table 3). There were 16 treatments laid out in a randomized complete block design with four replications (Table 3). The treatment rates were applied to a four-row plot that measured 5.0 × 3.0 m (5 m long and four rows 0.75 m apart) at 0 (Control), 37.5, 75.0, and 150.0 (g plot−1) as P2O5, K2O, and combinations sourced from triple superphosphate (TSP 46% P2O5) and muriate of potash (MOP 60% K2O), respectively.
2.5 Crop management
The soybean cultivar “Favor” (TGx 1844–22E), released and registered by the Savanna Agricultural Research Institute (SARI), was used as the test crop. The cultivar was of medium maturity (115–118 days), high yielding (2.0–3.5 kg ha−1), and a 5% field-shattering potential. The soybeans were planted to 75-cm ridged beds and thinned to 320,000 (plants ha−1) stand after 14 days of planting. Bradyrhizobium japonicum (strain USDA 110) (Nodumax, IITA BIP, Nigeria) inoculant was applied directly to the seeds in a two-step inoculation procedure at 1.0 g peat inoculant to 100.0 g seed with a 10% (w/v) gum arabic adhesive solution. Uninoculated plots were planted before the inoculant plots to avoid inoculum contamination. Seeds planted were immediately covered with soil to ensure good seed–soil moisture contact for proper germination and prevent the exposure of bacteria to direct sunlight. A single POST application of Odyssey WDG (imazamox 35% + imazethapyr 35%) herbicide at 43 g product ha−1 applied at the two to three true leaf stage in 200-L spray volume equivalent for weed control.
2.6 Nutrient use efficiency
The nutrient use efficiency (NUE) of P and K were evaluated using the partial factor productivity (PFP), agronomic efficiency (AE), and rain use efficiency (RUE).
Partial factor productivity (PFP) is the grain yield (kg ha−1) per the unit of nutrient rate applied of P2O5, K2O, or combination (kg ha−1) (Equation 1). The PFP indicates the farmers’ ability to integrate new technology (nutrient application) with indigenous knowledge (Dobermann, 2007).
Agronomic efficiency (AE) is the increase in grain yield (kg ha−1) per unit of nutrient (s) rate applied (kg ha−1) (Equation 2). The AE specifies the efficiency of crop utilization of each additional unit of applied nutrient (Dobermann, 2007).
Rain use efficiency (RUE) is the grain yield (kg ha−1) per the cumulative seasonal rainfall (CRF, mm) calculated from planting to crop maturity (Sharma et al., 2013) (Equation 3). The RUE is a measure of the efficient utilization of rainfall in the treatments under a rainfed environment.
2.7 Economic analysis
The economic feasibility of soybean production was evaluated with the variable cost ratio (VCR). The VCR is the grain yield increase per nutrient rate applied over the cost of the nutrient rate applied ($ ha−1) (Equation 4). A VCR value ≥ 2 is the baseline for potential technology adoption and profitability, and a VCR value ≤ 2 indicates a non-economic benefit (Roy et al., 2006). The nutrient input cost per treatment rate was calculated based on a 50-kg bag fertilizer product at an open market price at the time of the experiment (Supplementary Table S2).
Soybean prices were the average market price for 2021 and 2022. All the amounts are expressed in US dollars ($) at the average exchange rates of GHS 1 = $ 0.1695 for 2021 and GHS 1 = $ 0.1563 for 2022 (Sasu, 2023; Supplementary Table S2).
2.8 Data collection
Data were collected on days and plant height (cm) at 50% plant flowering. Grain and stover yields (kg ha−1), nutrient use efficiency, and economic profitability were evaluated at harvest.
2.8.1 Flowering time and plant height
The flowering time was evaluated from the date of planting to 50% of plants at the R1 flowering stage in the 7.5 (m2) sample net plot. Plant height was measured on six randomly sampled plants and measured at flowering time from net plots and tagged for stover yield (kg ha−1) and harvest index (kg kg−1) assessments at harvest. The plant height was measured from the base of each plant stem above the soil to the apex, and the average plant height was calculated.
2.8.2 Grain yield, stover yield, and harvest index
Grain yield, stover yield, and harvest index were evaluated at harvest from a net plot area of 7.5 m2 (two middle rows) and expressed in kilograms per hectare (Awuni et al., 2020).
2.9 Statistical analysis
A combined analysis of location site years (Moore and Dixon, 2014) was performed with an analysis of variance (ANOVA) in SAS Software (9.4) using the MIXED procedure (SAS Institute, 2016). The P and K treatments (T), location (L), and T × L interaction were fixed, and the effects of year (Y) and replication (R) were random. The Fisher’s protected LSD was used for mean separation with the DIFFS option and LSMEANS statement for letter grouping when treatment effects were significant at p< 0.05 (Saxton, 1998).
3 Results
3.1 Synergistic effect of phosphorus and potassium
The results indicated a synergistic effect of P and K interaction on grain yield, rain use efficiency (RUE), and partial factor productivity (PFP) in all locations; harvest index (HI) at Nyankpala and Dokpong; agronomic efficiency (AE) at Manga and Dokpong; and variable cost ratio (VCR) at Dokpong (Table 4; Figures 1–3). A synergistic interaction occurred when the combined effect of P and K was greater than the sum of each independently.
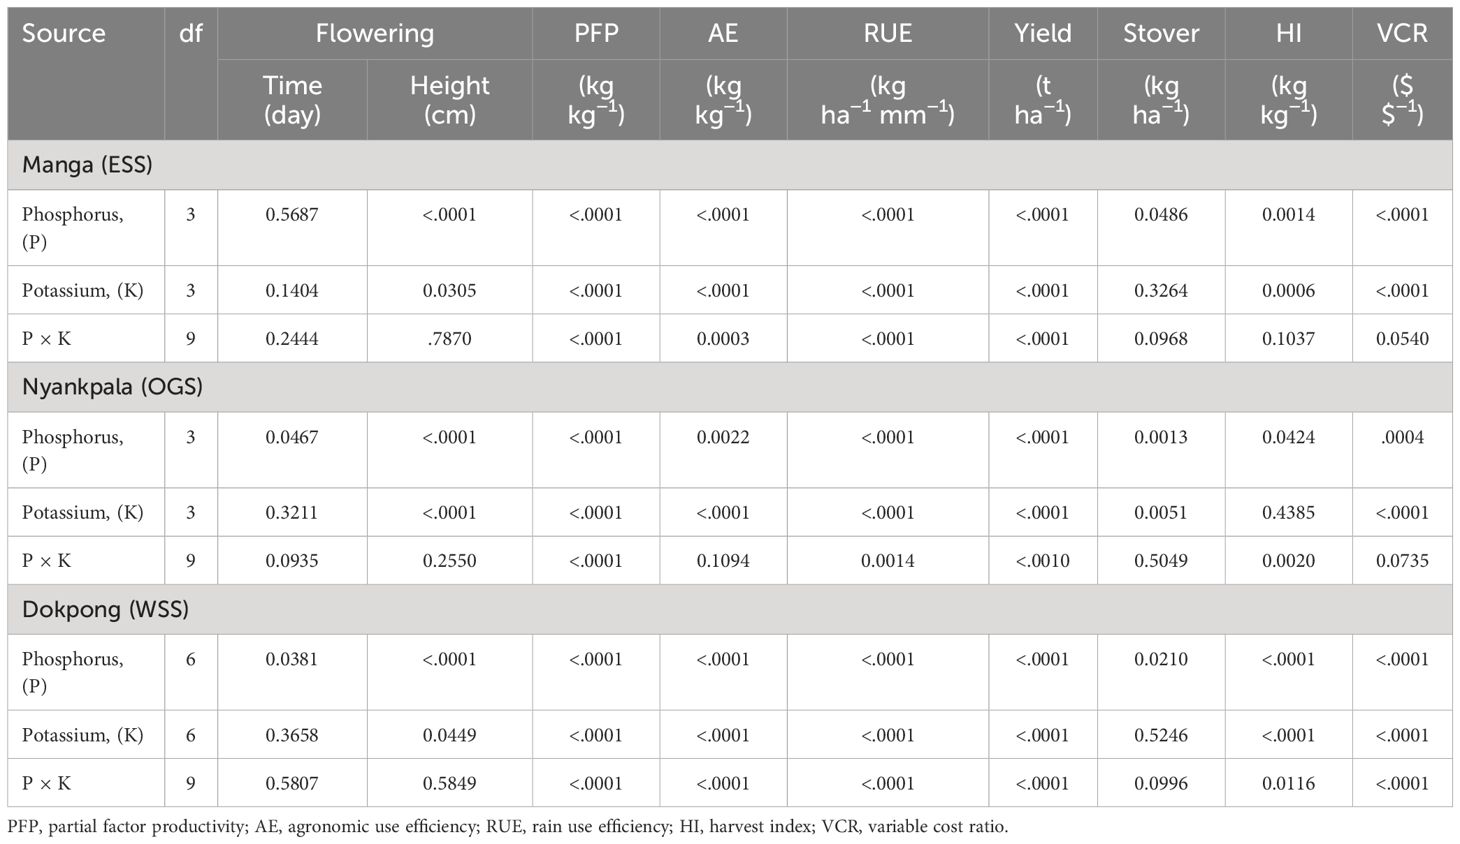
Table 4 Probability (F-values) for the phosphorus and potassium rates on soybean phenology, yield, and input use efficiency at Manga, Nyankpala, and Dokpong in Ghana’s interior savanna.
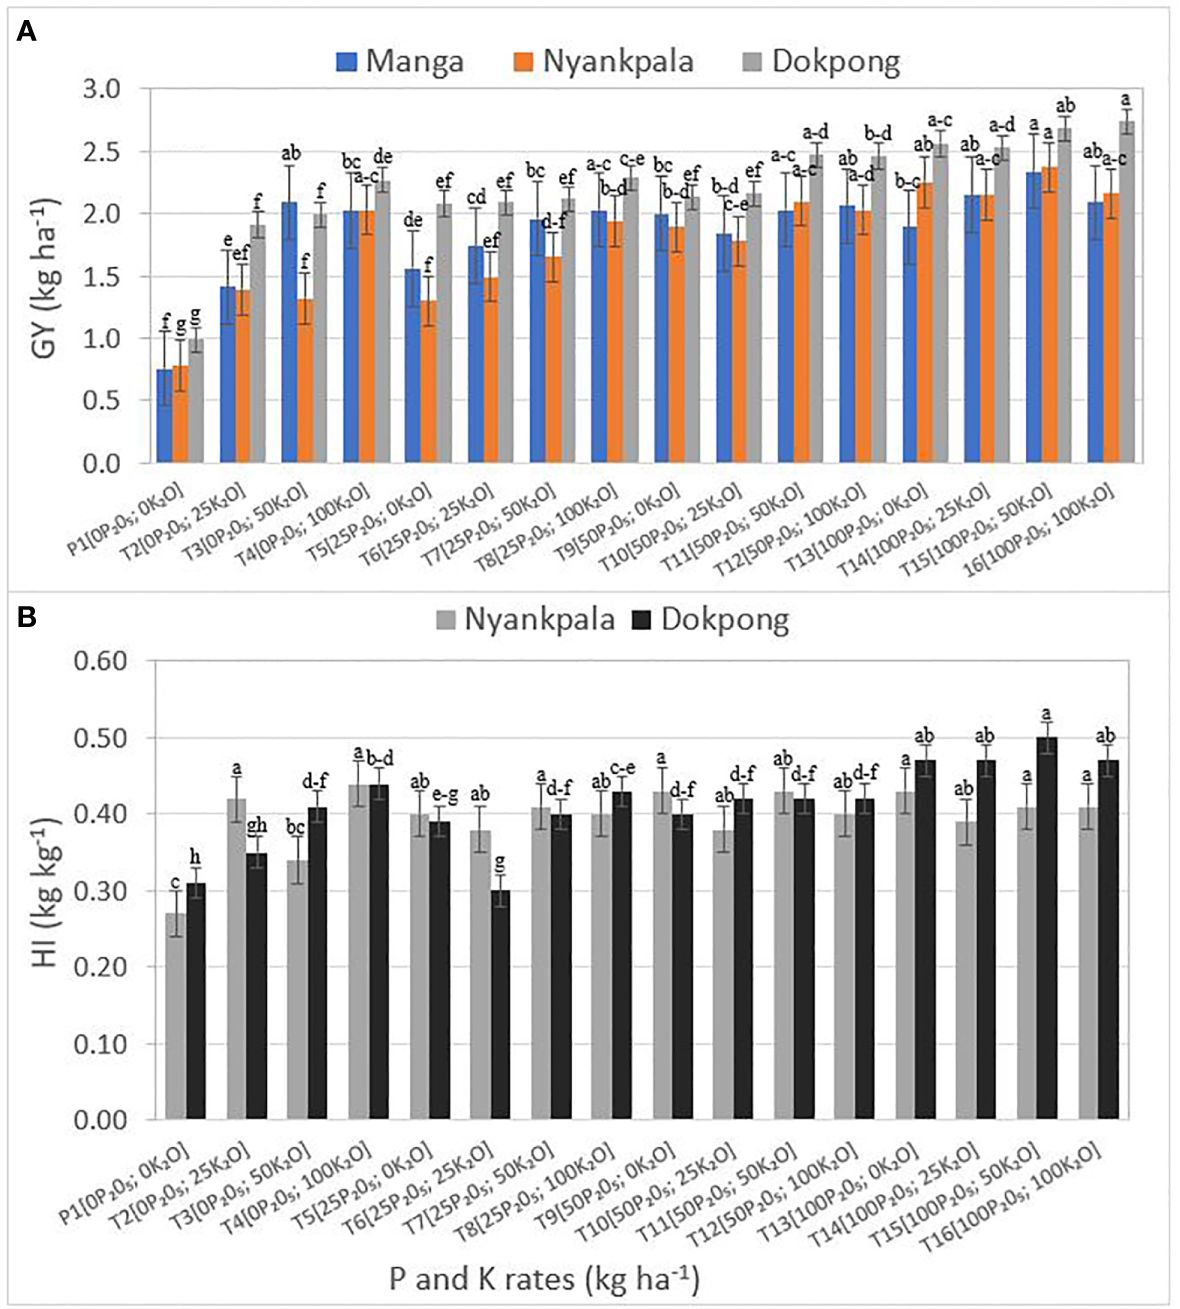
Figure 1 (A, B) Interaction effects of P and K rates (kg ha-1) on (A) grain yield (GY) at Manga, Nyankpala, and Dokpong; and (B) harvest index (HI) at Nyankpala and Dokpong. Means (SEM±) within treatments in the same location with the same letter(s) group are not significantly different (P <0.05).
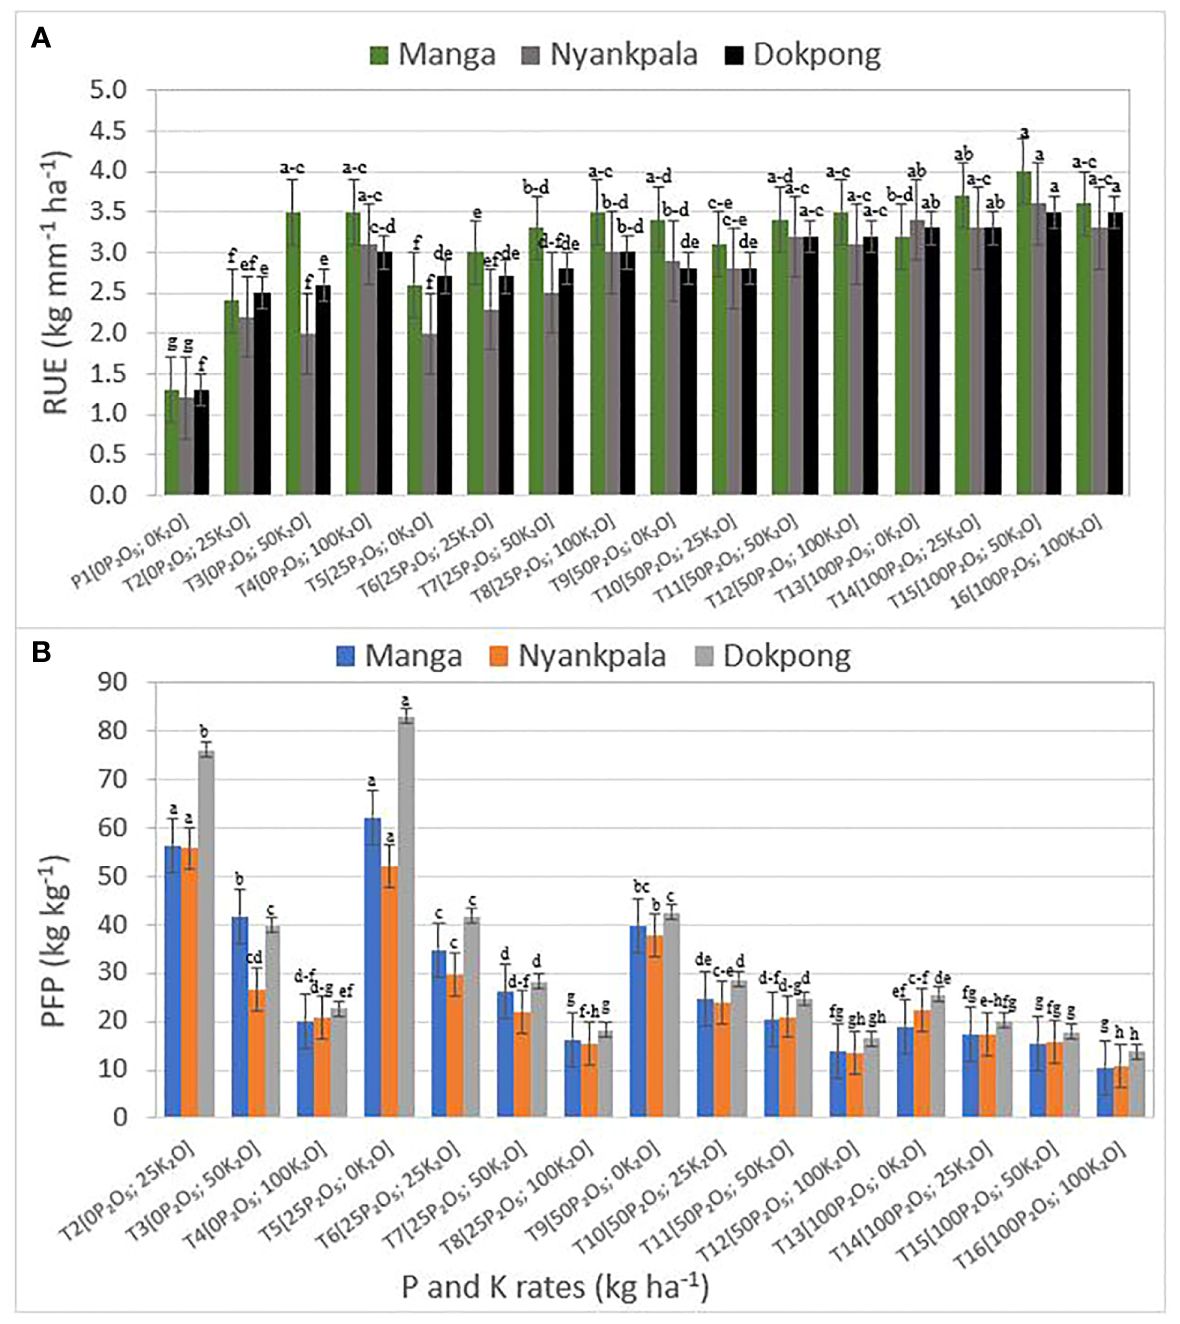
Figure 2 (A, B) Interaction effects of P and K rates (kg ha-1) on (A) rain use efficiency (RUE); and (B) partial factor productivity (PFP) at Manga, Nyankpala, and Dokpong. Means (SEM±) within treatments in a location with the same letter(s) group are not significantly different (P <0.05).
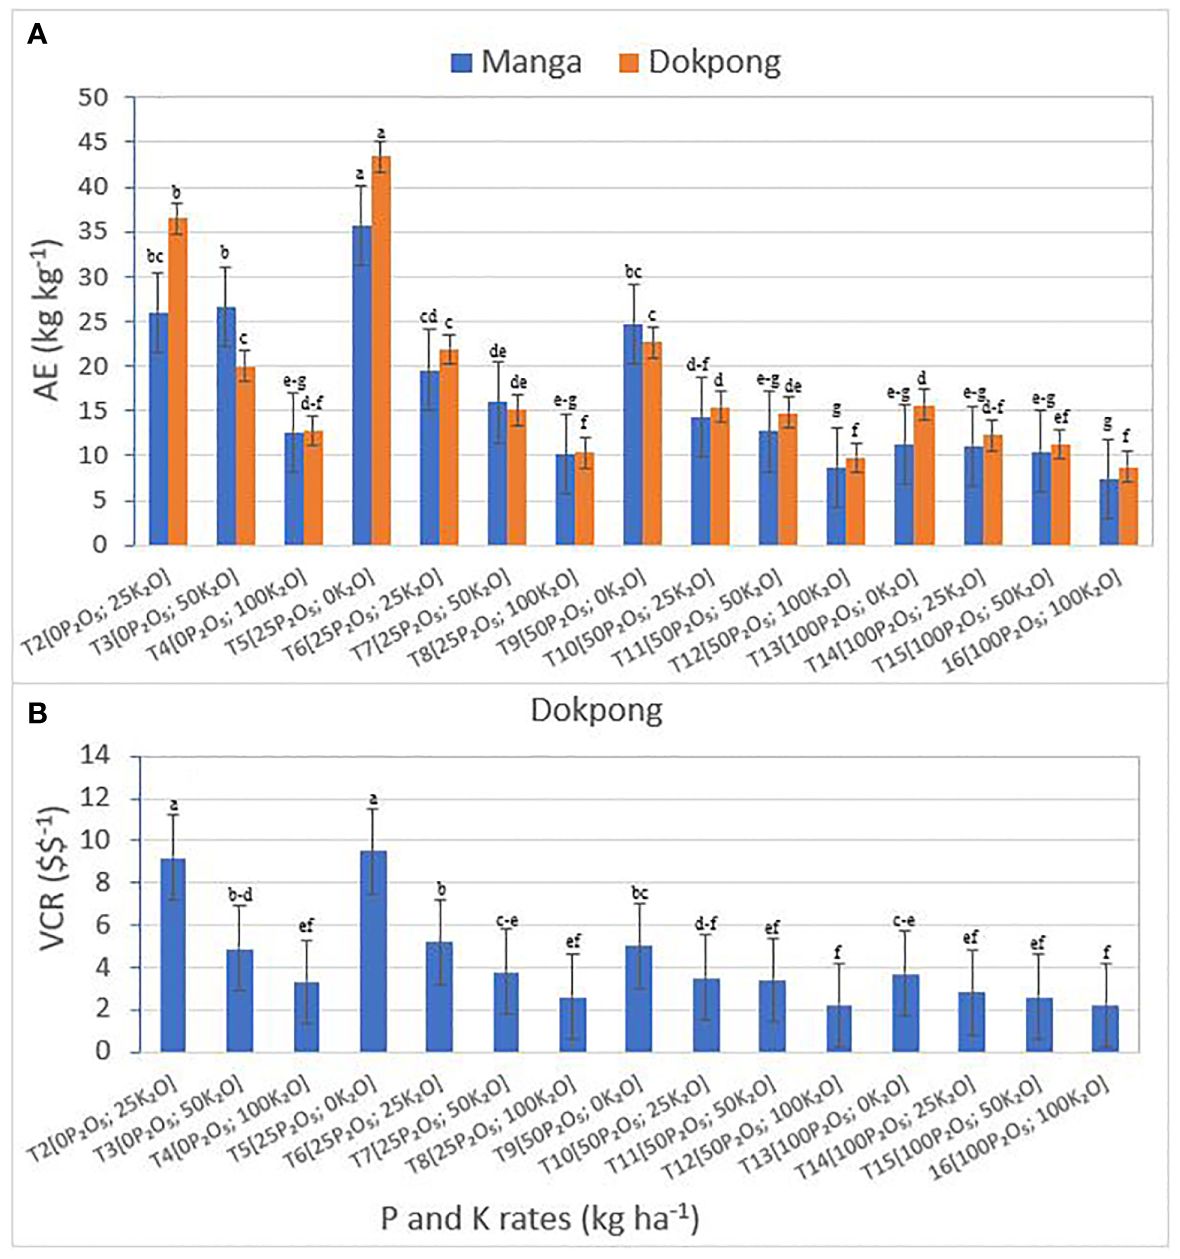
Figure 3 (A, B) Interaction of P and K rates (kg ha-1) on (A) agronomic efficiency (AE) at Manga and Dokpong; and (B) variable cost ratio (VCR) at Dokpong. Means (SEM±) within treatments at a location with the same letter(s) group are not significantly different (P <0.05).
3.1.1 Grain yield (PK-GY) and harvest index (PK-HI)
The synergy of P and K treatment rates on grain yield (PK-GY) differed significantly (Table 4), with PK-GY increasing as the synergy of P and K rates increased in all locations (Figure 1A; Supplementary Table S3). The highest grain yield at Manga (2.34 t ha−1) and Nyankpala (2.37 t ha−1) was from treatment T15, not statistically different from T16, T14, T12, T11, T8, and T3 at Manga, including T13 and T4 at Nyankpala. At Dokpong, the highest grain yield (2.74 t ha−1) was from treatment combination T16, similar to treatment combinations T15, T14, T13, and T11. The control T1 had the lowest grain yield (<1.0 t ha−1) in all locations.
The synergy of P and K on harvest index (PK-HI) differed significantly at Nyankpala and Dokpong (Table 4). At Nyankpala, treatment T4 had the highest PK-HI (0.44 kg kg−1) similar to all other treatments except T3 and the control T1 (Figure 1B; Supplementary Table S3). At Dokpong, T15 had the highest PK-HI (0.50 kg kg−1) similar to treatments T14 and T16; control T1 had the lowest PK-HI of 0.27 and 0.31 (kg kg−1) at Nyankpala and Dokpong locations.
3.1.2 Rain use efficiency (PK-RUE) and partial factor productivity (PK-PFP)
The synergistic effect of P and K treatment combinations on rain use efficiency (PK-RUE) differed significantly in all locations (Table 4). The PK-RUE increased as P and K combination rates increased with T15 being the highest PK-RUE of 4.0, 3.5, and 3.6 (grain kg ha−1 mm−1 rainfall) at Manga, Nyankpala, and Dokpong, respectively (Figure 2A; Supplementary Table S4). These values did not differ significantly from treatment combinations T16, T14, and T12 across the specified locations; T8, T4, and T3 at Manga; T13 and T11 at Nyankpala and Dokpong; and T4 at Nyankpala. The control T1 had the lowest PK-RUE of 1.5 (grain kg ha−1 mm−1 rainfall) across locations.
The synergy of P and K on partial factor productivity (PK-PFP) was significant across locations (Table 4). The PK-PFP decreased as P and K treatment combinations increased in all locations (Figure 2B; Supplementary Table S4). The highest PK-PFP at Manga (62.2 kg kg−1) and Dokpong (83.1 kg kg−1) were from treatment combination T5, and treatment combination T2 at Nyankpala (55.8 kg kg−1). In contrast, the treatment combination T16 recorded the lowest PK-PFP values of 10.4, 10.8, and 13.7 (kg kg−1) at Manga, Nyankpala, and Dokpong, respectively.
3.1.3 Agronomic efficiency and value cost ratio
The synergy of P and K treatment interaction on agronomic efficiency (PK-AE) differed significantly at Manga and Dokpong (Table 4). The PK-AE values decreased with increasing P and K treatment combinations at the two locations (Figure 3A; Supplementary Table S5). Hence, the synergy of treatment T5 (P25K0) had the highest PK-AE of 35.7 and 43.4 (kg kg−1) at Manga and Dokpong, respectively. In contrast, the synergy of treatment T16 had the lowest PK-AE of 7.4 and 8.8 (kg kg−1) at Manga, and Dokpong, respectively.
The effect of P and K treatment interaction on the variable cost ratio (PK-VCR) only differed significantly at Dokpong (Table 4). The PK-VCR decreased with increasing P and K treatment combination rates (Figure 3B; Supplementary Table S5). Thus, the highest PK-VCR was from T5 (9.5 $ $−1), not statistically different from T2 (9.2 $ $−1). In contrast, the T16 obtained the lowest PK-VCR across locations.
3.2 The additive effects of phosphorus and potassium
The results indicated an additive effect of P and K interaction at 50% flowering time (days), plant height, and stover yield (SY) in all locations; harvest index (HI) and VCR at Manga; and agronomic efficiency (AE) and VCR at Nyankpala (Table 4; Figures 4–7). An additive interaction occurred when the combined effect of P and K was the sum of each independently.
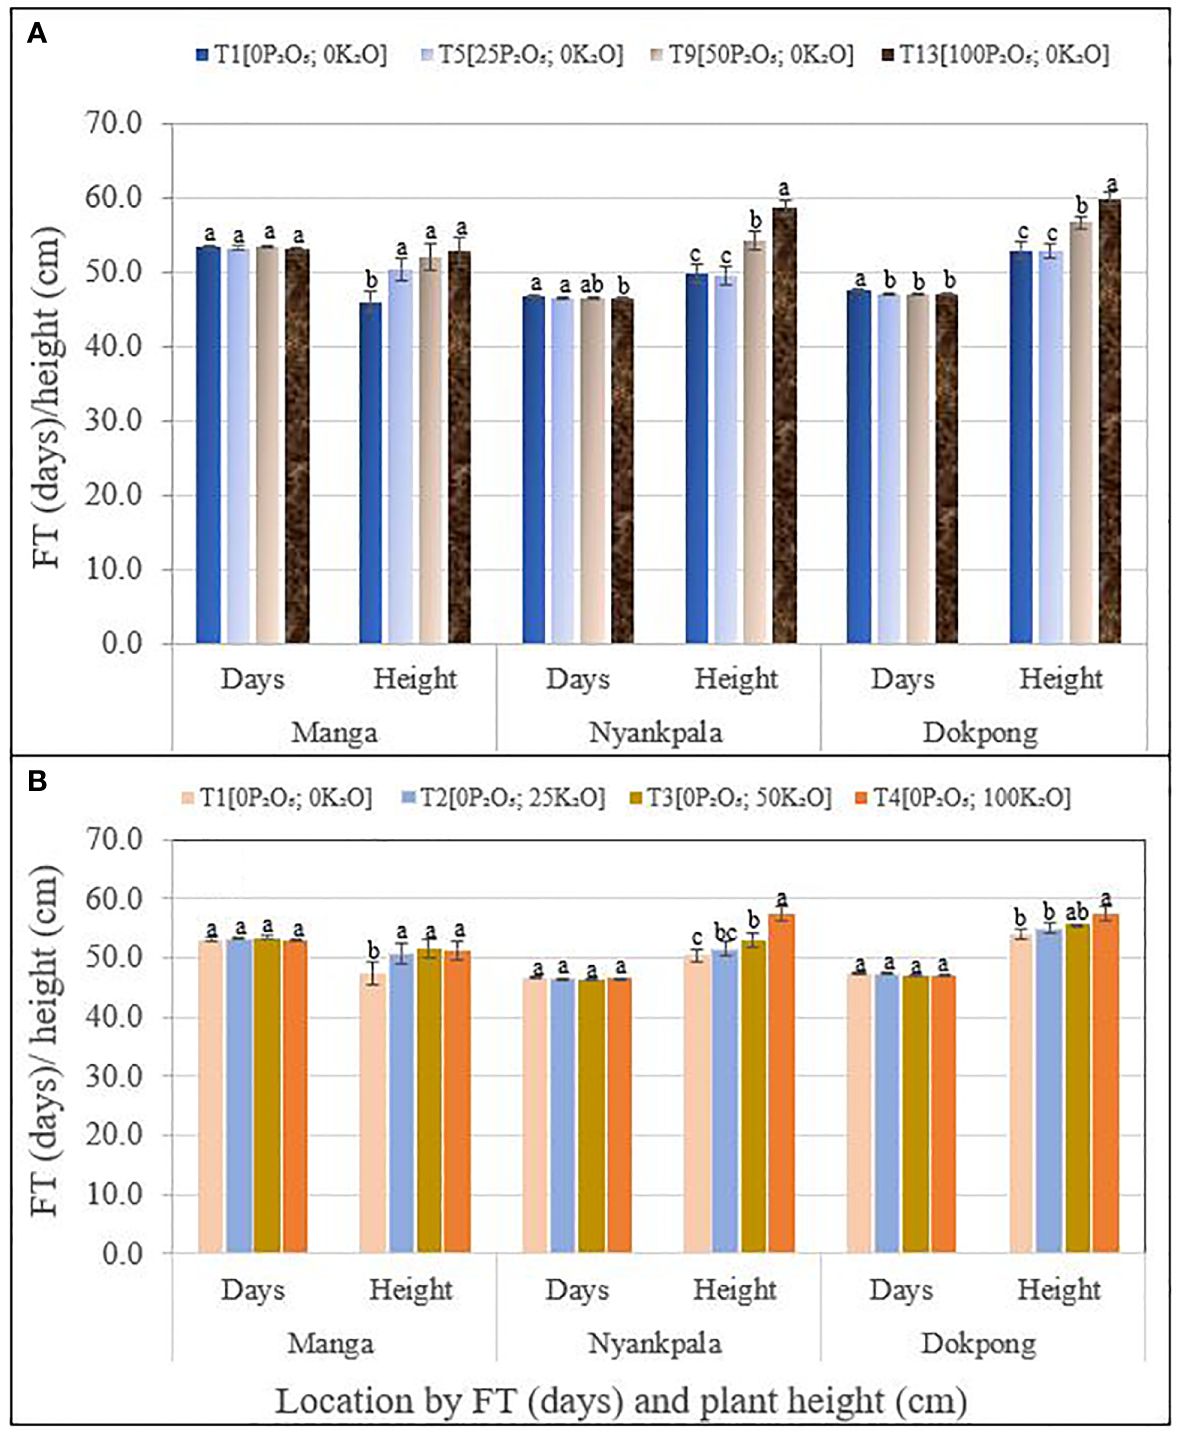
Figure 4 (A, B) Main effects of (A) P and (B) K rates (kg ha-1) of location, flowering time (FT), and plant height (cm) at Manga, Nyankpala, and Dokpong. Means (SEM±) within a treatment and in tha same location with the same letter(s) group are not significantly different (P <0.05).
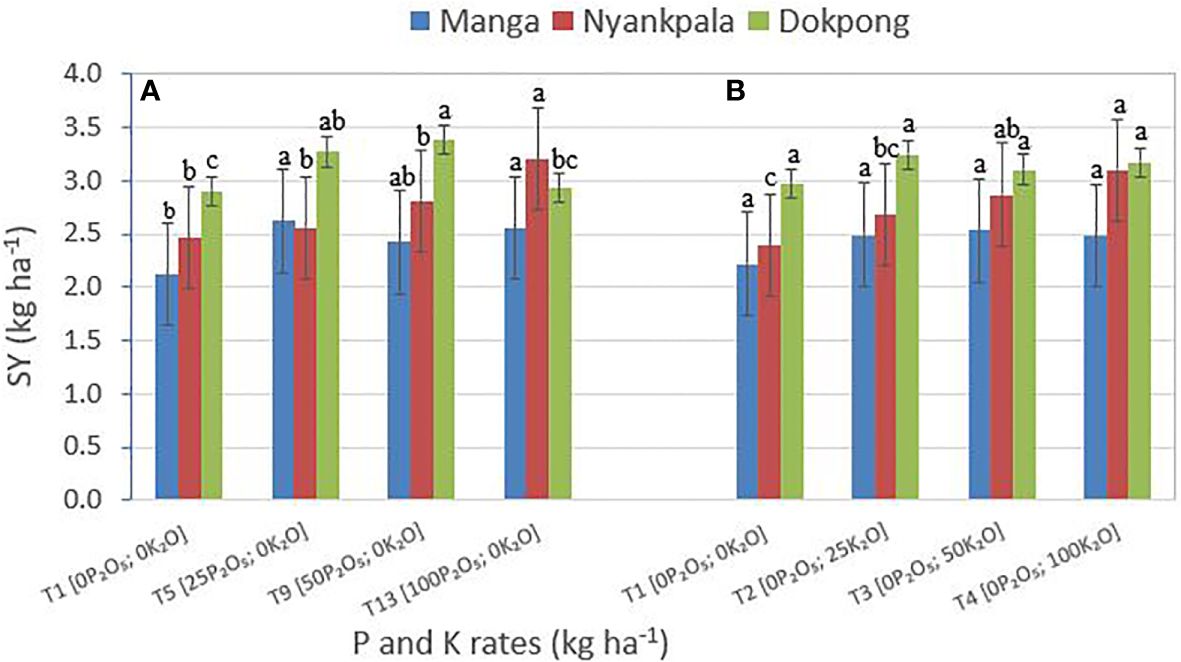
Figure 5 (A, B) Main effects of (A) P and (B) K rates (kg ha-1) on stover yield (SY) at Manga, Nyankpala, and Dokpong. Means (SEM±) within a treatments and in the same location with the letter(s) group are not significantly different (P <0.05).
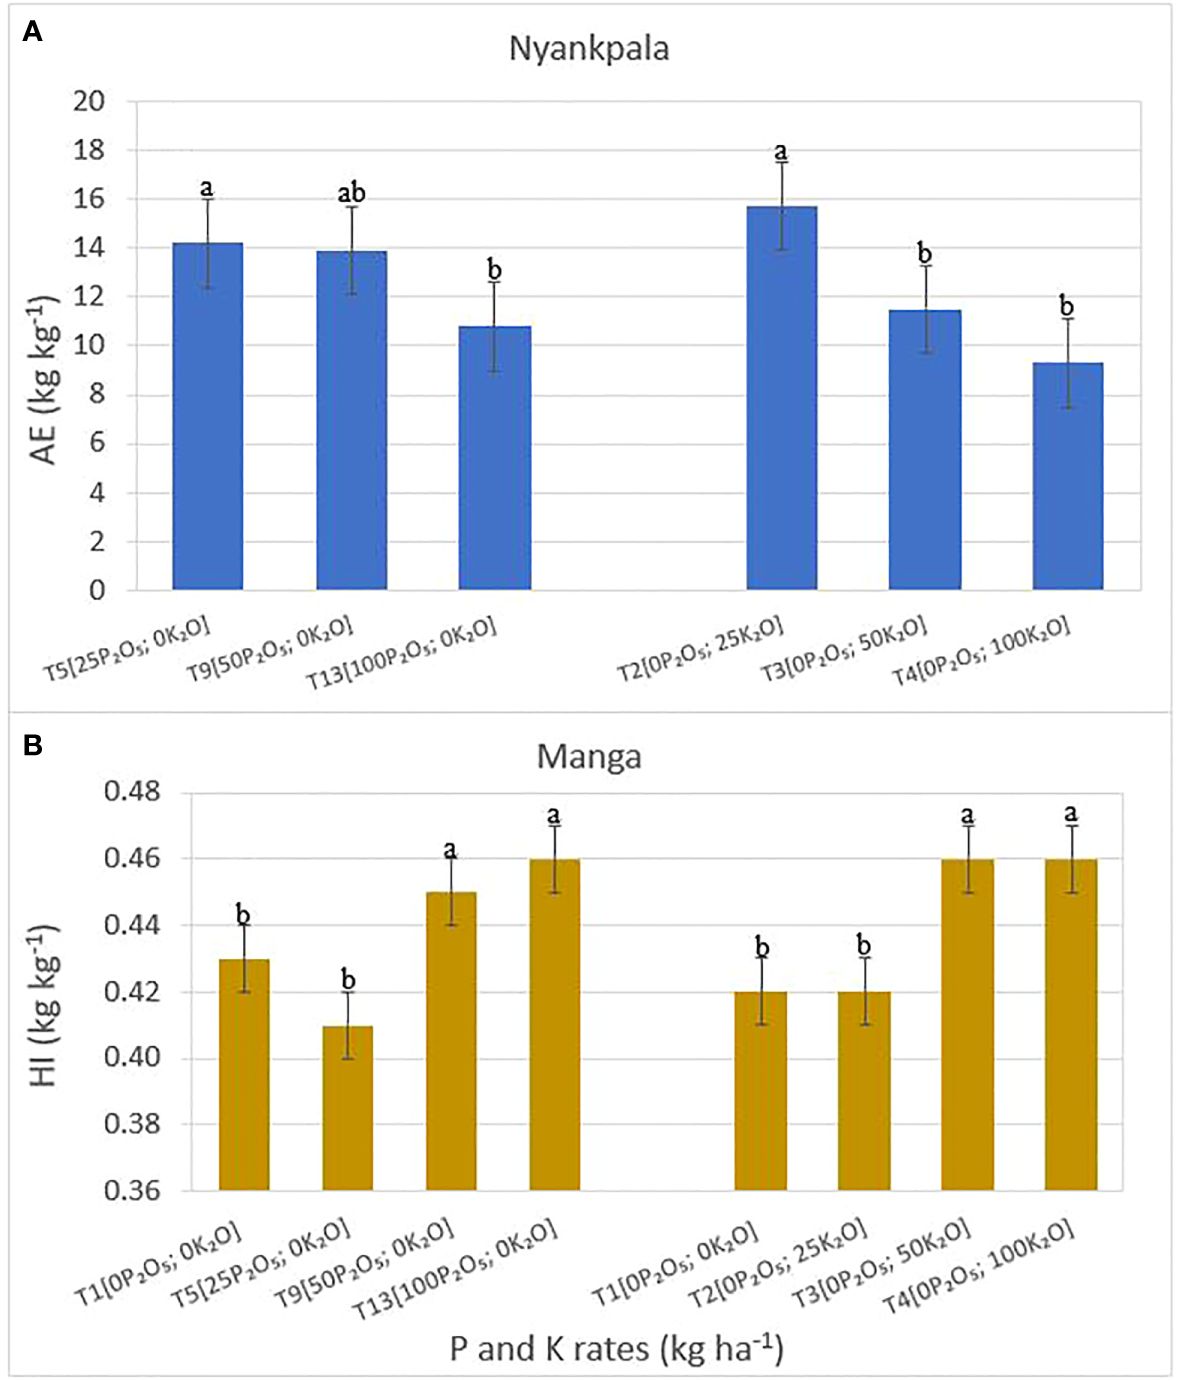
Figure 6 (A, B) Main effects of P and K rates (kg ha-1) on (A) agronomic efficiency (AE) at Nyankpala; and (B) harvest index (HI) at Manga. Means (SEM±) within a treatment and in the same the location with the same letter(s) group are not significantly different (P <0.05).
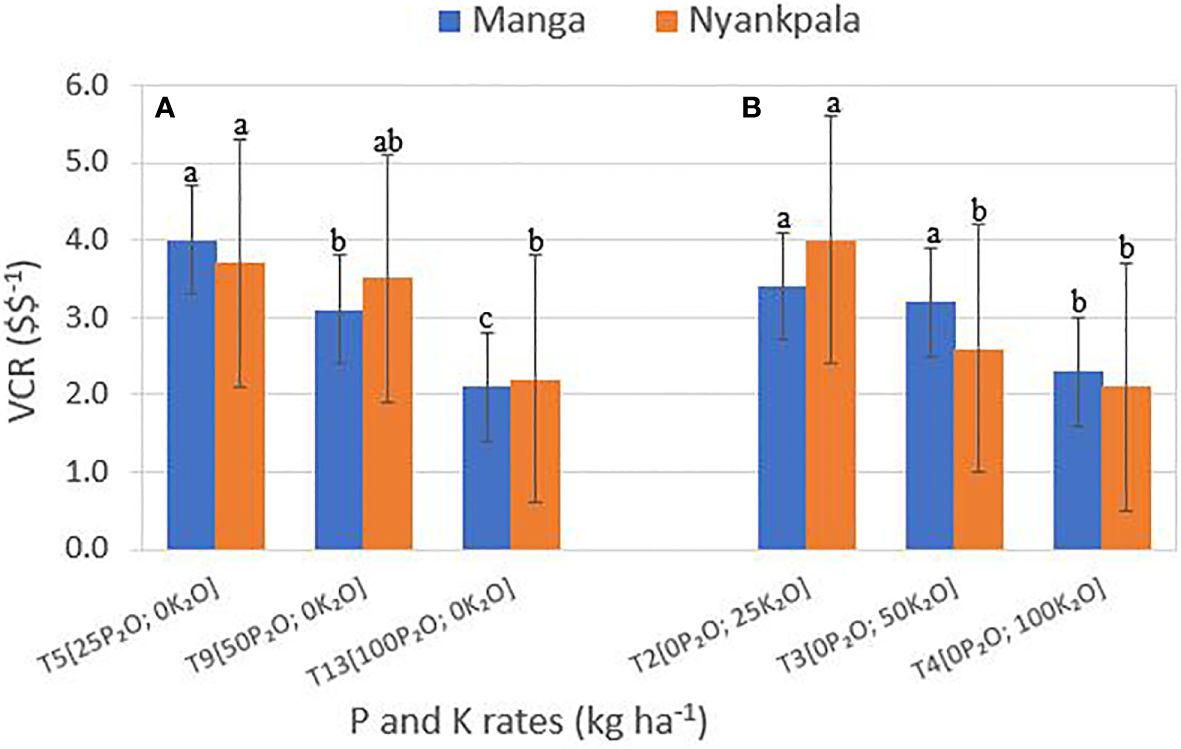
Figure 7 (A, B) Main effects of (A) P and (B) K rates (kg ha-1) on the variable cost ratio (VCR) at Manga and Nyankpala. Means (SEM±) within a treatment and in the location with the same letter group are not significantly different (P <0.05).
3.2.1 Flowering phenology and stover yield
The effect of P rates on flowering time (P-FT) differed significantly at Nyankpala and Dokpong (Table 4) with flowering time reduced by 0.2–0.4 (days) compared to the control T1 (Figure 4A; Supplementary Table S6), with a significant increase in plant height across locations. At Manga, the P rates increased plant height by 10%–15% over the control T1. At Nyankpala, the highest plant height was from T13 by an increase of 18.0%, 18.0%, and 8.0% over the control T1, T5, and T9, and at Dokpong by 13.0%, 12.6%, and 2.0%, respectively.
In contrast, the K treatment rates did not influence flowering time significantly across locations. However, plant height was significantly impacted across locations (Table 4). In Manga, the K treatment rates increased plant height over the control T1 by 8% (Figure 4B; Supplementary Table S6). In Nyankpala, the K treatment rate T4 increased plant height by 14%, 11%, and 8% control T1, T2, and T3, respectively. Similarly, at Dokpong, the K treatment rate T4 increased plant height over the control T1 and T2 by 6% and 4%, respectively.
The P treatment rates significantly impacted stover yield across locations (Table 4) with an increase of 14%–24% over the control T1 at Manga (Figure 5A; Supplementary Table S6). The P treatment rate T13 at Nyankpala had the highest stover yield (3.2 kg ha−1), with an increase over the P control treatment T1, T5, and T9 by 31%, 25%, and 14%, respectively. At Dokpong, the P treatment rate T9 recorded the highest stover yield (3.4 kg ha−1), with an increase over the control T1 and T13 by 17 and 15%, respectively.
In contrast, the K treatment rates resulted in a significant stover yield at the Nyankpala location (Table 4) with the highest stover yield (3.10 kg ha−1) from T4 by 30% and 16% over the control T1 and T2, respectively (Figure 5B; Supplementary Table S6).
3.2.2 Agronomic efficiency and harvest index
The effect of P treatment rates on P-AE at Nyankpala was significant with treatment T13 having the lowest P-AE compared to T5 and T9 (Figure 6A; Supplementary Table S7). The effect of K treatment rates on K-AE differed significantly, with K-AE values decreasing as K treatment rates increased (Figure 6B; Supplementary Table S7). Thus, the treatment rate T2 recorded the greatest K-AE value of 15.7 (kg kg−1).
The impact of P treatment rates on P-HI was significant and was increased as the P treatment rates increased with the highest P-HI (0.46 kg kg−1) from treatment T13, and not statistically different from treatment T9 (0.45 kg kg−1) (Figure 6B; Supplementary Table S7). The lowest P-HI was obtained from treatment T5 (0.41 kg kg−1), which was not statistically different from the control treatment T1 (0.43 kg kg−1). Similarly, the K treatment rate T4 had the highest K-HI (0.46 kg kg−1), similar to T3 (0.46 kg kg−1), and the lowest K-HI from T2 (0.42 kg−1) and control T1 (Figure 6B; Supplementary Table S7).
3.2.3 Value cost ratio
The impact of P treatment rates on P-VCR decreased with increasing P treatment rates at Manga and Nyankpala (Figure 7A; Supplementary Table S7). The highest P-VCR was from the treatment rate T5 with 4.0 and 3.4 ($ $−1) at Manga and Nyankpala, respectively. The lowest P-VCR at Manga (2.1 $ $−1) and Nyankpala (2.3 $ $−1) were from T1. Similarly, the K treatment rates significantly impacted VCR at the Manga and Nyankpala locations with a decrease in K-VCR values as K rates increased. The highest K-VCR values at Manga (3.7 $ $−1) and Nyankpala (4.0 $ $−1) were from T2 (Figure 7B; Supplementary Table S7), and the lowest were from T4 at Manga and Nyankpala.
4 Discussion
The current study was designed to evaluate the interaction effect of P and K treatment rates on soybean cv. Favor for growth and development. The study found that the combined effect of P and K produced additive interaction for flowering time (days), plant height, and stover yield (SY) and synergistic interaction on grain yield, RUE, and PFP across locations, but varied for harvest index (HI), AE, and VCR among locations. An additive interaction occurs when the combined effect of P and K is the sum of each independent factor, while a synergistic interaction occurs when the combined effect of P and K is greater than the sum of each independent factor (Fong et al., 2017). Fageria and Oliveira (2014) noted that the combined effect of P and K nutrient rates may either produce a positive, negative, or neutral response, based on yield and yield components.
Smallholder farmers consider soybeans as a “zero-input” crop (Mungai et al., 2016), but soil health is critical for high-yielding soybeans. The soil test results presented in this study suggest soil remediation of nutrient inputs to make a meaningful crop harvest. The soil pH ranged from moderately acidic (Manga) to strongly acidic (Nyankpala and Dokpong), with lime required to improve soil pH at Nyankpala and Dokpong for soybeans (Awuni et al., 2023). The available P and extractable K were limiting at low and very low values across the three locations. Slaton and Steinke (2021) noted that phosphorus soil test levels should be maintained between 20 ppm and 40 ppm for soybeans. Nitrate concentration in soil is a good indicator of available nitrogen to plants. The required soil nitrate–nitrogen (NO3–N) differs from crop to crop, but the generally desired concentration ranges between 10 mg kg−1 and 50 mg kg−1.
4.1 Soybean flowering time and plant height
The current study observed that the control T1 had longer days to flowering time (R1) at Nyankpala and Dokpong and reduced plant height across locations. Neenu et al. (2020) reported similar findings with various P application rates in soybeans on vertisols of central India. In contrast, the K application rates had a neutral response to flowering time, but positively increased plant height compared to the control T1. The reduced flowering time and increased plant height in the P treatment rates could be explained by improved nutrient uptake and better water use efficiency relative to the control treatments. By implication, the additive P and K mitigation effect on flowering time and plant height is easily predictable. Munthali et al. (2017) observed that nutrient application can mitigate environmental stress and enhance crop development for yield optimization.
4.2 Nutrient interaction and use efficiency of P and K application
Sub-optimal and unbalanced fertilizer use favors multi-nutrient deficiency in most soils in Ghana’s interior savanna, especially true for the primary nutrients of N, P, and K. The P and K use efficiency were evaluated based on soybean yield, stover yield, HI, PFP, AE, RUE, and VCR. These parameters provide an integrative index that quantifies total economic output relative to nutrient resource utilization in cropping systems (Yadav, 2003).
The synergistic application of P and K rates increased grain yield, PFP, and RUE in all three locations; AE at Manga and Dokpong; and HI at Nyankpala and Dokpong. The combined effect of P and K on PFP and AE was maximized at low treatment rates T2 and T5 compared to higher P and K treatment combinations. The low treatment rates T2 and T5 had the highest PFP, AE, and VCR compared to the high nutrient treatment rates. Dobermann (2007) published similar results with PFP values of 40–80 (kg kg−1) and noted that values >60 (kg kg−1) were well-managed production systems. The PFP values in the current study for T2 and T5 ranged between 52 and 76 (kg kg−1). The control T1 had the lowest PFP, indicating low soil fertility and declined indigenous soil P and K supply. Similarly, the AE values in this study were between 21 and 37 (kg kg−1). Dobermann (2007) reported similar values of 10–30 (kg kg−1) and noted that values<25 (kg kg−1) were well-managed production systems. Integrating cultural practices promotes nutrient recycling, helps reduce the quantity of fertilizer applied, and improves fertilizer use efficiency. Vanlauwe et al. (2011) noted that nutrient management sought to utilize indigenous knowledge to maximize the AE of applied nutrient inputs. Broadcast fertilizer application is and has been the most popular and low-cost method among smallholder farmers. This study suggests that a band application of low fertilizer input could increase the yield of soybeans or even reduce the optimal fertilization rate and avoid waste. This means band application could increase crop nutrient uptake in soils where there is unusually high P and K fixation capacity and when unfavorable soil conditions restrict root growth. Therefore, smallholder farmers must develop management practices that maximize agronomic efficiency and improve nutrient stewardship in crop fields, such as applying the right nutrient source, at the right rate, time, and placement (APNI, 2022).
In contrast, the synergy of P and K interaction increased grain yield, stover yield, harvest index, and RUE. This was true for treatment combinations that involved low levels of P and increased levels of K or the reversal, but the yield gains decreased with an increasing trend of higher P and K combinations. In all cases, the optimum grain yield, harvest index, and RUE were obtained from the treatment combination T15 across locations. Turner (2004) observed that nutrient application enhanced crop growth, yield, and RUE through increased nutrient uptake and improved agronomic practices.
The use of phosphate and potash fertilizers per hectare of cropland in Ghana is low at 16.2 (P2O5 kg ha−1) and 13.6 (K2O kg ha−1) (Ritchie et al., 2023). This is not an isolated case related to Ghana alone but SSA countries that triggered the 2006 Abuja declaration to suggest increased fertilizer use to 50 kg ha−1 to increase crop yields (Henao and Banaante, 2006).
4.3 Economic implication of P and K application rates
The VCR showed that increasing nutrient application rates decreased VCR values. Hence, the greatest VCR values were from T2 at Manga and T5 at Nyankpala and Dokpong locations, and the lowest VCR from the combined treatment T16 across locations. The VCR values for treatment rates T2 and T5 were between 5.4 and 9.2 ($ $−1), and the lowest VCR from the high nutrient input treatments was between 1.5 and 2.2 ($ $−1) across the three locations. The results indicated that treatment rates T2 and T5 were the most economical and profitable across locations.
In contrast, the combined treatment rate T16 obtained the lowest economic returns across locations. Munthali et al. (2017) reported similar results in Malawi, suggesting that smallholder farmers may be more comfortable with the low fertilizer application. All treatment rates passed the VCR threshold of 2.0 to be economically and profitably acceptable for farmer adoption, except for the combined treatment rates T12 and T16 at Manga and Nyankpala. This may be supported by the theory of diminishing returns, which suggests that as P and K are applied incrementally, the rate of profit margins increases initially but, at a point, cannot continue to increase if other variables remain constant. However, the economic viability of a crop production system depends on the yield and the cost of production (input price). Houssou et al. (2017) asserted that resource-limited farmers, basically smallholder farmers, would invest in the lowest opportunity cost that enhances crop growth and provides the best returns on investment.
5 Conclusion
By adopting sustainable nutrient management practices such as crop rotation and precision nutrient placement, farmers can improve soil health, conserve water, and reduce nutrient losses. Fertilization, mulching, and composting can help maintain soil fertility and promote the growth of soybeans. The results of this study indicated that the application of P and K treatment rates had a significant effect on grain yield, nutrient use efficiency, and better economic returns compared to the control treatments. This means that the soils are deficient in P and K nutrients for optimal soybean production in the three study locations. Although the synergy of P and K produced a higher yield, PFP, and RUE, the yield increase diminished at a point as P and K rates increased and did not translate into better economic returns compared to low doses of P and K application. Adopting the low-treatment inputs will provide environmental stewardship compared to the higher doses of P and K nutrient rates, which were seldom economical. By all indications, phosphorus was the most limiting nutrient at two locations (Donkong and Manga) and potassium at one location (Nyankpala).
By all indications, the study justified the use of nutrient input in soybeans, especially P to enhance grain yield and profitability. However, avoiding broadcast applications and adopting a band placement (precision) with the 4R nutrient principles of right placement, right fertilizer source, right rate, and the right time is key. With the highly weathered interior savanna soils, a split application of high fertilizer doses in low application doses may provide feasible and efficient nutrient use. The study recommends further experiments on different combinations of P and K in different agro-ecologies and soil types for a long-term residual study on rotational crops.
Data availability statement
The original contributions presented in the study are included in the article/Supplementary Material. Further inquiries can be directed to the corresponding author.
Author contributions
GA: Data curation, Formal analysis, Investigation, Methodology, Writing – original draft, Writing – review & editing. DD: Conceptualization, Investigation, Methodology, Project administration, Resources, Supervision, Writing – review & editing. DR: Conceptualization, Funding acquisition, Investigation, Methodology, Project administration, Resources, Supervision, Validation, Writing – review & editing. PA: Investigation, Methodology, Writing – review & editing. YI: Formal analysis, Investigation, Methodology, Writing – review & editing. GM: Investigation, Methodology, Writing – review & editing. TB: Investigation, Methodology, Writing – review & editing. SA: Investigation, Methodology, Writing – review & editing. PG: Funding acquisition, Investigation, Methodology, Project administration, Resources, Supervision, Writing – review & editing.
Funding
The author(s) declare financial support was received for the research, authorship, and/or publication of this article. Funding support was from the USAID, Feed the Future Innovation Lab for Soybean Value Chain Research (Cooperative Agreement no. AID OAA-L-14–00001), USDA National Institute of Food and Agriculture (USDA-NIFA), and Mississippi Agricultural and Forestry Experimental Station (MAFES).
Acknowledgments
The authors gratefully acknowledge the support of the CSIR-Savanna Agricultural Research Institute, Mississippi State University for the collaborative research. The authors are grateful to Waypoint Analytical Inc., Memphis, TN, United States for the soil analysis.
Conflict of interest
The authors declare that the research was conducted in the absence of any commercial or financial relationships that could be construed as a potential conflict of interest.
Publisher’s note
All claims expressed in this article are solely those of the authors and do not necessarily represent those of their affiliated organizations, or those of the publisher, the editors and the reviewers. Any product that may be evaluated in this article, or claim that may be made by its manufacturer, is not guaranteed or endorsed by the publisher.
Supplementary material
The Supplementary Material for this article can be found online at: https://www.frontiersin.org/articles/10.3389/fagro.2024.1391506/full#supplementary-material
References
Abdulai M. S., Denwar N. N., Haruna M. (2006). Combating the menace of Striga hermonthica infestation: An integrated approach adopted in North-Eastern Ghana. J. Agron. 5, 617–620. doi: 10.3923/ja.2006.617.620
Abudulai M., Salifu A. B., Opare-Atakora D., Haruna M., Denwar N. N., Baba I. I. Y. (2012). Yield loss at the different growth stages in soybean due to insect pests in Ghana. Arch. Phytopath. Plant Protect. 45, 1796–1809. doi: 10.1080/03235408.2012.706744
Adjei-Gyapong T., Asiamah R. D. (2002). The Interim Ghana Soil Classification System and Its Relation with the World Reference Base for Soil Resources. FAO, Quatorzième Réunion Du Sous-Comité Ouest Et Centre Africain De Corrélation des Sols, Abomey, Benin, 9–13 Oct 2000. World Soil Res. Report Vol. 98 (Rome: FAO), 51–76.
Adjei-Nsiah S., Kumah J. F., Owusu-Bennoah E., Kanampiu F. (2019). Influence of P sources and rhizobium inoculation on growth and yield of soybean genotypes on Ferric Lixisols of Northern Guinea savanna zone of Ghana. Commun. Soil Sci. Plant Anal. 50 (7), 853–868. doi: 10.1080/00103624.2019.1589489
Adjei-Nsiah S., Martei D., Yakubu A., Ulzen J. (2022). Soybean (Glycine max L. Merrill) responds to phosphorus application and Rhizobium inoculation on Acrisols of the semi-deciduous forest agro-ecological zone of Ghana. PeerJ 10, e12671. doi: 10.7717/peerj.12671
Aidoo R., Mensah J. O., Opoku A., Abaidoo R. C. (2014). Factors influencing soybean production and willingness to pay for inoculum used in Northern Ghana. Am. J. Expt. Agric. 4, 290–301. doi: 10.9734/AJEA/2014/6011
Akakpo D. B., de Boer I. J. M., Adjei-Nsiah S., Duncan A. J., Giller K. E., Oosting S. J. (2020). Evaluating the effects of storage conditions on dry matter loss and nutritional quality of grain legume fodders in West Africa. Anim. Feed Sci. Tech. 262, 114419. doi: 10.1016/j.anifeedsci.2020.114419
Amanullah, Almas L. K. (2009). Partial factor productivity, agronomic efficiency, and economic analyses of maize in wheat-maize cropping system in Pakistan, Annual Meeting, January 31-February 3, 2009, Atlanta, Georgia 46747. South Agric. Econ. Assoc, 26. doi: 10.22004/ag.econ.46747
APNI (2022) Soybean Cropping Guide - 4R Nutrient Management and Best Agronomic Practices, Northern Ghana (African Plant Nutrition Institute (APNI). Available at: https://www.apni.net/2022/07/07/new-release-soybean-cropping-guide-for-northern-Ghana/ (Accessed 02/13/2024).
Awuni G. A., Reynolds D. B., Dodds D., Denwar N. N., Abdulai A. L., Asungre P. A., et al. (2023). Lime, inoculum, and phosphorous input supplementation under rain-fed soybean in Ghana’s northern savannas. Front. Sustain. Food Syst. 7. doi: 10.3389/fsufs.2023.992644
Awuni G. A., Reynolds D. B., Goldsmith P. D., Tamimie C. A., Denwar N. N. (2020). Agronomic and economic assessment of input bundle of soybean in moderately acidic Savanna soils of Ghana. Agrosyst. Geosci. Environ. 3, e20085. doi: 10.1002/agg2.20085
Bationo A., Fening J. O., Kwaw A. (2018). “Assessment of soil fertility status and integrated soil fertility management in Ghana,” in Improving the profitability, sustainability, and efficiency of nutrients through site-specific fertilizer recommendations in West Africa agroecosystems. Eds. Bationo A., Ngaradoum D., Youl S., Lompo F., Fening J. (Springer, Cham). doi: 10.1007/978–3-319–58789-9_7
Brooker A. P., Lindsey L. E., Culman S. W., Subburayalu S. K., Thomison P. R. (2017). Low soil phosphorus and potassium limit soybean grain yield in Ohio. Crop Forage Turfgrass Manage. 3, 1–5. doi: 10.2134/cftm2016.12.0081
Buernor A. B., Kabiru M. R., Bechtaoui N., Jibrin J. M., Asante M., Bouraqqadi A., et al. (2022). Grain legume yield responses to rhizobia inoculants and phosphorus supplementation under Ghana Soils: A Meta-Synthesis. Front. Plant Sci. 13. doi: 10.3389/fpls.2022.877433
Buri M. M., Issaka R. N., Wakatsuki T. (2005). Extent and management of low pH soils in Ghana. Soil Sci. Plant Nutri. 5, 755–759. doi: 10.1111/j.1747-0765.2005.tb00107.x
CILSS (2016) Ecoregions and topography of Ghana. West Africa - Land Use and Land Cover Dynamics. Available at: https://eros.usgs.gov/westafrica/ecoregions-andtopography/ecoregions-and-topography-Ghana (Accessed March 2, 2023).
Dankwa P., Cudjoe E., Amuah E. E. Y., Kazapoe R. W., Agyemang E. P. (2021). Analyzing and forecasting rainfall patterns in the Manga-Bawku area, northeastern Ghana: Possible implication of climate change. Environ. Chall. 5, 100354. doi: 10.1016/j.envc.2021.100354
Dobermann A. (2007). Nutrient use efficiency - measurement and management (Paris, France: Agronomy and Horticulture - Faculty Publications), 1442. Available at: https://digitalcommons.unl.edu/agronomyfacpub/1442.
Fageria N. K., Oliveira J. P. (2014). Nitrogen, phosphorus and potassium interactions in upland rice. J. Plant Nutri. 37, 10, 1586–1600. doi: 10.1080/01904167.2014.920362
Fong C. R., Bittick S. J., Fong P. (2017). Simultaneous synergist, antagonistic and additive interactions between multiple local stressors all degrade algal turf communities on coral reefs. J. Ecol. 106, 1390–1400. doi: 10.1111/1365–2745.12914
Gyogluu C., Jaiswal S. K., Kyei-Boahen S., Dakora F. D. (2018). Identification and distribution of microsymbionts associated with soybean nodulation in Mozambican soils. Syst. Appl. Microbiol. 41, 506–515. doi: 10.1016/j.syapm.2018.05.003
Henao J., Banaante C. (2006). Agricultural production and nutrient mining in Africa: Implications for Resource Conservation and Policy Development. African Fertilizer Summit, 9–13 June 2006 (Abuja, Nigeria: IFDC).
Houssou N., Andam K., Asante-Addo C. (2017) Can better targeting improve the effectiveness of Ghana’s fertilizer subsidy program? Lessons from Ghana and other countries in Africa south of the Sahara (International Food Policy Research). Available at: https://ssm.com/abstract=2926075 (Accessed March 5, 2023).
Imas P., Magen H. (2008) Role of Potassium Nutrition in Balanced Fertilization for Soybean Yield and Quality - Global Perspective (Switzerland: International Potash Institute). Available at: https://www.ipipotash.org/udocs/264-Part-1.pdf (Accessed February 15, 2024).
IUSS Working Group WRB (2015). World Reference Base for Soil Resources 2014, Update 2015. International Soil Classification System for Naming Soils and Creating Legends for Soil Maps. World Soil Resources Reports No. 106 (Rome: FAO).
Khan F., Siddique A. B., Shabala S., Zhou M., Zhao C. (2023). Phosphorus plays key roles in regulating plants’ physiological responses to abiotic stresses. Plants 12, 2861. doi: 10.3390/plants12152861
Kumar S., Diksha, Sindhu S. S., Kumar R. (2021). Biofertilizers: an eco-friendly technology for nutrient recycling and environmental sustainability. Curr. Res. Microb. Sci. 3, 1–26. doi: 10.1016/j.crmicr.2021.100094
Kyei-Boahen S., Savala C. E. N., Muananamuale C. P., Malita C., Wiredu A. N., Chibeba A. M., et al. (2023). Symbiotic effectiveness of Bradyrhizobium strains on soybean growth and productivity in Northern Mozambique. Front. Sustain. Food Syst. 6. doi: 10.3389/fsufs.2022.1084745
Lamaoui M., Jemo M., Datla R., Bekkaoui F. (2018). Heat and drought stresses in crops and approaches for their mitigation. Front. Chem. 6. doi: 10.3389/fchem.2018.00026
Matey D., Alidu S. M. (2023). Evaluation of elite soybean (Glycine max L.) genotypes for nitrogen nutrition, water use efficiency, and grain yield in the Guinea Savanna agro-ecological zone of northern Ghana. J. Plant Breed. Crop Sci. 15, 1–13. doi: 10.5897/JPBCS2022.1003
Mehlich A. (1984). Mehlich 3 soil test extractant: A modification of mehlich 2 extractant. Commun. Soil Sci. Plant Anal. 15, 277–294. doi: 10.1080/00103628409367568
MoFA-SRID (2019). Agriculture in Ghana: Facts and Figures (Accra: Ministry of Food and Agriculture, Statistics, Research, and Information Directorate (SRID).
Moore K. J., Dixon P. M. (2014). Analysis of combined experiments Revisited. Agron. J. 107, 763–771. doi: 10.2134/agronj13.0485
Mungai L. M., Snapp S., Messina J. P., Chikowo R., Smith A., Anders E., et al. (2016). Smallholder farms and the potential for sustainable intensification. Front. Plant Sci. 7. doi: 10.3389/fpls.2016.01720
Munthali M., Nlivata P., Makumba W., Mbewe E., Manase H., Oduor G., et al. (2017). Optimizing nutrient use efficiency and returns from soybean production under smallholders in three agroecologies of Malawi. Agric. Sci. 8, 801–815. doi: 10.4236/as.2017.88059
Neenu S., Ramesh K., Somasundaram J., Ramana S. (2020). Varietal influence on phosphorus uptake and use efficiency in soybean at varying phosphorus regimes in vertisols of Central India. Int. J. Curr. Microbiol. App. Sci. 9, 2743–2753. doi: 10.20546/ijcmas.2020.906.333
Ntiamoah E. B., Li D., Appiah-Otoo I., Twumasi M. A., Yaboah E. N. (2022). Towards a sustainable food production: modeling the impacts of climate change on maize and soybean production in Ghana. Environ. Sci. pollut. Res. Int. 29, 72777–72796. doi: 10.1007/s11356-022-20962-z
Ocran V. K., Delimini L. L., Asubuoah R. A., Asiedu E. A. (1998). Seed Management Manual for Ghana (Accra, Ghana: Ministry of Food and Agriculture).
Ritchie H., Roser M., Rosado P. (2023) Crop yields (OurWorldInData.org). Available at: https://ourworldindata.org/crop-yields (Accessed March 1, 2023).
Rockström J., Barron J., Fox P. (2003). “Water productivity in rain-fed agriculture: Challenges and opportunities for smallholder farmers in drought-prone tropical agroecosystems,” in Water Productivity in Agriculture: Limits and Opportunities for Improvement. Eds. Kijne J. W., Barker R., Molden D. (CABI, Wallingford), 145162. doi: 10.1079/9780851996691.0145
Roy R. N., Finck A., Blair G. J., Tandon H. L. S. (2006). Plant nutrition for food security: A guide for integrated nutrient management. FAO Fertilizer and Plant Nutrition Bulletin 16 (Rome: FAO).
SAS Institute (2016) SAS User’s Guide: Statistics (version 9.4) (Cary, NC: SAS Institute, Inc.). Available at: https://sas.com/en_my/software/sas9 (Accessed April 2, 2023).
Sasu D. D. (2023) Annual average exchange rate of U.S. dollar in Ghanaian cedi (GHS) from 2016 to 2022. Available at: https://www.statista.com/statistics/1292002/usd-to-Ghanaian-cedi-annual-average-exchange-rate/ (Accessed Feb 27, 2023).
Saxton A. (1998). “A macro for converting mean separation output to letter groupings in Proc Mixed,” in Proceedings of the 23rd SAS Users Group International (SAS Institute, Cary, NC), 1243–1246.
Sedibe M. M., Mofokeng A. M., Masvodza D. R. (2023). Soybean production, constraints, and future prospects in poorer countries: A Review. In: Hasanuzzaman M., (Ed.), Production and utilization of legumes-progress and prospects. InTech Open Access Publishers, p. 192. doi: 10.5772/intechopen.109516
Serno G., Weg van der R. F. (1985). A preliminary assessment of the (available) existing soil information of Nyankpala Agricultural Experiment Station (Tamale, Northern Ghana) (Wageningen, the Netherlands: Soil Survey Institute).
Sharma A., Sankar G. R. M., Arora S., Gupta V., Singh B., Kumar J., et al. (2013). Analyzing rainfall effects for sustainable rainfed maize productivity in foothills of Northwest Himalayas. Field Crops Res. 145, 96–105. doi: 10.1016/j.fcr.2013.02.013
Sinclair T. R., Marrou H., Soltani A., Vadez V., Chandolu K. C. (2014). Soybean production potential in Africa. Global Food Sec. 3, 31–40. doi: 10.1016/j.gfs.2013.12.001
Slaton M., Steinke K. (2021) Phosphorus and potassium fertilizer recommendations for high-yielding, profitable soybeans. Available at: https://www.canr.msu.edu/news/phosphorus_and_potassium_fertilizer_recommendations_for_high_yielding_profi#:~:text=The%20phosphorus%20soil%20test%20levels,test%20levels%20in%20this%20range (Accessed 02/22/2024).
Stoop W. A., Lanting H., Ramaiah K. V. (1983)Occurrence of Striga and its possible control in cropping systems in northern Ghana. In: Striga: Proceedings of the Second International Workshop on Striga, 5–8 Oct 1981, IDRC/ICRISAT, Ouagadougou, Upper Volta. Inter. Crops Res. Inst Semi-Arid Tropics (ICRISAT). Patancheru, A. P (India: ICRISAT). Available online at: https://pdf.usaid.gov/pdf_docs/PNAAP982.pdf (Accessed April 2, 2023).
Tefera H. (2011). “Breeding for promiscuous soybeans at IITA,” in Soybean - Molecular Aspects of Breeding. Ed. Sudaric A. (Rijeka, Croatia: INTECH Open Access Publisher). doi: 10.5772/14533
Tetteh F., Larbi A., Nketia K. A., Senayah J. K., Hoeschle-Zeledon I., Abdulrahman N. (2016) Suitability of soils for cereal cropping in Northern Ghana (Ibadan, Nigeria: IITA). Available at: https://cgspace.cgiar.org/handle/10568/96198 (Accessed April 1, 2023).
Turner N. C. (2004). Agronomic options for improving rainfall-use efficiency of crops in dryland farming systems. J. Expt. Bot. 55, 2413–2425. doi: 10.1093/jxb/erh154
Valdes C., Gillespie J., Dohlman E. (2023). Soybean production, marketing costs, and export competitiveness in Brazil and the United States (Report No. EIB-262) (Washington, D.C., United States: U.S. Department of Agriculture, Economic Research Service (USDA-ERS). doi: 10.32747/2023.8142532.ers
Vanlauwe B., Kihara J., Chivenge P., Pypers P., Coe R., Si J. (2011). Agronomic use efficiency of N fertilizer in maize-based systems in sub-Saharan Africa within the context of integrated soil fertility management. Plant Soil 339, 35–50. doi: 10.1007/s11104-010-0462-7
Vogel J. T., Liu W., Olhoft P., Crafts-Brandner S. J., Pennycooke J. C., Christiansen N. (2021). Soybean yield formation physiology – A foundation for precision breeding based improvement. Front. Plant Sci. 12. doi: 10.3389/fpls.2021.719706
World Bank (2017) Ghana Agriculture Sector Policy Note: Transforming Agriculture for Economic Growth, Job Creation, and Food Security (Washington, DC: World Bank). Available at: http://hdl.handle.net/10986/28394 (Accessed February 21, 2023).
Keywords: soybean yield, partial factor productivity, rain use efficiency, nutrient use efficiency, value cost ratio
Citation: Awuni GA, Dodds DM, Reynolds DB, Asungre PA, Yahaya I, Mahama GY, Bella T, Abongo S and Goldsmith PD (2024) Soybean yield, nutrient use efficiency, and economic returns of phosphorus and potassium in Ghana’s interior savanna. Front. Agron. 6:1391506. doi: 10.3389/fagro.2024.1391506
Received: 26 February 2024; Accepted: 24 May 2024;
Published: 27 June 2024.
Edited by:
Hanuman Singh Jatav, Sri Karan Narendra Agriculture University, IndiaReviewed by:
Ioannis Roussis, Agricultural University of Athens, GreeceAnamika Nepali, Banaras Hindu University, India
Copyright © 2024 Awuni, Dodds, Reynolds, Asungre, Yahaya, Mahama, Bella, Abongo and Goldsmith. This is an open-access article distributed under the terms of the Creative Commons Attribution License (CC BY). The use, distribution or reproduction in other forums is permitted, provided the original author(s) and the copyright owner(s) are credited and that the original publication in this journal is cited, in accordance with accepted academic practice. No use, distribution or reproduction is permitted which does not comply with these terms.
*Correspondence: George A. Awuni, Z2F3dW5pQHBzcy5tc3N0YXRlLmVkdQ==
 George A. Awuni
 Darrin M. Dodds
 Daniel B. Reynolds1,2
 Peter A. Asungre
 Iddrisu Yahaya