- 1Sustainable Natural Resources Management Section, International Center for Biosaline Agriculture (ICBA), Dubai, United Arab Emirates
- 2Division of Dryland Agriculture, Arid Land Research Center, Tottori University, Tottori, Japan
- 3Department of Environmental Science, Graduate School of Agriculture, Saga University, Saga, Japan
- 4Department of Agricultural, Life and Environmental Sciences, Faculty of Agriculture, Tottori University, Tottori, Japan
Numerical models of crop response to irrigation and weather forecasts with internet access should be fully utilized in modern irrigation management. In this respect, we developed a new numerical scheme to optimize irrigation depth that maximizes net income over each irrigation interval. The scheme applies volumetric water prices to inspire farmers to save water, and it provides growers with real-time estimates of irrigation depth and net income over the growing season. To evaluate this scheme, we carried out a field experiment for groundnut (Arachis hypogaea L.) grown in a sandy field of the Arid Land Research Center (ALRC), Tottori University, Japan. Two treatments were established to compare the net income of the proposed scheme with that of an automated irrigation system. Results showed that although the proposed scheme gave a larger amount of seasonal irrigation water 28%, it achieved 2.18 times of net income owing to 51% higher yield compared to results of the automated irrigation system. The accuracy of rainfall forecast had little effect on the scheme outputs, where the root mean square error (RMSE) between observed and forecasted rainfall was 4.63 mm. By utilizing numerical simulation information of the soil–plant–atmosphere system into the proposed scheme, it would be a more cost-effective tool for optimizing irrigation depths than automated irrigation systems.
1 Introduction
Irrigation is a vital factor for agriculture in both arid and semi-arid regions. Even in the humid and sub-humid regions, it is essential for rain-fed crops during drought periods when rainfall fails to provide sufficient moisture for stabilized crop production (Debaeke and Aboudrare, 2004). Approximately 70% of global water resources are used for irrigation (WWAP (World Water Assessment Programme), 2012). By 2050, the global population is forecasted to reach 9 billion (United Nations, 2012); therefore, the world needs to produce at least 50% more food (World Bank, 2017). This makes irrigation a significant issue in future decades to meet the global demand for food, especially in nations with scarce water resources.
To manage irrigation more efficiently, both frequency and amount of watering must be properly determined. Farmers may schedule irrigation water more efficiently by using computer simulation models and innovative electronics technology. Mbabazi et al. (2017) used an average of the previous 5-day crop evapotranspiration to develop an irrigation scheduling using smart irrigation avocado app. Yet, irrigation scheduling is more efficiently accomplished in terms of enhancing water use efficiency if advanced technologies of soil water sensors are used (Schattman et al., 2023). Consequently, automated irrigation systems with sensors can be used to meet crop water needs more precisely (Cancela et al., 2015; Osroosh et al., 2015). Liang et al. (2016) used data of soil water tension from wireless soil moisture sensors and the van Genuchten model (Van Genuchten, 1980) to schedule irrigation water. Stirzaker et al. (2017) used electronic detectors to detect the wetting front of infiltrated irrigation water through the soil profile to close a solenoid valve at a certain value to manage irrigation water. Those technologies, however, require high initial investment; therefore, the development of low-cost technology will motivate farmers to save irrigation water. For example, numerical simulation of water flow and crop growth can be utilized as a substitute for sensing drought stress.
Linking weather forecasts with irrigation scheduling may improve irrigation water management since the availability of quantitative weather forecasts of acceptable accuracy with internet access. Lorite et al. (2015) used free accessible online weather forecasts to determine irrigation scheduling based on daily and weekly reference evapotranspiration. Delgoda et al. (2015) validated their framework, which aimed to minimize both irrigation depth and soil moisture deficit under limited water conditions using weather forecasts and AquaCrop model (Steduto et al., 2009). Integration of weather forecasts and a multi-objective function was used to determine the optimal yield–irrigation combinations (Linker and Sylaios, 2016), which was based on the total yield and irrigation at the end of season. Wang and Cai (2009) used a genetic algorithm (GA) to schedule irrigation water assuming perfect weather forecasts for either non-overlapping 2 weeks or the entire growing season.
Irrigation scheduling is generally targeted to improve water use efficiency; however, it is worth considering net income as well. Concerning the economic benefits in relation to irrigation water, Yang et al. (2017) used four multiple objective functions to maximize the economic benefits per unit cubic meter of irrigation water supply. Those functions, however, were based on uncertain data of crop evapotranspiration, which would be a major constraint of that model. Moreover, Wang and Cai (2009) developed an optimization framework combined the SWAP model (van Dam et al., 1997) and the GA to search for both irrigation dates and depths that maximize entirely season profits.
It is worth setting a price on water to motivate farmers to save irrigation water (Bozorg-Haddad et al., 2016). This can be made even more effective by incorporating quantitative weather forecasts. Accordingly, Wang and Cai (2009) and Jamal et al. (2019) determined daily irrigation depth by combining seasonal weather forecasts with volumetric water pricing, with an objective to maximize seasonal net income. This may result in significant inaccuracies if predicted decisions do not match those acquired with actual weather. To mitigate uncertainty of weather forecasts and real-time net profit over irrigation interval, Fujimaki et al. (2014) developed an optimization scheme to determine irrigation depths that maximize net income at each irrigation interval considering the volumetric water pricing and short-term weather forecasts. This scheme was incorporated into a two-dimensional model of water, solute, and heat movement in soils (WASH_2D, Fujimaki et al. (2014)). They evaluated their scheme by carrying out two preliminary field experiments at two different locations under various weather, soil, and crop conditions. However, results of those experiments were not sufficient to validate such a scheme. Therefore, several studies have been conducted to validate the proposed scheme using the preliminary results of earlier experiments, including the data provided in this study. These results could aid in enhancing the accuracy of the proposed optimized scheme. For example, the two functions describing the dynamic development of basal crop coefficient and normalized root length density distribution in terms of cumulative transpiration were modified, which could enhance the performance of the proposed scheme (Abd El Baki et al., 2020). The scheme also showed a good performance in terms of water savings and boosting farmers' net income when employed or compared with other methods such as sensor-based irrigation (Abd El Baki and Fujimaki, 2021) and both refilling (returning soil moisture content to field capacity) and simplified versions of the proposed scheme (Abd El Baki et al., 2023). Further advantages of the optimized scheme in terms of supplemental irrigation management and N uptake efficiency were reported by Abd El Baki et al. (2018) and Liang et al. (2022). All of these reviewed studies regarding the optimized scheme in addition to other research studies (Fujimaki et al., 2020, 2022) were performed using the WASH 2D model. The proposed scheme, which aims to determine the irrigation depth that maximizes net income of each irrigation interval, was developed for smallholder farmers, but it can potentially be applied on a larger scale if it is coupled with smart solenoid valves equipped with a wireless communication system. By acquiring cumulative transpiration, which is predicted by numerical modeling utilizing crop characteristics and weather forecast information, farmers may maximize their net income at each irrigation event. Further research with various crops and weather circumstances is needed to validate the scheme. This paper, however, is one of the initial steps to improve the performance of the scheme. Therefore, the major objective was to evaluate the feasibility of the optimization scheme to determine irrigation depth that maximizes net income using a major crop, groundnut. The specific goal was to replace capital-intensive automated irrigation methods with a low-cost scheme based on freely available weather data and numerical simulation.
2 Materials and methods
2.1 The process model
Unlike the commercial software, we employed a two-dimensional physically based model, WASH_2D, which is freely available on the website of the ALRC, Tottori University. This software simulates water, solute, and heat movement in soils with the finite difference method. It includes a module for simulating root water uptake and crop growth. Further details about the model were given by Fujimaki et al. (2014).
2.2 Numerical scheme
2.2.1 Maximization of net income
Net income, ($ ha−1), was calculated in proportion to the increment in dry matter attained during the irrigation interval as follows:
where is the producer's price of crop ($ kg−1 DM); is transpiration efficiency of the crop [produced dry matter (kg ha−1) divided by cumulative transpiration (kg ha−1)], is cumulative transpiration rate during each irrigation interval, i (kg ha−1); is the income correction factor, which was considered to avoid possible underestimation for the contribution of initial transpiration to the entire quantum of growth as transpiration in the initial growth stage is smaller than that in later stages (Abd El Baki et al., 2023); is the price of water ($ kg−1); W is the irrigation depth (mm, where 1 mm equals 10,000 kg ha−1); and is other costs ($ ha−1).
In order to maximize the at each irrigation interval, we used the optimization problem presented in Equation 2:
Subject to
where is weather forecasts, is actual weather conditions, is crop properties, and is upper boundary of irrigation depth. The was calculated by the sum of the transpiration rate, (cm h−1), over time, which was calculated by integrating the water uptake rate, S, over the root zone:
where j is the start hour of an irrigation interval, k is total hours of an irrigation interval, and and are width and depth of root zone. A macroscopic root water uptake model (Feddes and Raats, 2014) was used to predict the water uptake rate, S (cm h─1):
where Tp, , and are the potential transpiration (cm h─1), Feddes reduction factor, and active root length density, respectively. The Tp was computed using the approach proposed by Allen et al. (1998) as follows:
where is reference evapotranspiration (cm h─1), calculated by the Penman–Monteith (PM) equation (Allen et al., 1998), and is the basal crop coefficient, which was expressed as a function of transpiration as it is largely affected by growth stage (Equation 5):
where , , and are fitting parameters. This function was updated in a recent publication (Abd El Baki et al., 2023) to consider the decline of in the late growth stage. The estimated value of those parameters depends on each growth stage of the plant. Fujimaki et al. (2014) suggested their values by measuring cumulative transpiration rate via a weighing lysimeter. The was described by the additive function as follows:
where ψ and ψo are the matric and osmotic heads, respectively, and ψ50, ψo50, and p are adjusting coefficient (van Genuchten, 1987). The β was described as follows:
where is an adjusting coefficient; and mrt are the depth and width of the root zone (cm), respectively; x is the horizontal distance; z is the soil depth; and is the depth below which roots exist (cm). In general, the roots of cultivated plants start from approximately 2.5 cm below the soil surface; therefore, we have added a new parameter to make the model more realistic. The was also expressed as a function of transpiration as follows:
where , , and are fitting parameters. By expressing both and drt as functions of cumulative transpiration as independent variables instead of days after sowing, WASH_2D may express plant growth more dynamically responding to drought or salinity stresses.
2.2.2 Estimation of optimal irrigation depths
To minimize repetition of numerical prediction in non-linear optimization, we used the following scheme proposed by Fujimaki et al. (2014). First, it is assumed that the cumulative transpiration rate at each irrigation interval may be empirically described as:
where and are fitting parameters and is at W = 0. Note that even when W equals to zero, the plant can still uptake remaining available water from the soil. Second, the W is determined at the maximum when the slope of the line tangent of Equation 1 becomes zero. This can be attained by substituting Equation 10 into Equation 1 and determining the first derivative with respect to W as:
By rearranging Equation 11, the optimal W is calculated as:
Since W corresponds to a stationary positive point () where the function (Equation 1) is neither increasing nor decreasing, and the slope on the left side of is positive [] and negative on the right side [], the stationary point is considered as a maximum. In order to confirm whether is a maximum, the second derivative is given as:
This indicates that the curve describing the relation between and W is concave down, and thus, represents the maximum value. The hard constraints value of and must be determined by defining the minimum, intermediate, and maximum points of the decision variables (, ), (, ), and (, ), respectively. The point (, ) is known as (0, ), whereas the other two points (, ) and (, ) are defined using Equation 10 as:
By subtracting Equations 13a, 13b, the can be estimated as:
Then, the value of can be easily searched using the bisection numerical method.
The user has to input the value of , which is suggested to be equal to the average value of the sum of potential transpiration and reference ET over an irrigation interval. Finally, by predicting τ using numerical simulation at three irrigation depths, zero, the upper limit, and an intermediate value, we can determine an optimal value of irrigation depth that maximizes the net income.
2.3 Optimization procedure
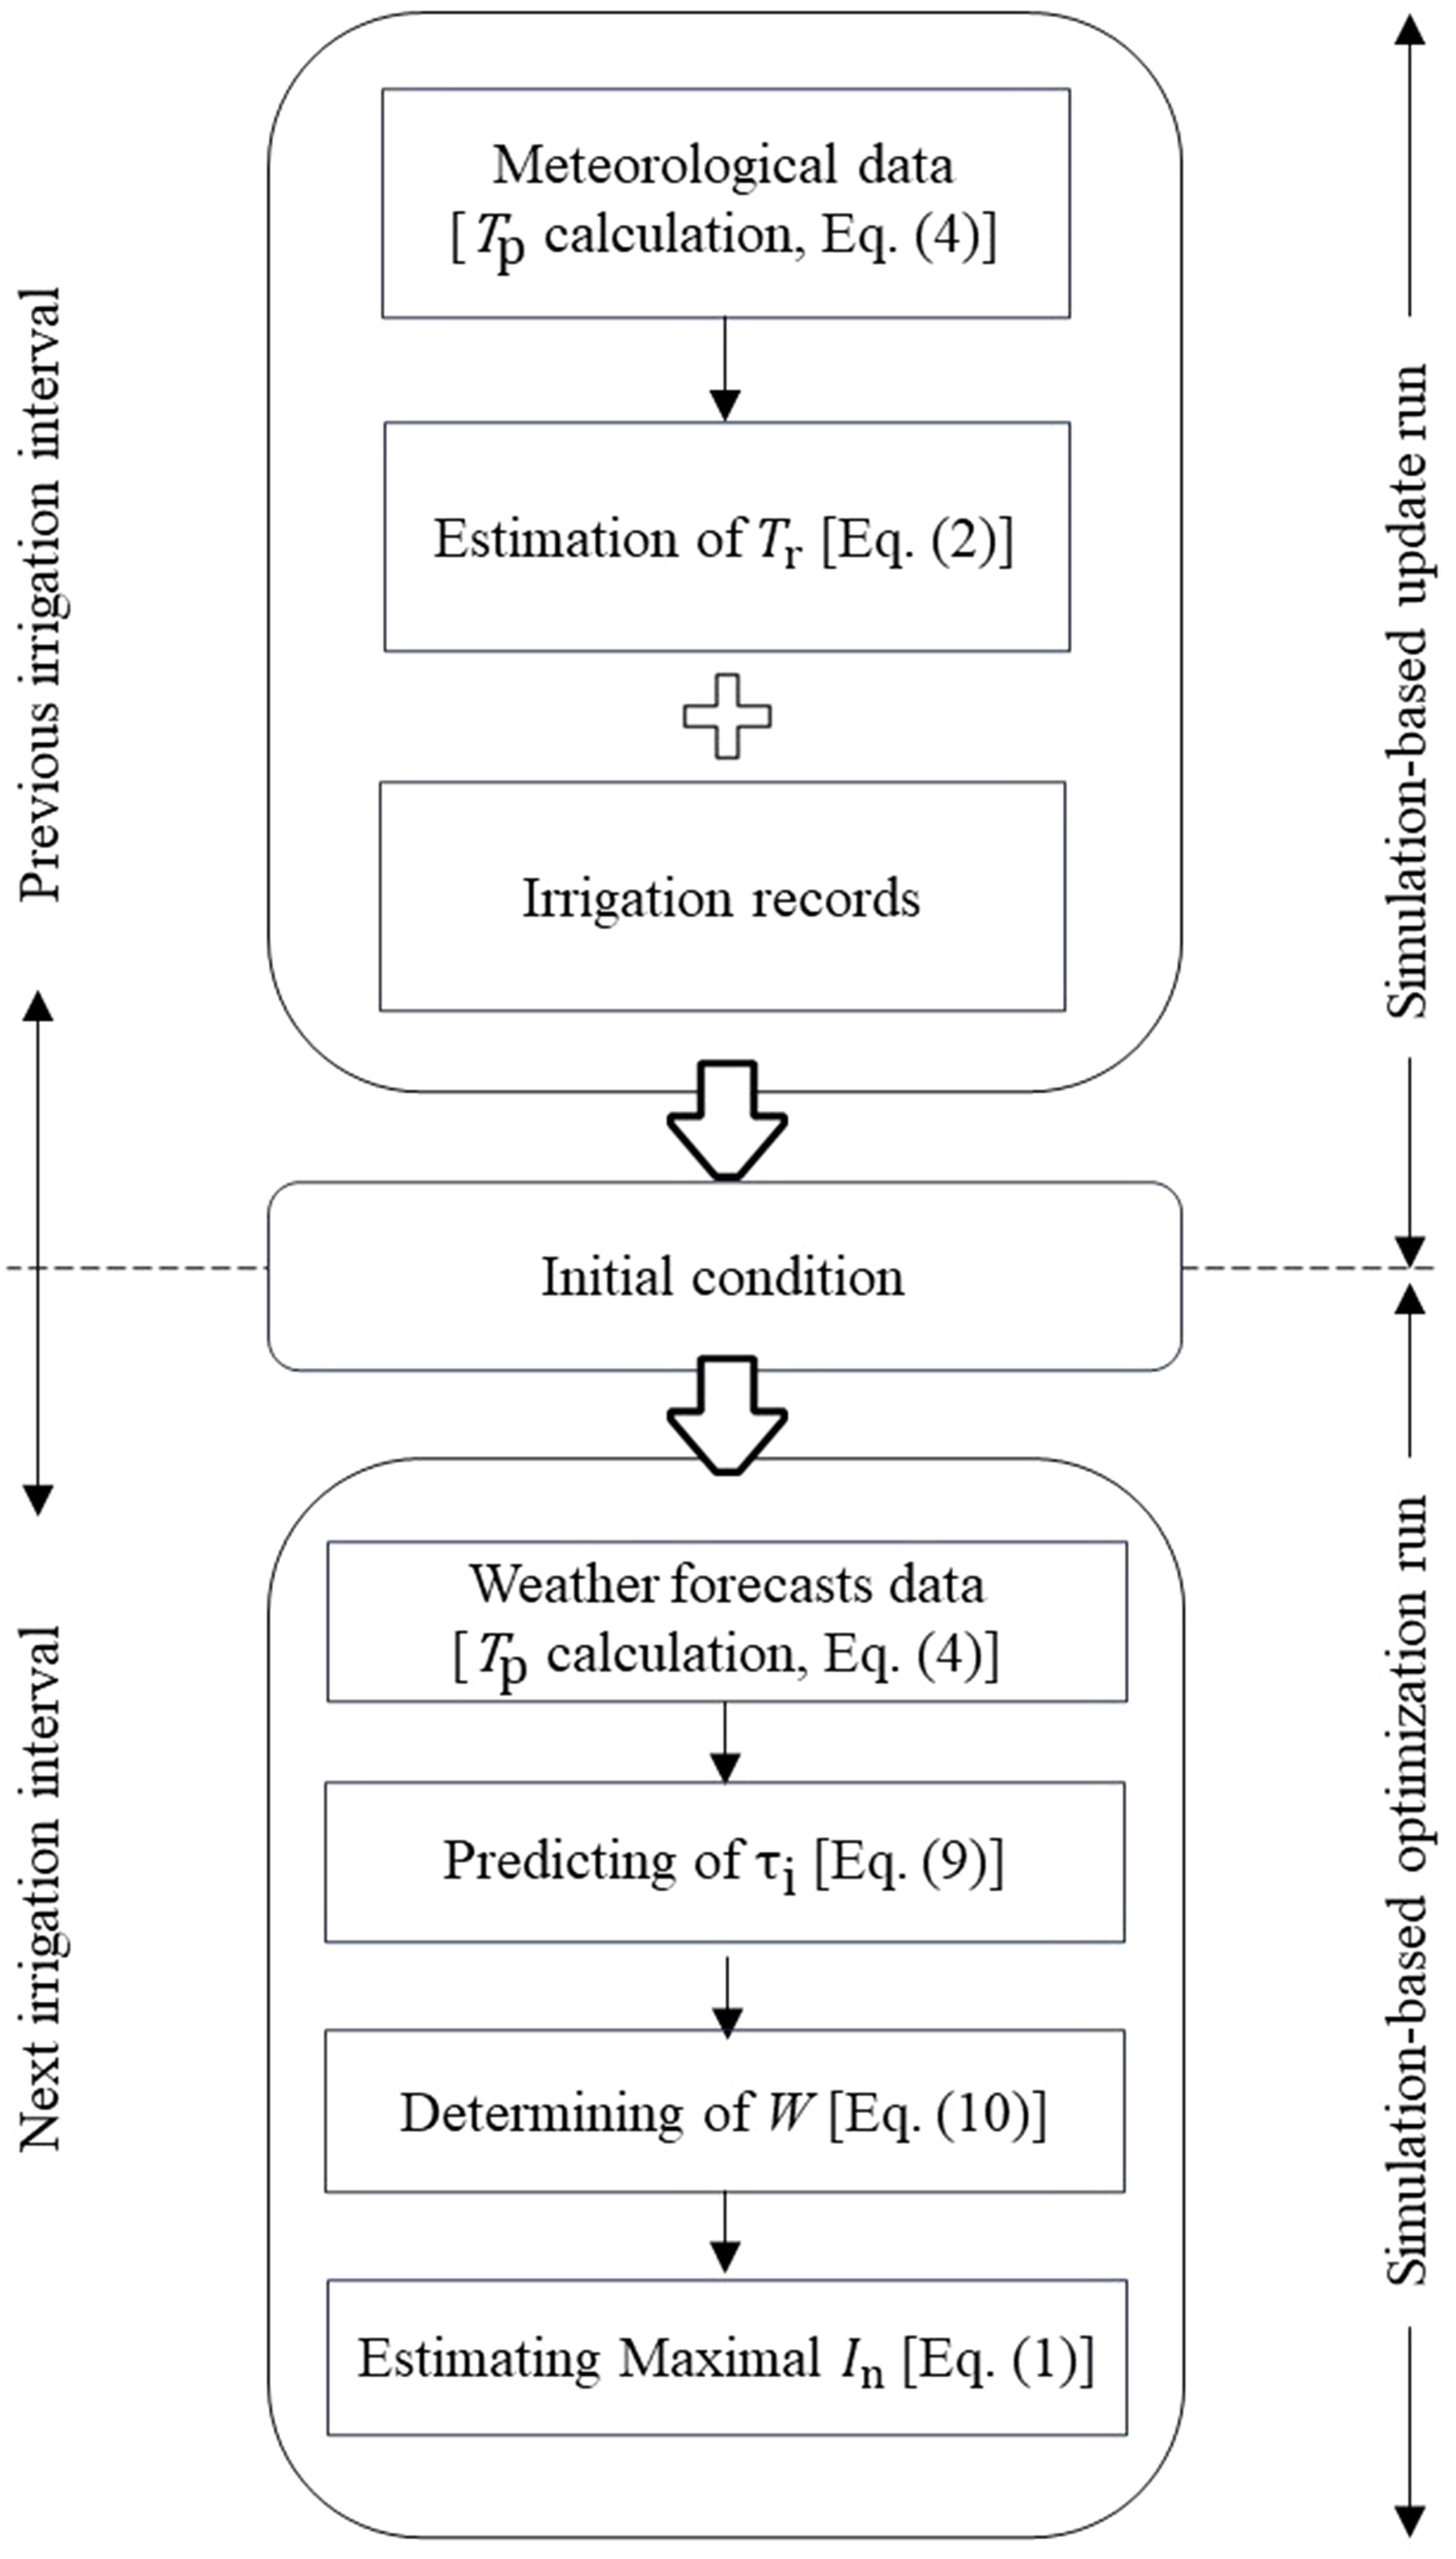
The optimization procedure (Figure 1) consists of two major steps: Step 1, update run, which was done in the early morning of each irrigation day. It uses records of irrigation, weather, and cumulative transpiration since the last irrigation day to estimate the initial condition of soil moisture status. Then, Step 2, optimization run, is implemented, which was carried out using results of update run and weather forecast data retrieved from the website of Yahoo! Japan (https://weather.yahoo.co.jp/weather/jp/31/6910/31302.html Abd El Baki et al., 2023; accessed on 2 September 2017) to determine W for the next irrigation interval. Meteorological data including solar radiation, air temperature, relative humidity, wind speed, and rainfall were collected from a weather station approximately 20 m away from the experimental field as presented in Figure 2. This website provides all required parameters except solar radiation but provides categorical estimates of cloud cover. Therefore, we used an empirical relationship between cloud cover and the ratio of extraterrestrial radiation to solar radiation. The estimated values of solar radiation in terms of the three classes of cloud cover were "clear" = 0.82, "cloudy" = 0.63, and "rain" = 0.32.
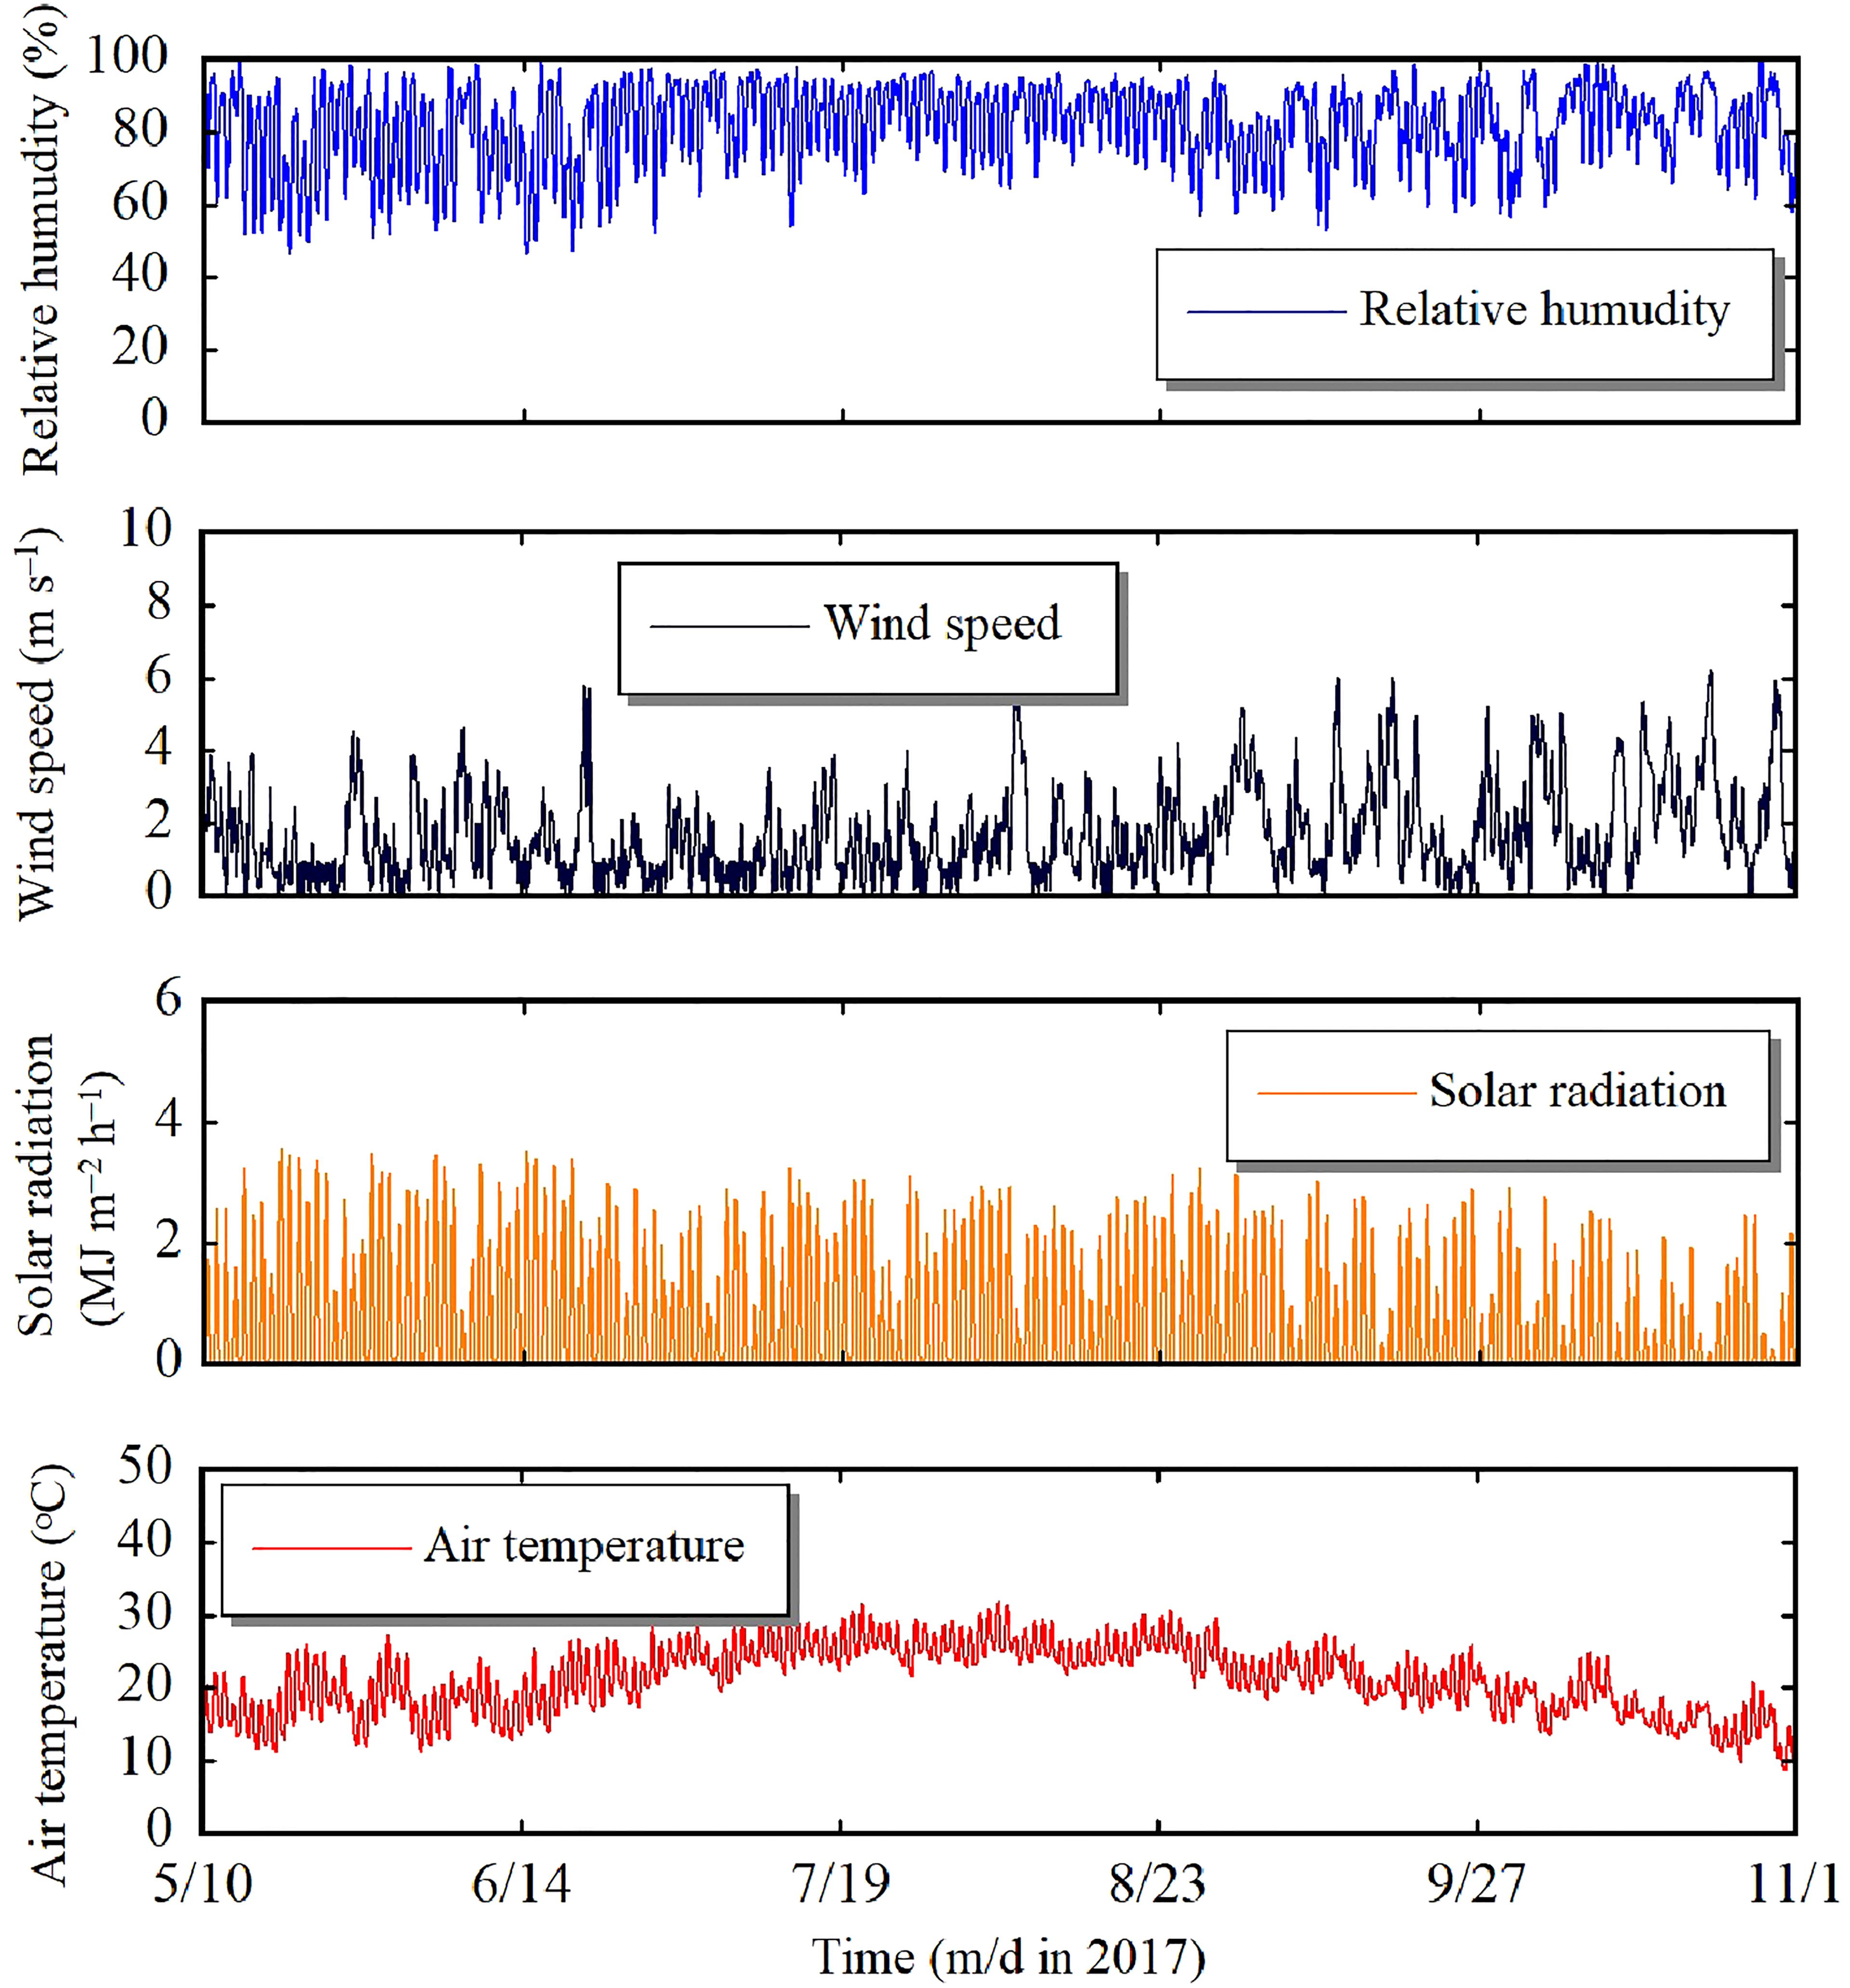
Figure 2. The observed meteorological data via a weather station installed at the field during the growing season.
2.4 Field experiment
A field experiment was carried out in a sandy field of the ALRC, Tottori, Japan in 2017 (latitude, 35° 32′ 8.88″ N and longitude, 134° 12′ 40.3194″ E). Two treatments were established: (1) treatment A, an automated irrigation system based on a threshold value of soil water potential of 45 cm, and (2) treatment S, the proposed scheme. Each treatment had two plots as replicates. Each plot was 10 m long and 16 m wide.
The soil texture was sand, and its hydraulic properties are shown in Figure 3. In treatment A, three tensiometers were installed at the depth of 10 cm below three plants to automatically manage irrigation. In treatment S, the determined W through the numerical simulation was applied manually. In order to check the feasibility of the model in simulating volumetric water content (VWC), two replicates consisting of six TDR probes (TDR-SK10, Sankeirika Inc., Tokyo, Japan) were connected to a time domain reflectometry system (TDR 100 by Campbell Scientific, Ltd., Logan, UT 84321-1784, USA). Each replicate was inserted in six observation points [(5, 0), (15, 0), (45, 0), (5, 15), (5, 45), and (15, 15)] represented in (z, x) format, where z and x refer to soil depth and distance away drip tube, respectively.
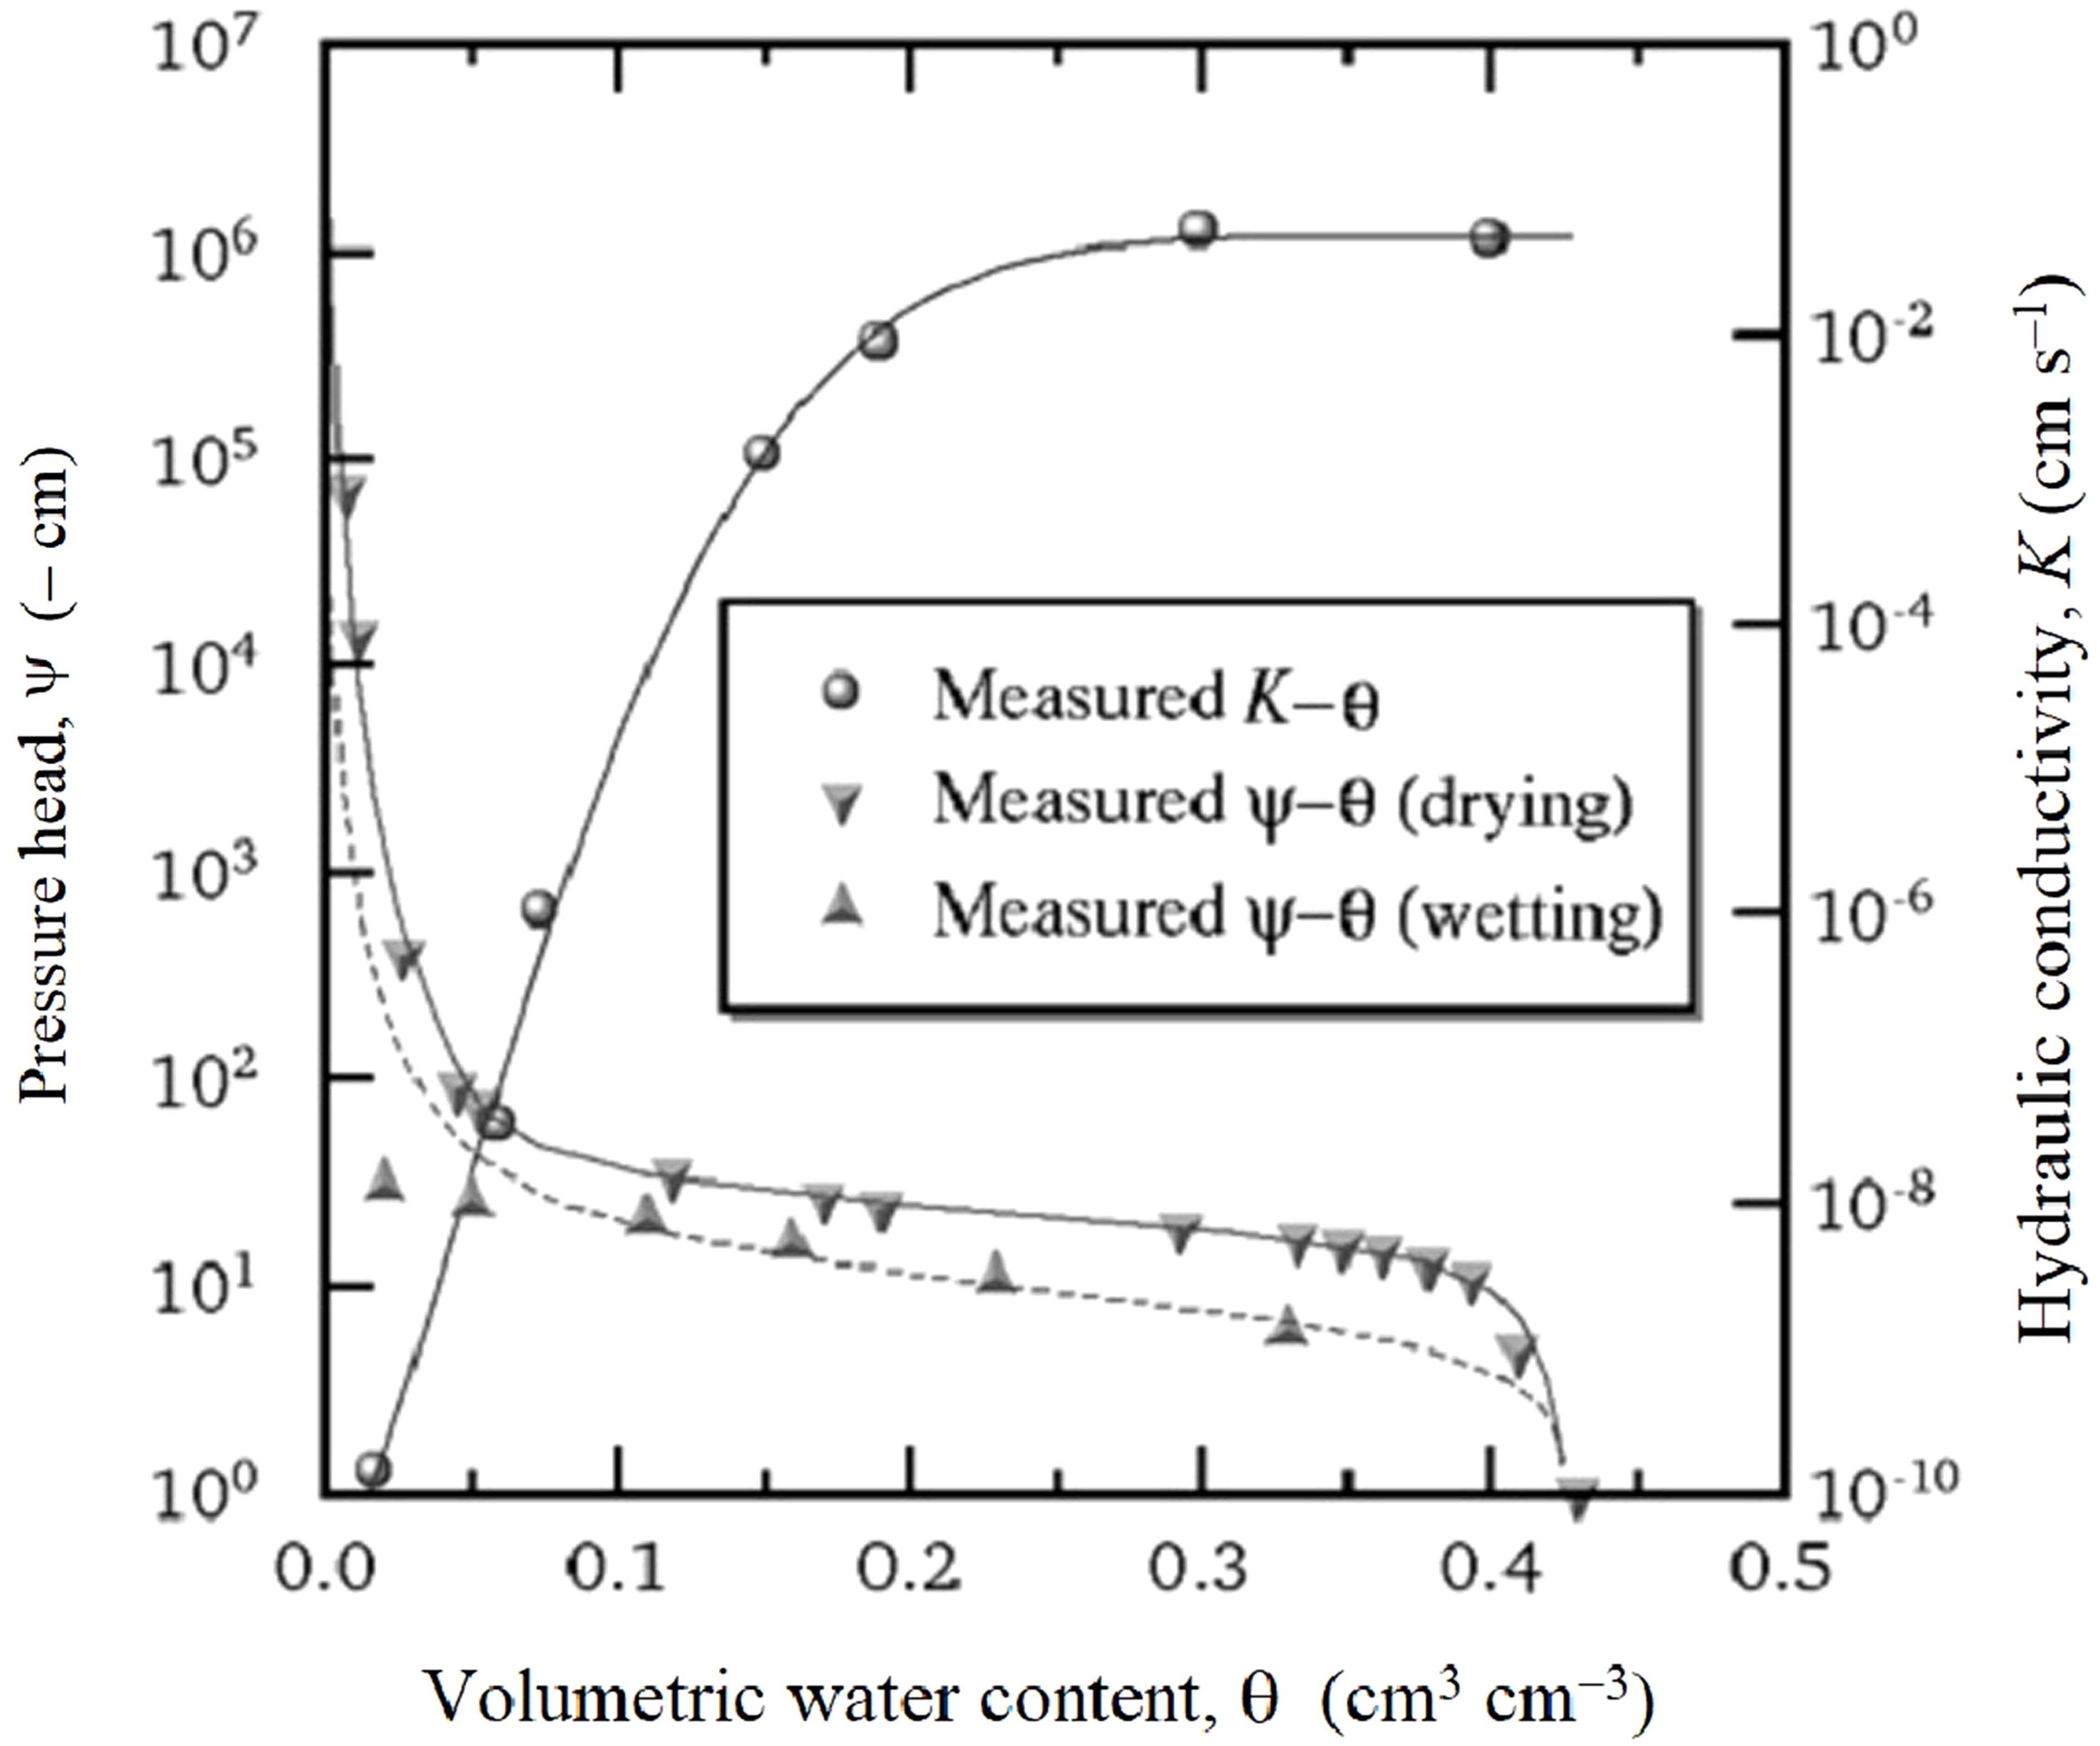
Figure 3. The soil hydraulic properties of a sandy soil, Tottori, Japan (Fujimaki et al., 2014).
Irrigation was applied through a drip irrigation system with emitters spaced at 20 cm along laterals spaced at 90 cm. The discharge rate of emitters was 1 L h─1, and corresponding irrigation intensity was 5.55 mm h−1. The distribution uniformity (DU) test was performed by selecting a group of emitters randomly. DU was calculated by dividing the average collected water volumes of the lowest quartile by the overall average, which was approximately 90%. In treatment A, W was applied for an hour when the average suction of three tensiometers exceeded −45 cm. This value was set in respect to the value of reported in Table 1. The value of W was determined at constant intervals of 2 days in treatment S. We set the value of both transpiration efficiency and water price as 0.004 according to Ratnakumar et al. (2009) and 0.0003 ($ kg−1) according to Cornish et al. (2004), respectively. A constant daily rate of liquid fertilizer (N = 12%, P2O5 = 5%, and K2O = 7%) and calcium chloride were supplied with irrigation for the entire growing season in which the total injected amounts were 8.56 g m−2 and 12.96 g m−2, respectively. When there was no irrigation owing to a rain forecast, the fertilizer amount was calculated as the number of off days multiplied by a fixed daily rate. Groundnut (Arachis hypogaea L.) was selected as an important legume crop cultivated globally as a source of protein and edible oil. It was planted in rows (laterals) at 20 cm spacing on 9 May. We independently determined parameter values of the stress response function for groundnut as listed in Table 1 using method described by Yanagawa and Fujimaki (2013).
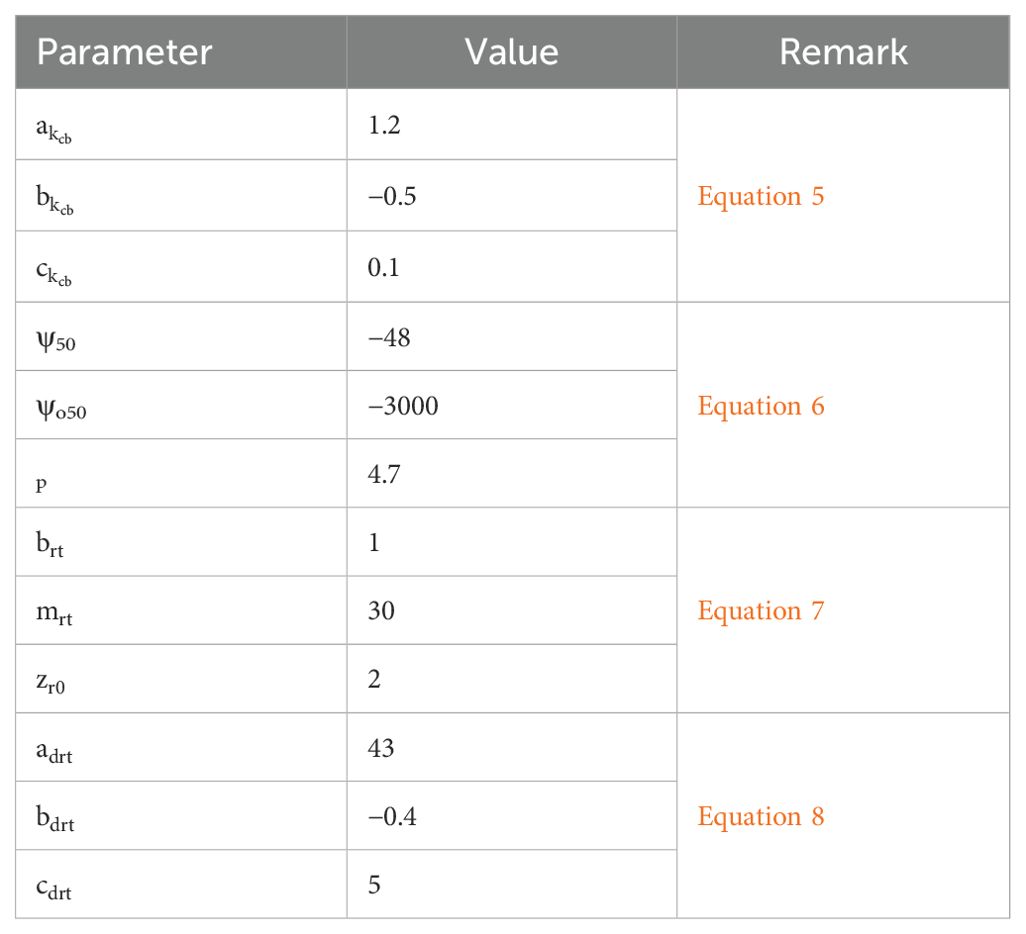
Table 1. Representative coefficient values of the crop growth module used to simulate cumulative transpiration rate.
Parameter values of the crop coefficients were updated four times throughout the growing season such that simulated evapotranspiration matched the measured values (Figure 4). Leaf area index (LAI) was calculated as the ratio of sampled leaf area to harvested ground area. Vegetative biomass was measured by separating leaves and stems of plant samples and then oven-dried at 70°C until constant weight. The seasonal income was calculated by setting the price of seed crop at 5 $ kg−1 based on average marketable prices in Japan in 2017. Irrigation application was stopped on 5 September and the crop was harvested on October 31.
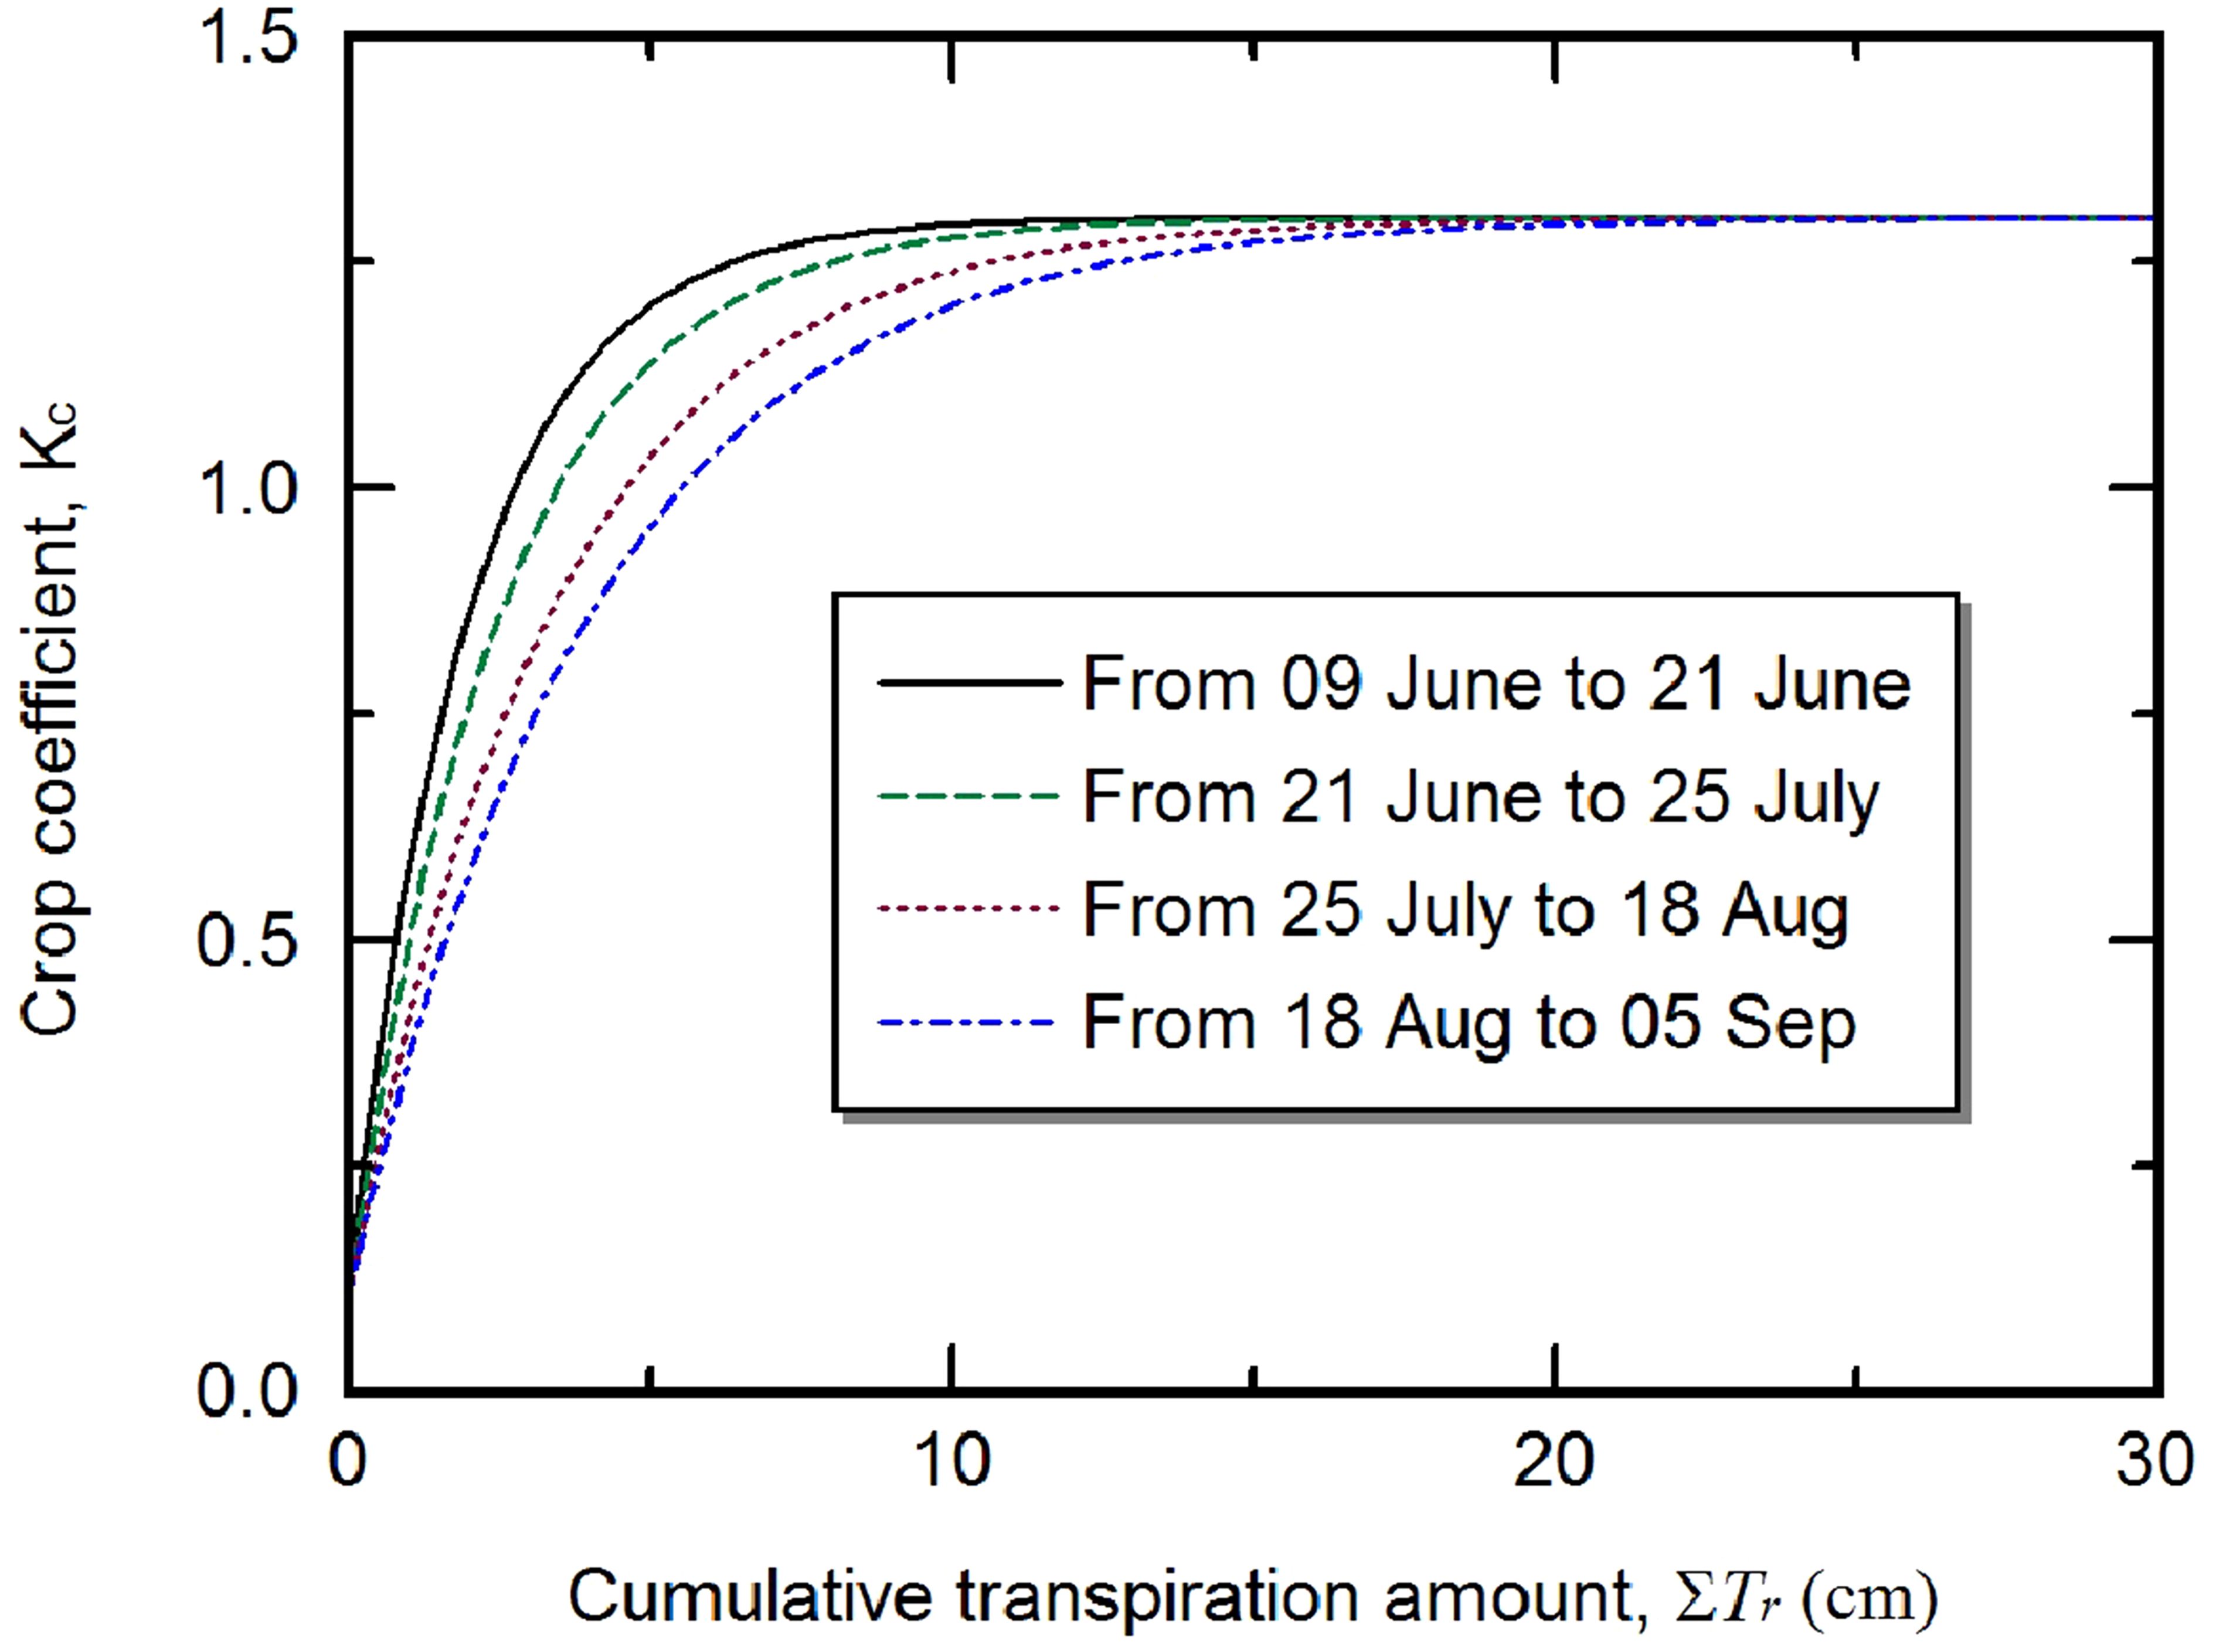
Figure 4. Basal crop coefficient as a function of cumulative transpiration. The values were updated for four time periods over the growing season.
3 Results and discussion
3.1 Leaf area index and biomass
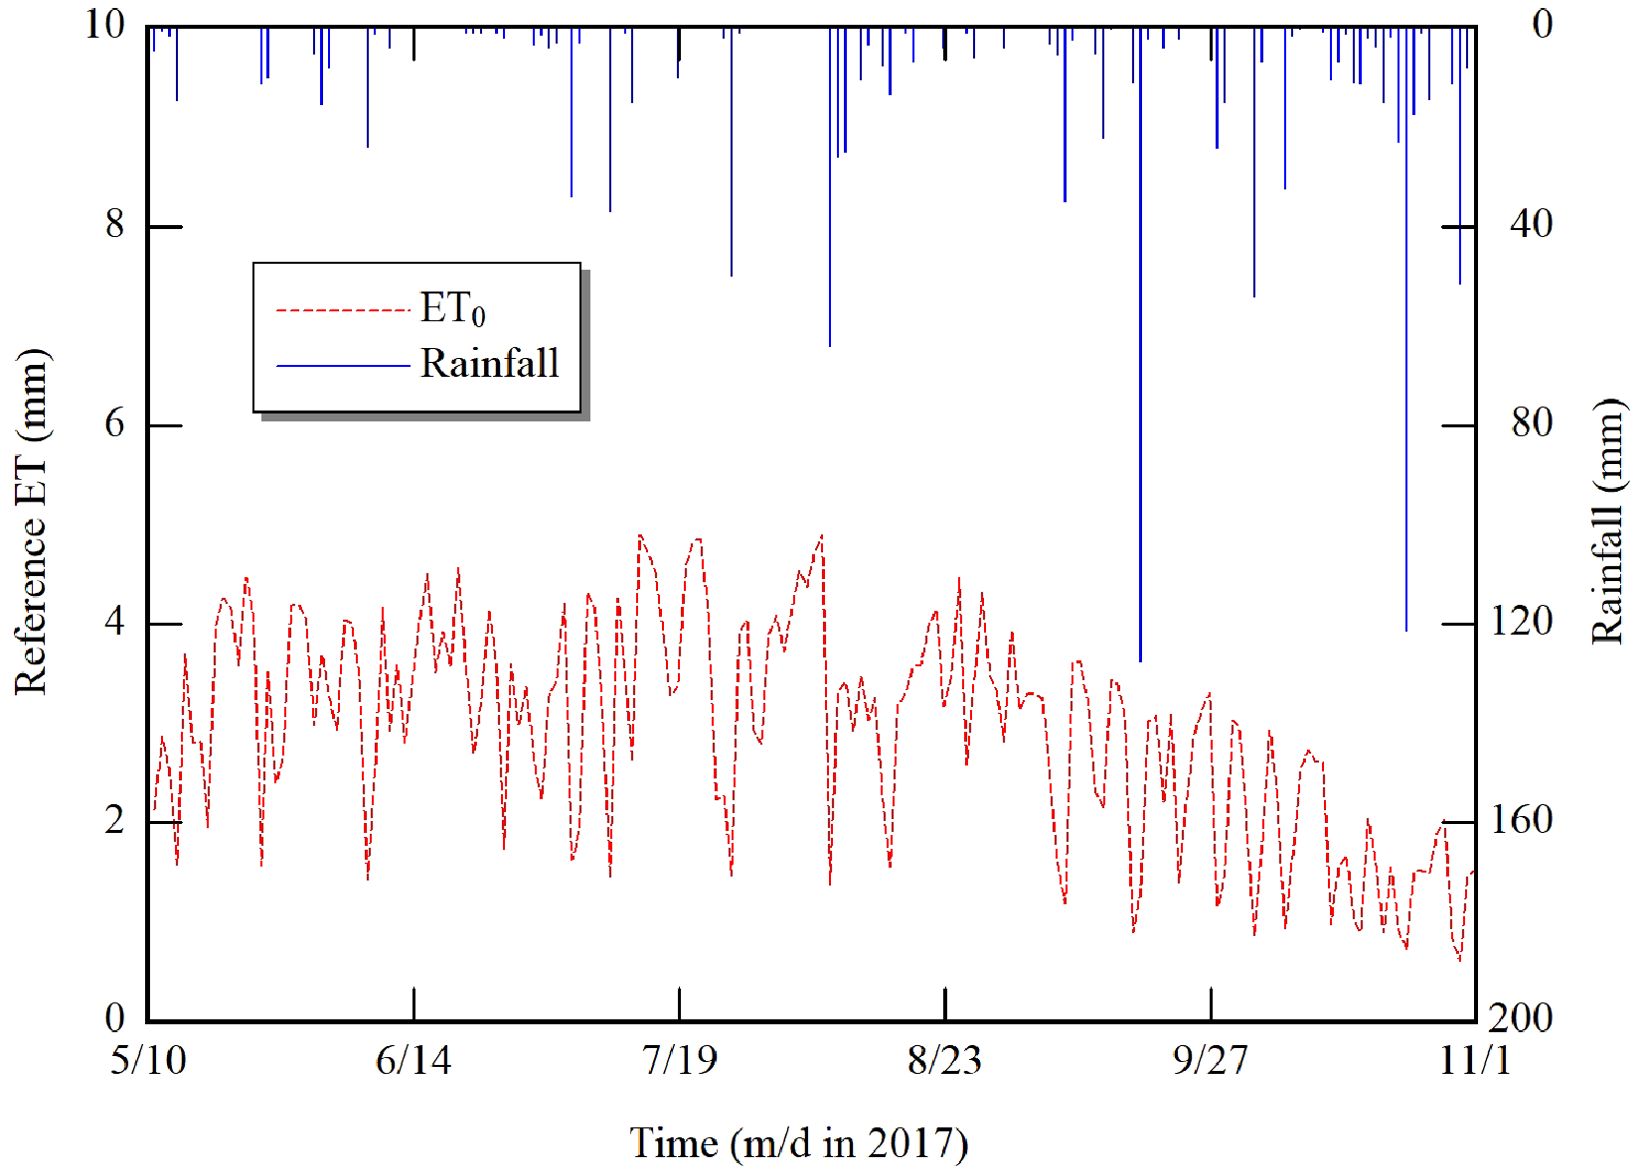
Results of five observations for both leaf area index and biomass throughout the growing season are demonstrated in Figure 5. Despite that treatment S has received more water than treatment A from the sowing date until 74 days after sowing (DAS), there were no significant differences between the two treatments in terms of leaf area indices and biomass. When the plant reached the reproductive stage, which began with blooming at 31 DAS and ends with full seeding at 74 DAS (Boote, 1982), the pegging and pod development compete for nutrients and carbohydrates, which may slightly reduce leaf growth in the treatment S. On the other hand, leaf growth and biomass production increased more in treatment S than treatment A from the full seed filling until harvest. This might be due to less water applied in treatment A than treatment S. These results agreed with the findings of Haro et al. (2008). We observed that the crop canopy remained green with full vegetative cover until harvest, with no decline or senesce in plant leaves, resulting in greater LAI values at harvest time. This could be attributed to persistent rainfall events and low reference ET values, as illustrated in Figure 6.
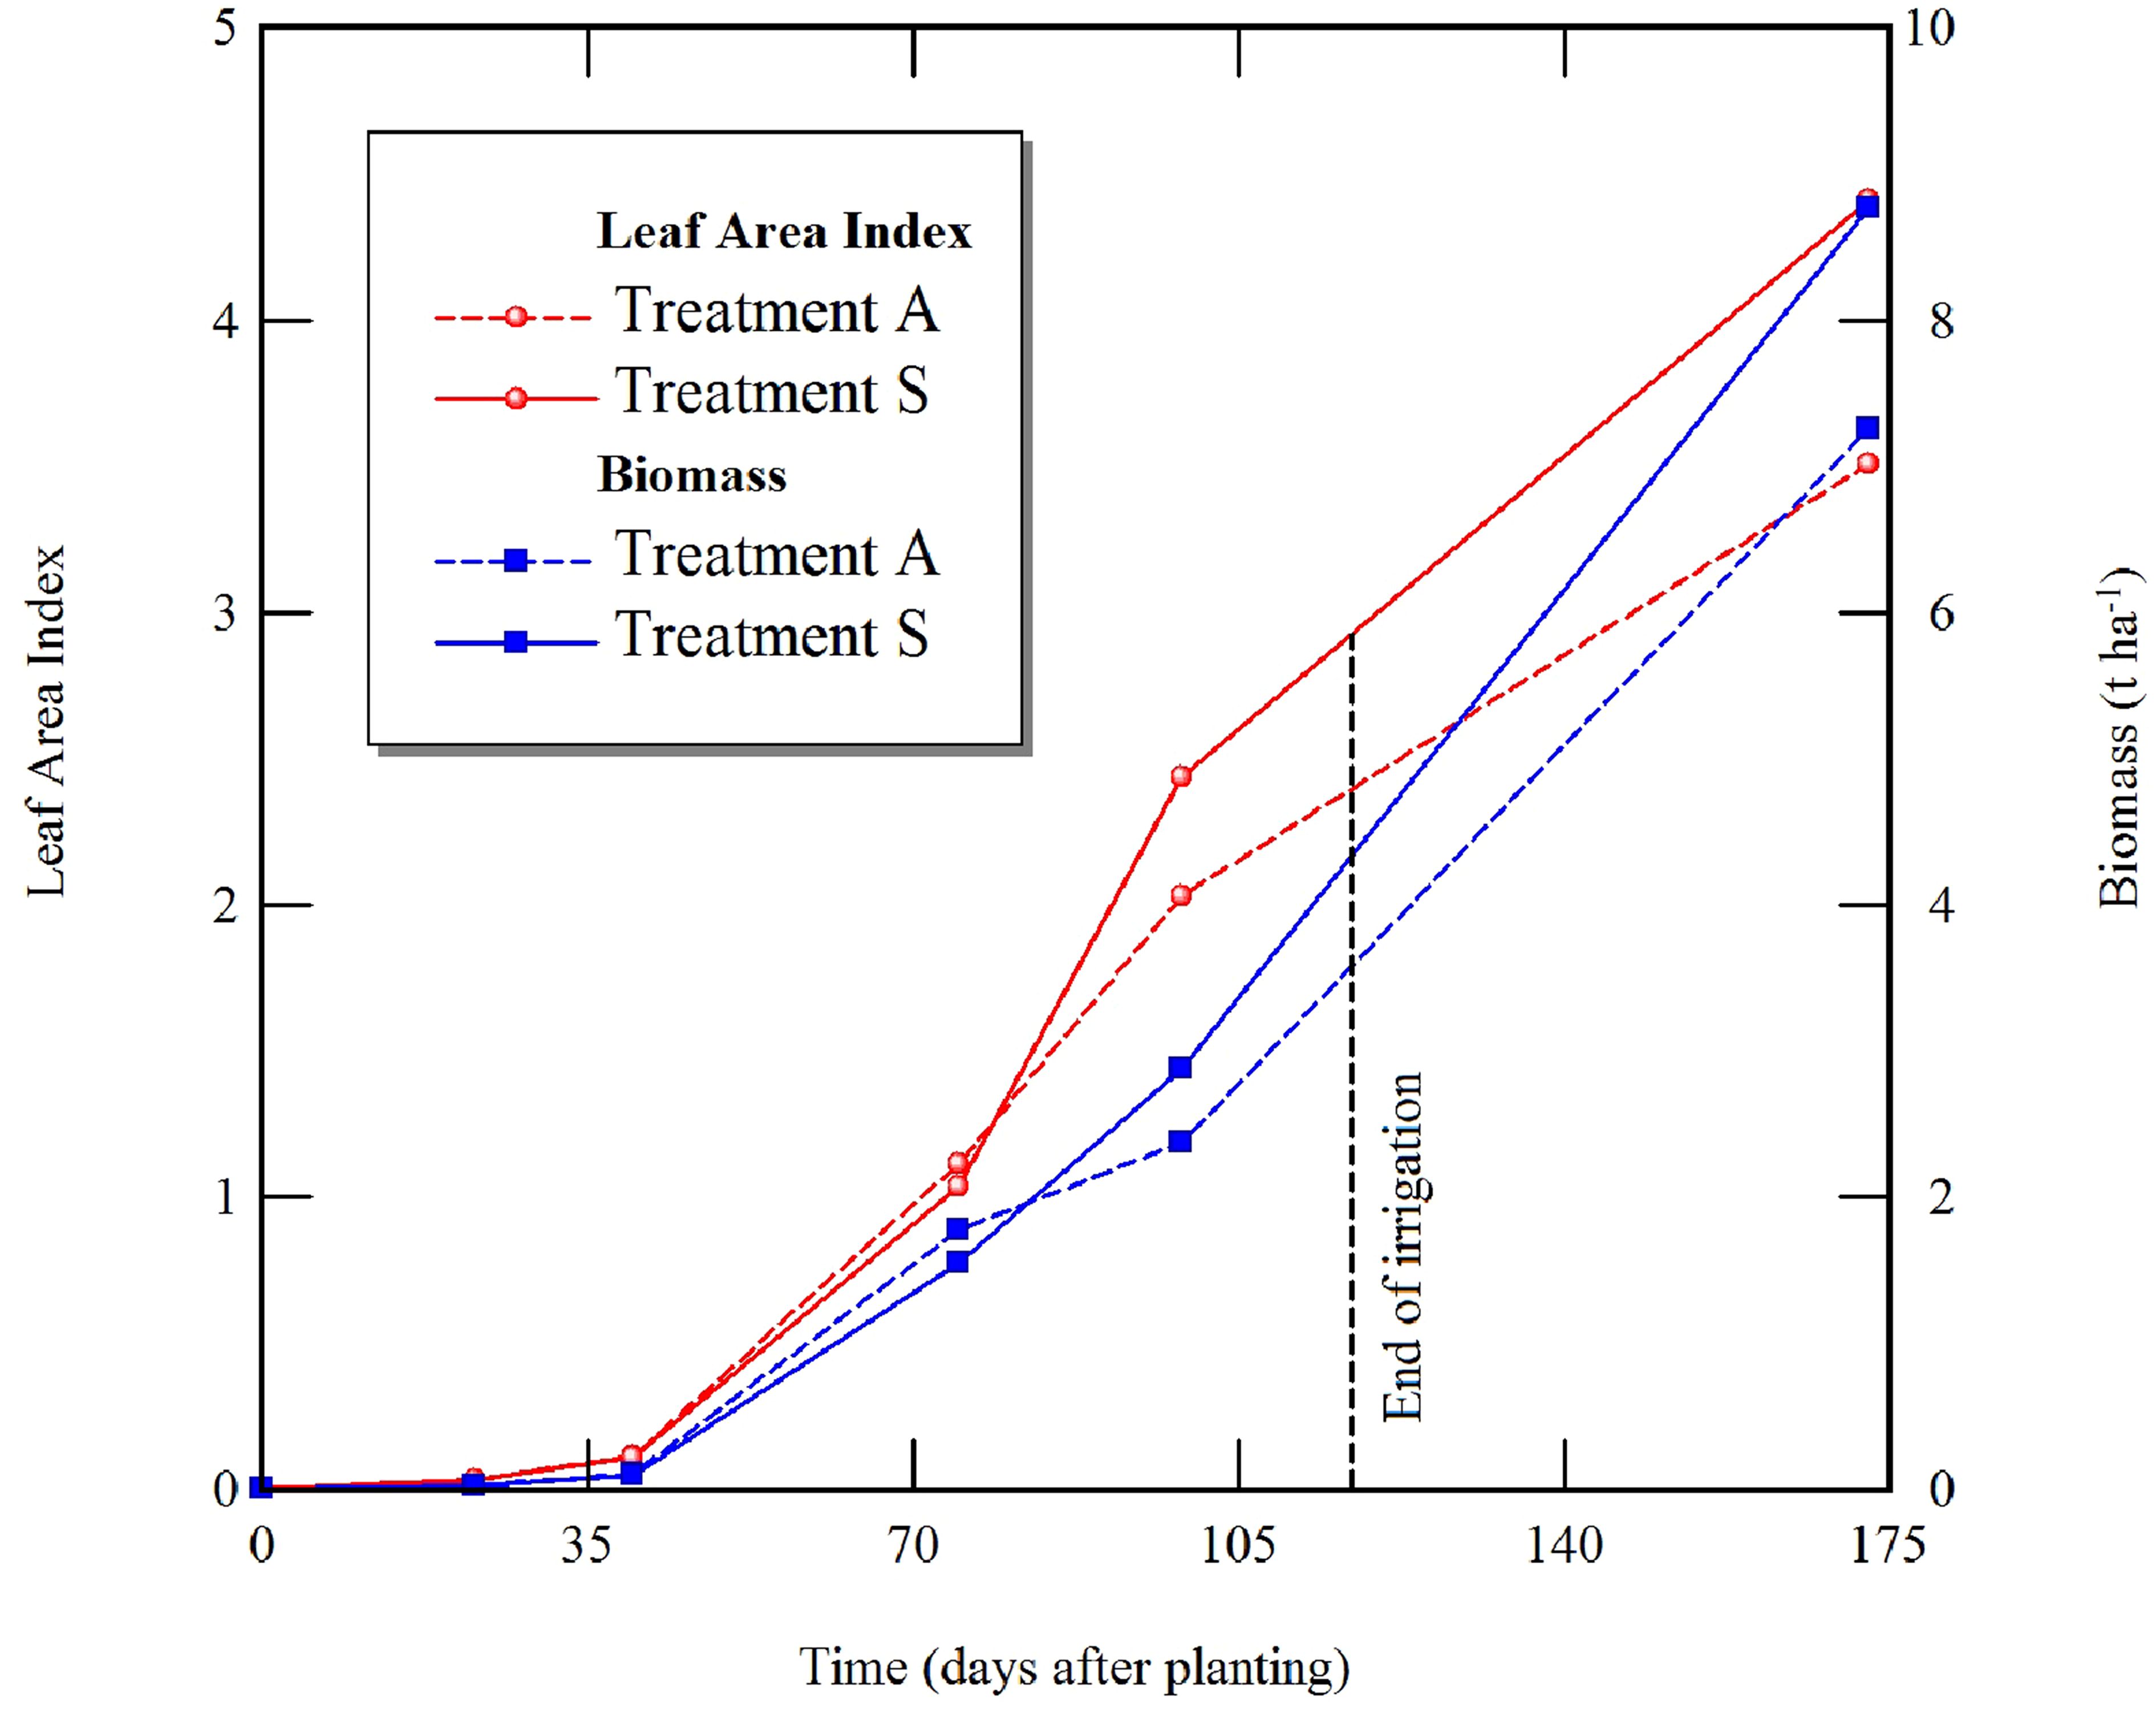
Figure 5. The status of leaf area index and biomass at each growth stage for the proposed treatments (treatments A and S refer to automated and simulation-based irrigation schemes).
3.2 Accuracy of soil water simulation
Accurate measurement of soil hydraulic characteristics can lead to more realistic estimates of soil water contents, which leads to better irrigation management (Minasny and McBratney, 2002; Heathman et al., 2003). Therefore, we assessed the model accuracy in terms of simulated soil water content. Figure 7 demonstrates a comparison example of two-dimensionally simulated and observed volumetric water contents (VWC) from 12 July to 11 August under two distinct circumstances of irrigation and rainfall events. The highest irrigation depth determined through the model was 15.6 mm, and owing to water block, it was applied twice on 4 August. It is obviously shown that the VWC responded to irrigation and rainfall events. The observed VWC at the point (5, 0) was overestimated with an RMSE of 0.023 compared to the simulated one, most likely due to overestimated potential transpiration. Hence, the function of was updated downward. In the deeper layer at the point (45, 0), the model overestimated VWC with an RMSE of 0.01, most likely due to overestimation in normalized root length distribution. Whereas the model at the observation point (5, 45) could consider the internal drainage and accurately simulate VWC with an RMSE of 0.016. These findings were consistent with those of Abd El Baki et al. (2017) and Abd El Baki et al. (2018), who tested the same scheme for potatoes and sweet potatoes under the same soil and at the same spatial observation points. The results were likewise comparable to those obtained by Fujimaki et al. (2014) for sweet corn, but their simulations for VWC in the deeper layer were slightly underestimated. For the combination of clay soil, arid climate, and maize crop, Abd El Baki and Fujimaki (2021) found that the model fairly simulated the VWC at the top layer of soil (5 cm), but they were unable to evaluate the accuracy of the model in the deeper layers, as the sensor (5TE, METER Inc., Pullman, Washington, USA) gave unrealistic readings due to high clay content of the soil. This is in agreement with the findings of Datta et al. (2018), who observed that all five tested dielectric moisture sensors, including 5TE, did not give satisfactory readings with high soil salinity and clay content. Therefore, the presented scheme is more applicable for determining irrigation depths in sandy textured soils, whereas further evaluation work is needed to test the proposed scheme in clay soils, even if it increased farmers' net income, according to Abd El Baki and Fujimaki (2021).
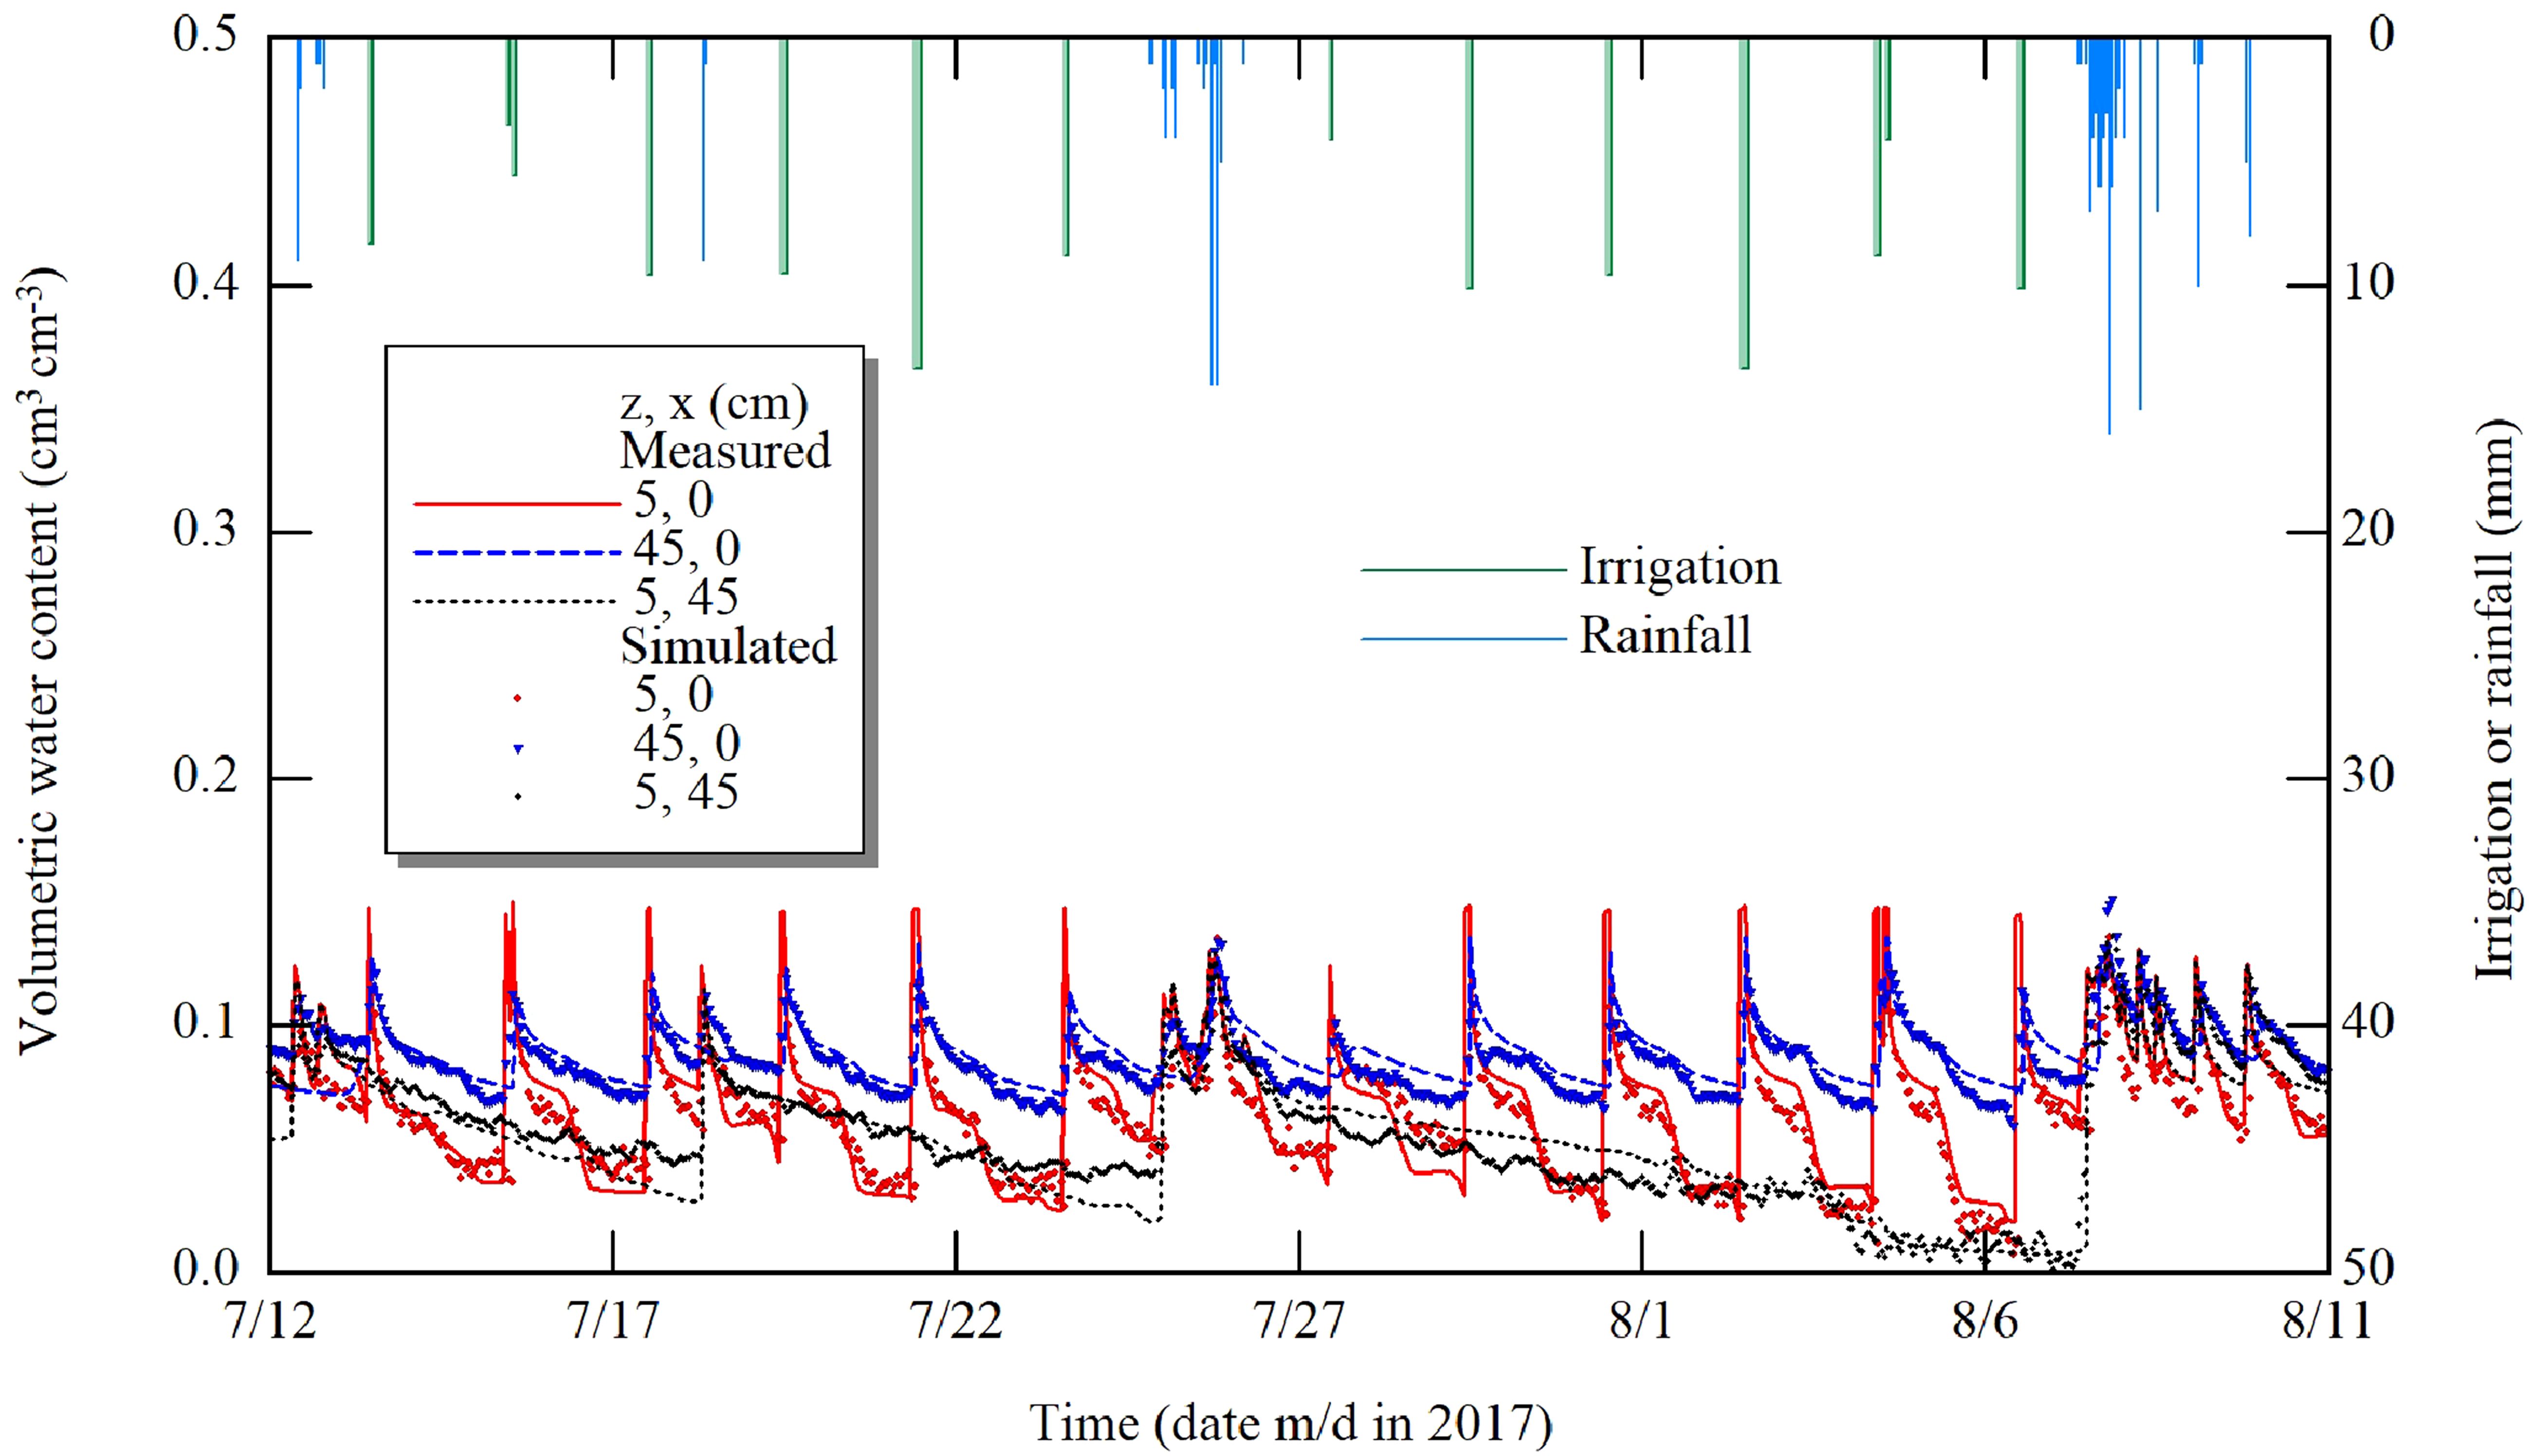
Figure 7. The accuracy of VWC simulations in comparison with the observed ones with TDR probes. the observation points represented by (z, x), in which z and x are soil depth and horizontal distance from the lateral, respectively.
3.3 Impact of quantitative weather forecasts on irrigation optimization
The utilization of quantitative weather forecasts together with the presented scheme was effectively used to optimize irrigation depths. For instance, the simulation conducted on 10 August revealed that soil water would be sufficient to meet crop water requirements due to a 12-mm forecasted rainfall. As a result, the irrigation depth determined by the scheme was equal to 0. In contrast, 4.8 mm was applied through the automated irrigation system on 11 August just 5 h before rainfall occurrence (Figure 8). This is the only case encountered during the experiment period. According to Abd El Baki et al. (2023), such a case example was repeated six times, emphasizing the importance of rainfall forecasting in irrigation scheduling. The workability of automated irrigation system is shown in Figure 9. The irrigation was automatically applied when the average trigger value of three tensiometers reached to −45 cm. The significant rainfall events occurred only on 25 July and after 12 August; therefore, the example presented in Figure 8 was the only case that occurred over the growing season. Higher precision in weather forecasting can lead to accurate forecasts of that can improve the feasibility of the presented scheme and potentially saving over irrigated water amounts by farmers (Wang and Cai, 2009; Jamal et al., 2019). Combining numerical weather forecasts with the PM method has the potential to forecast daily with reasonable accuracy (Perera et al., 2014; Yang et al., 2016). According to Xiong et al. (2015), the daily forecasts of are highly dependent on weather conditions; therefore, utilizing weather forecasts derived from historical weather data, which are typically generated for medium or long term, is not feasible to forecast daily . In our presented scheme, we used short-interval weather forecasting to ensure higher accuracy of prediction.
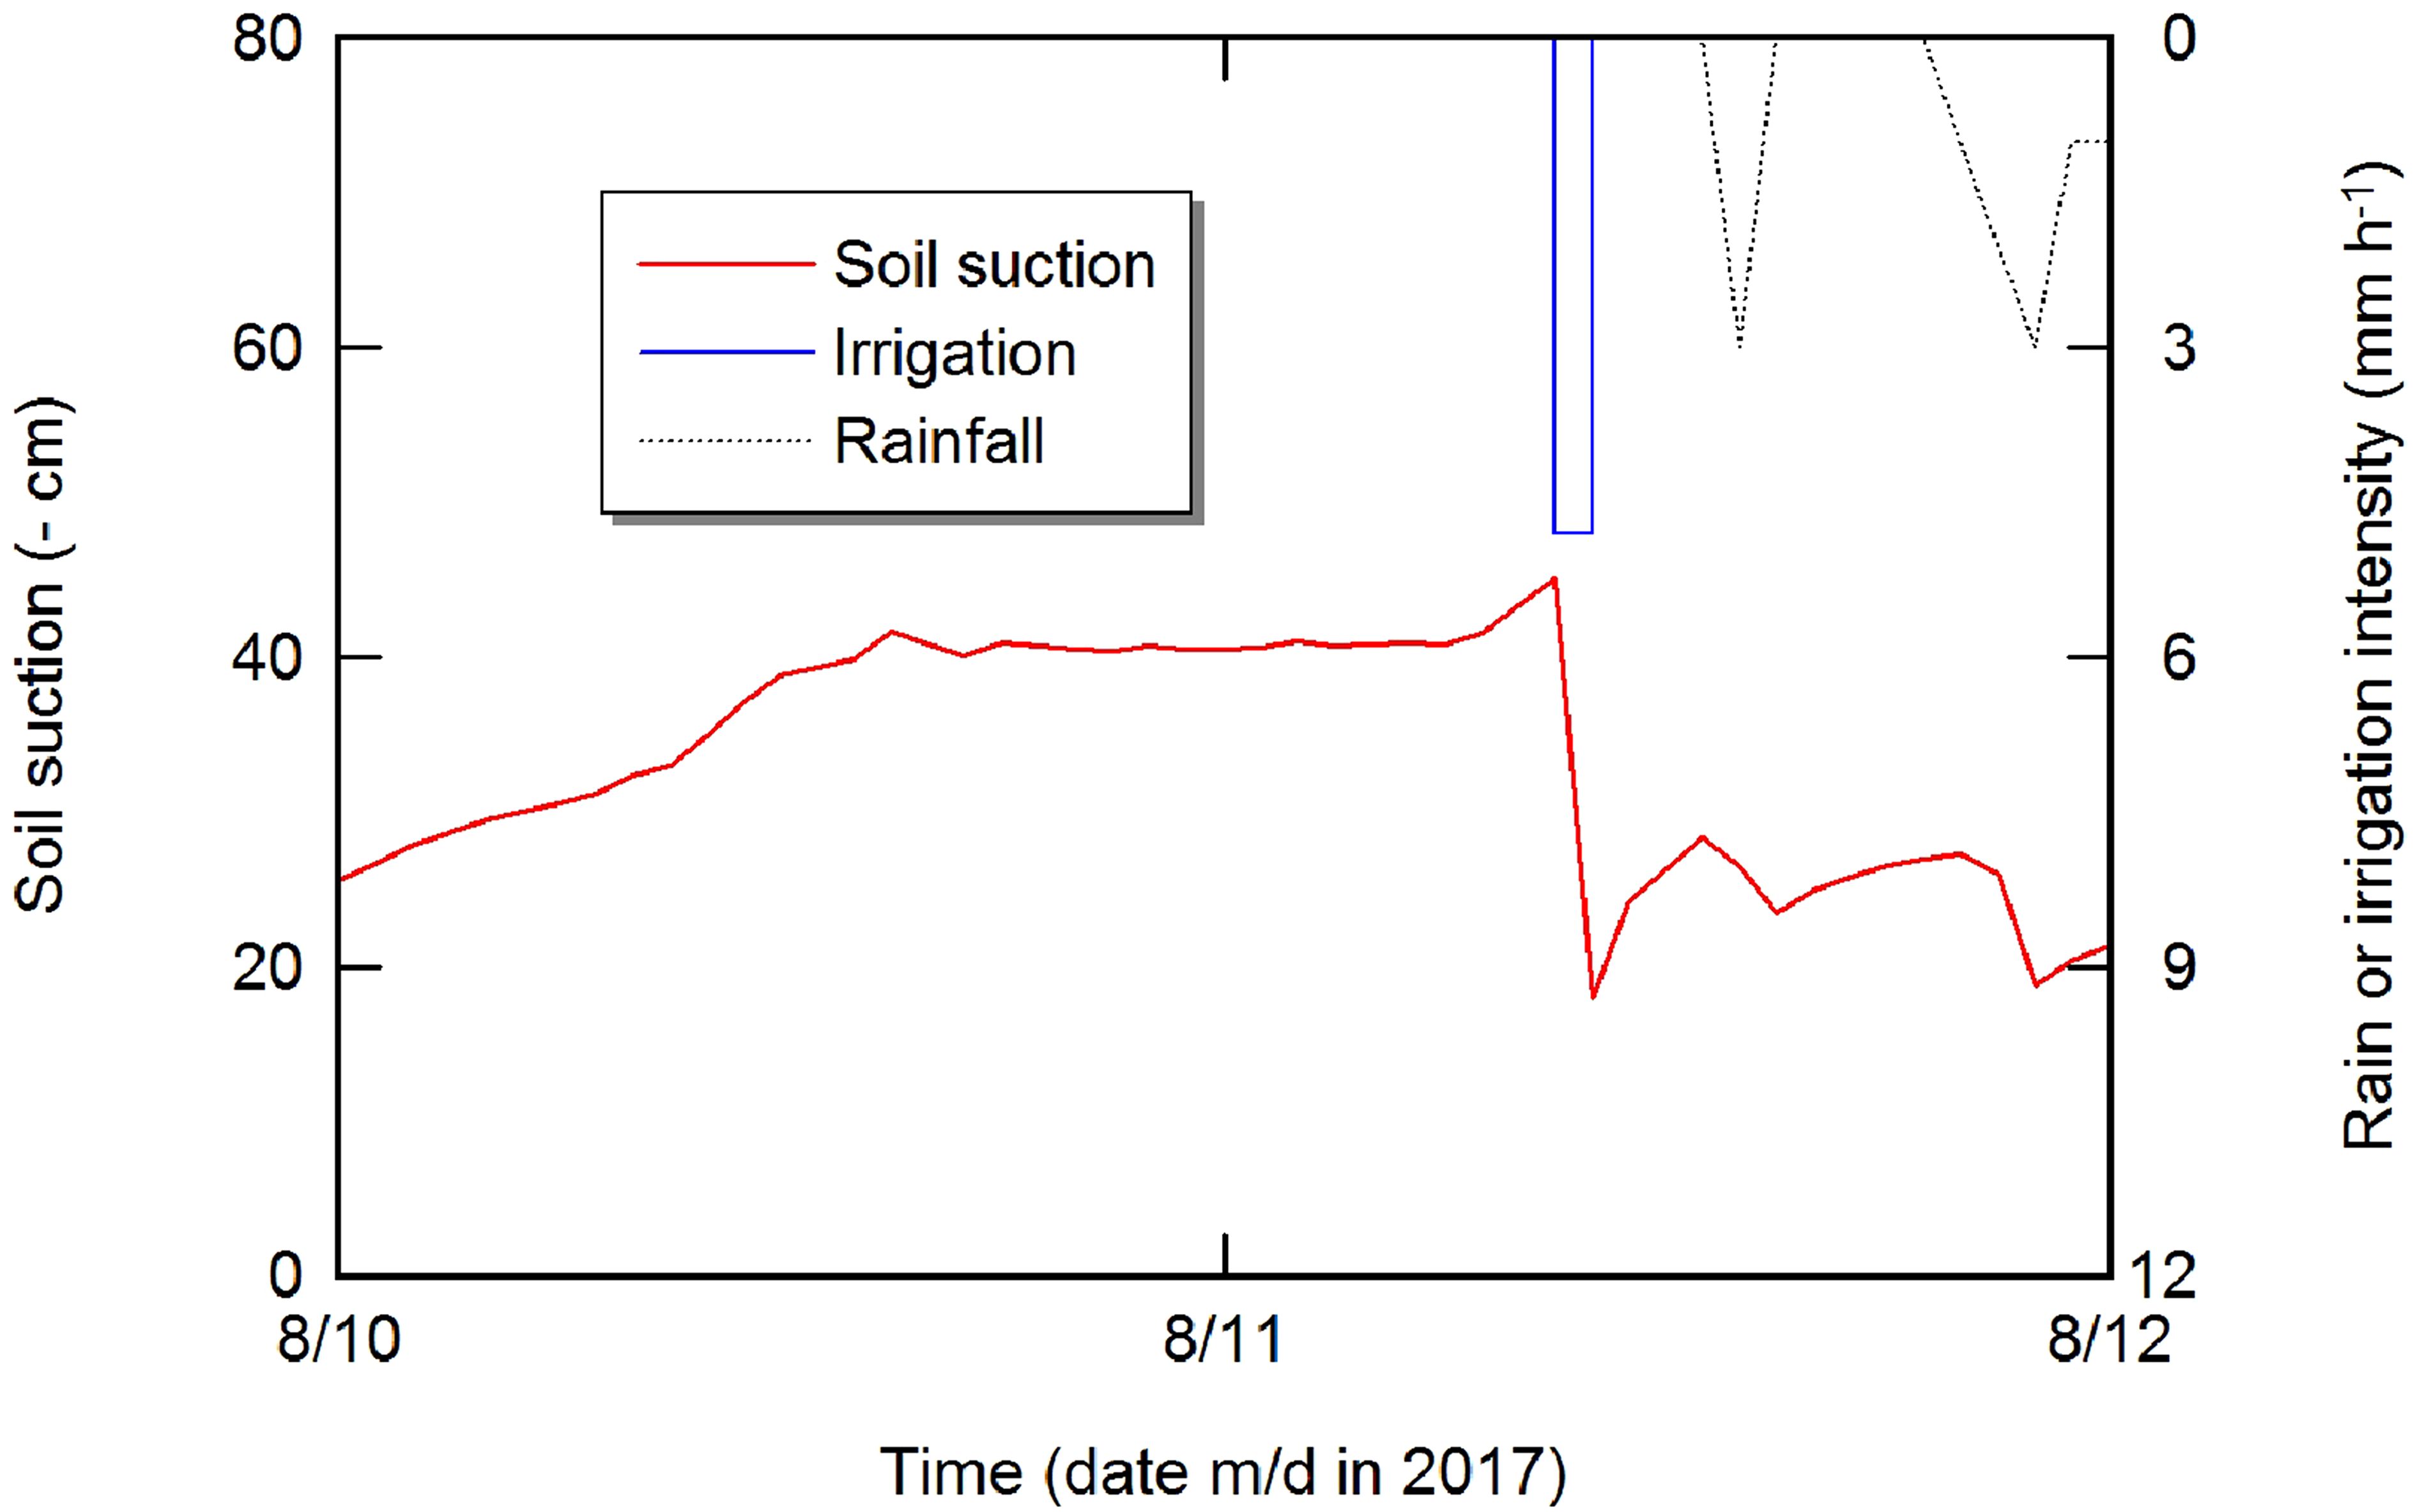
Figure 8. An example of improper water application by the automated system (4.8 mm was applied, while the proposed simulation scheme suggested no irrigation with respect to the forecasted rain).
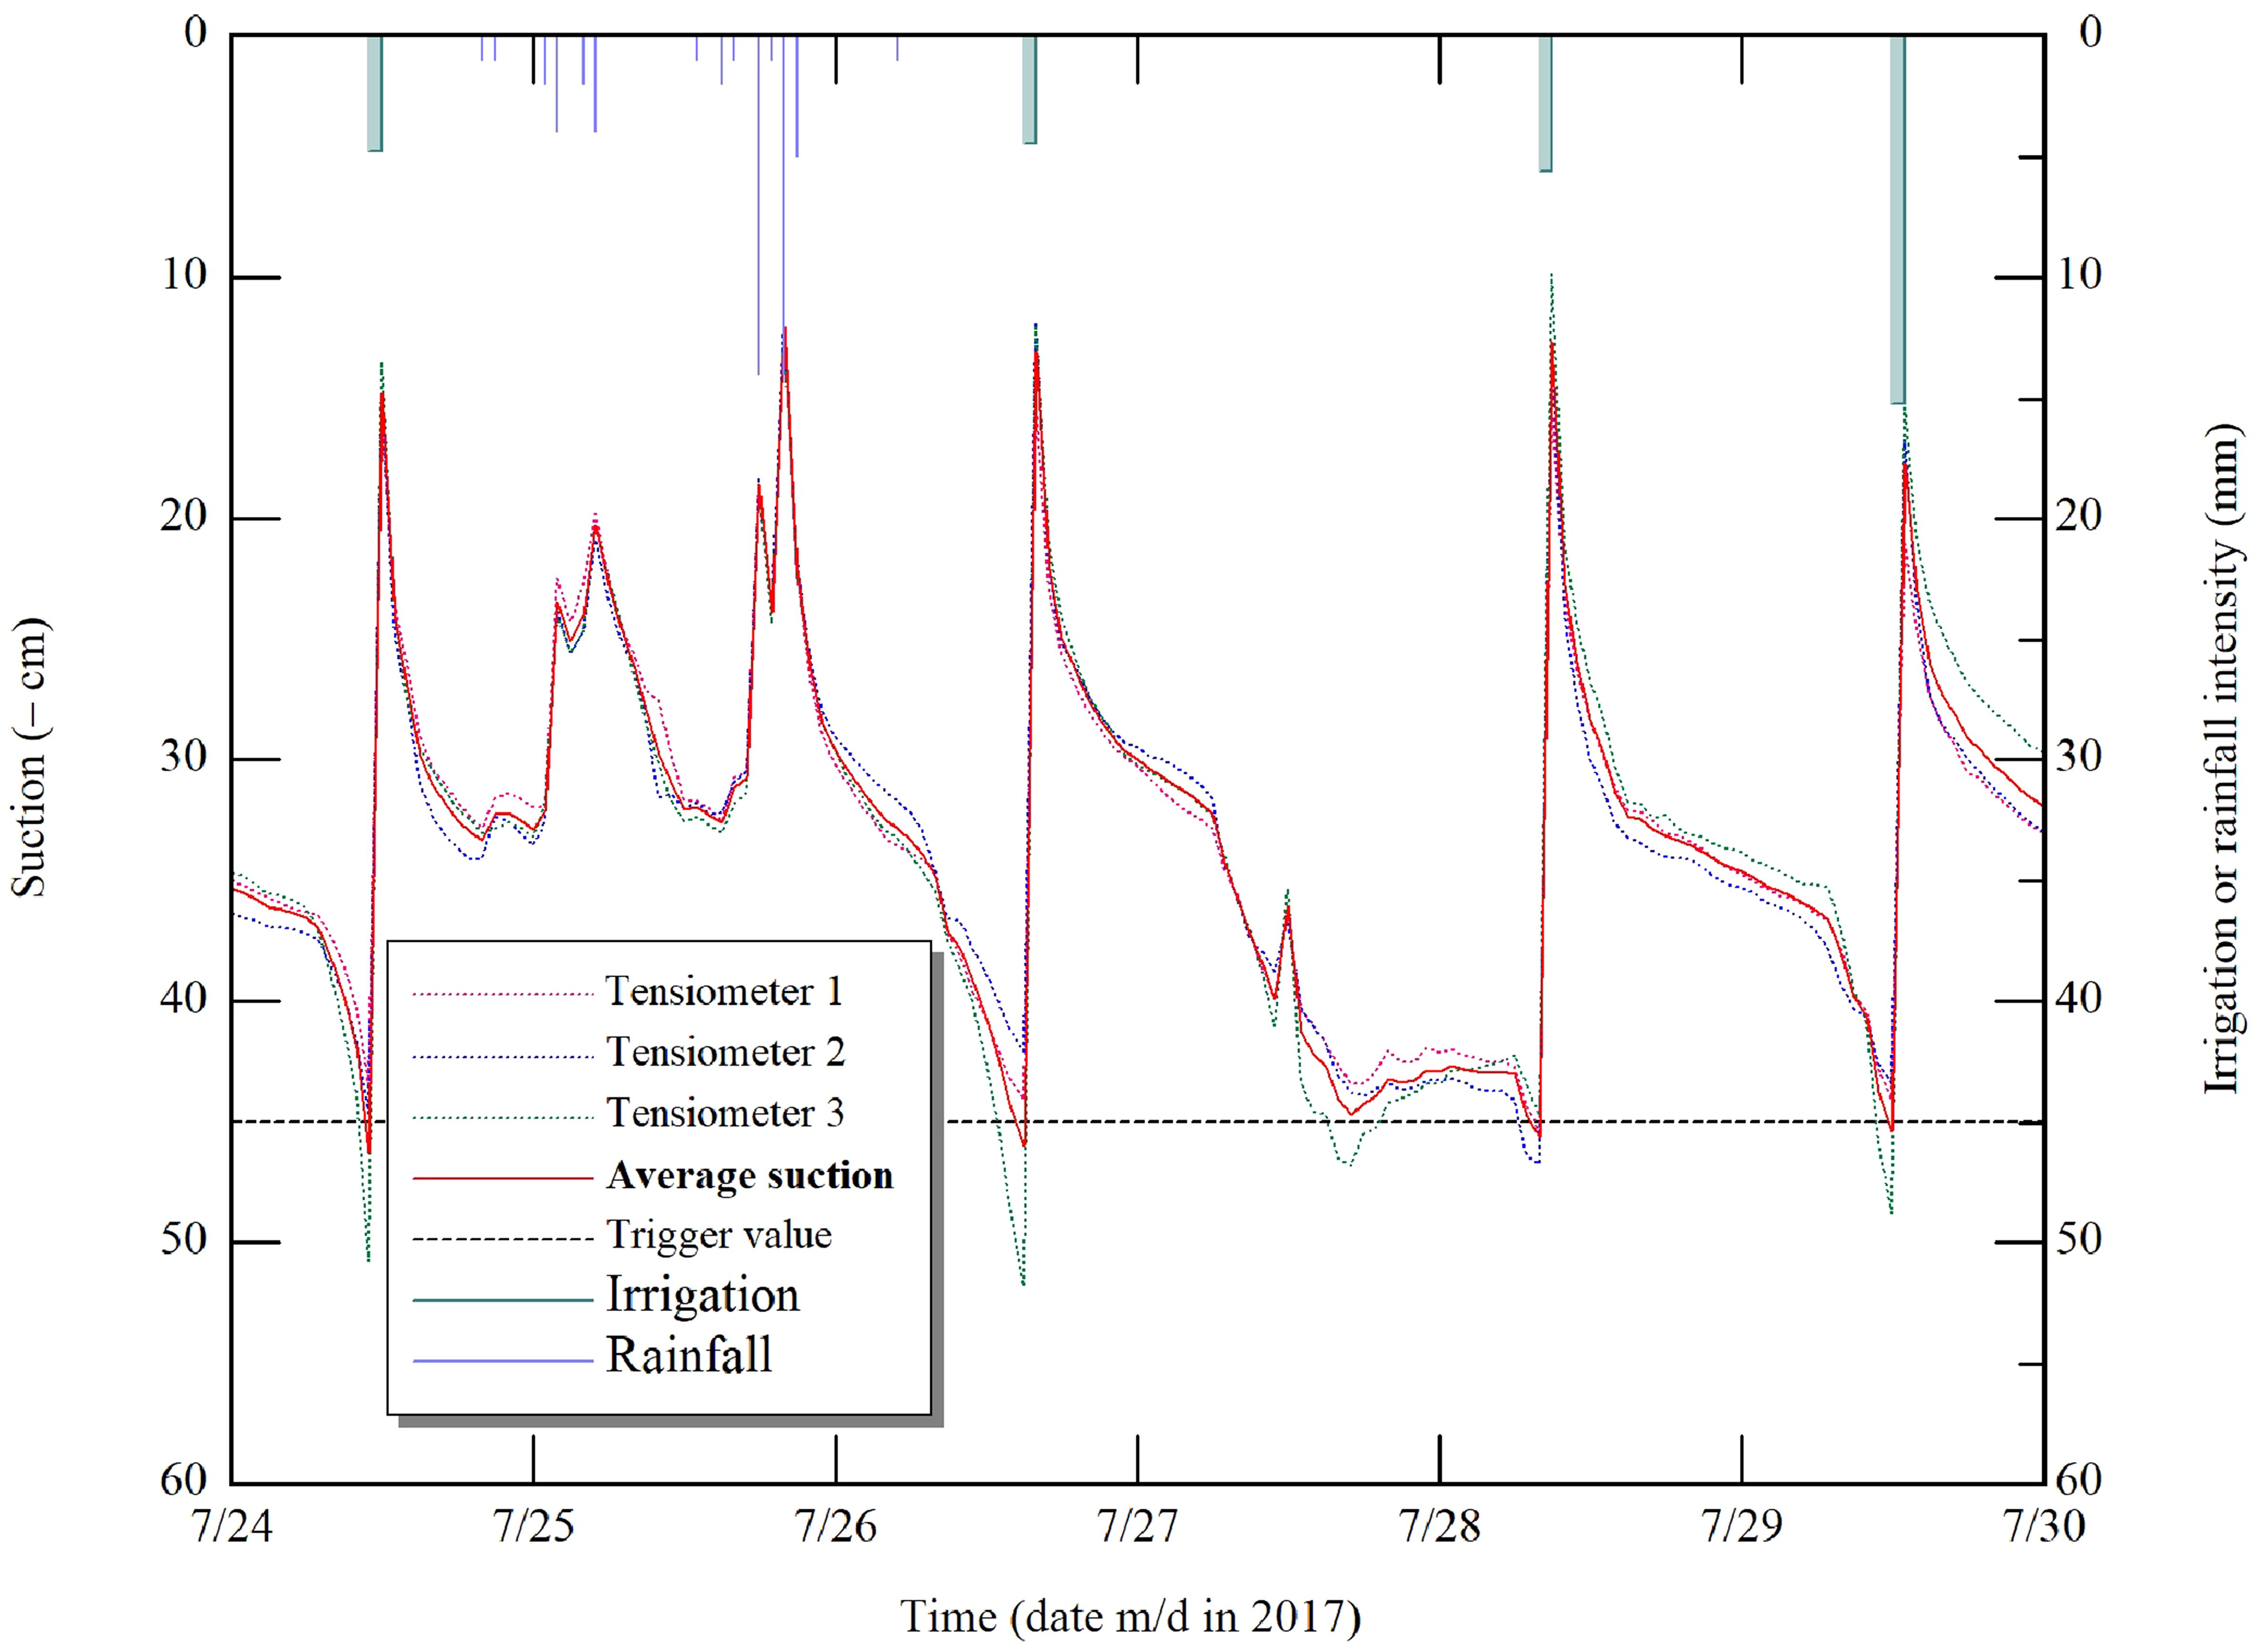
Figure 9. An example of the workability of automated irrigation under both irrigation and rainfall events.
3.4 Effectiveness of the proposed scheme on net income
As described in the previous section, the proposed scheme optimizes irrigation depth that gives maximal net income when three values of transpiration are predicted. An example of the optimization for irrigation scheduling on 6 August is shown in Figure 10. At the maximum value of the net income curve, an irrigation depth of 0.87 cm was determined, which was corresponded to lower cumulative transpiration value compared to the maximum value at 1.5 cm. This indicates that the proposed scheme employs mild water deficits.
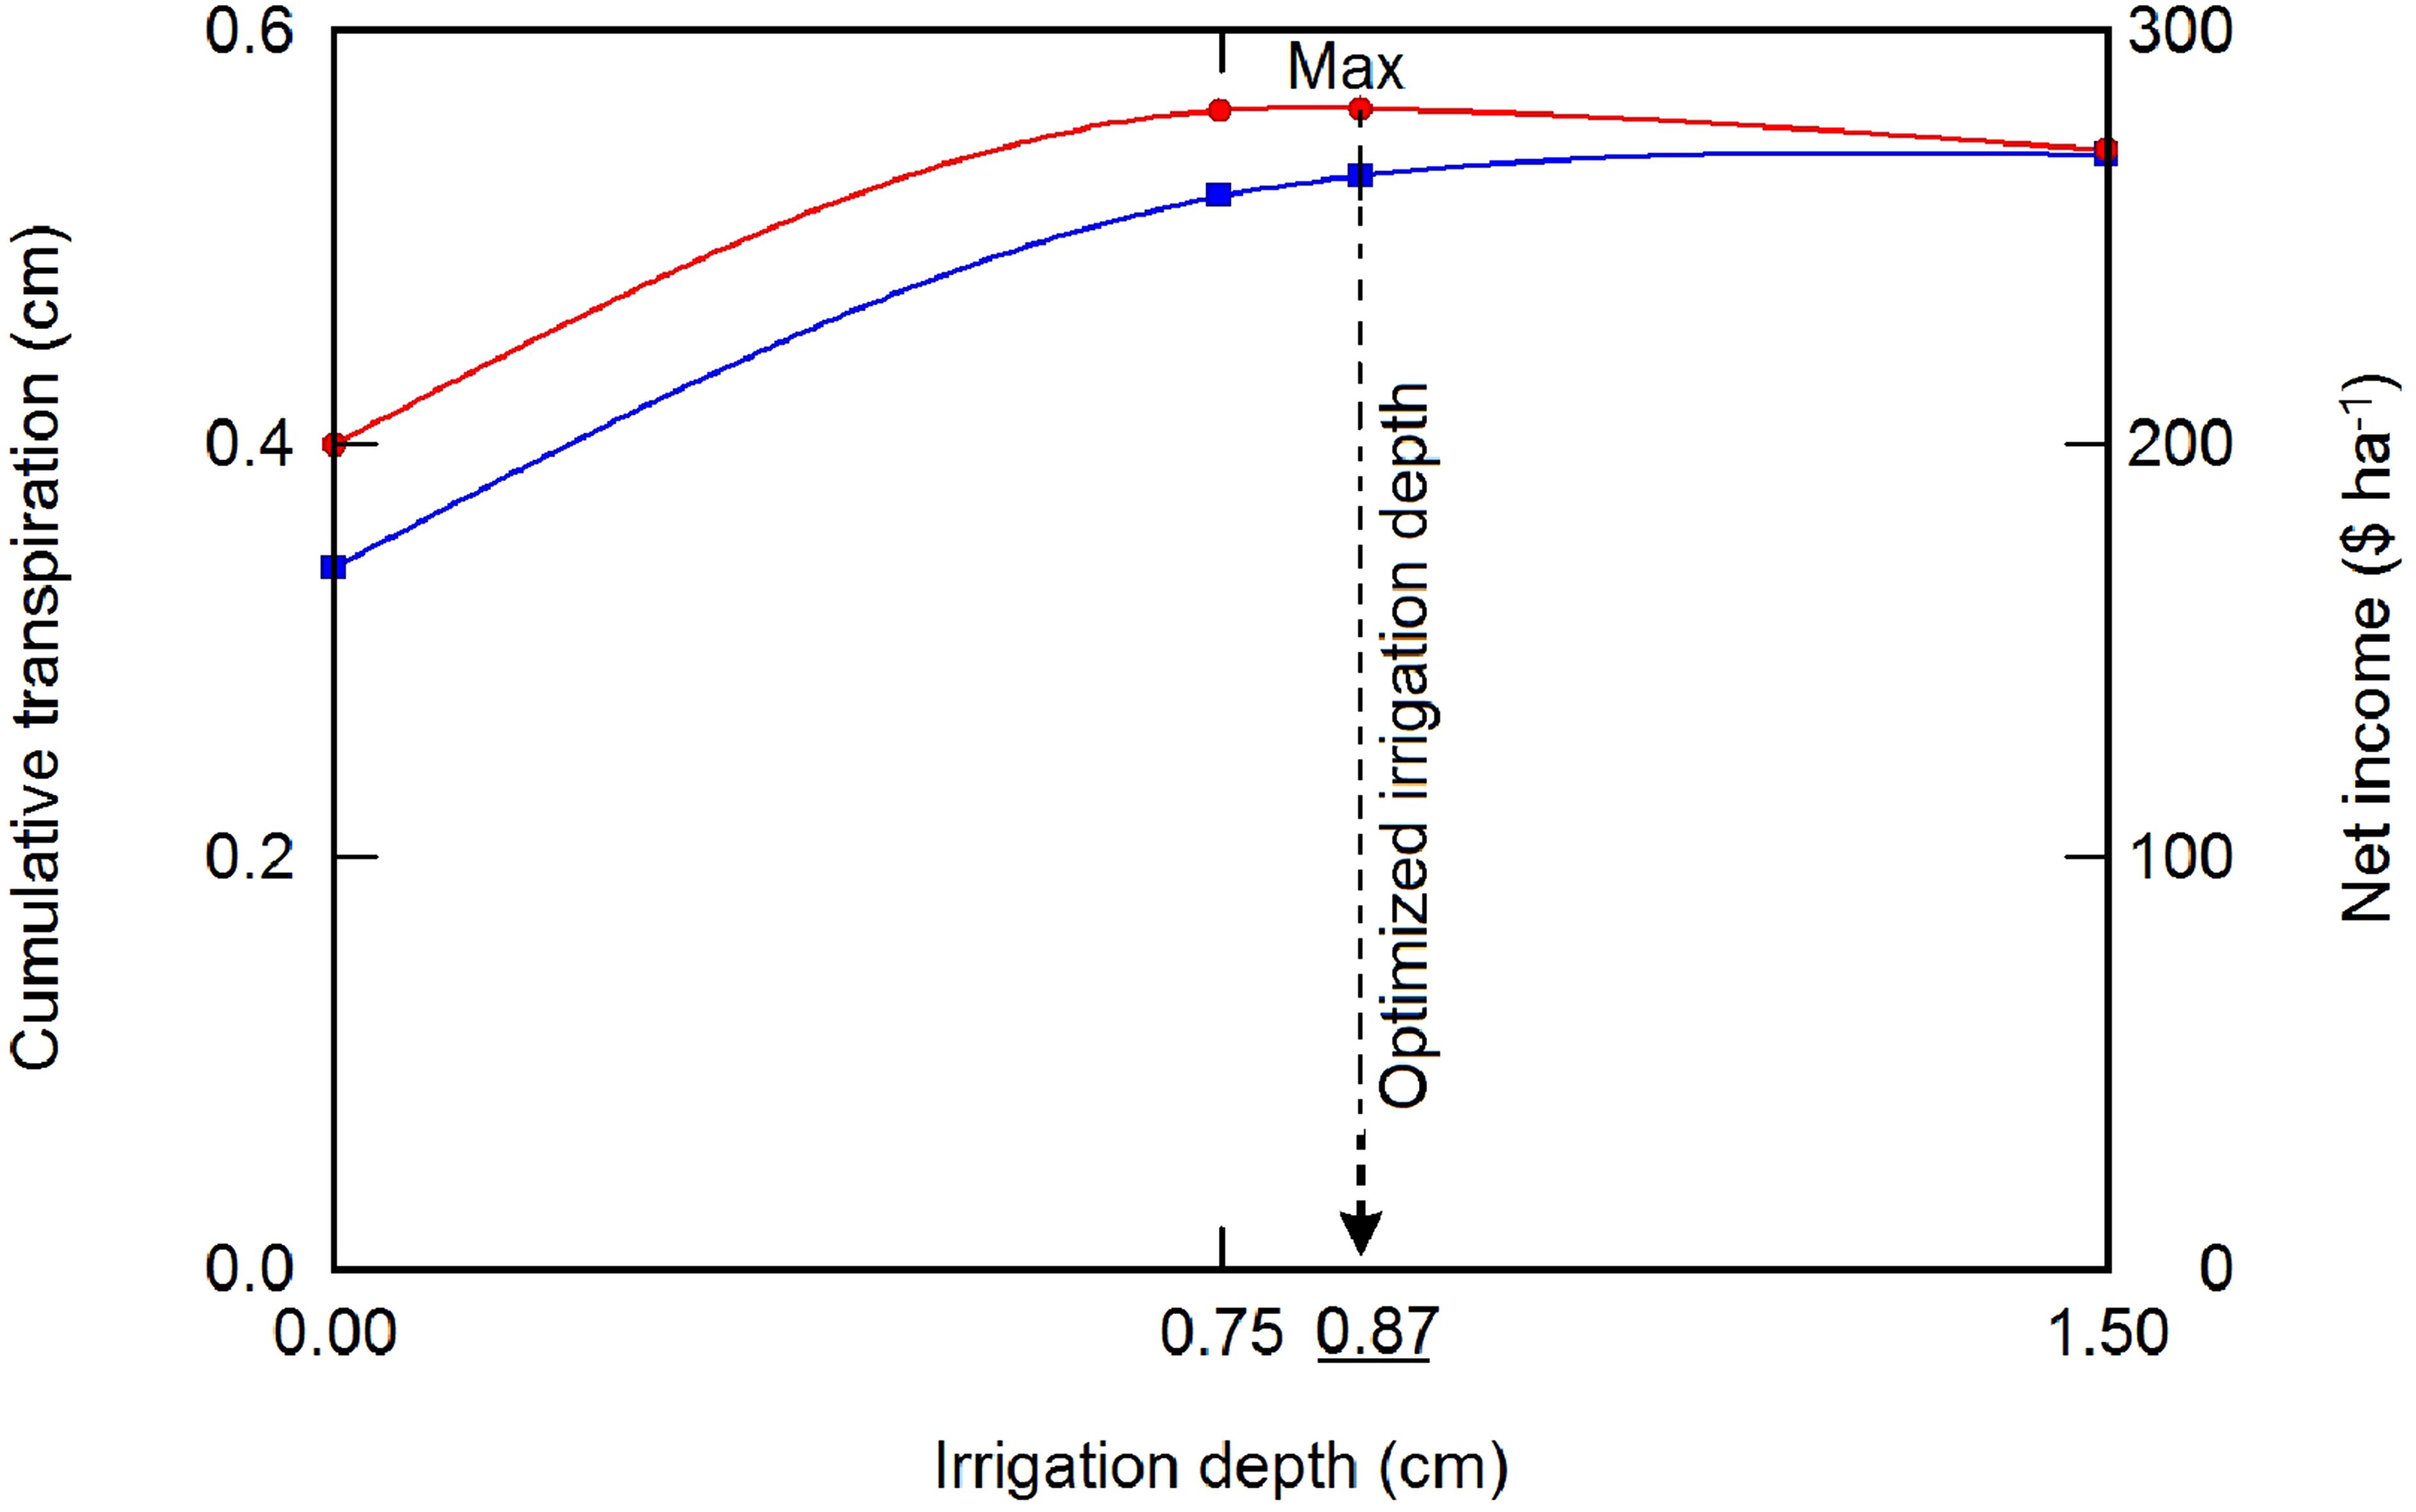
Figure 10. An example of how the irrigation depth was determined at the maximum net income on 6 August.
Under scarce water conditions, the primary goal of farmers should be maximizing net income per unit of water (Fereres and Soriano, 2007). In this context, the presented scheme has a tremendous advantage to maximize farmers' net income and enable them to predict it at each irrigation event, whereas other research (e.g., Wang and Cai, 2009) focused on the seasonal net income. According to Abd El Baki et al. (2023), the scheme gave a similar value of total predicated net income compared to virtual one, making it a valuable economic tool for growers. In this respect, we assessed the effect of the proposed scheme on total net income as shown in Figure 11. Although treatment S gave more seasonal applied water by 28%, it achieved 2.18 times of net income of treatment A. Seed yield of groundnut of treatments A and S was 0.97 Mg ha−1 and 1.47 Mg ha−1, respectively. It means that treatment S was 51% larger than treatment A, which could justify the cost of applied water. Under the current crop and water pricing combination, the trigger value of soil suction (−45 cm) might be set too stringent, resulting in yield reduction due to inadequate water supply for treatment A. The difficulty in determining economically optimum trigger value without expensive field trials is another disadvantage of the automated irrigation system. We also obtained a lot of pops (pods in full size with no kernels inside), which contributed to a drop in yield in both treatments A and S. This might be due to an inadequate amount of Ca applied to the crop in the early stages of reproductive stage. This scheme is only applicable when irrigation water is volumetrically priced. Thus, the scheme could be a robust way of optimizing irrigation water supplies and meeting sustainability goals in the face of a near future water crisis.
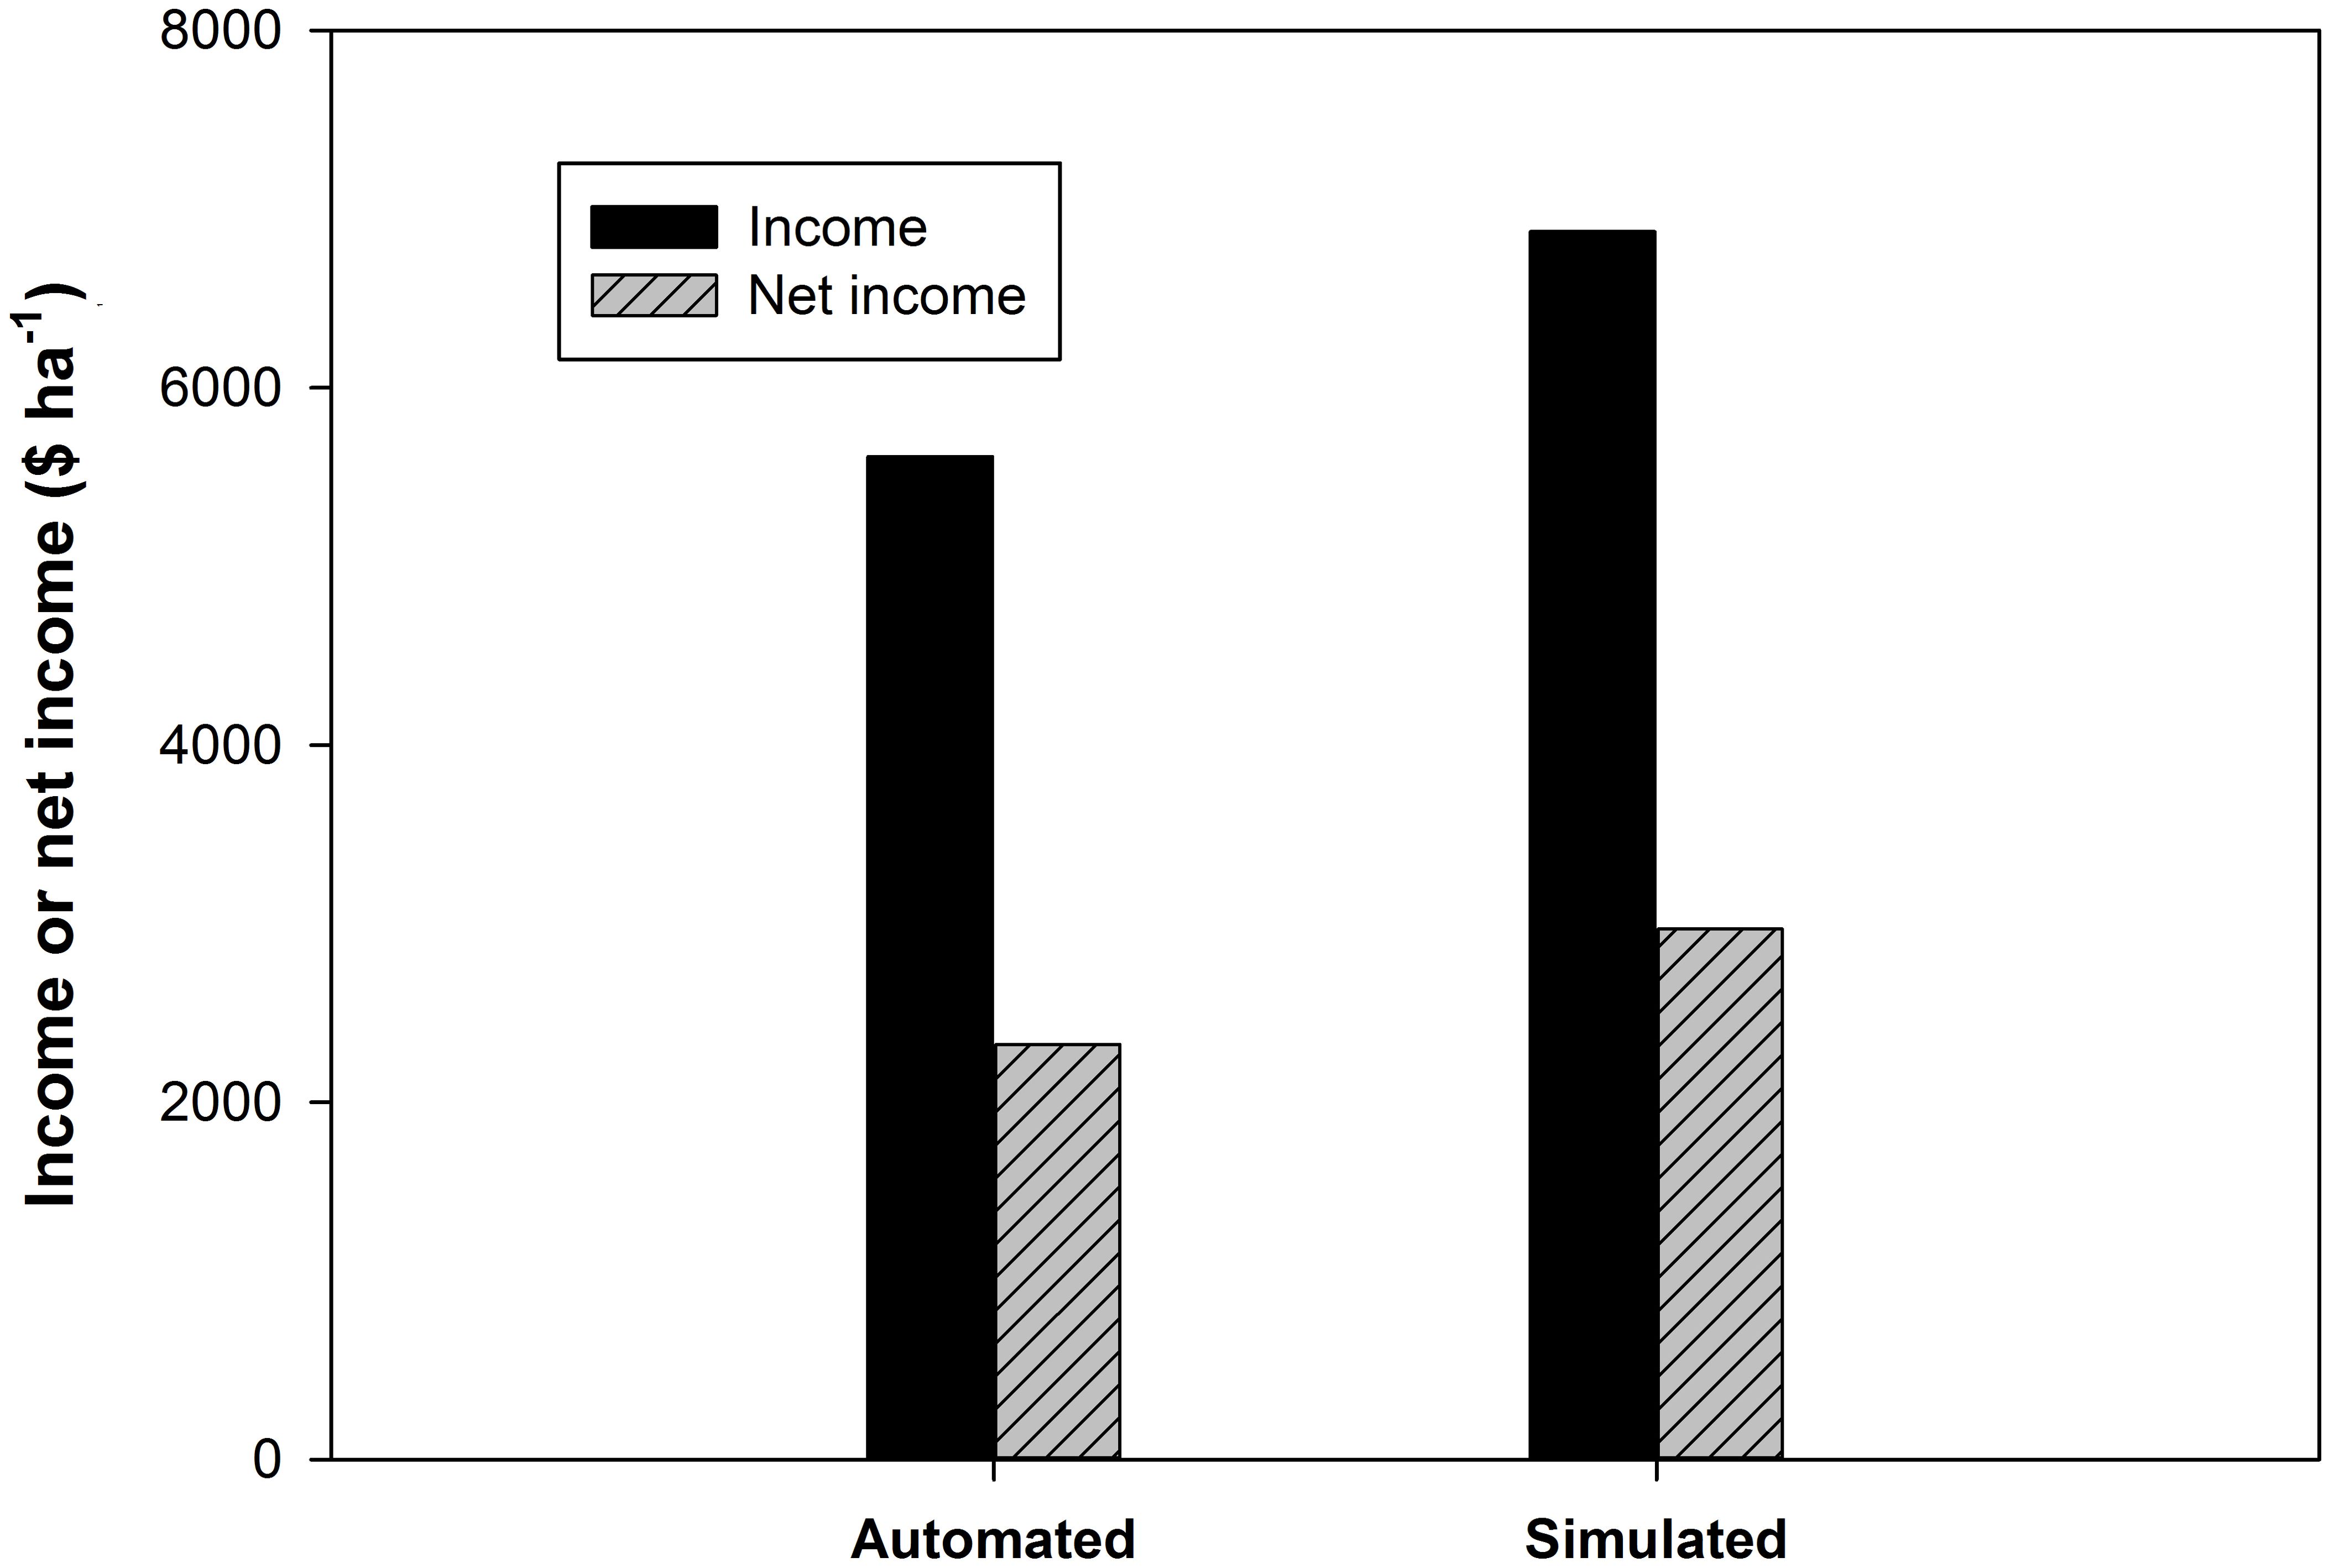
Figure 11. Total income and net income of the two irrigation treatments (treatment A, automated irrigation scheduling based on soil water suction monitoring, and treatment S, the proposed simulation scheme-based optimization).
3.5 Comparison between forecast and actual rainfall
Since the accuracy of rainfall forecasts may affect the performance of the proposed scheme, we compared the forecasted daily effective rainfall to the actual one as shown in Figure 12. In the data analysis procedure, we set the daily effective rainfall as 20 mm because additional rainfall larger than adjusted value is lost due to deep percolation and cannot be taken up by crop roots. During the 88-day simulation run, actual and forecasted rainfall events occurred on 26 and 25 days, respectively, with 195.5 mm and 235 mm. The forecasted rain events that coincided with the observed ones were 18 days and had an RMSE 7.86 mm. The RMSE between both of them was 4.63 mm over the entire simulation period. It should be noted that the RMSE concept is insufficient to assess the accuracy of rain forecasts. For example, total actual rainfall on August 11 and 12 was 11.5 mm, while 12.5 mm was forecasted on 11 August and zero on 12 August. The accuracy of rainfall forecast depends on the utilized website, and several attempts were established to enhance it. For example, Frnda et al. (2022) improved the daily rainfall accuracy by 45% using neural network modeling. In comparison with Fujimaki et al. (2014), we found that accuracy of weather forecasts is improving and that would enhance efficiency of the proposed scheme to determine irrigation depth. Even if rain is poorly anticipated, the performance of the presented scheme will not be significantly affected. This is because executing an update run (a simulation of the previous irrigation interval with actual weather data, irrigation records, and water flow information) and using the resulting data as inputs in an optimization run, in addition to setting short irrigation frequencies, can reduce the effect of the uncertainty of rain forecasts even if a mis-forecast occurs. Thus, the proposed scheme may be considered as an efficient and economical tool to determine irrigation depths considering the useful information of rain forecasts irrigation water management.
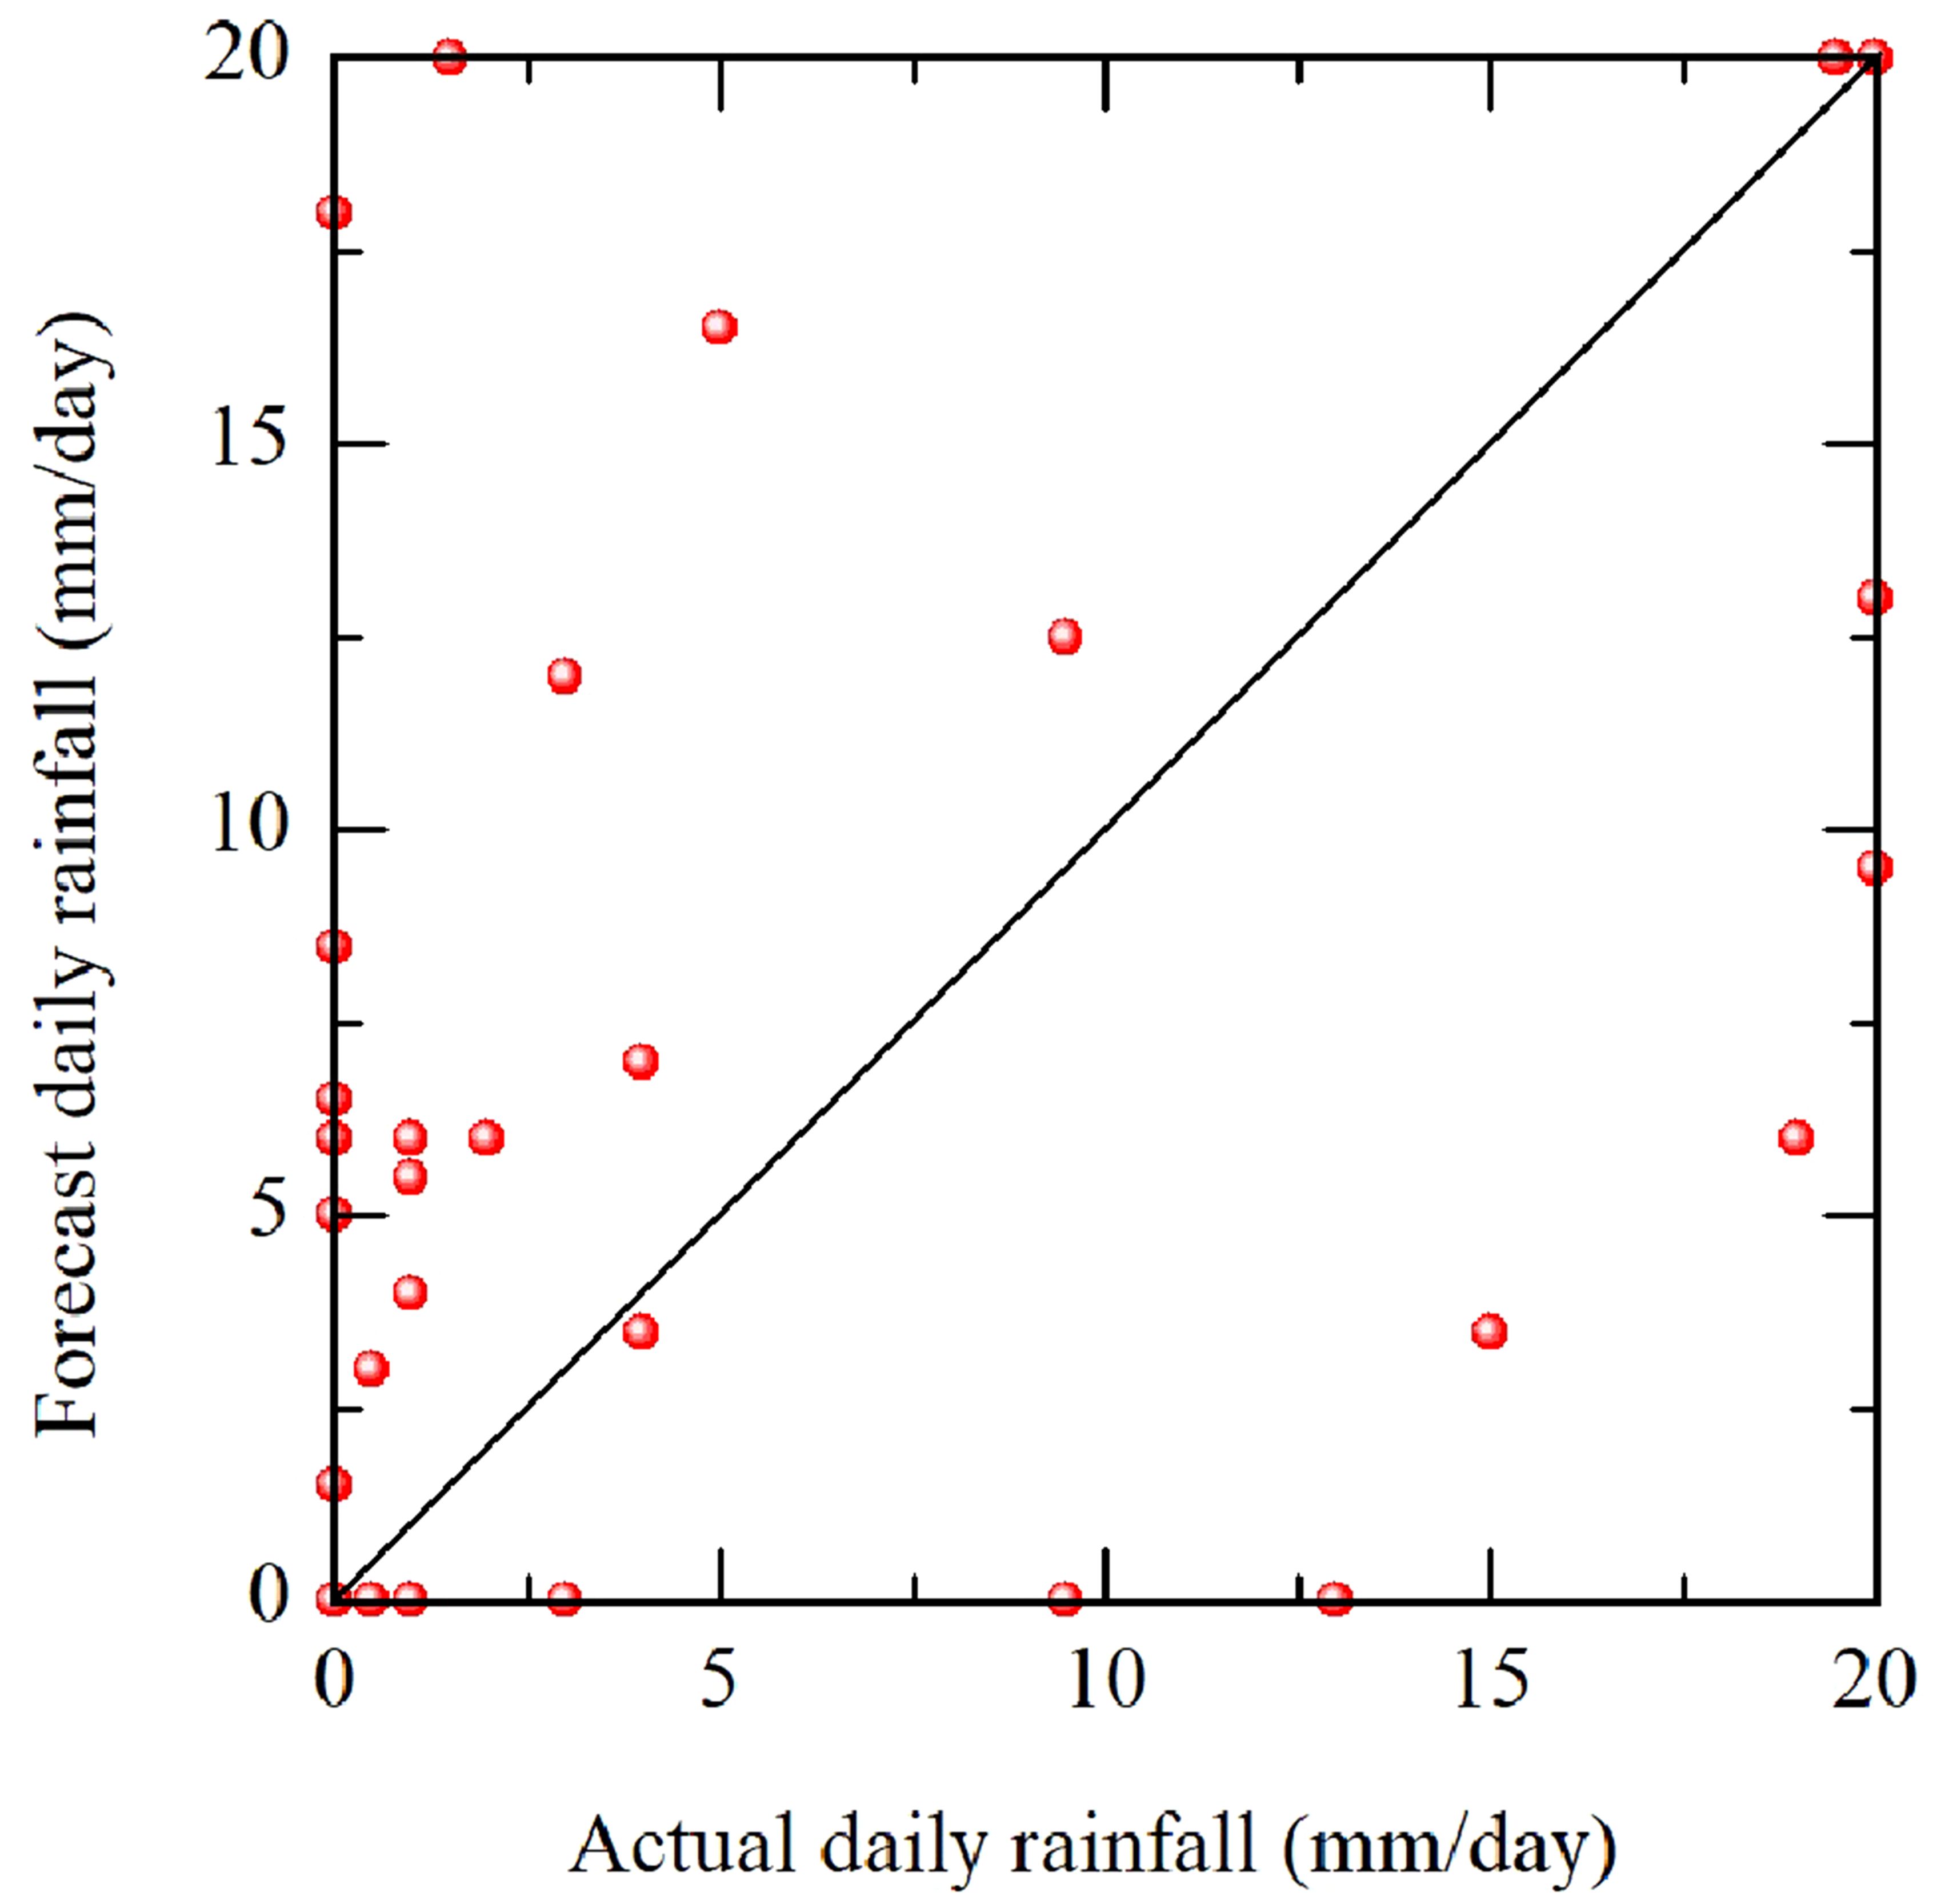
Figure 12. Comparison of forecast and actual daily effective rainfall for the entire growing season of the experimental period.
4 Conclusions
In this study, we evaluated the effectiveness of the proposed scheme in the determination of optimum irrigation depth that maximizes net income using a major crop, groundnut (Arachis hypogaea L.). This scheme combined local weather forecasts and a plant growth model to predict cumulative transpiration in response to irrigation depth. It also considers volumetric water pricing, which should be set at a high level that may give farmers incentive to save irrigation water. In this regard, a field study was carried out to assess the viability of the proposed numerical simulation scheme in comparison to an automated irrigation scheme triggered by soil suction. We compared both schemes in terms of total yield, applied irrigation, and net income. Both applied irrigation and total net income achieved by the numerical scheme resulted in a total of 1.28 and 2.18 times that of the automated irrigation scheme, respectively. This was because it achieved a 51% higher seed yield than the automated irrigation scheme. The overestimation of root water uptake parameters reduced the accuracy of VWC simulations, but in general, the model results matched the observed ones. This study was one of the initial investigations that was used in the development of the proposed numerical scheme. In comparison to earlier research, this novel scheme has the potential to maximize farmers' net income at each irrigation event and provide them with real-time estimates of how much they can gain within a specific time period. In contrast, it is difficult to set an optimum trigger value for controlling automated irrigation systems, and they are not always employed to boost farmers' net income. Based on this research and other studies published by the authors, the numerical scheme has a significant impact on determining optimal irrigation depths that boost farmers' net income when compared to the expensive automated irrigation methods.
Data availability statement
The raw data supporting the conclusions of this article will be made available by the authors, without undue reservation.
Author contributions
HB: Data curation, Formal Analysis, Investigation, Validation, Visualization, Writing – original draft. HF: Conceptualization, Funding acquisition, Project administration, Software, Supervision, Writing – review & editing. IT: Data curation, Methodology, Writing – review & editing. TS: Data curation, Methodology, Writing – review & editing.
Funding
The author(s) declare financial support was received for the research, authorship, and/or publication of this article. This research was funded by the Ministry of Education, Culture, Sports, Science and Technology (MEXT) as a part of the PhD study program.
Acknowledgments
We thank the technical staff of the Arid Land Research Center for their kind support with land and experimental facilities.
Conflict of interest
The authors declare that the research was conducted in the absence of any commercial or financial relationships that could be construed as a potential conflict of interest.
Publisher’s note
All claims expressed in this article are solely those of the authors and do not necessarily represent those of their affiliated organizations, or those of the publisher, the editors and the reviewers. Any product that may be evaluated in this article, or claim that may be made by its manufacturer, is not guaranteed or endorsed by the publisher.
References
Abd El Baki H. M., Fujimaki H. (2021). An evaluation of a new scheme for determination of irrigation depths in the Egyptian Nile Delta. Water 13, 2181. doi: 10.3390/w13162181
Abd El Baki H. M., Liang S., Fujimaki H. (2023). Simulation-based schemes to determine economical irrigation depths considering volumetric water price and weather forecasts. J. Water Resour. Plann. Manage. 149 (9), 04023043. doi: 10.1061/JWRMD5.WRENG-5801
Abd El Baki H. M., Fujimaki H., Tokumoto I., Saito T. (2017). Determination of irrigation depths using a numerical model of crop growth and quantitative weather forecast and evaluation of its effect through a field experiment for potato. J. Jpn. Soc Soil Phys. 136, 15–24. doi: 10.34467/jssoilphysics.136.0_15
Abd El Baki H. M., Fujimaki H., Tokumoto I., Saito T. (2018). A new scheme to optimize irrigation depth using a numerical model of crop response to irrigation and quantitative weather forecasts. Comput. Electron. Agric. 150, 387–393. doi: 10.1016/j.compag.2018.05.016
Abd El Baki H. M., Raoof M., Fujimaki H. (2020). Determining irrigation depths for soybean using a simulation model of water flow and plant growth and weather forecasts. Agronomy 10, 369. doi: 10.3390/agronomy10030369
Allen R., Pereira L., Raes D., Smith M. (1998). Crop evapotranspiration: guidelines for computing crop water requirements. FAO irrigation and drainage paper no. 56 (Rome, Italy: FAO), 135–142.
Boote K. J. (1982). Growth stages of peanut (Arachis hypogaea L.). Peanut Sci. 9, 35–39. doi: 10.3146/i0095-3679-9-1-11
Bozorg-Haddad O., Malmir M., Mohammad-Azari S. (2016). Estimation of farmers’ willingness to pay for water in the agricultural sector. Agric. Water Manage. 177, 284–290. doi: 10.1016/j.agwat.2016.08.011
Cancela J. J., Fandiño M., Rey B. J., Martínez E. M. (2015). Automatic irrigation system based on dual crop coefficient, soil and plant water status for Vitis vinifera (cv. Godello and cv. Mencía). Agric. Water Manage. 151, 52─63. doi: 10.1016/j.agwat.2014.10.020
Cornish G., Bosworth B., Perry C. (2004). Water charging in irrigated agriculture—An analysis of international experience (Rome, Italy: FAO), 19–26.
Datta S., Taghvaeian S., Ochsner T. E., Moriasi D., Gowda P., Steiner J. L. (2018). Performance assessment of five different soil moisture sensors under irrigated field conditions in Oklahoma. Sensors 18, 3786. doi: 10.3390/s18113786
Debaeke P., Aboudrare A. (2004). Adaptation of crop management to water-limited environments. Eur. J. Agron. 21, 433–446. doi: 10.1016/j.eja.2004.07.006
Delgoda D., Malano H., Saleem S., Halgamuge M. (2015). Irrigation control based on model predictive control (MPC): Formulation of theory and validation using weather forecast data and AQUACROP model. Environ. Model. Software 78, 40–53. doi: 10.1016/j.envsoft.2015.12.012
Feddes R. A., Raats P. A. C. (2014). “Parameterizing the soil-water-plant root system, unsaturated-zone modeling: Progress, challenges, applications,” in Wageningen UR frontis series, vol. 5 . Eds. Feddes R. A., de Rooij G. H., van Dam J. C. (Kluwer Academic, Dordrecht, The Netherlands).
Fereres E., Soriano M. A. (2007). Deficit irrigation for reducing agricultural water use. J. Exp. Bot. 58, 147–159. doi: 10.1093/jxb/erl165
Frnda J., Ďurica M., Rozhon J., Vojteková M., Nedoma J., Martinek R. (2022). ECMWF short-term prediction accuracy improvement by deep learning. Sci. Rep. 12, 7898. doi: 10.1038/s41598-022-11936-9
Fujimaki H., Abd El Baki H. M., Mahdavi S. M., Ebrahimian H. (2020). Optimization of irrigation and leaching depths considering the cost of water using WASH_1D/2D models. Water 12, 2549. doi: 10.3390/w12092549
Fujimaki H., Abd El Baki H. M., Toderichi K., Saito T., Onishi J., Jitsuno M. (2022). Optimization of irrigation depth for Mungbean considering the cost for water under a saline condition. J. Arid Land Stud. 32-S, 135–138. doi: 10.14976/jals.32.S_135
Fujimaki H., Tokumoto I., Saito T., Inoue M., Shibata M., Okazaki T., et al. (2014). “Determination of irrigation depths using a numerical model and quantitative weather forecast and comparison with an experiment,” in Practical applications of agricultural system models to optimize the use of limited water, vol. 5 . Eds. Ahuja L. R., Ma L., Lascano R. J. (ACSESS, Madison, WI, USA), 209–235.
Haro R. J., Dardanelli J. L., Otegui M. E., Collino D. J. (2008). Seed yield determination of peanut crops under water deficit: Soil strength effects on pod set, the source-sink ratio and radiation use efficiency. Field Crops Res. 109, 24–33. doi: 10.1016/j.fcr.2008.06.006
Heathman G. C., Starks P. J., Ahuja L. R., Jackson T. J. (2003). Assimilation of surface soil moisture to estimate profile soil water content. J. Hydrol. 279, 1–17. doi: 10.1016/S0022-1694(03)00088-X
Jamal A., Linker R., Housh M. (2019). Optimal irrigation with perfect weekly forecasts versus imperfect seasonal forecasts. J. Water Resour. Plann. Manage. 145, 06019003. doi: 10.1061/(ASCE)WR.1943-5452.0001066
Liang S., Abd El Baki H. M., An P., Fujimaki H. (2022). Determining irrigation volumes for enhancing profit and N uptake efficiency of potato using WASH_2D model. Agronomy 12, 2372. doi: 10.3390/agronomy12102372
Liang X., Liakos V., Wendroth O., Vellidis G. (2016). Scheduling irrigation using an approach based on the van Genuchten model. Agric. Water Manag 176, 170─179. doi: 10.1016/j.agwat.2016.05.030
Linker L., Sylaios G. (2016). Efficient model-based sub-optimal irrigation scheduling using imperfect weather forecasts. J. Comput. Electron. Agric. 130, 118–127. doi: 10.1016/j.compag.2016.10.004
Lorite I. J., Ramírez-Cuesta J. M., Cruz-Blanco M., Santos C. (2015). Using weather forecast data for irrigation scheduling under semi-arid conditions. Irrig. Sci. 33, 411–427. doi: 10.1007/s00271-015-0478-0
Mbabazi D., Migliaccio K. W., Crane J. H., Fraisse C., Zotarelli L., Morgan K. T., et al. (2017). An irrigation schedule testing model for optimization of the Smartirrigation avocado app. Agric. Water Manage. 179, 390–400. doi: 10.1016/j.agwat.2016.09.006
Minasny B., McBratney A. B. (2002). The efficiency of various approaches to obtaining estimates of soil hydraulic properties. Geoderma 107, 55–70. doi: 10.1016/s0016-7061(01)00138-0
Osroosh Y., Peters R. T., Campbell C., Zhang Q. (2015). Automatic irrigation scheduling of apple trees using theoretical crop water stress index with an innovative dynamic threshold. Comput. Electron. Agric. 118, 193─203. doi: 10.1016/j.compag.2015.09.006
Perera K. C., Western A. W., Nawarathna B., George B. (2014). Forecasting daily reference evapotranspiration for Australia using numerical weather prediction outputs. Agric. For. Meteor. 194, 50–63. doi: 10.1016/j.agrformet.2014.03.014
Ratnakumar P., Vadez V., Nigam S. N., Krishnamurthy L. (2009). Assessment of transpiration efficiency in peanut (Arachis hypogaea L.) under drought using a lysimetric system. Plant Biol. 11, 124–130. doi: 10.1111/j.1438-8677.2009.00260.x
Schattman R. E., Jean H., Faulkner J. W., Maden R., McKeag L., Nelson K. C., et al. (2023). Effects of irrigation scheduling approaches on soil moisture and vegetable production in the Northeastern U.S.A. Agric. Water Manage. 287, 108428. doi: 10.1016/j.agwat.2023.108428
Steduto P., Hsiao T. C., Raes D., Fereres E. (2009). AquaCrop: the FAO crop model to simulate yield response to water: I. Concepts and underlying principles. J. Agron. 101, 426–437. doi: 10.2134/agronj2008.0139s
Stirzaker R. J., Maeko T. C., Annandale J. G., Steyn J. M., Adhanom G. T., Mpuisang T. (2017). Scheduling irrigation from wetting front depth. Agric. Water Manage. 179, 306─313. doi: 10.1016/j.agwat.2016.06.024
United Nations (2012). World agriculture towards 2030/2050. ESA E working paper no. 12-03, 2012 (Accessed 12 September 2023).
van Dam J. C., Huygen J., Wesseling J. G., Feddess R. A., Kabat P., van Walsum P. E. V., et al. (1997). Theory of SWAP version 2.0: Simulation of water flow, solute transport, and plant growth in the soil-water-atmosphere-plant environment (Wageningen: Wageningen Agricultural University, Dept. Water Resources No. 71. DLO Winand Staring Centre).
Van Genuchten M. (1980). A closed-form equation for predicting the hydraulic conductivity of unsaturated soils. Soil Sci. Soc Am. J. 44, 892─898. doi: 10.2136/sssaj1980.03615995004400050002x
van Genuchten M. T. (1987). A numerical model for water and solute movement in and below the root zone, reserch report 121 (Riverside, CA, USA: U.S. Salinity Laboratory, Agricultural Research Service, United States Department of Agriculture).
Wang D. B., Cai X. M. (2009). Irrigation scheduling-role of weather forecasting and farmers’ behavior. J. Water Resour. Plan. Manage. 135, 364–372. doi: 10.1061/(ASCE)0733-9496(2009)135:5(364)
World Bank (2017). Enabling the Business of Agriculture 2017 (Washington, DC: World Bank). doi: 10.1596/978-1-4648-1021-3. License: Creative Commons Attribution CC BY 3.0 IGO
WWAP (World Water Assessment Programme) (2012). Managing water under uncertainty and risk-united nations world water assessment programme united nations world water development report 4 (Paris, France: The United Nations Educational, Scientific and Cultural Organization). Available at: http://unesdoc.unesco.org/images/0021/002156/215644e.pdf.
Xiong Y. J., Zhao S. H., Tian F., Qiu G. Y. (2015). An evapotranspiration product for aridregions based on the three-temperature model and thermal remote sensing. Journal of Hydrology 530, 392–404. doi: 10.1016/j.jhydrol.2015.09.050
Xiong Y., Luo Y., Wang Y., Traore S., Xu J., Jiao X., et al. (2016). Forecasting daily reference evapotranspiration using the Blaney–Criddle model and temperature forecasts. Arch. Agron. Soil Sci. 62, 790–805. doi: 10.1080/03650340.2015.1083983
Yanagawa A., Fujimaki H. (2013). Tolerance of canola to drought and salinity stresses in terms of root water uptake model parameters. J. Hydrol. Hydromech. 61, 73–80. doi: 10.2478/johh-2013-0009
Yang G., Liu L., Guo P., Li M. (2017). A flexible decision support system for irrigation scheduling in an irrigation district in China. Agric. Water Manage. 179, 378–389. doi: 10.1016/j.agwat.2016.07.019
Keywords: automated irrigation, soil water content, drought, transpiration, net income, numerical simulation
Citation: Abd El Baki HM, Fujimaki H, Tokumoto I and Saito T (2024) Optimization of irrigation scheduling using crop–water simulation, water pricing, and quantitative weather forecasts. Front. Agron. 6:1376231. doi: 10.3389/fagro.2024.1376231
Received: 25 January 2024; Accepted: 02 September 2024;
Published: 04 October 2024.
Edited by:
Asher Bar-Tal, Agricultural Research Organization (ARO), IsraelReviewed by:
Alaa Jamal, Agricultural Research Organization (ARO), IsraelRaphael Linker, Technion Israel Institute of Technology, Israel
Copyright © 2024 Abd El Baki, Fujimaki, Tokumoto and Saito. This is an open-access article distributed under the terms of the Creative Commons Attribution License (CC BY). The use, distribution or reproduction in other forums is permitted, provided the original author(s) and the copyright owner(s) are credited and that the original publication in this journal is cited, in accordance with accepted academic practice. No use, distribution or reproduction is permitted which does not comply with these terms.
*Correspondence: Haruyuki Fujimaki, ZnVqaW1ha2lAdG90dG9yaS11LmFjLmpw
 Hassan M. Abd El Baki
 Haruyuki Fujimaki
 Ieyasu Tokumoto3
 Tadaomi Saito