 Luis Orozco-Aguilar1*
 Arlene López-Sampson2*
 Luis A. Barboza3
 María José Borda2
 Mariela E. Leandro-Muñoz2
 Melanie Bordeaux4
 Rolando H. Cerda2Eusebio Ayestas Villega5Eduardo Somarriba2
- 1National Technical Office, The Tropical Agricultural Research and Higher Education Center (CATIE), Managua, Nicaragua
- 2Coffee, Cocoa and Agroforestry Unit, The Tropical Agricultural Research and Higher Education Center (CATIE), Turrialba, Cartago, Costa Rica
- 3Centro de Investigación en Matemática Pura y Aplicada (CIMPA), Universidad de Costa Rica, San Pedro de Montes de Oca, San José, Costa Rica
- 4Fundación NicaFrance, Finca La Cumplida, Matagalpa, Nicaragua
- 5Independent Consultant, National Agroforestry Consult in Perennial Crops, Leon, Nicaragua
Cocoa attainable yields are affected by a complex of pests and diseases in a particular agro-environment. Estimation of yield loss is critical for agronomic and economic decision-making at the farm level. For over 15 months, we monitored 1100 pods from six cocoa clones (PMCT-58, CC-137, CATIE-R1 CATIE-R4, ICS-95, and CCN-51) to assess the incidence of pests and diseases and to elucidate their survival behavior. Cocoa clones grow in a 12-year timber-based cocoa agroforestry plot (1330 cocoa plants ha-1, 100 shade trees ha-1, and 65% shade cover), in La Montaña, Turrialba, Costa Rica. Between 6-12 trees and 120-140 pods per clone of four size classes (very small – 2.5-7 cm, small – 7.1-14 cm, medium – 14.1-21 cm, and large – ≥21 cm) were tagged and measured fortnightly. Pods were selected at two vertical strata along the tree trunk (below and above 1.5 m) and grouped into three generations (rainy, transition, and dry). Competitive risk and survival analysis were performed per clone, generation, pod size class, and pod position along the tree trunk. Overall, pods reached maturity at the age of 155-165 days and were exposed to several hazards that disrupted their development. The Cox model that better described the cumulative risk during pod development included two covariables with substantial explicative power, generation, and clones. Regardless of clone and pod generation, a combination of diseases/pests accounted for about 45% to 65% of yield losses. The Kaplan-Meier survival analysis showed that pod survival was similar between generations but differed among clones within generations. Pods from CATIE-R1, CATIE-R4 and CC-137 clones showed greater survival rates than those of ICS-95, CCN-51 and PMCT-58 clones. The position of the pod along the tree trunk did not influence pod survival rates. We combined pod counting and pod survival rates calculated in this study and contrasted our yield estimations against a widely used prediction method proposed by a certification body. Overall, yield estimated using the UTZ method applied to 90-day-old pods of CATIE-R1 clone consistently overestimated yield predictions in the range of 27-45%. We proposed the combination of pod counting and pod index with a set of clone-specific discount factors; the survival rates, to reliably forecast on-farm cacao yields over time.
Introduction
The lifecycle of a cocoa pod; from pollination to maturity, lasts between five to six months, depending on germplasm and growing conditions (Daymond and Hadley, 2008; Cubillos, et al., 2019; Rojas et al., 2020; Romero Vergel et al., 2022). Development stages and pod growth patterns are well documented and have been modeled elsewhere (Maisin & Lamin, 2006; Ten Hoopen et al., 2012; da Silva and Savian, 2019). During their lifecycle cocoa pods face several risks or hazards that disrupt the normal growth pattern and prevent ripening (Niemenak et al., 2010; Goudsmit et al., 2023). Several risk factors such as the fruiting cycle, pod age, position on the tree, cocoa genotype, microclimate variables and agronomic management, which in turn affect attainable yield; have been identified (Phillips-Mora et al., 2013; Leandro-Muñoz et al., 2017; Armengot et al., 2020; Jaimez et al., 2020; Armengot et al., 2023).
Several methods for assessing pod production in cocoa breeding trials have been proposed and tested (Toxopeus, 1970; Atanda and Jacob, 1975; Lachenaud, 1984; Tahi et al., 2007). Pod counting is one method that has been routinely implemented to forecast cacao yields in medium and large-commercial plantations and even across production regions (Zaroni and Aidar, 1992; dos Santos Filho and Midlej, 2016; dos Santos Filho, 2018). This method entails counting the total number of pods of a certain pod size/age class and dividing the count by the pod index (number of pods required to obtain one kilogram of dry cocoa beans) of the specific cultivar/clone to estimate yields (Bartley, 1970; Lachenaud, 1984; Bastide et al., 2008). The method is practical, however; it must be accompanied by the correct estimation of the pod index to convert the pod production into actual dry bean yield for each cultivar/clone (Lachenaud, 1984; Lachenaud & Oliver 2005; Pang, 2006),. Other cocoa yield forecasting methods are based on the counting and scoring of active flower cushions and categorizing tree pod load, but these methods are seldom used and are less reliable (Tahi et al., 2007; dos Santos Filho and Midlej, 2016).
The applicability and reliability of the pod counting x pod index method faces several constraints in the field such as the need for repeated measurements to robustly estimate the pod index, the lack of farm production records and small farmers do not usually know the cocoa cultivar they planted, especially in seed-based cocoa plantations (Bastide et al., 2006; Ryan et al., 2009; Somarriba and Beer, 2011; Lachenaud and Oliver, 2005). Yield estimation at the farm and regional levels has been attempted with several degrees of success. For instance, Zaroni and Aidar (1992) combined pod counting and the development of fructification profiles during a cropping year to create a predictive model based on pod size class frequency distribution. Later, dos Santos Filho and Midlej (2016); building on the previous study, used pod counting in Bahia, Brazil to forecast production at the regional level and found that predictions varied between of 0.8% to 10.2% over consecutive years. Given this variability in production estimate, the authors cautioned on the need to quantify monthly cocoa production data at the farm level to validate yield predictions.
Tree pod load is characterized by pod generations or cohorts of different age and sizes, which physiologically developed under varying microclimatic and management conditions (Krauss et al., 2002; Leandro-Muñoz et al, 2017; Jaimez et al., 2020). Therefore, each pod generation is exposed to a distinct set of risks that eventually prevent them from being harvested (Krauss and Soberanis, 2001; Lamos-Dí́az et al., 2020; Ló́pez-Herná́ndez et al., 2018). Monilia infection success is determined by several factors, including pod wetness (Merchan, 1981; Porras-Umaña et al., 1985; Lamos-Díaz, et al., 2020), moreover; high relative humidity (80 to 100%) and warm temperatures (20 to 27°C) are suitable conditions for spore germination and for the fungal penetration (Leach et al., 2002; Leandro-Muñoz et al, 2017). Recently, Della Sala (2022) found that pod inter, and not intra-generational competition, increased total cherelle wilt, especially due to pods in the linear phase of growth. Hence, understanding the multiple risk factors affecting cocoa pod development and survival of cocoa cultivars; although pending, is crucial to reliably estimate crop yields and to better plan the agricultural calendar (Tahi et al., 2007; Phillip-Mora and Wilkinson, 2007; Aneani and Ofori-Frimpong, 2013).
Forecasting cocoa yields is of paramount importance for farmers, technicians, certification agencies, and farm managers which drives agronomic and economic decision-making (dos Santos Filho, 2018; Jaimez et al., 2020). This paper combined the pod counting method with competitive risk and survival analysis to better assess the impact of various risks on pod development and survival and to devise more reliable cocoa yield estimates at the farm level. We explored the following research questions: 1) To what extent does cocoa pod survival behavior differ between clones? 2) Does the vertical position of the pod influence pod survival? and 3) Do cocoa pods from different generations exhibit dissimilar survival behavior?
Methodology
Site description
The study was carried out in a cocoa-timber agroforestry system located in La Montaña site, Turrialba, Costa Rica (9. 88°N, 83.65°W, 600 m altitude, rainfall: 2600 mm year-1, temperature: 24-29 C°, relative humidity: 80%) (Figure 1). The site is on loamy soil (43% sand, 35% silt, 22% clay) with a mean pH of 5.6 and organic matter of 2.75%. The cocoa plantation is 12 years old; clonal, grafted cocoa was planted at 3.0 x 2.5 m (1333 plants ha-1) and managed with synthetic agrochemicals. Cocoa plants were fertilized three times a year (200 g plant-1 event-1, NPK, 15-15-15) and pruned twice a year. Weeding was done manually three times a year. Lime is applied once a year to mitigate the soil pH (0.25 tons ha-1). The cocoa plantation is on a flat terrain and no irrigation is provided.
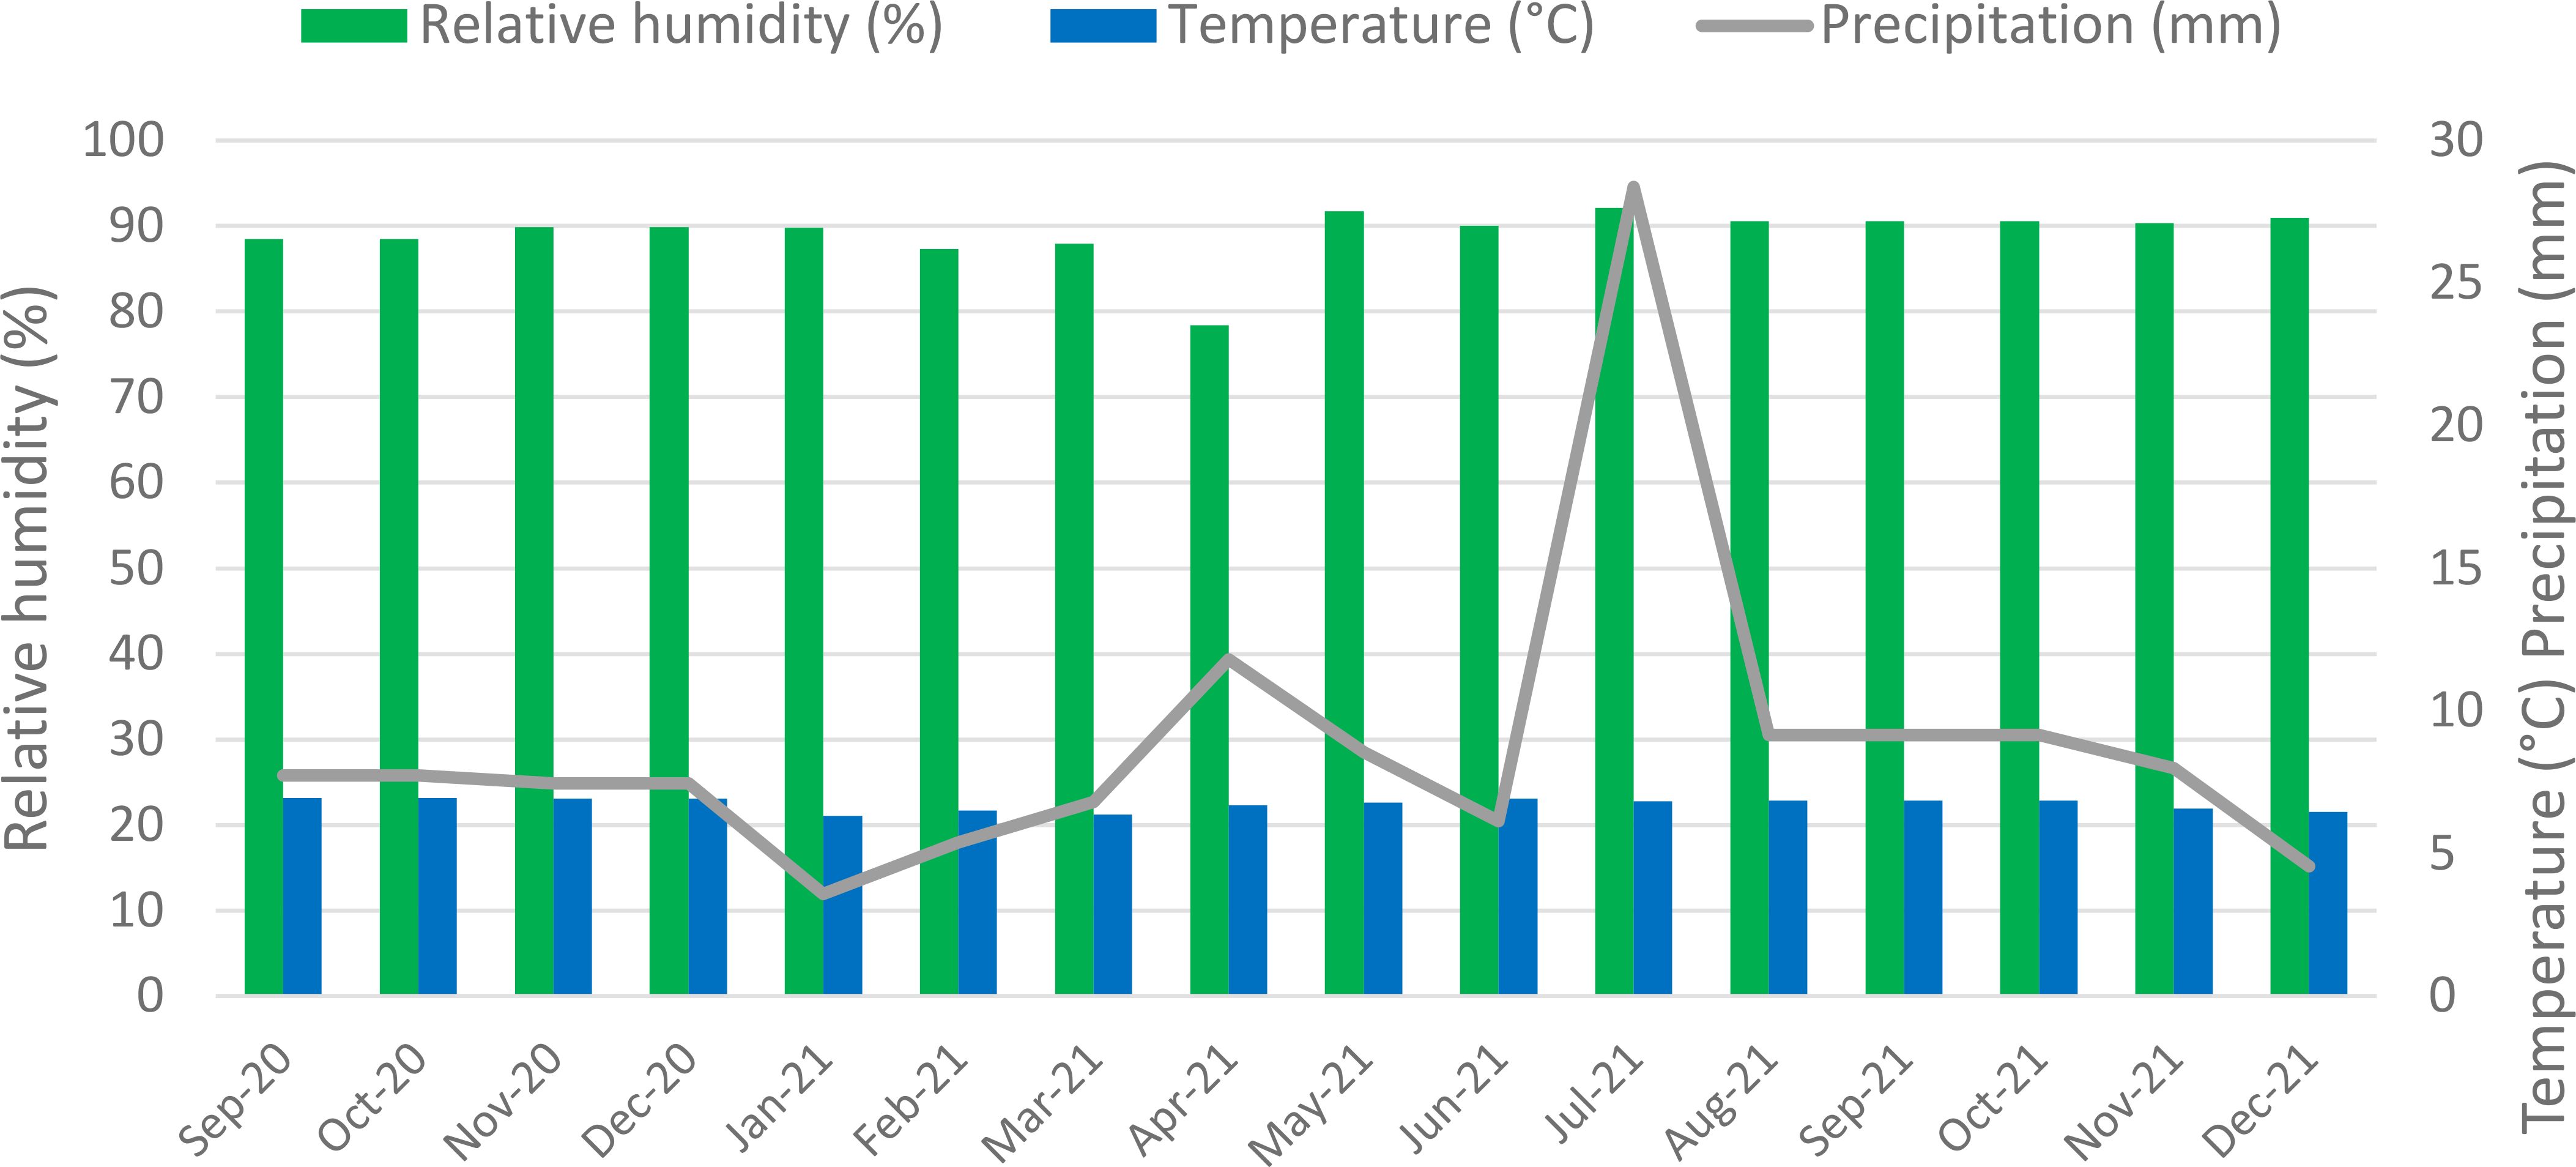
Figure 1 Mean daily relative humidity (%), temperature (°C) and precipitation (mm) over 16 months in La Montana, Turrialba, Costa Rica. CATIE’s weather station # 73173. Green bars represent relative humidity; blue bars denote temperature, and the grey line indicates precipitation.
The shade canopy includes two timber species (Cordia alliodora and Swietenia macrophylla) planted at 10 x 10 m (100 trees ha-1), with annual tree cover between 50-70% (varies according to seasonal tree phenology). C. alliodora and S. macrophylla trees occurred at 40:60 ratio, respectively. Shade tree management consists of pruning of lower branches and thinning when needed (Somarriba et al., 2021). No shade regulation was performed during the timeframe of this study. C. alliodora trees have full foliage between June and January but partially lose their canopy foliage between February and May at the following monthly rates: 25% loss in February, 50% loss in March, 80% loss in April, 50% in May and 25% in June. In Central America, S. macrophylla trees retain their canopy over eight months and lose their foliage during the four-month dry season (February-April) (Suarez-Islas, 2008, Somarriba et al., 2014).
Cocoa clones, tree selection and measurements
We assessed six cocoa clones (CATIE-R1 CATIE-R4, PMCT-58, CC-137, ICS-95 and CCN-51) and monitored 5 to 12 trees per clone and between 120 to 270 pods per tree over 15 months (Table 1). Assessed clones, except CCN-51, are the set of clones developed within the CATIE’s cacao breeding program which have been distributed as new planning material across Central America since 2010 (Phillips-Mora et al., 2015; CATIE, 2013). CCN-51, a high-yielding clone grown mainly in Ecuador, Peru, and Colombia, is not yet a commonly used clone in the region, but it was included as a control (Jaimez et al., 2022). For each cocoa tree, the following variables were recorded once: 1) trunk diameter (measured in cm at 30 cm above ground), 2) tree height (measured in m from the base up to the treetop) 3) number of all main and secondary branches and 4) length (m) of productive tissue (the addition of all segments from main and secondary branches up to 2.5 cm width and 2.5 m high) (Leandro-Muñoz et al., 2017). The trunk diameter was measured using a diameter tape and tree height was estimated with a measuring pole. Selected cocoa trees and pods were monitored fortnightly for 15 months including three different “weather seasons” (rainy, transition, and semi-dry) and covering the main and secondary harvest peaks. All selected trees were surrounded by at least three trees of comparable size and vigor i.e. under 75-100% competition status (Toxopeus, 1969; Ayestas et al., 2013; Wibaux et al., 2017).
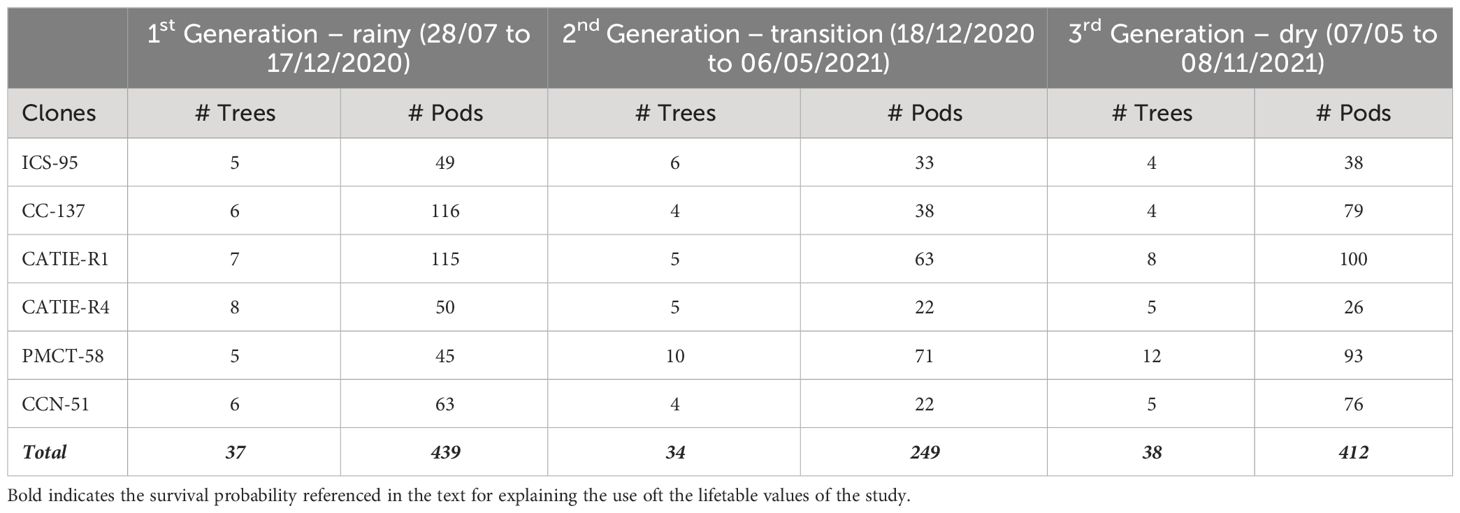
Table 1 Number of trees and pods per generation and cocoa clone monitored over 15 months in La Montana site, Turrialba, Costa Rica.
Cocoa pod measurements and risk recording
Between 120-270 cocoa pods per clone from 2.5 cm in length, were tagged and grouped in two cocoa tree vertical strata (below and above 1.5 m). Vertical distribution of pod load on a given tree has proven to face distinct microclimate affecting monilia epidemiology, which in turn affects pod infestation (Leach et al., 2002; Phillips-Mora et al., 2015; Leandro-Muñoz et al., 2017). Tagged pods were then grouped into four size classes according to pod length: very small (2.5-7 cm), small (7.1-14 cm), medium (14.1-21 cm), and large (over 21 cm) and three seasons (rainy, transition, and dry). Pod diameter (mm) and length (mm) were measured fortnightly using a digital caliper (Figure 2). Fortnightly evaluations are in line with pod harvest periodicity recommended to farmers in Costa Rica (Phillips-Mora et al., 2006; CATIE, 2013).
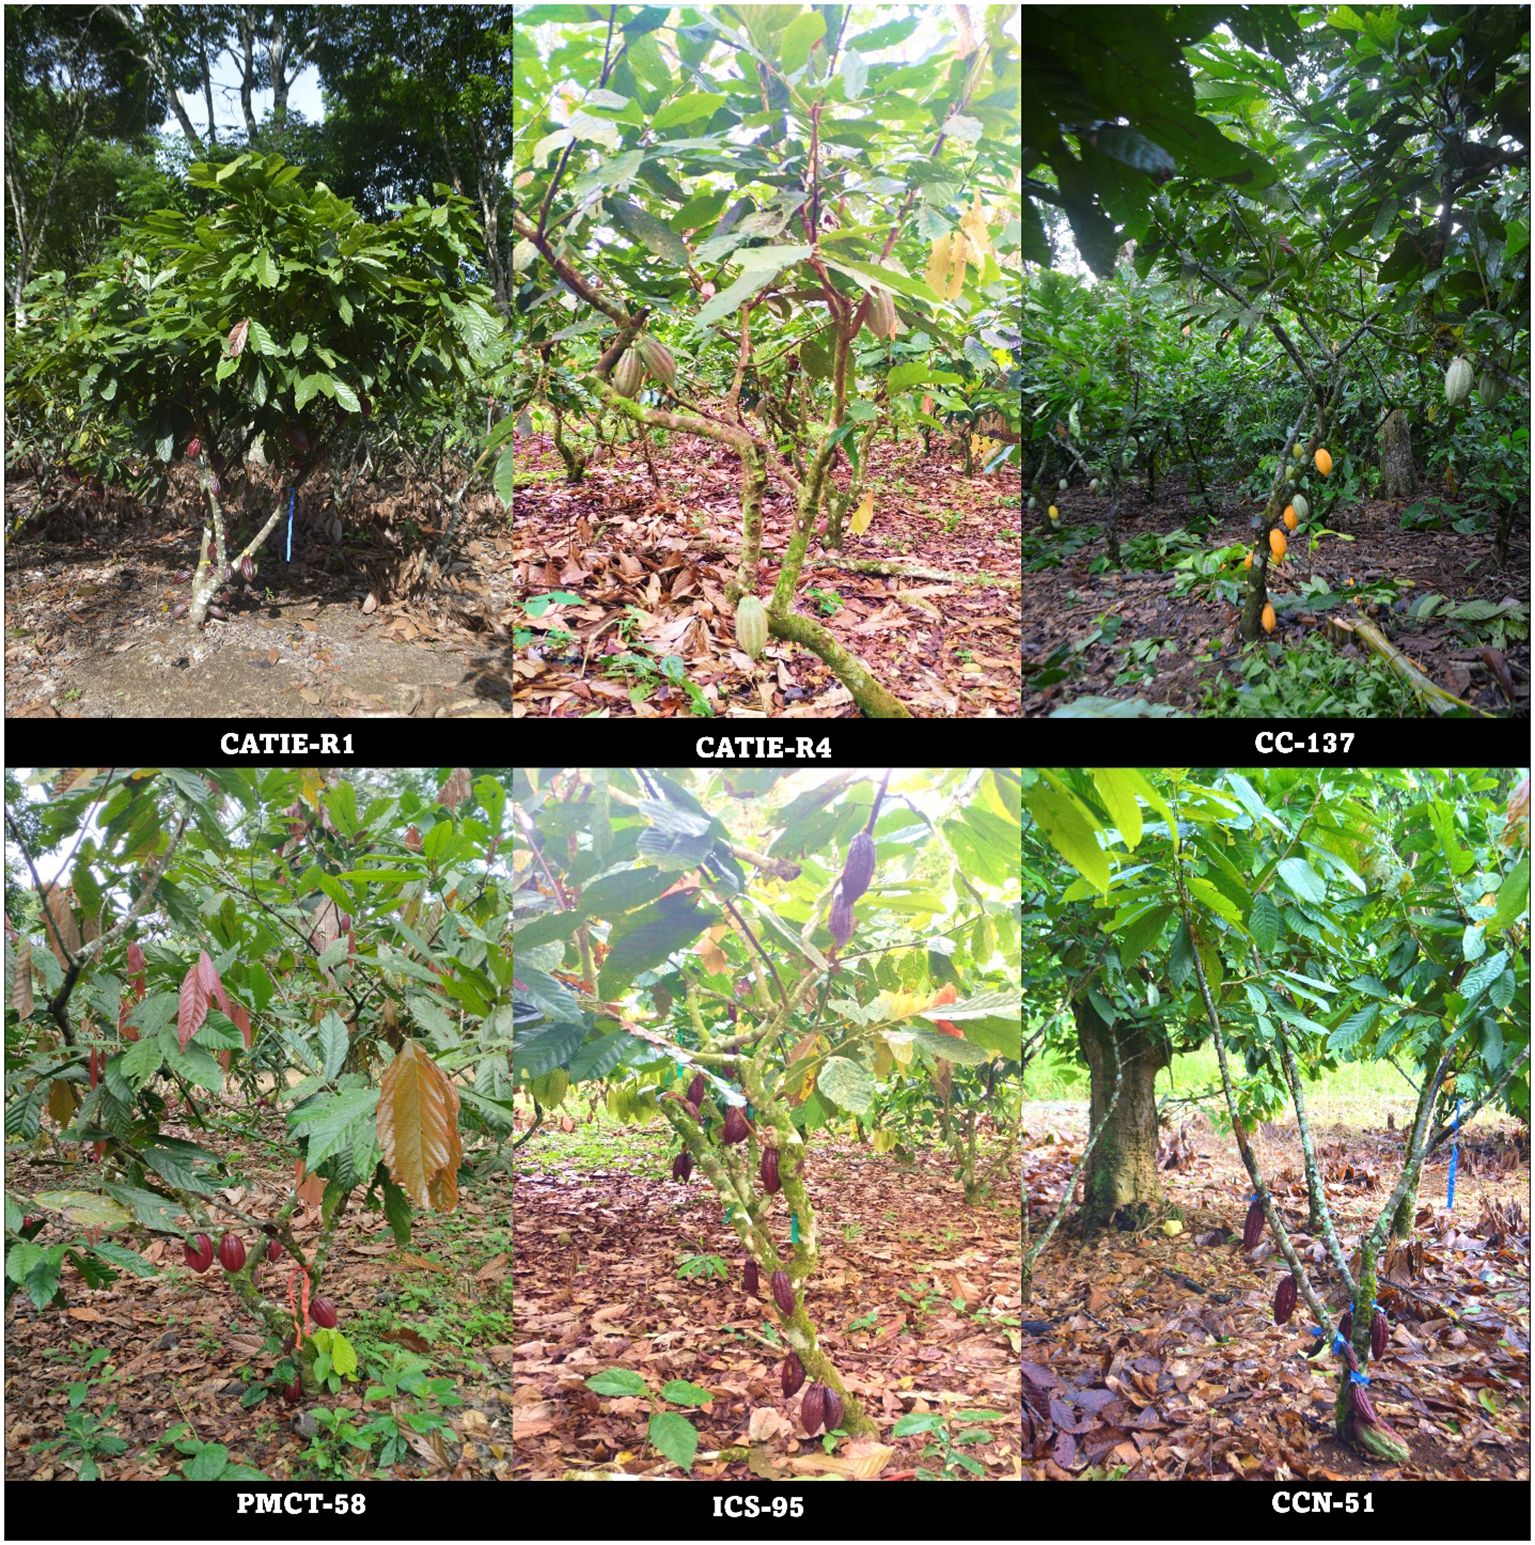
Figure 2 Architectural features and tagged pods along the tree trunk of the six cacao clones assessed in the La Montaña site, Turrialba, Costa Rica. Photo: Maria Jose Borda.
In total, 1100 were studied. Each time a pod was inspected; its health status was recorded in one of five classes: 1) healthy, 2) affected by cherelle wilt, 3) diseased (frosty pod rod – Moniliophthora roreri, black pod – Phytophthora palmivora), 4) damaged by pests (birds, squirrels, and others namely insects or rats) or 5) harvested. Pictures of affected pods were taken to further verify the main hazard responsible for pod failure. When two or more hazards were observed, the most severe infection/damage was recorded as the main reason for pod failure. Harvested pods were those that reached maturity and were eventually collected by the operator for post-harvesting. A mature and harvested pod was determined by changes in size and color as indicated in the CATIE’s catalog (CATIE, 2012).
Data analysis
Data on cocoa tree architectural features (trunk diameter, tree height, number of branches and length of the productive tissue, etc) was analyzed with descriptive statistics and the Tukey test (0.05). Using data from pod counting and pod health status we built survival curves per clone using the Kaplan–Meier survival method, a non-parametric statistic (Kaplan and Meier, 1958; Etikan et al., 2017). The Kaplan–Meier survival analysis has been used to assess the survival probability of cocoa seedlings under water stress (Anokye et al., 2021). Following Kaplan–Meier guidelines, pods classified as diseased/damaged were treated as uncensored data while healthy and harvested pods were treated as censored data. Tagged pods were approximately 15-22 days old, thus survival time was calculated as the number of days between pod tagging and the date when each pod was recorded as diseased/damaged. A lifetable that summarizes survival data in terms of the number of risks/events and the proportion of pods surviving at each event time point was devised.
The Cox regression analysis (Cox, 1972; Klein et al., 2016) was used to elucidate the hazard/risk ratio and survival of pods as functions of clone, generation, pod position on the tree trunk, and pod size class. To examine the risk of cherelle wilt, diseased (pods affected by black pod and frosty pod rot were pooled), and pests (squirrels and birds were pooled) under different choices of the covariables generation, clone, pod position, and pod size class; we calculated the cumulative incidence of each of the three risks using the Aalen–Johansen estimator (Aalen and Johansen, 1978). After combining the three risks (cherelle wilt, diseases, and pests), we estimated a Cox model to explore the relationship between the most significant covariates and the time of occurrence of the first observed risk over pod development ( Lockwood and Yin, 1996; Lachenaud and Oliver, 1998; Beyersmann et al., 2012; Takan et al., 2013). During the initial adjustment of the Cox model, all four covariates under study were considered: pod generation, clone, pod position and pod size class. However, the covariate pod size did not contribute significantly to explaining the combined risks, hence we excluded pod size from the final Cox model. The Cox model with the best fit in terms of standard metrics such as AIC or BIC (Bozdogan, 1987) for this study was:
Where:
● : the hazard rate at time t for an individual with covariate values X.
● : the baseline value of the hazard function.
● b1 and b2 are the regression coefficients associated with the covariates generation (X1) and clone (X2), respectively.
Finally, in order to demonstrate the simplicity and applicability of clones’ survival rates to more accurately estimate yield at the farm level and over time, we used pod counting data across three CATIE-1 pod generations and contrasted yield estimates using the UTZ method (UTZ, 2016) for 90 days old pods against yield estimates derived from pod survival rates calculated in this study for pods of similar age. Yield differences were then expressed as the proportional difference between methods (over or under estimations).
Results
Tree architectural features
Cocoa tree trunk diameter, number of main branches, and length of productive tissue were similar among sampled trees (p-value, 0.0715) (Table 2). The tree trunk diameter ranged from 8.5 cm for clone CATIE-R1 to 17.2 cm for clone CC-137. On average, trees exhibited three main branches, indicating proper pruning and a well-balanced crown. The length of productive tissue varied from 4.2 m for clone CATIE-R1 to 18.8 m for clone CC-137. The clone with the lowest value of all the tree’s architectural features was CCN-51. Although tree height might be influenced by the pruning regime (frequency and intensity), it was the only statistically different architectural variable among sampled trees (p-, 0.0237). About 60% of the total pod load occurred in the lower tree strata (below 1.5 m) and 40% of the pods occurred in the upper strata (above 1.5 m).
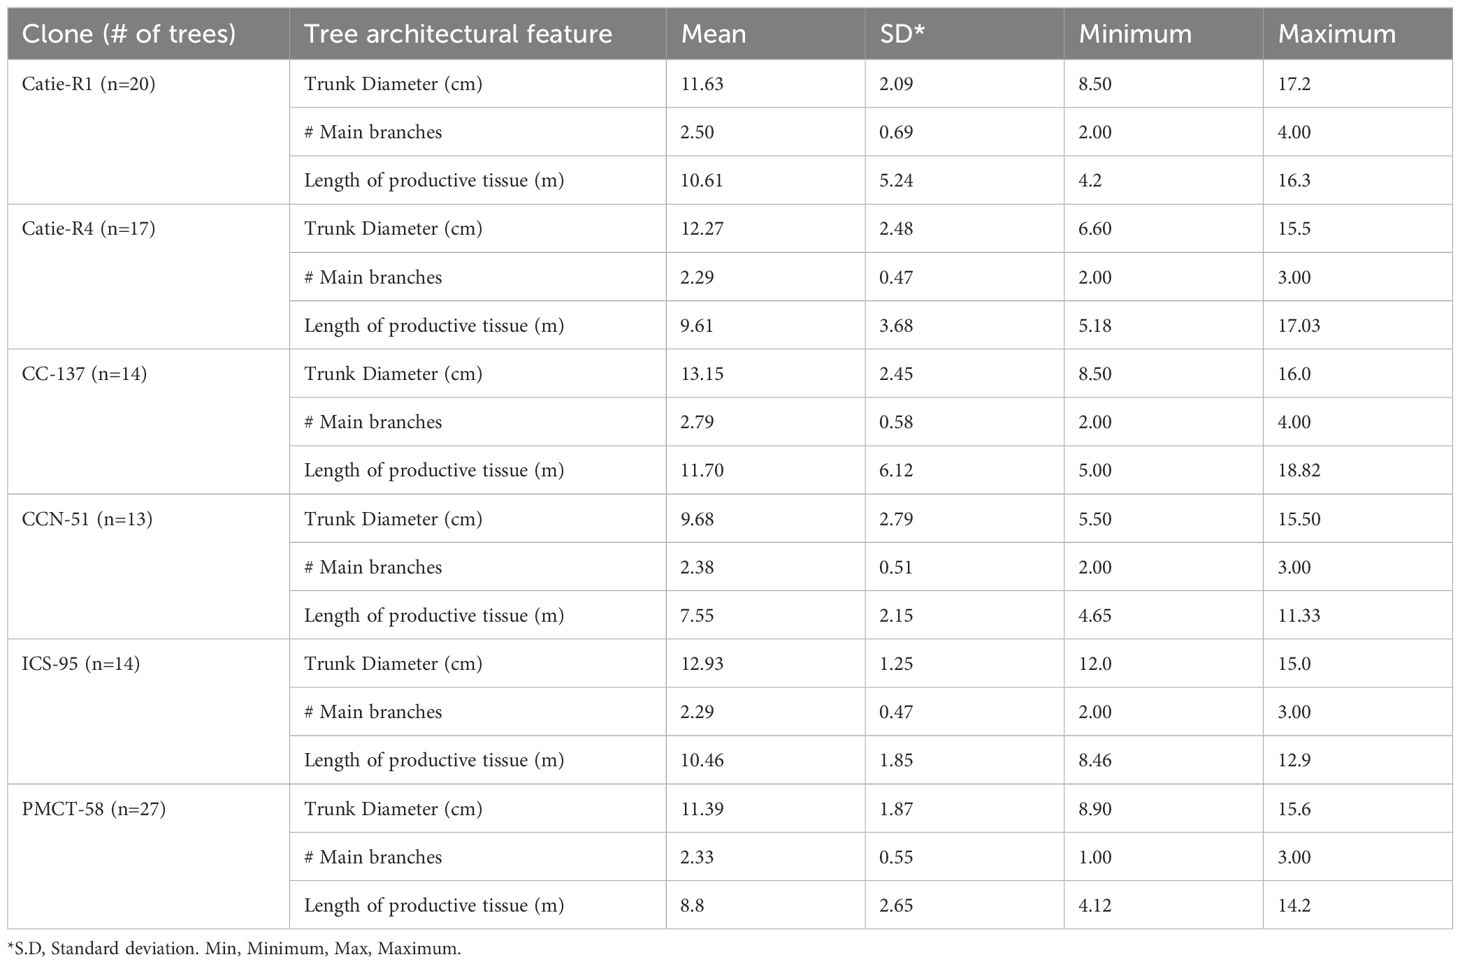
Table 2 Descriptive statistics of trees’ architectural features of sampled cocoa clones.
Pod development, health status and hazards
Regardless of clones, pods reached maturity and were harvested between 150-165 days (about 5.5 months) after tagging. During pod development, pods experienced a set of risks that depended on pod generation, clones, and pod size class (Figure 2). The cumulative incidence of cherelle wilt showed a marked difference between pod generations, for instance; third-generation pods were more affected by cherelle than those of the first and second generations (p = 6.18 x 10⁻⁷). The risk of cherelle differed among clones, CCN-51, CC-137, and ICS-95 were more affected by cherelle wilt than CATIE-R1, CATIE-R4 and PMCT-58 (p= 0.0023). As expected, the risk of cherelle wilt of small pods was higher during the first 30-45 days of pods lifespan (Figure 3). The risk of facing disease incidence was similar between pod generations and pod size classes but differed among clones. For instance, from day 75-120 both ICS-95 and CCN-51 showed the highest risk of diseases while CATIE-R1, CATIE-R4, CC-137, and PM-CT85 faced the lowest risks. The differences among these clones in cumulative disease between pod generations was small. On one hand, first and third-generation pods were more heavily affected by Cherelle wilt, similarly injured by diseases, and less damaged by pests. On the other hand, second-generation pods faced the lowest risk of cherelle wilt but the greatest risk of pest damage. Third-generation pods exhibited the greatest risk of cherelle and diseases but recorded the lowest risk of pest damage.
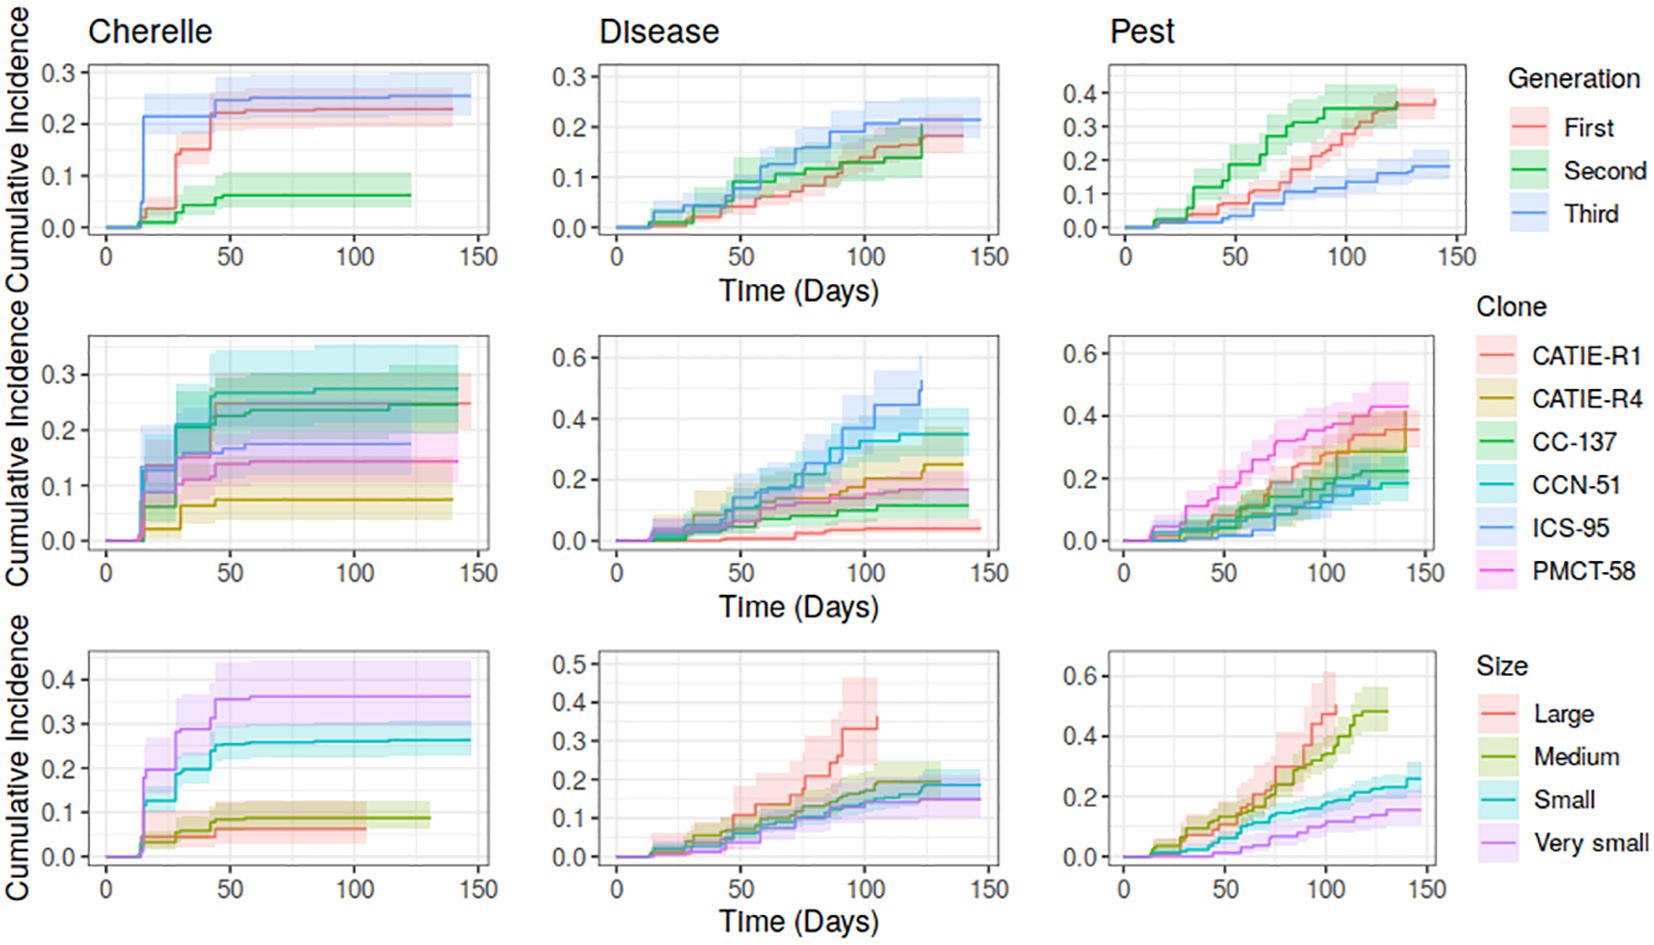
Figure 3 Cumulative incidence estimates for each risk (Cherelle, Disease and Pest) by Generation (upper panel), Clones (medium panel) and Pod Size (lower panel). Shaded areas for each incidence estimate represent the confidence intervals values at 95%.
CCN-51, PMCT-58 and CATIE-R4 clones were the most affected by pests’ damage, mainly when pods were more than 100 days old. Large-sized pods had a higher risk of diseases once they reached 60 days of exposure. Regardless of generation, clone, and pod size class, the greater exposure to disease risk was recorded between 80 to 120 days of pod development. Medium and large-size pods had the highest incidence of pest damage as squirrels and birds feed on nearly mature pods (Figure 3).
Overall, second-generation pods (within the transition period) faced the lowest combined risk, followed by those of the first-generation (pods within the rainy season) and third generation (pods within the dry season). The clone with the lowest combined risk was CATIE-R4, followed by CATIE-R1 and CC-137. Regardless of generation, clone, and pod size class, both CCN-51 and ICS-95 showed the highest combined risks over time.
The Cox model for cumulative risk
The model that better described the cumulative risk during pod development included two covariates with substantial explicative power namely generation and clone. The pod position along the trunk had no significant effects on combined pod risks. The Cox model adjustment parameters are shown in Table 3. Based on these parameters, we can highlight the following aspects:
● There was a 45.4% (16.6-81.4%) increase in the risk of any event facing first-generation pods compared to those of second-generation pods.
● Although not significant, there was a 22.3% (2.5-53.3%) increase in the risk of any event facing third-generation pods compared to that of second-generation ones.
● There is no significant difference in terms of cumulative risk between a pod of CATIE-R4, CC-137 and those from CATIE-R1 clones.
● There was a 99% increase (43.1-176%) in the risk of any event faced by pods of CCN-51 clone compared to those of CATIE-R4 clone.
● There was an 81.6% increase (28.4-156%) in the risk of any event faced by pods of ICS-95 clone compared to pods of CATIE-R1 clone.
● There was a 75.1% increase (27-141%) in the risk of any event facing pods from PMCT-58 clone compared to those of CATIE-R1 clone.
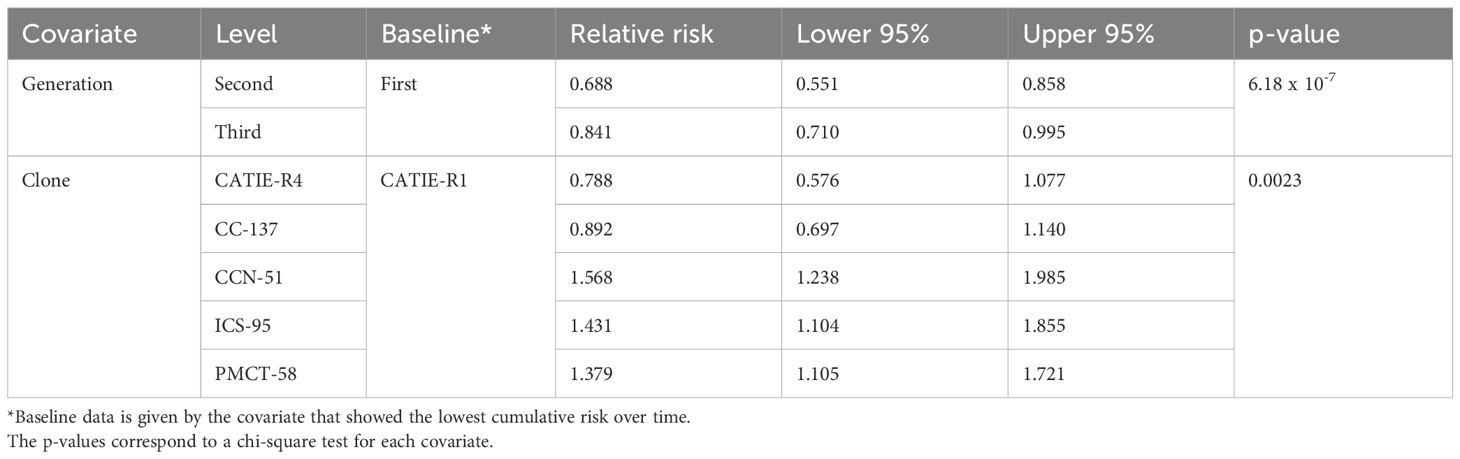
Table 3 Relative risk values from the adjusted Cox model with their 95%-confidence intervals.
Using the Cox model estimates, survival curves for each pod generation and each clone were developed. Pods’ survival behavior was similar between generations but different among clones (Figure 4). Pods of CATIE-R1, CATIE-R4 and CC-137 clones clearly showed greater survival rates than those of ICS-95, CCN-51 and PMCT-58 clones. For instance, about 50-55% of the pods of CATIE R1, CATIE-R4 and CC-137 clone reached maturity and were harvested, while only 30-35% of the pods of ICS-95, CCN-51 and PMCT-54 clones reached maturity and were harvested. These findings suggest that, in this environment and under this management regime and regardless of pod generation, a combination of diseases/pests accounted for about 45% to 65% of yield losses.
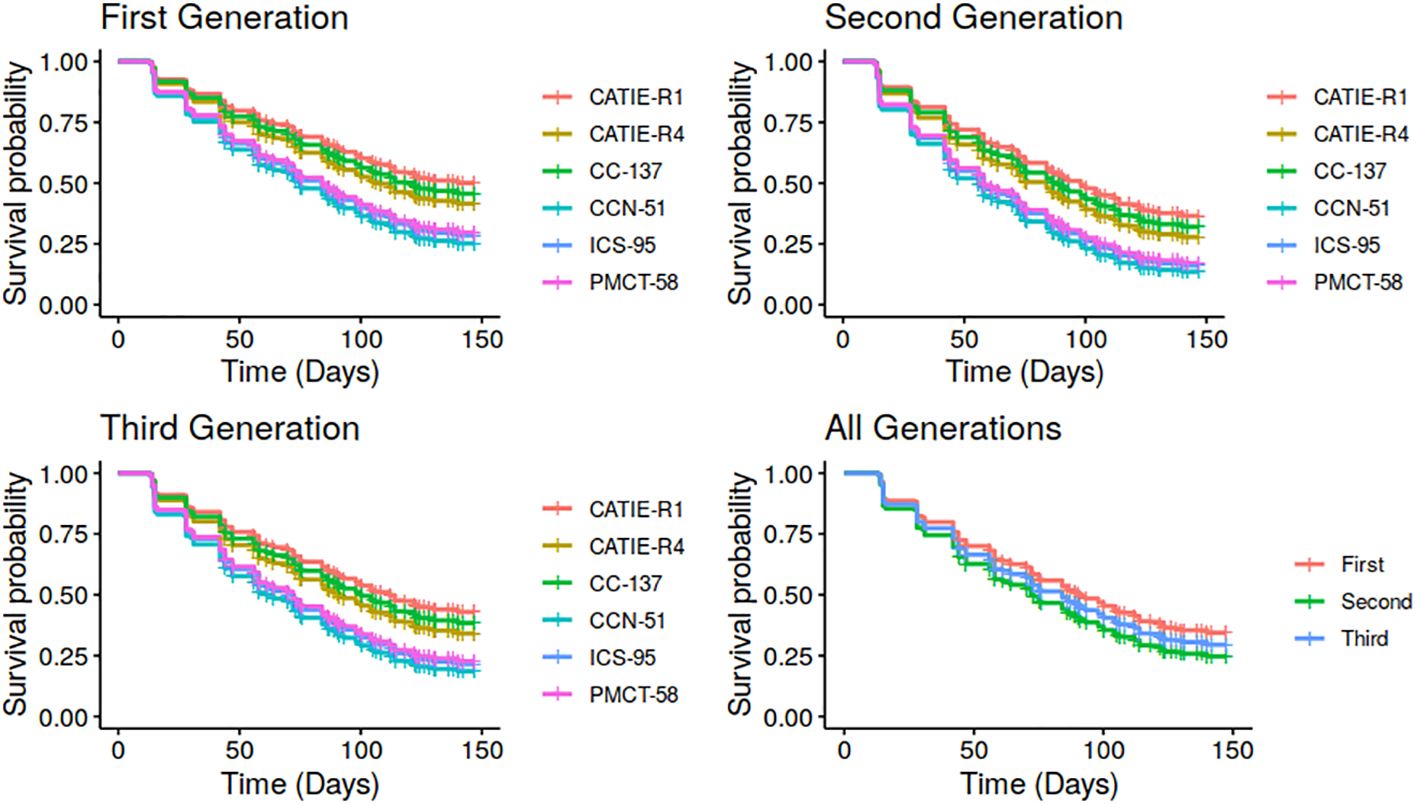
Figure 4 Estimated survival curves over time of pod load per cocoa clone and generation derived from the Cox model parameters estimated in this study.
Clone-specific discount factors: a proposal
We propose to use the combination of pod counting and the clone-specific discount factors with the clones’ corresponding pod index to reliably estimate cocoa yields at the farm level. A lifetable that summarizes survival data of clone CATIE-R1 in terms of the number of risks/events and the proportion of pods surviving at each event time point is presented in Table 4. Survival data given in Table 4 can be used in two novel ways: 1) the user wants to know the survival probability overtime to forecast cocoa yields for small pods and 2) the user might want to know the survival probability at a given timeframe to forecast cocoa yield by counting a certain pod size class, namely pods of 3 months old. In the first case, the user must consider the survival data from day 13 to 150 as presented in Table 4; in the second case; assuming that the user has counted several pods about 3 months old and wants to forecast yield, the user must take the conditional probability from when pods will be potentially harvested (150 days) and divided this data by the survival probability when pod counting took place (90 days). For instance, a small second-generation pod of CATIE-R1 clone has a survival probability to reach 150 days of 0.415 and the probability of the same pod reaching 90-day days is 0.580, thus the conditional survival probability of a 90-day pod to be potentially harvested at day 150 is given by 0.415/0.580 = 0.715. The user must repeat the same operation to devise the survival probability of any cocoa pod from distinct generations, clones, and pod ages at and different timeframes.
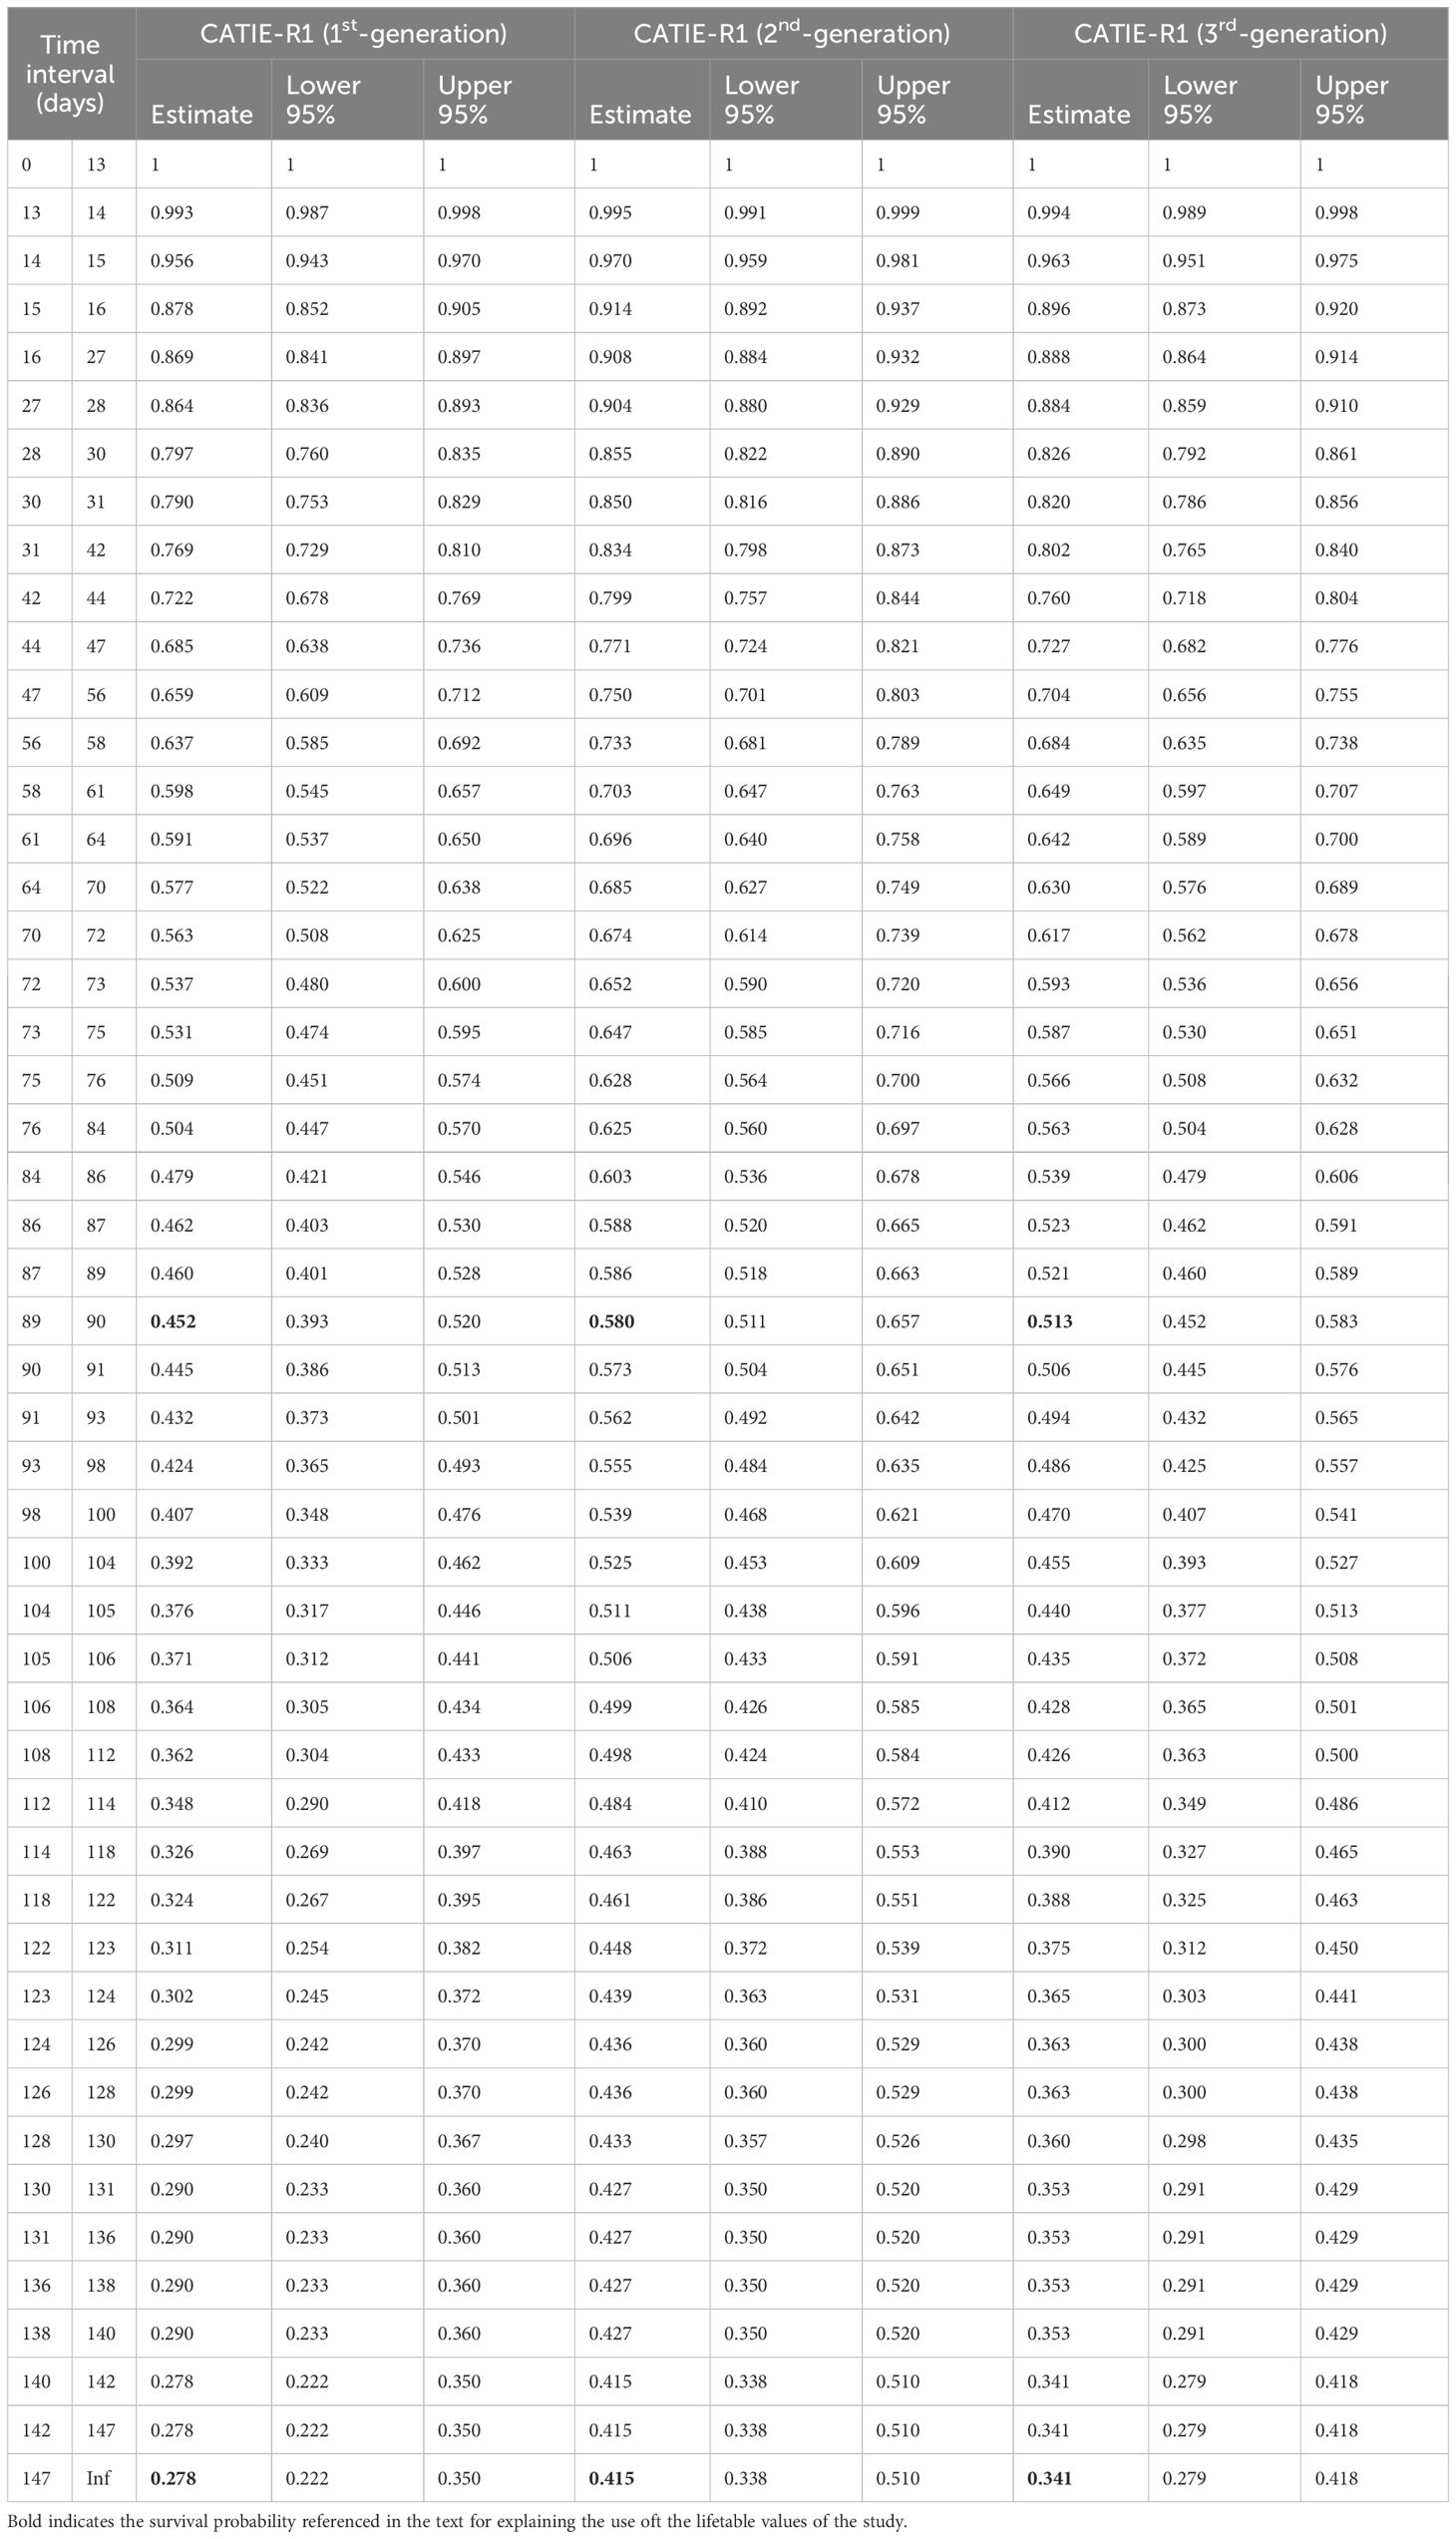
Table 4 Lifetable showing the proportion of CATIE-R1 pods surviving at each event time point and the corresponding lower and upper confidence intervals.
Comparative estimate of cocoa yields
The UTZ method applied to a set of 90-day-old pods of CATIE-R1 clone across generations consistently overestimated yield predictions in the range of 27-45% (Table 5). This comparative exercise confirmed the simplicity of the pod counting x pod index coupled with the clone-specific survival rate to forecast cacao yield more accurately at the farm and over time.
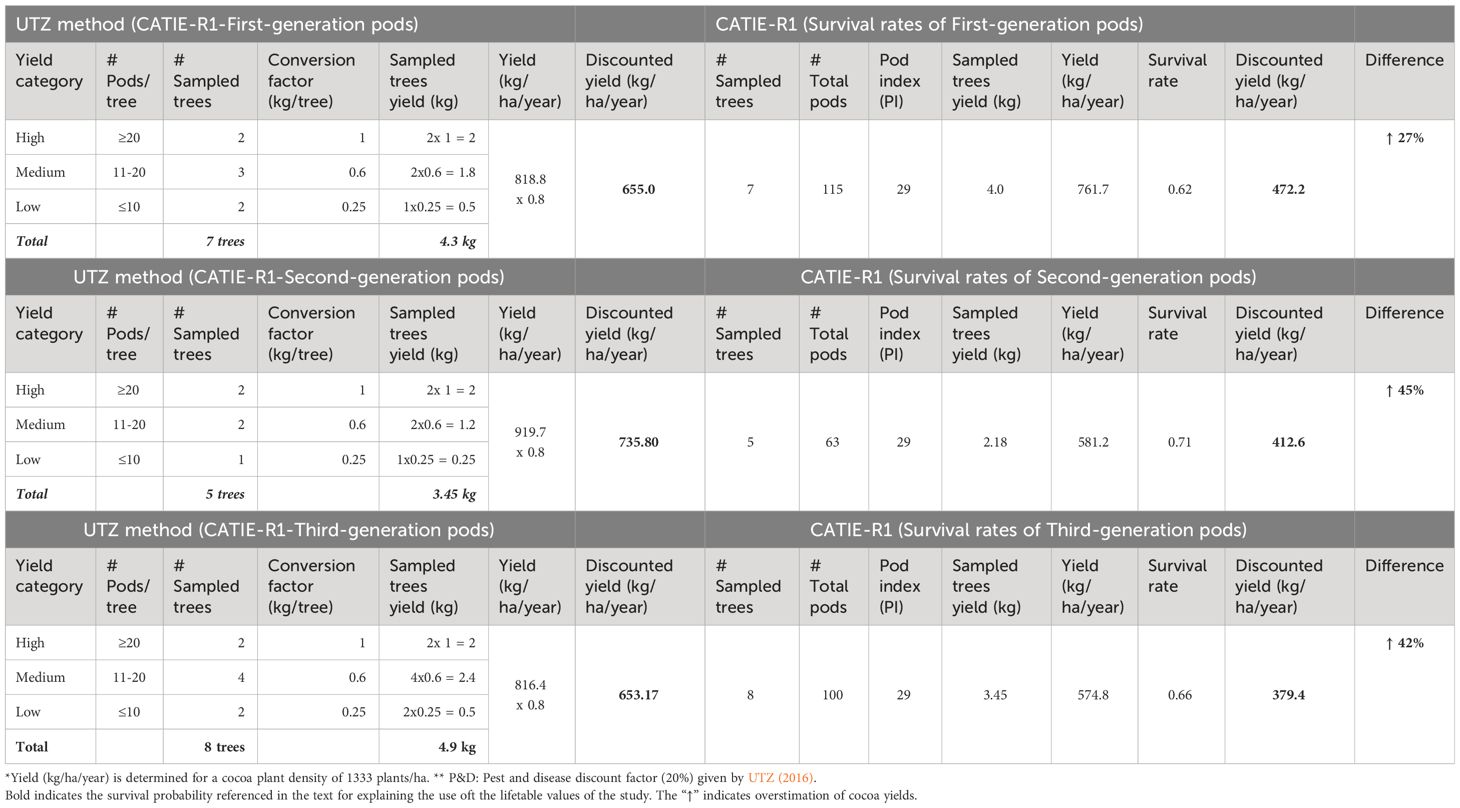
Table 5 Comparative yield estimations using UTZ (2016) method and clone-specific survival rates estimated in this study.
Discussion
By combining pod counting and risk and survival analysis we were able to elucidate the relative importance of a set of risks that disrupted pod development of six cacao clones over time. Regardless of clone, pod generation, and pod size class, the combined risks affecting attainable yields in this study ranged from 35 to 65%. Nevertheless, individual risks affected pod size class differently and occurred at different points in the life cycle of the pod. For instance, small pods aged 30-45 days were heavily affected by cherelle wilt which accounted for 18-25% of pod losses. In line with Daymond et al. (2002); Bastide et al. (2006) and Wibaux et al. (2017); this finding suggests that small pods cannot be included in pod courting exercises for yield predictions. Cherelle wilt is a physiological mechanism in cocoa to self-regulate tree pod load (Melnick, 2016; de Almeida and Valle, 2007; Della Sala, 2022). Moreover, medium size pods were more likely to be exposed to the risk of diseases between 60-100 days of pod development (accounting for 20-35% of pod losses), this risk was higher for third-generation pods, which experienced a hotter and more humid environment than pods from the first and second generations. Medium to large pods aged 110-130 days were more exposed to the attack of pests namely squirrels and birds, which accounted for 12-15% of total pod losses. Understanding the set of risks in a cocoa plantation can help farm managers apply a timely and more effective integrated pest and disease plan (Leach et al., 2002; Quiroz and Amores, 2002; Krauss et al., 2013; Armengot et al., 2020).
The effect of clone on risk avoidance and pod survival
In this study, the effect of “clone” significantly affected the ability of pods to avoid deadly risks and survive over time. CATIE-R1, CATIE-R4 and CC-137 clones were less affected by cherelle wilt, diseases, and pests while PMCT-58, ICS-95 and CCN-51 were more prone to the combination of these risks. This finding is in line with the reported inherent tolerance of CATIE’s clones against frosty pod rot and black pod (Phillips-Mora et al., 2007; Phillips-Mora and Wilkinson, 2007; Phillips-Mora et al., 2013; Mata-Quirós et al., 2018) and confirmed the performance of these clones cultivated elsewhere (Sauvadet et al., 2021). The pod survival curves depicted in this study were a function of the interaction of clone x pod generation and were consistent over time.
Across generations, between 45-55% of the pods of CATIE-R1, CATIE-R4 and CC-137 reached maturity and were harvested but only 30 to 35% of the pods of PMCT-58, ICS-95 and CCN-51 clones were harvested. Pod losses registered in this study were almost two folds higher than those reported for CATIE-R1, CATIE-R4 and CC-137 clones growing in a medium-sized and well-managed commercial farm located about 10 km away from our study site (Villatoro, 2023). This indicates that the set of risks experienced during pod development is shaped by the genetic makeup of the cocoa clone, environmental conditions, and crop management (Leach et al, 2002; Kieck et al. 2016; Armengot et al., 2020; Jaimez et al., 2022). Our study site had greater cocoa plating density, shade tree density and canopy cover than recommended for shaded plots which in turn creates a favorable microclimate for pests and disease outbreaks (Dias et al., 2000; Blaser et al., 2018; Ramirez et al., 2022; Jaimes-Suárez et al., 2022; Somarriba et al., 2023).
The position on the tree trunk does not influence the pods’ survival
The risk of disease infection depends on numerous context-specific factors such as disease incidence the year before, actual pod load, climate, pod position and the genetic makeup of the cocoa tree itself, which determines pod size, growth, and inherent disease resistance (Dias and Kageyama, 1995; dosSantos Dias and Kageyama, 1998; Ten Hoopen et al., 2012; Mangueira et al., 2022). Pod size influences pod wetness duration due to the deposition of dew on the pod. Prolonged wetness increases the chances of pathogen propagules germinating and infecting the pod (Butler, 1980; Leach et al., 2002; Bateman, 2004). In our study, regardless of clones and pod generation, the position of pods on the tree trunk had no significant effect on risk avoidance and pod survival. This result is at odds with Leandro-Muñoz et al. (2017) who reported higher frosty pod rot incidence over pods located in the upper strata of the tree. Smaller trees are recommended for better and more effective disease control, pruning, and harvesting (Somarriba et al., 2018; Cilas and Bastide, 2020). Fortnightly removal of infected pods and regular pruning have proven to be effective in reducing yield losses due to disease incidence in timber-based agroforestry systems of lowland Honduras (Ramirez et al., 2022). Fertilization and synchronized pruning have a significant influence on reducing the combined risks affecting pod development and survival (Ten Hoopen et al., 2012; Goudsmit et al., 2023). In Bolivia, shade regulation and frequent pruning reduced yield losses in both conventional and organic shaded cacao plantations (Vargas et al., 2005, Armengot et al., 2020).
Survival behavior curves aid yield estimation at the farm level
Most cocoa yield forecasting methods in use today rely on pod counting, the use of clone-specific pod index, and the application of a pest & diseased standard discount factor in each site and time (UTZ, 2016; Amores et al., 2005). These methods have proven to be inconsistent across spatial scales and over time. For instance, dos Santos Filho and Midlej (2016), used pod counting in Bahia, Brazil to forecast production at the regional level and found that yield predictions revealed differences in the range of 0.8% to 10.2% among consecutive years and cautioned on the need for specific discount factor at the farm level. According to the views of several farm managers, this widely used method consistently either over or underestimated attainable yields over consecutive harvesting seasons (personal communication with Phillipe Bastide, international cocoa consultant; Felipe Bermudez, Mars-La Chola-Ecuador; Carlos Escobar, 12Tree-Colombia; Elsa Hegmann, Rausch Cacao, Costa Rica; Roy Fratz, CacaoVerapaz, Guatemala, Jaume Martorell-12Tree-Dominican Republic and Elizabeth Rizo, Ritter Sport-Nicaragua).
In this study, we devised survival curves per clone which might inform us of the harmful effect of combined risks on cocoa attainable yields in a particular location and over time. Here, second-generation pods (within the transition period) faced the lowest combined risk, followed by those of the first-generation (pods within the rainy season) and third-generation pods (semi-dry season). Results from Leandro-Muñoz et al. (2017) indicated that the fungal microclimatic requirements vary from the early to the late cycle stages, possibly due to the pathogen’s long latent period, thus pods from different cohorts are affected differently. Recent work proposed the development of a disease and production index for the selection of productive and tolerant cacao clones (Jaimez et al., 2020). Our study allowed a better understanding of the multiple risks affecting cocoa pod development and survival to apply clone-specific discount factors more reliably.
In addition, based on the lifetime table we built, we demonstrated that the application of a standard factor that accounts for “overall pests/diseases losses” during a cropping year is not a reliable means for cocoa yield estimation (Tahi et al., 2007; Lachenaud, 1991; Lachenaud and Oliver, 1998; Lachenaud et al., 2007; Ramón et al., 2024). Forecasting yield is a key action for farmers, technical staff, certification bodies, and farm managers, it allows a reliable estimation of potential revenues from the current harvest season, it helps farmers’ organizations to project funds and staff required to buy the quota of cocoa beans to be traded each year (dos Santos Fhilo, 2018). Certification bodies require reliable yield estimation from current clients to set a fair price for certified cocoa beans (UTZ, 2016), for farm managers, yield forecasting is crucial to better schedule labor and operational costs and to properly assess annual profitability (Jaimez et al., 2024). Our study demonstrated that pod survival changes as a function of clone and pod age. Hence, we suggest combining pod counting and pod index with a set of clone-specific discount factors, from survival rates, to improve the accuracy of cocoa yield forecasting methods at the farm level.
Conclusion
In each cultivation site, different microclimate conditions and management practices shape multiple risk factors affecting pod development and survival. In our study, pods from different generations exhibited distinct survival rates. Moreover, the effect of “clone” significantly affected the ability of pods to avoid deadly hazards and survive over time, which confirmed the CATIE clone’s inherent ability to tolerate disease pressure. However, the position of the pod along the tree trunk does not influence the pod’s survival rates. The novel approach followed in this study that combines risk analysis and survival curves allowed the development of clone-specific discount factors to better plan a timely agricultural calendar and estimate farm yields more accurately over time.
Data availability statement
The datasets presented in this study can be found in online repositories. The names of the repository/repositories and accession number(s) can be found in the article/supplementary material.
Ethics statement
Written informed consent was obtained from the individual(s) for the publication of any potentially identifiable images or data included in this article.
Author contributions
LO-A: Conceptualization, Formal analysis, Supervision, Writing – original draft. AL-S: Conceptualization, Formal analysis, Methodology, Resources, Software, Writing – original draft. LC: Data curation, Formal analysis, Funding acquisition, Methodology, Software, Writing – review & editing. MJB: Data curation, Investigation, Resources, Writing – review & editing. ML-M: Funding acquisition, Investigation, Methodology, Project administration, Writing – review & editing. RC: Funding acquisition, Methodology, Project administration, Writing – review & editing. MB: Investigation, Methodology, Resources, Writing – review & editing. EV: Data curation, Validation, Writing – review & editing. ES: Conceptualization, Methodology, Supervision, Validation, Visualization, Writing – original draft.
Funding
The author(s) declare financial support was received for the research, authorship, and/or publication of this article. This research was partly funded by the MOCCA (https://mocca.org/) project led by the consortium TechnoServe and Corus International and supported by CATIE’s Research Competitive Funds (2022). Additional funds were provided by the Foundation for Food and Agricultural Research (FFAR) and the Rapid Outcomes from Agricultura Research program (ROAR) to make the research findings of this project open to the public. In-kind support was provided by Centro de Investigacion en Matematica Pura y Aplicada (CIMPA) from the Universidad de Costa Rica (https://www.cimpa.ucr.ac.cr/).
Acknowledgments
We appreciate the assistance of the technical staff at La Montana, experimental site, CATIE and to M.Sc Oscar Ramirez Argueta from FHIA for his support during data collection. We thank the reviewer for the valuable feedback.
Conflict of interest
The authors declare that the research was conducted in the absence of any commercial or financial relationships that could be construed as a potential conflict of interest.
Publisher’s note
All claims expressed in this article are solely those of the authors and do not necessarily represent those of their affiliated organizations, or those of the publisher, the editors and the reviewers. Any product that may be evaluated in this article, or claim that may be made by its manufacturer, is not guaranteed or endorsed by the publisher.
References
Aalen O. O., Johansen S. (1978). An empirical transition matrix for non-homogeneous markov chains based on censored observations. Scandinavian J. Stat 5, 141–150.
Amores F., Quiroz J., Moreira M. D., Tarqui O. (2005). Rehabilitación de plantaciones de cacao mediante el uso de chupones. Estación Experimental Tro-cial. Boletín Divulgativo #242. Quito, Ecuador. 11 p.
Aneani F., Ofori-Frimpong K. (2013). An analysis of yield gap and some factors of cocoa (Theobroma cacao) yields in Ghana. Sustain. Agric. Res. 2, 117–127.
Anokye E., Lowor S. T., Dogbatse J. A., Padi F. K. (2021). Potassium application positively modulates physiological responses of cocoa seedlings to drought stress. Agronomy 11, 563. doi: 10.3390/agronomy11030563
Armengot L., Ferrari L., Milz J., Velásquez F., Hohmann P., Schneider M., et al. (2020). Cacao agroforestry systems do not increase pest and disease incidence compared with monocultures under good cultural management practices. Crop Protect. 130, 105047. doi: 10.1016/j.cropro.2019.105047
Armengot L., Picucci M., Milz J., Hansen J. K., Schneider M. (2023). Locally selected cacao clones for improved yield: a case study in different production systems in a long-term trial. Front. Sustain. Food Syst. 7. doi: 10.3389/fsufs.2023.1253063
Atanda O. A., Jacob V. J. (1975). Yield characteristics of Theobroma cacao L. with special reference to studies in Nigeria. Rev. Theobroma 5, 21–36.
Ayestas V. E., Orozco-Aguilar L., Astorga C., Munguia R., Vega. C. (2013). Caracterrizacion de árboles promisorioss de cacao en fincas orgánicas de Waslala, Nicagua. Agroforesteria en las Américas 49, 18–25.
Bartley B. G. D. (1970). Yield variation in the early productive years in trials with cacao (Theobroma cacao L.). Euphytica 19, 199–206. doi: 10.1007/BF01902946
Bastide P., Paulin D., Lachenaud P. (2008). Influence de la mortalité des cacaoyers sur la stabilité de la production dans une plantation industrielle. Tropicultura 26, 33–38.
Bastide P., Lachenaud P., Olivier G., Pauling. D. (2006). Pod filling in guianan wild cacao trees (Theobroma cacao l.). Acta Bot. Gallica 153 (1), 105–114.
Bateman R. P. (2004). The use of narrow-angle cone nozzles to spray cocoa pods and other slender biological targets. Crop Prot. 23, 989–999. doi: 10.1016/j.cropro.2004.02.014
Beyersmann J., Allignol A., Schumacher M. (2012). “Competing risks and multistate models with R,” in Competing Risks and Multistate Models with R (Springer, New York). doi: 10.1007/978-1-4614-2035-4
Blaser W. J., Oppong J., Hart S. P., Landolt J., Yeboah E., Six J. (2018). Climate-smart sustainable agriculturein low-to intermediate shade agroforests. Nat. Sustainabil. 1, 234–239. doi: 10.1038/s41893-018-0062-8
Bozdogan H. (1987). Model selection and Akaike’s informationcriterion (AIC): The general theory and its analytical extensions. Psychometrika. 52, 345–370. doi: 10.1007/BF02294361
Butler D. R. (1980). Dew and thermal lag: measurements andan estimate of wetness duration on pods. Q. J. R. Meteorological Soc. 106, 539–550.
CATIE (Tropical Agricultural Research and Higher Educatiokn Center). (2013). “Servicios ambientales de los cacaotales centroamericanos resultados de investigación al alcance de las comunidades cacaoteras,” in Serie técnica materiales de extensión no. 10(Turrialba, CR), 20.
CATIE (Tropical Agricultural Research and Higher Education Center). (2012). “Catalogue of cacao clones selected by CATIE for commercial plantings,” in Technical Series/Technical Manual/CATIE, vol. 105. (, Costa Rica: Turrialba), 68. Available at: https://repositorio.catie.ac.cr/handle/11554/7280.
Cilas C., Bastide P. (2020). Challenges to cocoa production in the face of climate change and the spread of pests and diseases. Agronomy 10, 1232. doi: 10.3390/agronomy10091232
Cox D. R. (1972). Regression models and life-tables. J. R. Stat. Society. Ser. B (Methodological) 34, 187–220. http://www.jstor.org/stable/2985181.
Cubillos B. A., Garcia-Munoz M., Calvo-Salamanca. A., Carvajal-Rojas H. G., Tarazona-Diaz M. (2019). Study of the physical and chemical changes during the maturation of three cocoa clones,EET8, CCN51, and ICS60. J. Sci. Food Agric. 99 (13), 5910–5917. doi: 10.1002/jsfa.9882
da Silva P. V., Savian T. (2019). Chanter model: nonlinear modeling of the fruit growth of cocoa. Ciencia Rural. 49 (11). doi: 10.1590/0103-8478cr20190409
Daymond A. J., Hadley (2008). Differential effects of temperature on fruit development and bean quality of contrasting genotypes of cacao (Theobroma cacao). Ann. Appl. Biol. 53, 175–185. doi: 10.1111/j.1744-7348.2008.00246.x
Daymond A. J., Hadley P., MaChado R. C. R., Ng E. (2002). Genetic variability in partitioning to the yield component of cacao (Theobroma cacao L.). HortScience 37, 799–801. doi: 10.21273/HORTSCI.37.5.799
de Almeida A. F., Valle R. R. (2007). Ecophysiology of the cacao tree. Braz. J. Plant Physiol. 19, 425–448. doi: 10.1590/S1677-04202007000400011
Della Sala P. (2022). “Importance of drought components on the productivity of theobroma cacao and ways to improve the industry’s seasonal forecasting capacity,” in Functional ecology and agronomic sciences (Universite de Montpellier), 138. Available at: https://agritrop.cirad.fr/603035/1/ID603035.pdf. Doctoral Thesis.
Dias L. A. S., Kageyama P. Y. (1995). Combining ability for cacao (Theobroma cacao L.) yield components under southern Bahia conditions. Theor. Appl. Genet. 90, 534–541. doi: 10.1007/BF00222000
Dias L., Santos M., Santos A., Almeida C., Cruz C., Carneiro P. (2000). Efect of planting density on yield and incidence of witches’ broom disease in a young plantation of hybrid cacao trees. Exp. Agr 36, 501–508. doi: 10.1017/S001447970000106X
dos Santos Dias L. A., Kageyama Y. P. (1998). Repeatability and minimum harvest period of cacao (Theobroma cacao L.) in Southern Bahia. Euphytica 102, 29–35. doi: 10.1023/A:1018373211196
dos Santos Filho L. P. (2018). Metido empirico de privisao de safras de cacau. Agrotrópica 30 (3), 253 –254. doi: 10.21757/0103-3816.2018v30n3p253-254
dos Santos Filho P. L., Midlej R. R. (2016). Metodo de estimativa da producao de cacau no ano civil na regioao cacaueira baina. Agrotrópica 28, 247–252.
Etikan I., Abubakar S., Alkassim R. (2017). The kaplan meier estimate in survival analysis. Biomet. Biostat. Int. J. 5. doi: 10.15406/bbij.2017.05.00128. 55-59p.
Goudsmit E., Rozendaal D. M. A., Tosto A., Slingerland M. (2023). Effects of fertilizer application on cacao pod development, pod nutrient content and yield. Sci. Hortic. 313. doi: 10.1016/j.scienta.2023.111869. 1-15p.
Jaimes-Suárez Y. Y., Carvajal-Rivera A. S., Galvis-Neira D. A., Carvalho F. E. L., Rojas-Molina J. (2022). Cacao agroforestry systems beyond the stigmas: Biotic and abiotic stress incidence impact. Front. Plant Sci. 13. doi: 10.3389/fpls.2022.921469
Jaimez R. E., Barragan L., Fernández-Niño M., Wessjohann L. A., Cedeño-Garcia G., Sotomayor Cantos I., et al. (2022). Theobroma cacao L. cultivar CCN 51: a comprehensive review on origin, genetics, sensory properties, production dynamics, and physiological aspects. PeerJ 10, e12676. doi: 10.7717/peerj.12676
Jaimez R. E., Vera D. I., Mora A., Loor R. G., Bailey B. A. (2020). A disease and production index (DPI) for selectionof cacao (Theobroma cacao) clones highly productive and tolerant to pod rot diseases. Plant Pathol. 69, 698–712. doi: 10.1111/ppa.13156
Kaplan E. L., Meier P. (1958). Nonparametric estimation from incomplete observations. J. Am. Stat. Assoc. 53, 457–481. doi: 10.1080/01621459.1958.10501452
Kieck S. J., Zug L. M. K., Yupanqui-Huamani H. A., Gomez-Aliaga R., Cierjacks A. (2016). Plant diversity effects on crop yield, pathogen incidence, and secondary metabolism on cacao farms in peruvian amazonia. Agricultiire Ecosyst. Envornmnet 222), 223–234. doi: 10.1016/j.agee.2016.02.006
Klein J. P., van Houwelingen H. C., Ibrahim J. G., Scheike T. H. (2016). Handbook of survival analysis (1st ed.). Chapman and Hall/CRC. doi: 10.1201/b16248
Krauss U., Adonijah V., Arroyo C., Bekker M., Crozier J., Gamboa A., et al. (2013). Cocoa (Theobroma cacao) yield increased in Costa Rica through novel stress management and fertilization approach. Greener J. Agric. Sci. 2, 068–078.
Krauss U., Soberanis W. (2002). Efect of fertilization and biocontrol application frequency on cocoa pod diseases. Biol. Control 24 (1), 82–89. doi: 10.1016/S1049-9644(02)00007-5
Krauss U., Soberanis W. (2001). Rehabilitation of diseased cacao fields in Peru through shade regulation and timing of biocontrol measures. Agroforestry Syst. 53, 1–6. doi: 10.1023/A:1013376504268
Lachenaud P. (1984). Une méthode d’évaluation de la production de fèves fraîches applicable aux essais entièrement«randomisés». Café Cacao Thé 28, 83–88.
Lachenaud Ph. (1991). Effet de quelques variables saisonnières sur la relation entre poids de cabosse et poids de fèves fraîches chez le cacaoyer. Bilan d’observations en Côte d’Ivoire. Café Cacao Thé 35, 113–120.
Lachenaud P., Oliver G. (1998). Influence d’éclaircies sur les rendements d’hybrides de cacaoyers. Plantations Recherche Développement 5, 34–40.
Lachenaud P., Paulin D., Ducamp M., Thevenin J. M. (2007). Twenty years of agronomic evaluation of wild cocoa trees (Theobroma cacao L.) from French Guiana. Sci. Hortic. 113, 313–321. doi: 10.1016/j.scienta.2007.05.016
Lachenaud P., Oliver G. (2005). Variability and selection for morphological bean traits in wild cocoa trees (Theobroma cacao l.) from french guiana. Genet. Resour Crop Evol. 52, 225–231. doi: 10.1007/s10722-004-4005-z
Lamos-Díaz H., Puentes-Garzón D. E., Zarate-Caicedo D. A. (2020). Comparison between machine learning models for yield forecast in cocoa crops in santander, Colombia. Rev. Fac. Ing. 29, 54. doi: 10.19053/01211129.v29.n54.2020.10853
Leach A. W., Mumford J. D., Krauss U. (2002). Modelling moniliophthora roreri in Costa Rica. Crop Prot. 21, 317–326. doi: 10.1016/S0261-2194(01)00148-X
Leandro-Muñoz M. E., Tixier P., Germon A., Rakotobe V., Phillips-Mora W., Maximova S., et al. (2017). Effects of microclimatic variables on the symptoms and signs onset of Moniliophthora roreri, the causal agent of pod rot in cacao. PloS One 12, e0184638.
Lockwood G., Yin J. P. T. (1996). Yields of cocoa clones in response to planting density in Malaysia. Expt. Agr. 32, 41–47. doi: 10.1017/S0014479700025837
López-Hernández J., López-Hernández L., Avendaño-Arrazate C., Aguirre-Medina J., Espinosa-Zagaroza S., Moreno-Martínez J., et al. (2018). Biología floral de cacao (Theobroma cacao L.); criollo, trinitario y forastero en México. Agroproductividad 11, 129–136.
Maisin N., Lamin K. (2006). “Cocoa pod sigmoid growthmodel using ‘the beta growth function’,” in Abstracts of the16th International Cocoa Research Conference, San Jose, Costa Rica, 9–14October 2006. 241.
Mangueira R. A., Silva V., Martins W. (2022). Description of the growth curve of the biquinho-type pepper plant under water stress. Ciencia Natura. 44, e17. doi: 10.5902/2179460X65803
Mata-Quirós A., Arciniegas-Leal A., Phillips-Mora W., Meinhardt W. L., Motilal L., Mischke S., et al. (2018). Assessing hidden parentage and genetic integrity of the “United Fruit Clones” of cacao (Theobroma cacao) from Costa Rica using SNP markers. Breed. Sci. 68 (5), 545–553. doi: 10.1270/jsbbs.18057
Melnick R. L. (2016). “Cherelle wilt of cacao: A physiological condition,” in Cacao diseases. Eds. Bailey B., Meinhardt L. (Cham: Springer). doi: 10.1007/978-3-319-24789-2_15
Merchán V. M. (1981). Avances en la investigación de la moniliasis del cacao en colombia. Cacaotero Colombiano. 16, 26–41.
Niemenak N., Cilas C., Rohsio C., Bleiholder H., Meier U., Lieberei R. (2010). Phenological growth stages of cacao plants (Theobroma sp.): codification and description according to the BBCH scale. Annals of Applied Biology. 156 (1), 13024. doi: 10.1111/j.1744-7348.2009.00356.x
Pang J. T.-Y. (2006). Yield efficiency in progeny trials with cocoa. Exp. Agric. 42, 289–299. doi: 10.1017/S0014479706003577
Phillips-Mora W., Aime M. C., Wilkinson M. J. (2007). Biodiversity andbiogeography of the cacao (Theobroma cacao) pathogen Moniliophthoraroreri. Plant Pathol. 56, 911–922. doi: 10.1111/j.1365-3059.2007.01646
Phillips-Mora W., Arciniegas-Leal A., Mata-Quirós A., Motamayor-Arias J. (2013). Catalogue of cacao clones selected by CATIE for commercial plantings. 1st (Turrialba, CR: Tropical Agricultural Research and Higher Education Center (CATIE), 68.
Phillips-Mora W., Baqueros F., Melnick R. L., Bailey B. A. (2015). First report of frosty pod rot caused by Moniliophthora roreri on cacao in Bolivia. New Dis. Rep. 31, 29. doi: 10.5197/j.2044-0588.2015.031.029
Phillips-Mora W., Wilkinson M. J. (2007). Frosty pod of cacao: a disease with a limited geographic range but unlimited potential for damage. Phytopathology 97 (12), 1644–1647. doi: 10.1094/PHYTO-97-12-1644
Phillips-Mora W., Coutiño A., Ortiz C. F., López A. P., Hernández J., Aime M. C. (2006). First report of moniliophthora roreri causing frosty pod rot (moniliasis disease) of cocoa in mexico. Plant Pathology. 55 (4), 584.
Porras-Umaña V. H., Galindo J. (1985). Effect of inoculum levels and "humid chamber" on screening cacao for resistance to monilia roreri cif & par. Phytopathology 75 (10), 1178.
Quiroz J., Amores F. (2002). “Rehabilitación de plantaciones tradicionales de cacao en ecuador,” in Manejo integrado de plagas (Costa rica), vol. 63. , 73–80. Available at: https://biblat.unam.mx/es/revista/manejo-integrado-de-plagas/articulo/rehabilitacion-de-plantaciones-tradicionales-de-cacao-en-ecuador.
Ramírez-Argueta O., Orozco-Aguilar L., Dubón A. D., Díaz F. J., Sánchez J., Casanoves F. (2022). Timber growth, cacao yields, and financial revenues in a long-term experiment of cacao agroforestry systems in northern honduras. Front. Sustain. Food Syst. 6. doi: 10.3389/fsufs.2022.941743
Ramón E., Jaimez L. B., Fernández-Niño M., Oswaldo J.L. B., Flores B. (2024). Pod production dynamics and pod size distribution of theobroma cacao l. clone CCN 51 in full sunlight. Int. J. Agron. 2024, 9, 4242270. doi: 10.1155/2024/4242270
Rojas K. E., Garcia C. M., Ceron X. I., Ortiz E. R., Tarazona-Diaz M. (2020). Identification of potential maturity indicators for harvesting cacao. Heliyon 6 (2), e03416. doi: 10.1016/j.heliyon.2020.e03416
Romero Vergel A. P., Camargo Rodríguez A. V., Ramírez O. D., Arenas Velilla P. A., Gallego A. M. (2022). A crop modelling strategy to improve cacao quality and productivity. Plants (Basel). 7-11, 157. doi: 10.3390/plants11020157
Ryan D., Bright G., Somarriba E. (2009). Damage and yield change in cocoa crops due to the harvesting of timber shade trees in Talamanca, Costa Rica. Agrofor Syst. 77, 97–106. doi: 10.1007/s10457-009-9222-1
Sauvadet M., Dickinson A. K., Somarriba E., et al. (2021). Genotype–environment interactions shape leaf functional traits of cacao in agroforests. Agron. Sustain. Dev. 41, 31. doi: 10.1007/s13593-021-00690-3
Somarriba E., Beer J. (2011). Productivity of Theobroma cacao agroforestry systems with timber or legume service shade trees. Agrofor. Syst. 8, 109–121. doi: 10.1007/s10457-010-9364-1
Somarriba E., Orozco-Aguilar L., Cerda R., López-Sampson A. (2018). “Analysis and design of the shade canopy of cocoa-based agroforestry system,” in Achieving sustainable cultivation of cocoa. Ed. Umaharan P. (Burleigh Dodds Science Publishing, Cambridge, UK), 469–499. doi: 10.19103/AS.2017.0021.29
Somarriba E., Suárez-Islas A., Calero-Borge W., Villota A., Castillo C., Vílchez S., et al. (2014). Cocoa-timber agroforestry systems: Theobroma cacao-Cordia alliodora in Central America. Agrofor Syst. 88, 1001–1019. doi: 10.1007/s10457-014-9692-7
Somarriba E., Peguero F., Cerda R., et al. (2021). Rehabilitation and renovation of cocoa (Theobroma cacao l.) agroforestry systems. A review. Agron. Sustain. Dev. 41, 64. doi: 10.1007/s13593-021-00717-9
Somarriba E., Zamora R., Barrantes J., et al. (2023). ShadeMotion: tree shade patterns in coffee and cocoa agroforestry systems. Agroforest Syst. 97, 31–44. doi: 10.1007/s10457-022-00784-1
Suarez-Islas A. (2008). ¿Cuántos y cuáles árboles de laurel (Cordia alliodora) se pueden cosechar en los cacaotales y bananales indígenas de talamanca, costa rica? Agroforesteria en las Americas. 46, (104–109).
Tahi G. M., N’Goran J. A. K., Souunigo O., Lachenaud P., Eskes A. B. (2007). Efficacy of simplified methods to assess pod production in cocoa breeding trials. Ingenic newsletter. (11), 7–11.
Takan P., Ndong E. P., Gwet H., Ndoumbe-Nkeng M. (2013). Smooth estimation of a lifetime distribution with competing risks by using Regular Interval Observations: Application to Cocoa Fruits Growth. J. R. Stat. Soc. Ser. C: Appl. Stat 62. doi: 10.1111/rssc.12019. 741-760 p.
Ten Hoopen G. M., Deberd P., Mbenoun M., Cilas C. (2012). Modelling cacao pod growth: implications for disease control. Ann. Appl. Biol. 160, 260–272. doi: 10.1111/j.1744-7348.2012.00539.x
Toxopeus H., Wessel M. (1970). Studies on pod and bean values of theobroma cacao l. @ in nigeria, i. Neth. J. Agric. Sei. 18 (2), 132–139. 10.18174/njas.v18i2.17349.
Toxopeus H. (1969). “Cacao (Theobroma cacao l..),” in Outlines of perennial crop breeding in the tropics. misc. papers, vol. 4. (Wageningen, The Netherlands: Landbouwhogeschool Agric Univ.), 81–109.
UTZ. (2016). Documento guía UTZ para la estimación de volumen certificado de café y cacao. Available online at: https://docplayer.es/56082714-Documento-guia-utz-estimacion-del-volumen-certificado.html.
Vargas A., Somarriba E., Carballo M. (2005). Dinámica poblacional del chinche (Monalonion dissimulatum dist.) y daño de mazorcas en plantaciones orgánicas de cacao del alto beni, bolivia. Agroforesteria en las Americas.
Villatoro C. A. (2023). Generación de curvas de crecimiento y sobrevivencia de mazorcas de cacao (Theobroma cacao L.) de cuatro clones, para mejorar la estimación de cosecha en finca en la zona húmeda de Costa Rica. CATIE. 55 p.
Wibaux Th., Konan D.-C., Snoeck D., Jagoret P., Bastide Ph. (2017). Study of tree to tree yield variability among seedling-based cacao population in an industrial plantation in Cote D Ivore. Exp. Agricult. 54, 719–730. doi: 10.1017/S0014479717000345
Keywords: survival, hazards, shaded cocoa, pod counting, pod index, attainable yields
Citation: Orozco-Aguilar L, López-Sampson A, Barboza LA, Borda MJ, Leandro-Muñoz ME, Bordeaux M, Cerda RH, Villega EA and Somarriba E (2024) Risk analysis and cacao pod survivorship curves to improve yield forecasting methods. Front. Agron. 6:1290035. doi: 10.3389/fagro.2024.1290035
Received: 06 November 2023; Accepted: 26 February 2024;
Published: 22 March 2024.
Edited by:
Edoardo Puglisi, Catholic University of the Sacred Heart, ItalyReviewed by:
Mojtaba Delshad, University of Tehran, IranJohnattan Hernández Cumplido, National Autonomous University of Mexico, Mexico
Copyright © 2024 Orozco-Aguilar, López-Sampson, Barboza, Borda, Leandro-Muñoz, Bordeaux, Cerda, Villega and Somarriba. This is an open-access article distributed under the terms of the Creative Commons Attribution License (CC BY). The use, distribution or reproduction in other forums is permitted, provided the original author(s) and the copyright owner(s) are credited and that the original publication in this journal is cited, in accordance with accepted academic practice. No use, distribution or reproduction is permitted which does not comply with these terms.
*Correspondence: Luis Orozco-Aguilar, bHVpc29yb3pAY2F0aWUuYWMuY3I=; Arlene López-Sampson, bG9wZXphQGNhdGllLmFjLmNy