 Sujata Bogati1Monique Y. Leclerc1*
 Gengsheng Zhang1Sukhvir Kaur Brar1
 Ronald Scott Tubbs2Walter Scott Monfort2Gary Lawrence Hawkins3
- 1Atmospheric Biogeosciences Group, Department of Crop and Soil Sciences, The University of Georgia, Griffin, GA, United States
- 2Department of Crop and Soil Sciences, The University of Georgia, Tifton, GA, United States
- 3Department of Crop and Soil Sciences, The University of Georgia, J. Phil Campbell Research and Education Center (REC), Watkinsville, GA, United States
Peanut (Arachis hypogaea L.) growers use different tillage systems in the Southeastern United States, the impact of which needs to be assessed with regard to evapotranspiration (ET), carbon uptake, and water-use efficiency (WUE). The eddy-covariance method was used to measure these fluxes in peanut in two common tillage systems (strip tillage vs. conventional tillage) over the course of three consecutive growing seasons (2019–2021). Results suggest that during the dry year of 2019 with rainfall of only 30 cm, strip tillage peanut had a significantly higher daytime ecosystem WUE, 105%, 51%, and 32% higher than that of the conventional tillage in early, mid, and late growth stages, respectively. In 2020, with mean rainfall the overall difference in average WUE was nonsignificant between the tillage systems. Heavy rainfall of 112 cm in 2021 led to waterlogged conditions in the conventional tillage field due to poorer infiltration. This likely reduced the CO2 uptake. Waterlogging did not occur in the strip tillage field due to improved infiltration. As a result, in 2021, 18%, 33%, and 48% greater ecosystem WUE in strip tillage during early, mid, and later stages was found. Thus, this study suggests that strip tillage fields can achieve higher net CO2 uptake and WUE in Georgia during dry or very wet years. However, no difference in WUE was found between different tillage systems in a typical year with average rainfall for Georgia. The present study has implications for regions characterized by long growing seasons and low rainfall.
1 Introduction
Over the last 120 years, the length of the dry season in the Southeastern United States has increased by 130% (Fill et al., 2019), a phenomenon attributed to climatic changes. Superimposed on this trend, the National Oceanic and Atmospheric Administration (NOAA) (2021) reports a heightened temporal variability in precipitation. Such changes are of particular significance in Georgia where 53% of the national production of peanut originates (USDA, 2021). In addition, the continuing increase in irrigated acreage (approximately 2,000% increase from 1976 to 2013) combined with declining aquifer resources in the Southeast place pressure on peanut production (Pimental and Sparks, 2000; Vorosmarty et al, 2000; Golladay et al., 2004; Sun, 2013; Williams et al., 2017; Engstrom et al, 2021). Thus, water-saving strategies are needed to improve sustainable crop production while preserving the highest yield possible. Despite several studies conducted on irrigation, diseases, and weed management of peanut in the Southeastern United States (Richburg et al., 1996; Johnson et al., 2001; Paz et al., 2007), the impact of tillage practices on water use has not been studied in the region.
The concept of water-use efficiency (WUE) varies with the discipline, and its definition differs with the scale at which it is examined. Such examples include leaf level (ratio of leaf transpiration to the stomatal conductance), plant level (biomass to the water loss), whole-crop level (harvested yield to the water loss), and ecosystem level (carbon absorbed per unit of water lost by the ecosystem) (Medrano et al., 2009; Blankenagel et al., 2018; Wieser and Troger, 2018; Zheng et al., 2019; Eyland et al., 2021; Mokhtar et al., 2022). The common definition of WUE is the amount of carbon gain per unit water loss in plants (Richardson and McCree, 1985). As this conventional definition does not include other carbon pools in the ecosystem, a definition that defines ecosystem WUE as the ratio of carbon uptake to the evapotranspiration (ET) on ecosystem level is more applicable (Hu et al., 2008; Wagle et al., 2016). The ecosystem WUE based on net ecosystem exchange (NEE) of CO2 with the atmosphere, i.e., the CO2 flux between the ecosystem and the atmosphere, is connected to both carbon uptake (photosynthesis) and release (respiration), and these mechanisms fluctuate widely depending on varying water availability (Niu et al., 2011).
Historically, crop farming has used tillage to control weeds and pests and prepare the soil for planting by mechanically turning the soil (Reicosky, 2015). There usually are two types of tillage systems performed in peanuts, conservation tillage and conventional tillage. Conservation tillage involves planting and growing plants with minimum disturbance to the soil (Derpsch, 2003). Strip tillage is the most common conservation tillage practice used in peanut in Georgia. Typically in the state, a cover crop is planted (October–November) to maintain vegetation on the field during the winter months. Three to four weeks prior to planting peanut, the cover crop is killed. At the time of planting, a narrow strip in various widths of 20–30 cm is tilled for planting. However, the conventional tillage system involves intensively tilling the soil several times to loosen the soil, to bury crop residue and weeds, and to distribute fertilizers, along with breaking the soil clumps to form a finer seed bed (Phillips et al., 1980).
Several studies suggest a clear advantage of conservation tillage in yield, quality, and net economic return compared to conventional tillage due to improved soil water holding capacity and improved water infiltration (Faircloth et al., 2012; Hawkins et al., 2016; Deines et al., 2019), while others have found little or no difference between conservation and conventional tillage practices (Colvin and Brecke, 1988; Jordan et al., 2003; Wiatrak et al., 2004; Tubbs and Gallaher, 2005). And yet other studies have found a clear disadvantage of conservation tillage leading to nutrient deficiencies due to poor crop establishment and altered soil fertility (Grichar and Boswell, 1987; Alvarez and Steinbach, 2009; Jordan and Johnson, 2010; Ogle et al., 2012).
The present study compares the WUE of conservation tillage vs. conventional tillage in peanut production over 3 years (2019–2021). It quantifies the net CO2 flux, water flux, and WUE of peanut in two commonly used tillage practices in peanut production. In this experiment, the peanut gas exchange was measured using the eddy-covariance (EC) technique. This method has been used successfully to measure the net exchange of carbon dioxide (CO2) and water flux in various agricultural, forest, and marine ecosystems (Baldocchi, 1994; Dekker et al., 2016; Anderson et al., 2017; Wagle et al., 2020). This paper reports in a credible scientifically robust manner the differences in peanut ecosystem carbon uptake, evapotranspiration (ET), and WUE. This study will help achieve higher net CO2 uptake and water conservation with higher WUE by selecting proper tillage in peanut production in the Southeastern United States.
2 Materials and methods
2.1 Site description
The 3-year study was conducted in 2019, 2020, and 2021 at the Sunbelt Agricultural Exposition Darrell Williams Research Farm in Moultrie, GA (31°09’06.10” N and 83°43’10.69” W). The soil is loamy sand. The reader is referred to Table 1 in the Results section for climatological information during those 3 years in Moultrie.
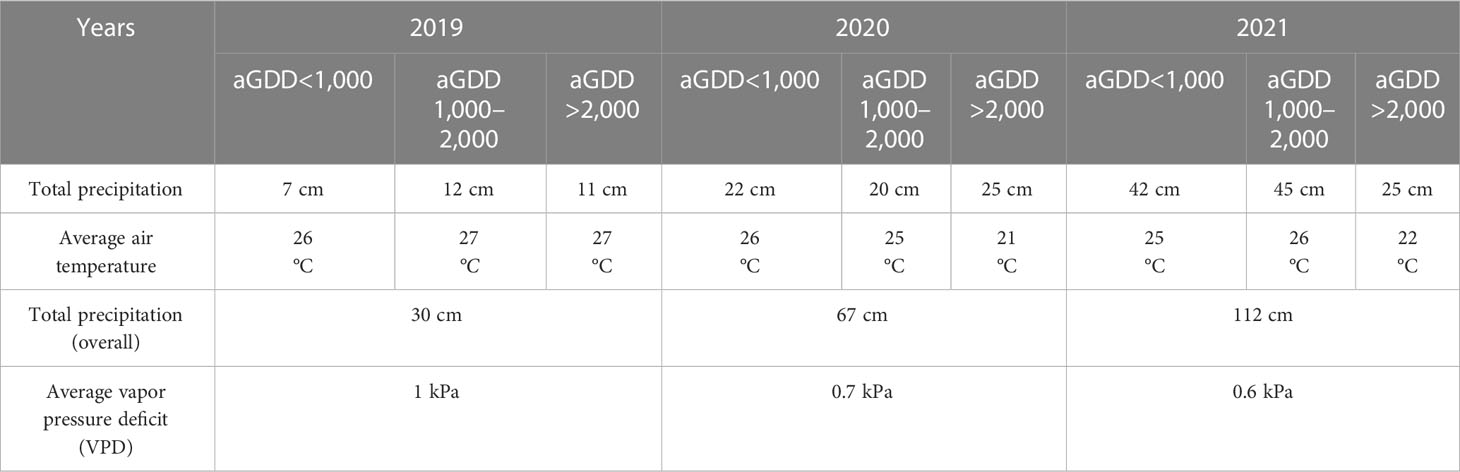
Table 1 Weather data during 2019, 2020, and 2021 growing seasons according to different accumulated growing degree days (aGDDs).
The experiment was conducted on two adjacent large, flat, and irrigated fields, one being managed with conventional tillage and the other with conservation tillage (in this case, strip tillage) (Figure 1). The fields used for this research were rotated annually with the management of the farm; therefore, the plot sizes changed slightly. The strip tillage fields were 8.5, 4.0, and 7.5 ha, and the conventional tillage fields were 5.0, 4.5, and 7.5 ha in the 2019, 2020, and 2021 growing seasons, respectively.
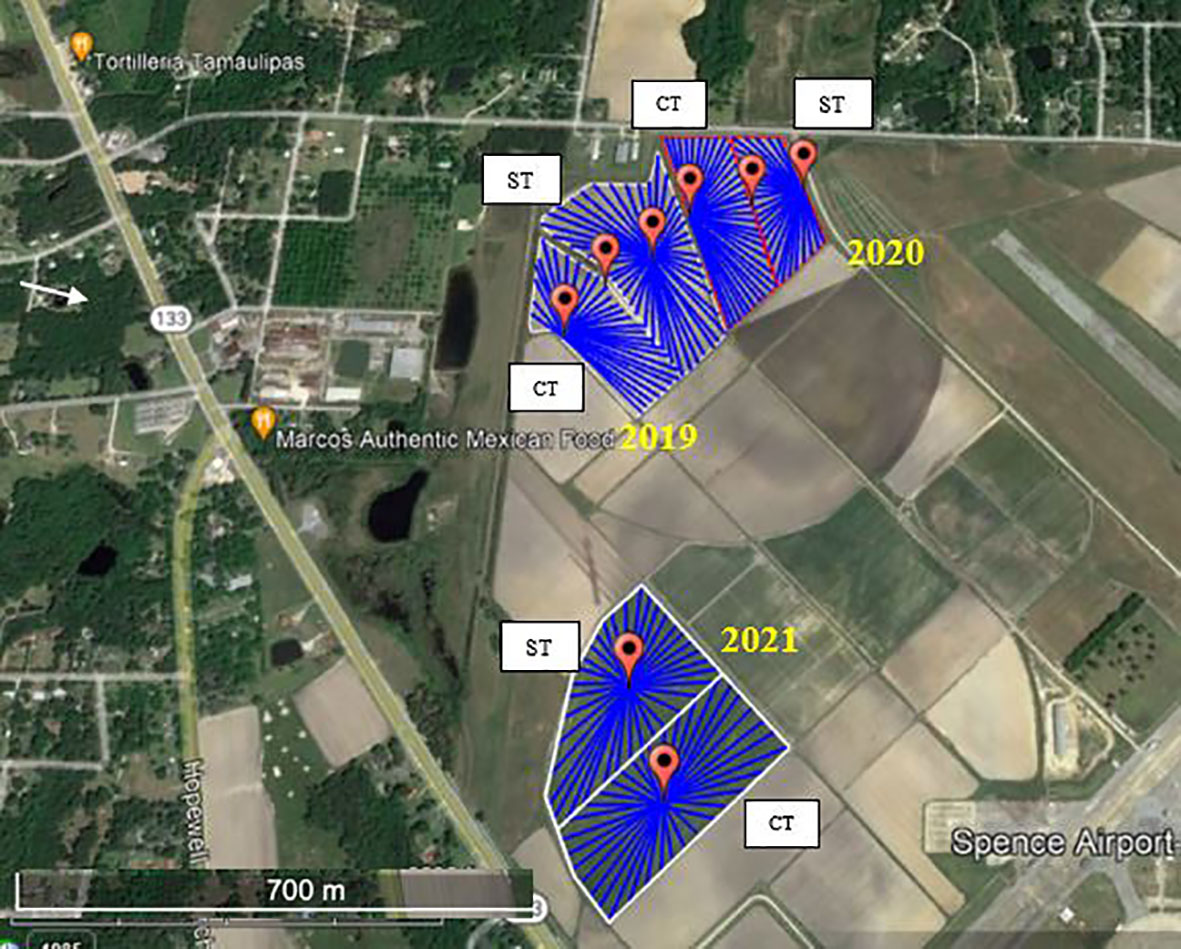
Figure 1 Eddy-covariance towers (red pins) and fetch for 2019, 2020, and 2021 conventional tillage (CT) and strip tillage (ST) fields. The three pins represent three eddy-covariance systems in 2019 and 2020. Source: Google Earth.
The runner-type peanut cultivar ‘Georgia-06G’ (Branch, 2007) was planted in all of the fields at a rate of 19 seeds/m of row for the experiment. Planting and harvest dates are shown in Table 2. Details regarding management practices are listed in Table 3.
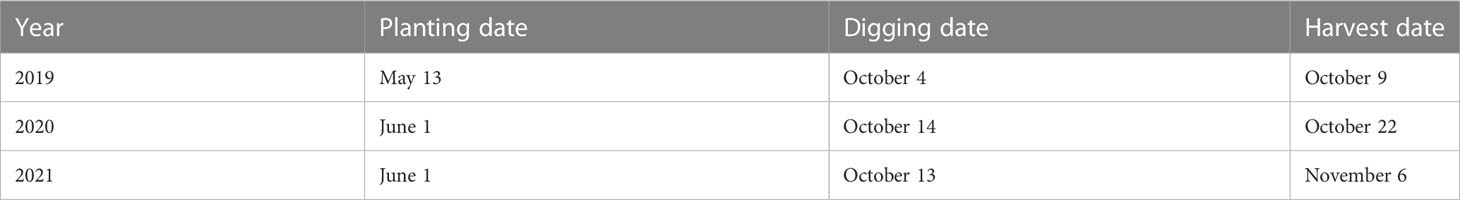
Table 2 Planting dates, digging dates, and harvesting dates for peanut during the study period of 2019–2021.
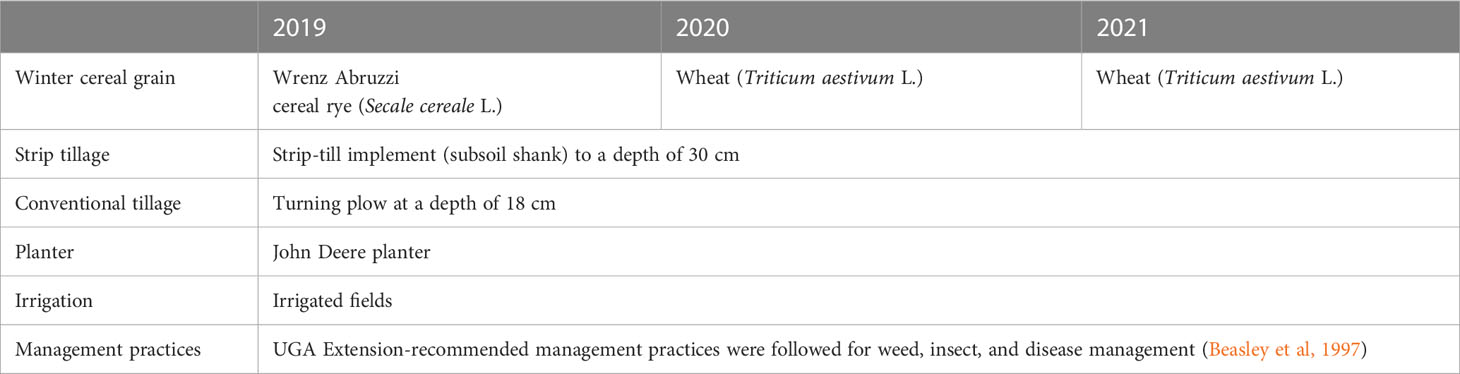
Table 3 Management practices for peanut during the study period of 2019–2021.
2.2 Meteorological measurements
The University of Georgia weather network provided the weather data. Rainfall was measured using a rain gauge (TB4, Hydrological Services America, Lake Worth, FL, USA). Air temperature and relative humidity were measured using temperature/humidity probes (HMP60, Vaisala Crop, Vantaa, Finland).
2.3 Eddy-covariance flux measurements
2.3.1 Instrumentation
In each field, an EC system was set up. The system consists of a fast-response omnidirectional sonic anemometer (CSAT3, Campbell Scientific Inc., Logan, UT, USA) and a fast-response CO2/H2O analyzer LI-7500 (LI-COR Biosciences, Lincoln, NE, USA). The system was installed on a tripod at approximately 1.5 m above the ground in each plot (Figure 1). Three-dimensional wind components, virtual temperature, water vapor concentration, and carbon dioxide concentration were measured at 10 Hz to determine ecosystem CO2 fluxes, evapotranspiration (ET), and WUE. The data reflect an integrated temporal and spatial average of CO2 and H2O exchange from each individual source/sink element to a point field measurement. The data were saved with a CR1000X datalogger (Campbell Scientific Inc., Logan, UT, USA) for later collection and analysis.
To help select the exact location of the flux system, a 10-year climatological analysis with particular attention to the seasonal and annual variability in the mean wind direction was made in conjunction with footprint calculations as a function of wind direction in each field. In each of the 3 years of this experiment, the location of the eddy-flux system was set to capture at least 80% of the daytime flux contained within the field dimensions for all prevailing wind directions.
In 2019, the field with strip tillage was large (8.5 ha), and the system was installed at the center. However, in the conventional tillage field, one system was installed near the eastern edge of the field while the other was near the western edge. Three systems in total were installed in 2020, two flux systems on either side of two tillage systems and one in the middle. However, in 2021, the fetch was sufficiently large (the fetch was 169–250 m), such that two systems were placed in the middle of each field to ensure that measured fluxes reflected the field of interest. The fetch ranged from 90 to 250 m in our 3-year experiment. Gas analyzers were also calibrated in the laboratory twice during the crop growth period, and internal chemicals were replaced annually.
2.3.2 Flux calculations and signal processing
Signal processing and flux calculations were made using the software EddyPro® v.7.0.6 (www.licor.com/eddypro). The anemometer tilt correction was done using the planar-fit method (Wilczak et al., 2001). The interference in the optical path of the sensor due to rain, fog, and dust was registered by the automatic gain control (AGC) values. The higher values of AGC above 90 were withheld from further processing due to the low quality of the data points. Periods with a maximum of 20% of missing data were selected. The statistical quality of the data was recorded and flagged for identifying appropriate data, and spike removal was conducted following the procedure outlined in Vickers and Mahrt (1997). Time lag compensation was done using the covariance maximization method (Aubinet et al., 2012). Density fluctuation corrections due to heat and water vapor transfer were made following the Webb-Pearman-Leuning (WPL) method (Webb et al., 1980), and linear detrending was done for each 30-min run.
2.3.3 Wind direction and footprint analysis
The data arising from the back of the sonic anemometer were removed because of flow distortion caused by the tower and flux instrumentation structure. To ensure that the flux data collected representsource/sink within the field of interest (and not from/to a neighboring field), a footprint model (Kormann and Meixner, 2001) was used. In this model, the footprint (Leclerc and Thurtell, 1990; Leclerc and Foken, 2014; Kljun et al., 2015; Arriga et al., 2017), i.e., the source upwind contributing to the measured fluxes, can be expressed as follows:
where F(x) is the footprint, i.e., the contribution of individual sources/sinks to a point of flux measurement. For our case, it is the fraction of the flux as a function of upwind distance (x) from the point of flux measurement in strip tillage or conventional tillage field. is the flux length scale. is the gamma function, and is a dimensionless model constant. This model gives the area’s cumulative source contribution, and the footprint is expressed in percentages of the total flux. To avoid excessive loss of data due to the limited fetch, a cumulative source distribution of 90% is used. The resulting wind direction for the 2019 growth season was primarily westerly. However, the wind direction changed throughout the growing season. The prevailing wind for the 2020 and 2021 growth seasons was predominantly southwesterly in summer and northeasterly in late spring and early fall, respectively (Figure 2).
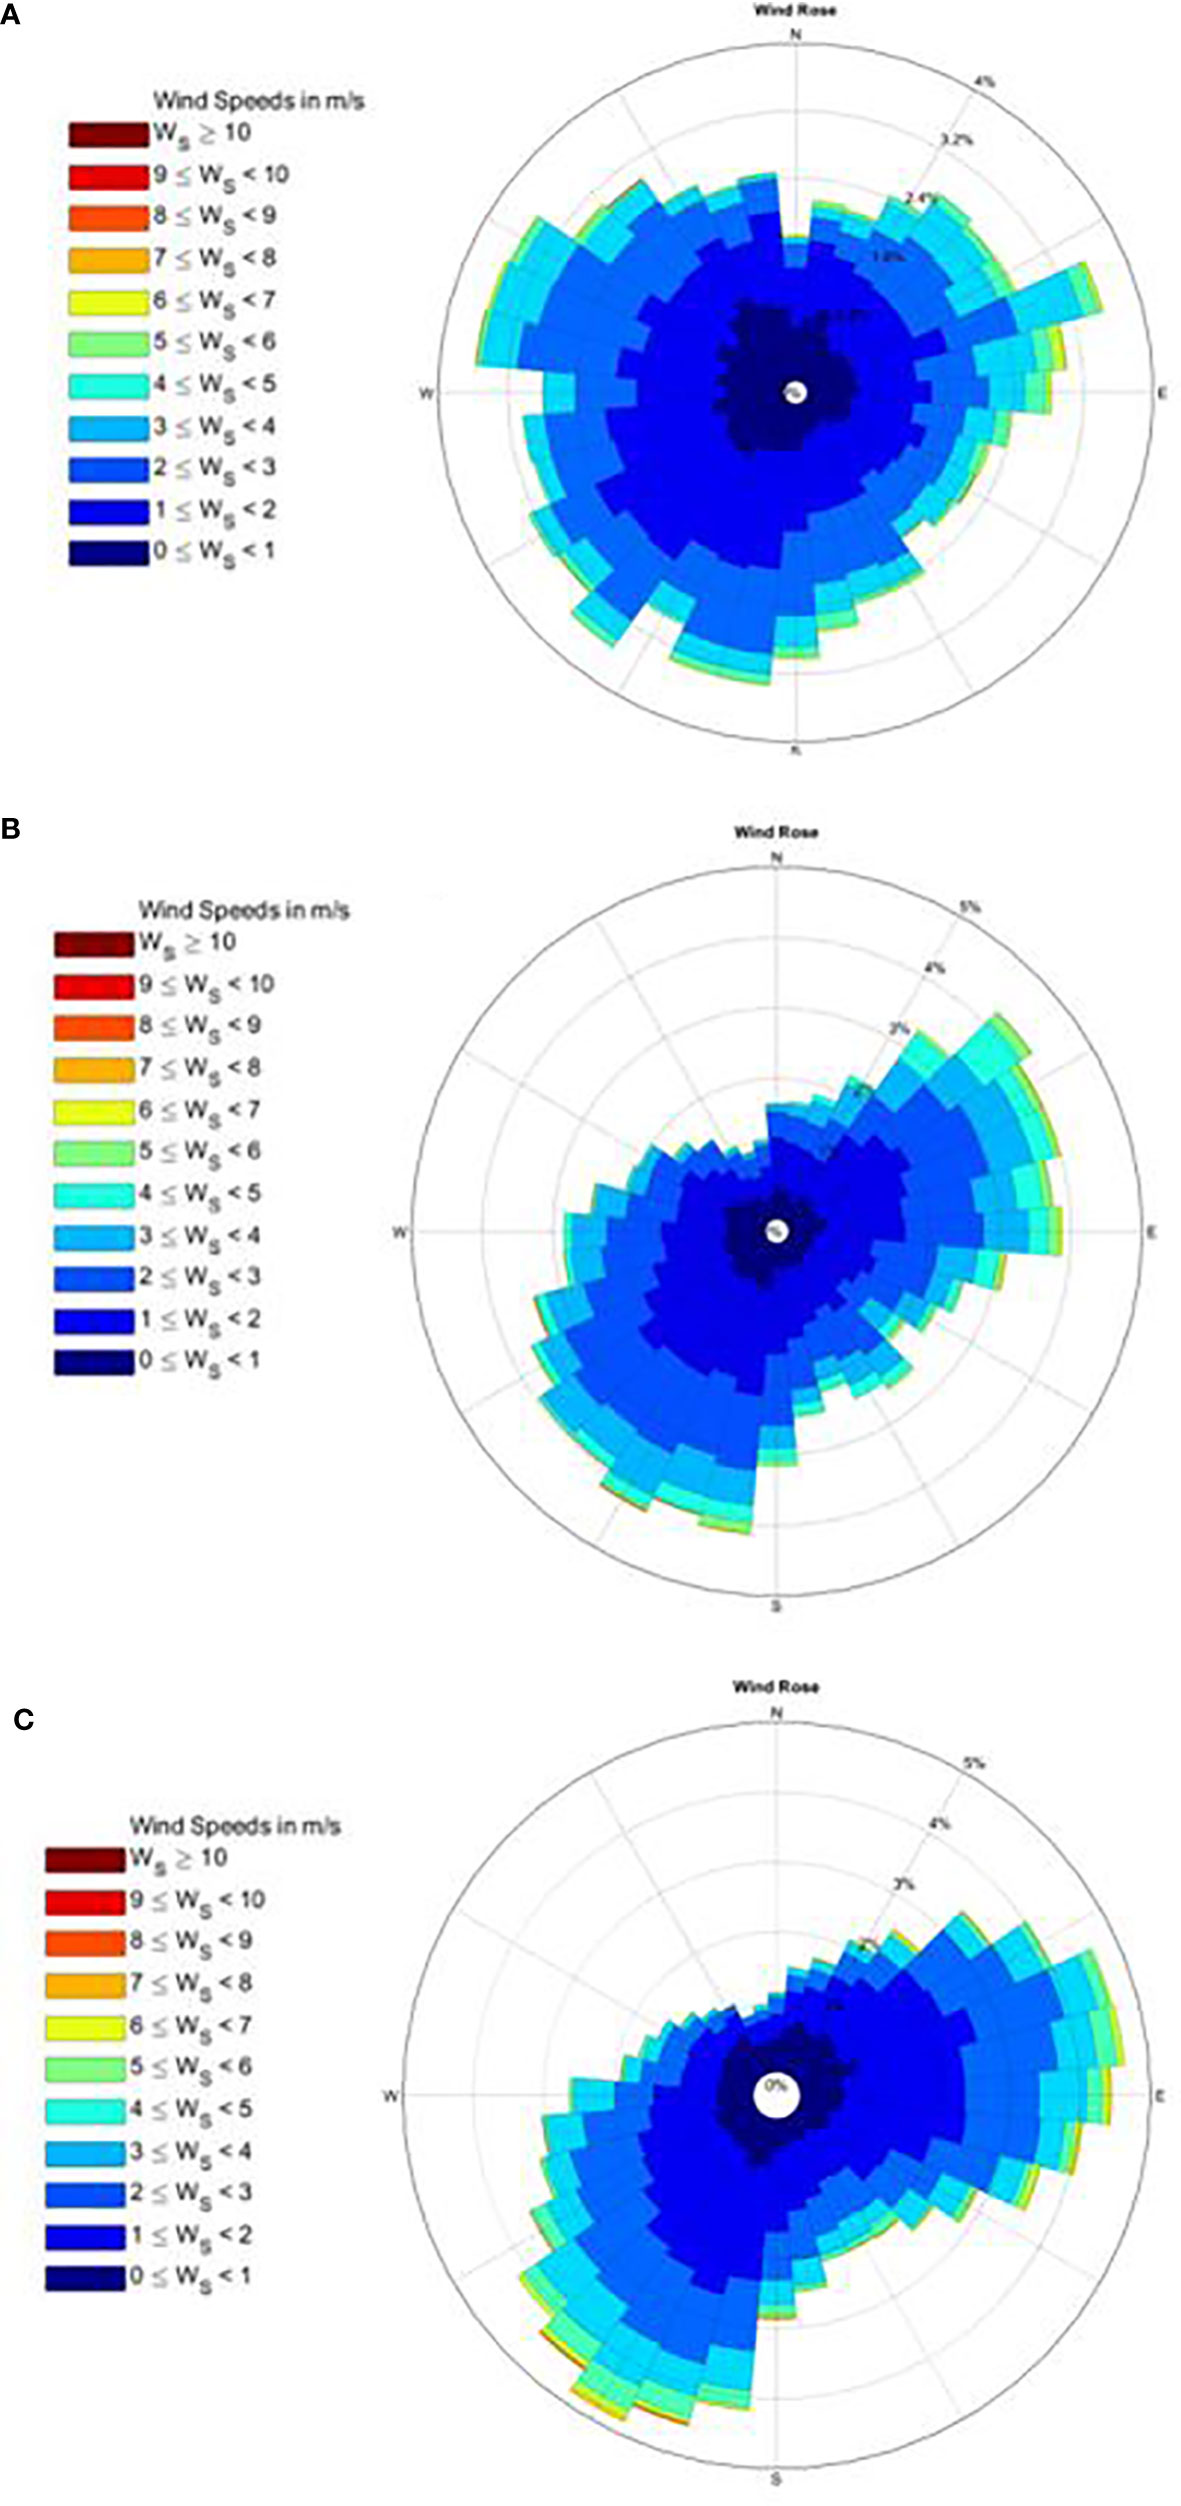
Figure 2 Wind roses for (A) 2019, (B) 2020, and (C) 2021. The length of the spoke represents the frequency of the prevailing wind, whereas the color represents the wind speed (m s-1).
2.3.4 Ecosystem water-use efficiency and growing degree days
The present study focuses on the daytime ecosystem WUE concept as the ratio of the net carbon uptake to evapotranspiration (ET) of the peanut ecosystem (Baldocchi, 1994; Scanlon and Albertson, 2004; Niu et al., 2011; Zhang et al., 2022; Zhang et al., 2023). The transition times of 2 h after sunrise and 2 h before sunset were removed following the work of Moffat et al. (2007). The ecosystem WUE in this experiment was calculated using the following expression:
where represents the average 30-min CO2 flux, represents the average 30-min H2O flux, represents the density of air, and w represents the vertical wind speed.
The growing degree days (GDDs) were calculated using the Mills’ GDD method (Mills, 1964), as it is considered to have the best relationship with peanut maturity (Rowland et al., 2006). The Mills’ GDD is calculated as follows:
where, ATmax = maximum daily air temperature ATmax35 = maximum daily air temperature, limited to the threshold of 35 °C, ATmin = minimum daily air temperature, ∆Toc = ABS(ATmax − 24.4). In this experiment, the accumulated growing degree days (aGDDs), a cumulative sum of the GDD starting from the planting date, were used. The data obtained in this experiment are divided into three categories as reported in Table 4.
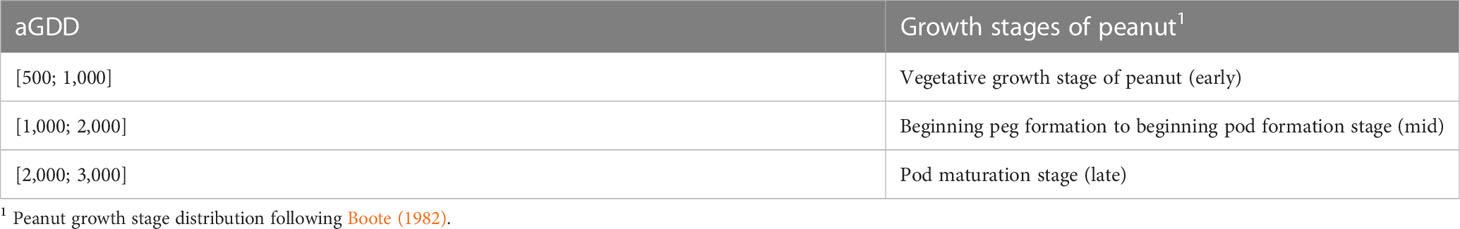
Table 4 Peanut growth stages according to different accumulated growing degree days (aGDDs).
2.4 Other measurements and statistical significance
The leaf area index (LAI) was measured using a plant canopy analyzer (LI-2000, LI-COR Inc., Lincoln, NE, USA). Ten samples in each field were measured weekly for each of the 3 years. During 2021, 10 additional measurements were conducted due to waterlogged conditions in the original LAI sampling area.
Soil moisture and temperature were measured for both tillage systems in 2021. The measurements were done at the three locations in each field by using the soil moisture and temperature probe CS655 (Campbell Scientific) with the probe inserted horizontally at a depth of 5 cm.
The disease rating for tomato spotted wilt virus (TSWV) was conducted in six locations in each field in 2021. Two peanut rows were used in each location along the length of the fields. The disease rating was measured according to the length of the rows that showed visible symptoms of TSWV.
For yield measurements, six representative locations in each field were selected randomly. KMC six-row peanut picker (Kelley Manufacturing Co., Tifton, GA, USA) was used for picking the peanut. The entire length of the row was measured to calculate the specific area for each plot (the estimated average sampling location area was 0.2 ha for both tillage systems). The yield was adjusted to 7% moisture.
The t-test was conducted for the comparison of averages at various growth stages between the strip tillage and the conventional tillage at the 95% level of significance. The mean comparison was done for the variables LAI, CO2 flux, evapotranspiration (ET), WUE, and yield. Postprocessing of flux data was done by using MATLAB R2018b (MathWorks, Inc.).
3 Results
3.1 Environmental conditions
Of all 3 years, the 2019 growing season with approximately 30-cm rain was the driest compared to 2020 and 2021 (Figure 3). In contrast, the 2020 growing season with approximately 67-cm rain was an average rainfall year among the three experimental years, and 2021 was a year with heavy rainfall of 112 cm during the growing season, leading to waterlogged conditions in the conventional tillage field.
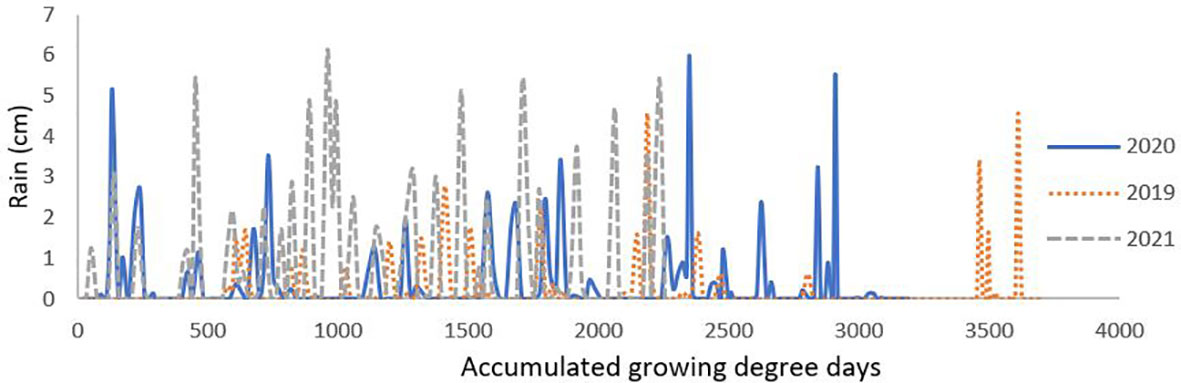
Figure 3 Precipitation trend for all three growing seasons.
Similarly, the average daily air temperature, total precipitation, and vapor pressure deficit (VPD) data are also shown in Table 1. According to the weather data, the growing season in 2019 was warm and dry when compared to the other two growing seasons.
3.2 Leaf area index
The LAI of strip tillage and conventional tillage at different growth stages for the three consecutive years 2019, 2020, and 2021 is depicted in Figure 4. The LAI in strip tillage was significantly greater than that in conventional tillage throughout the growing season in 2019 and 2021 (Figures 4A, C). In 2020, the LAI was similar between both tillage fields early in the growing season (Figure 4B). However, the LAI for conventional tillage decreased sharply beyond aGDD ∼2,000.
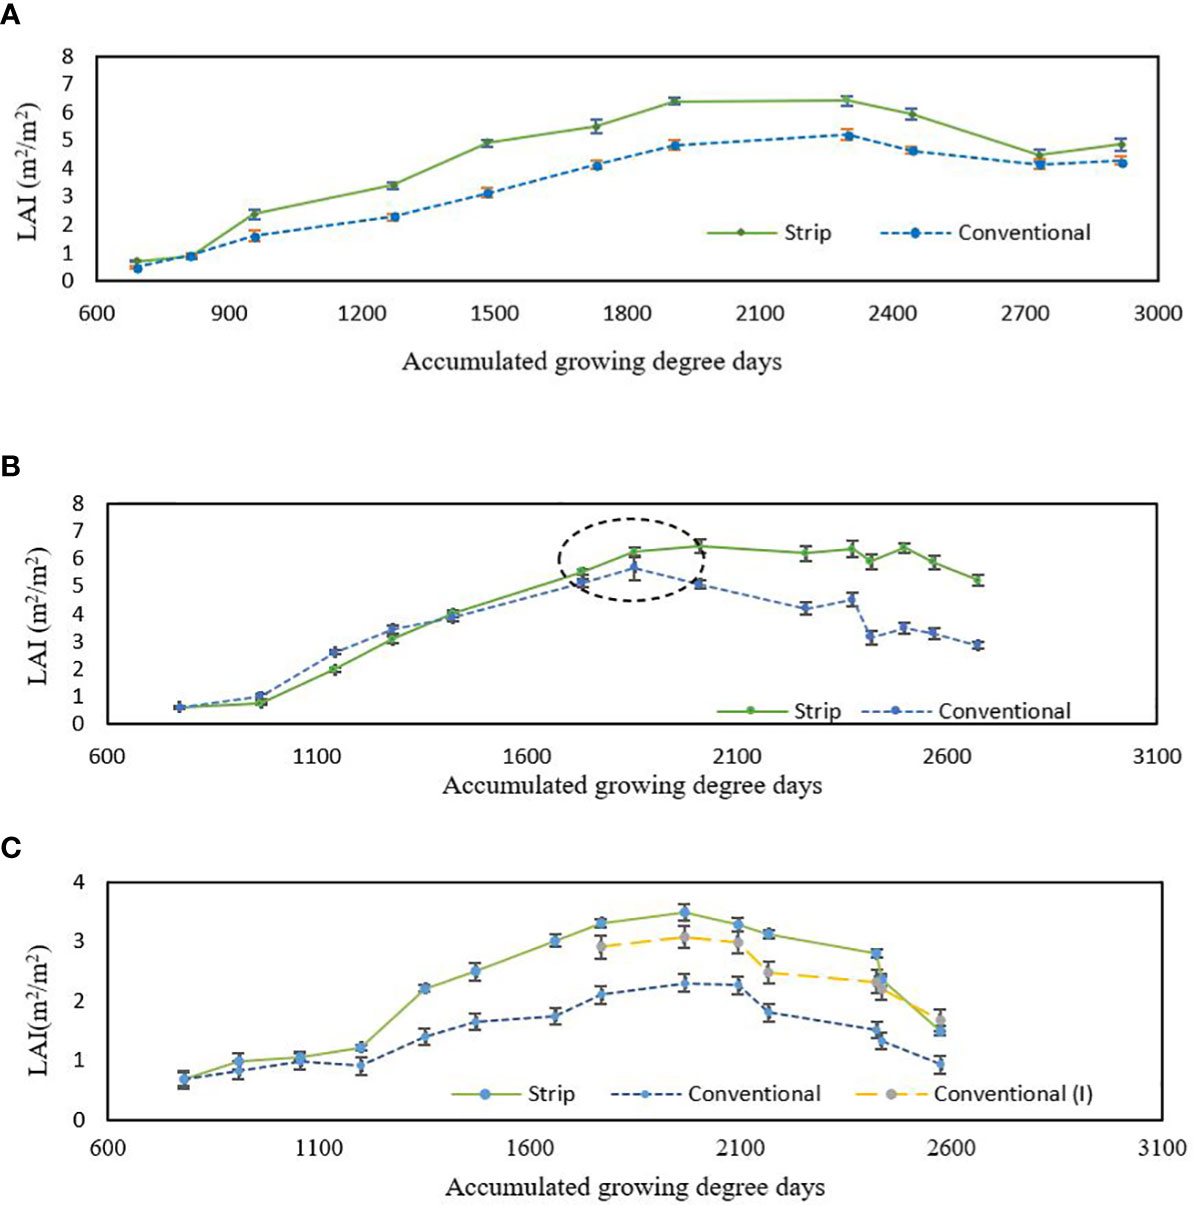
Figure 4 The LAI for (A) 2019, (B) 2020, and (C) 2021 between the strip tillage and the conventional tillage [conventional (I) represents the additional LAI measurements taken due to heterogeneous waterlogging in previous areas].
3.3 Net CO2 flux
In 2019, the net CO2 flux of the strip tillage field was considerably higher as compared to that of the conventional tillage field. The peanut ecosystem CO2 flux of the strip tillage field was 120%, 50%, and 64% greater than those of the conventional tillage in the early (aGDD<1,000), mid (aGDD 1,000–2,000), and late (a GDD >2,000) growth stages, respectively (Figure 5A). In 2020, the differences in CO2 fluxes were nonsignificant during the early growing period, but the conventional tillage showed greater CO2 fluxes during the mid and late growing stages compared to those measured in the strip tillage field (Figure 5B). The 2021 growing season shows a significant difference in the net CO2 fluxes between strip and conventional tillage systems (Figure 5C). This difference is particularly noteworthy during the mid (aGDD 1,000–2,000) and late growth stages (aGDD >2,000) by 21% and 40%, respectively (Figure 5C).
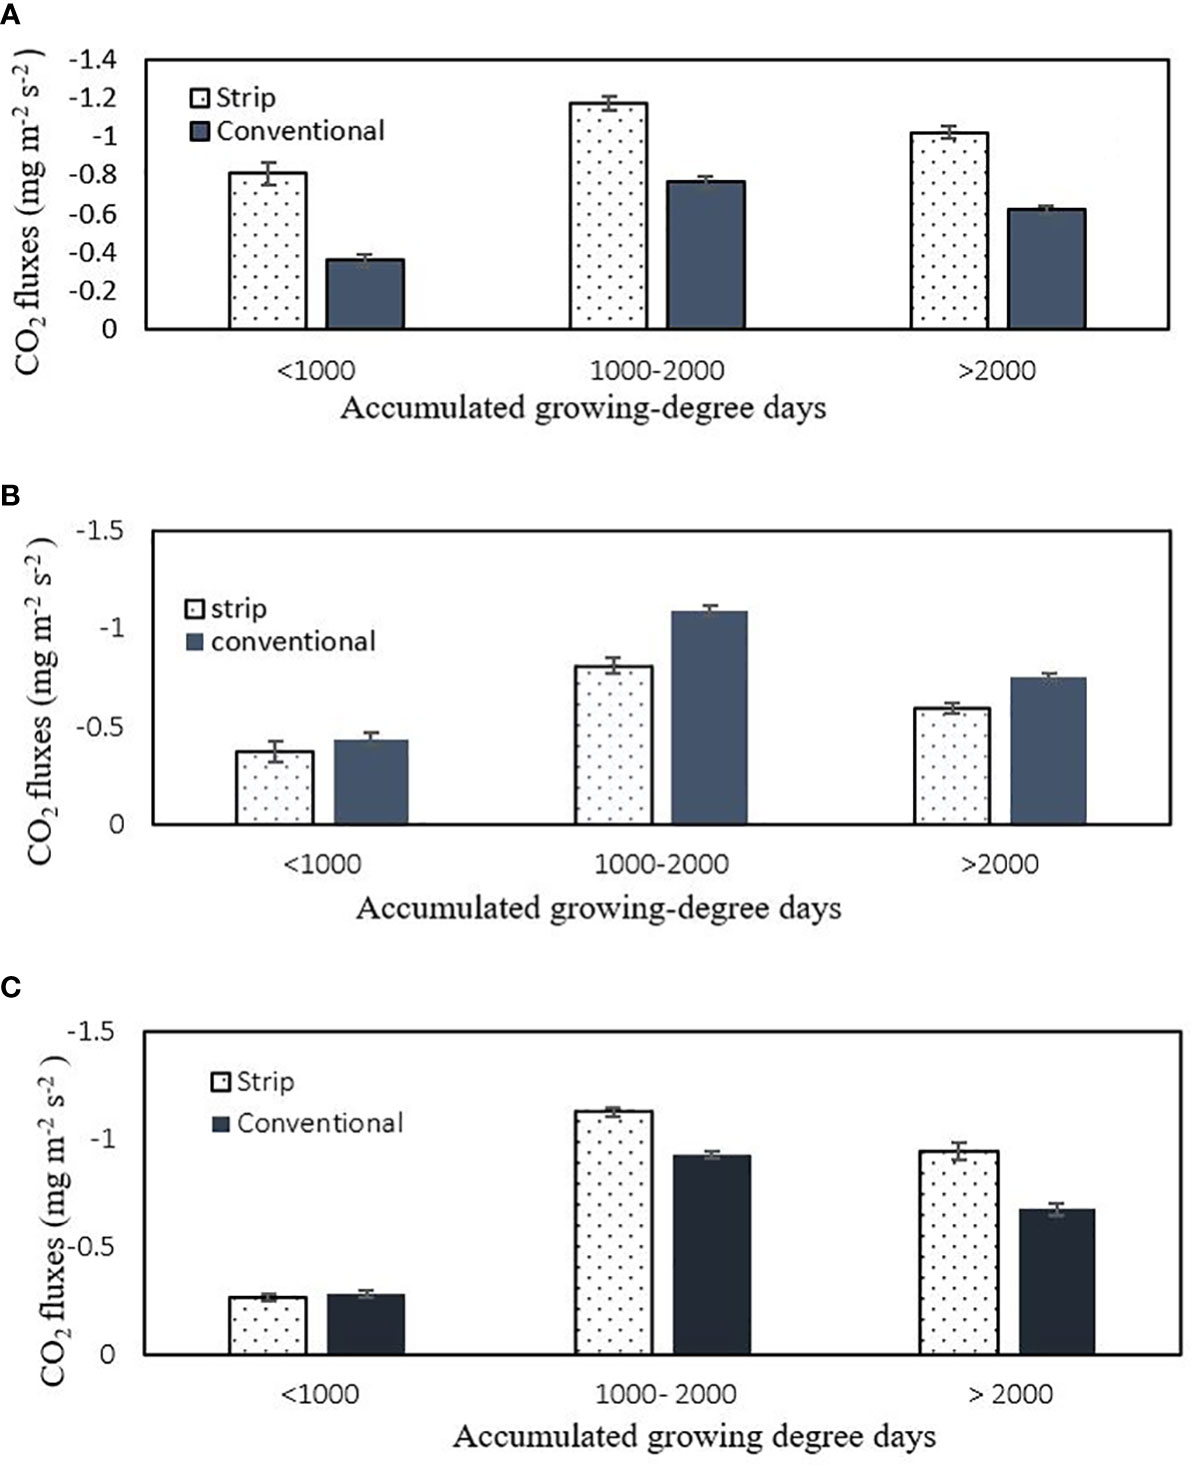
Figure 5 Comparison of total average 30-min CO2 fluxes at various growth stages among different tillage systems in (A) 2019, (B) 2020, and (C) 2021.
3.4 Evapotranspiration
In 2019, the evapotranspiration (ET) exhibited no significant difference between the two tillage systems in early and mid growth stages. However, the conventional tillage had greater evapotranspiration (ET) in the late growth stage (aGDD >2,000) (Figure 6A). In 2020, the conventional tillage had greater evapotranspiration (ET) than the strip tillage throughout all growth stages (Figure 6B). In 2021, the evapotranspiration (ET) with conventional tillage was also higher specifically during aGDD<2,000 (Figure 6C). However, there was no significant difference later in the season (i.e., aGDD >2,000).
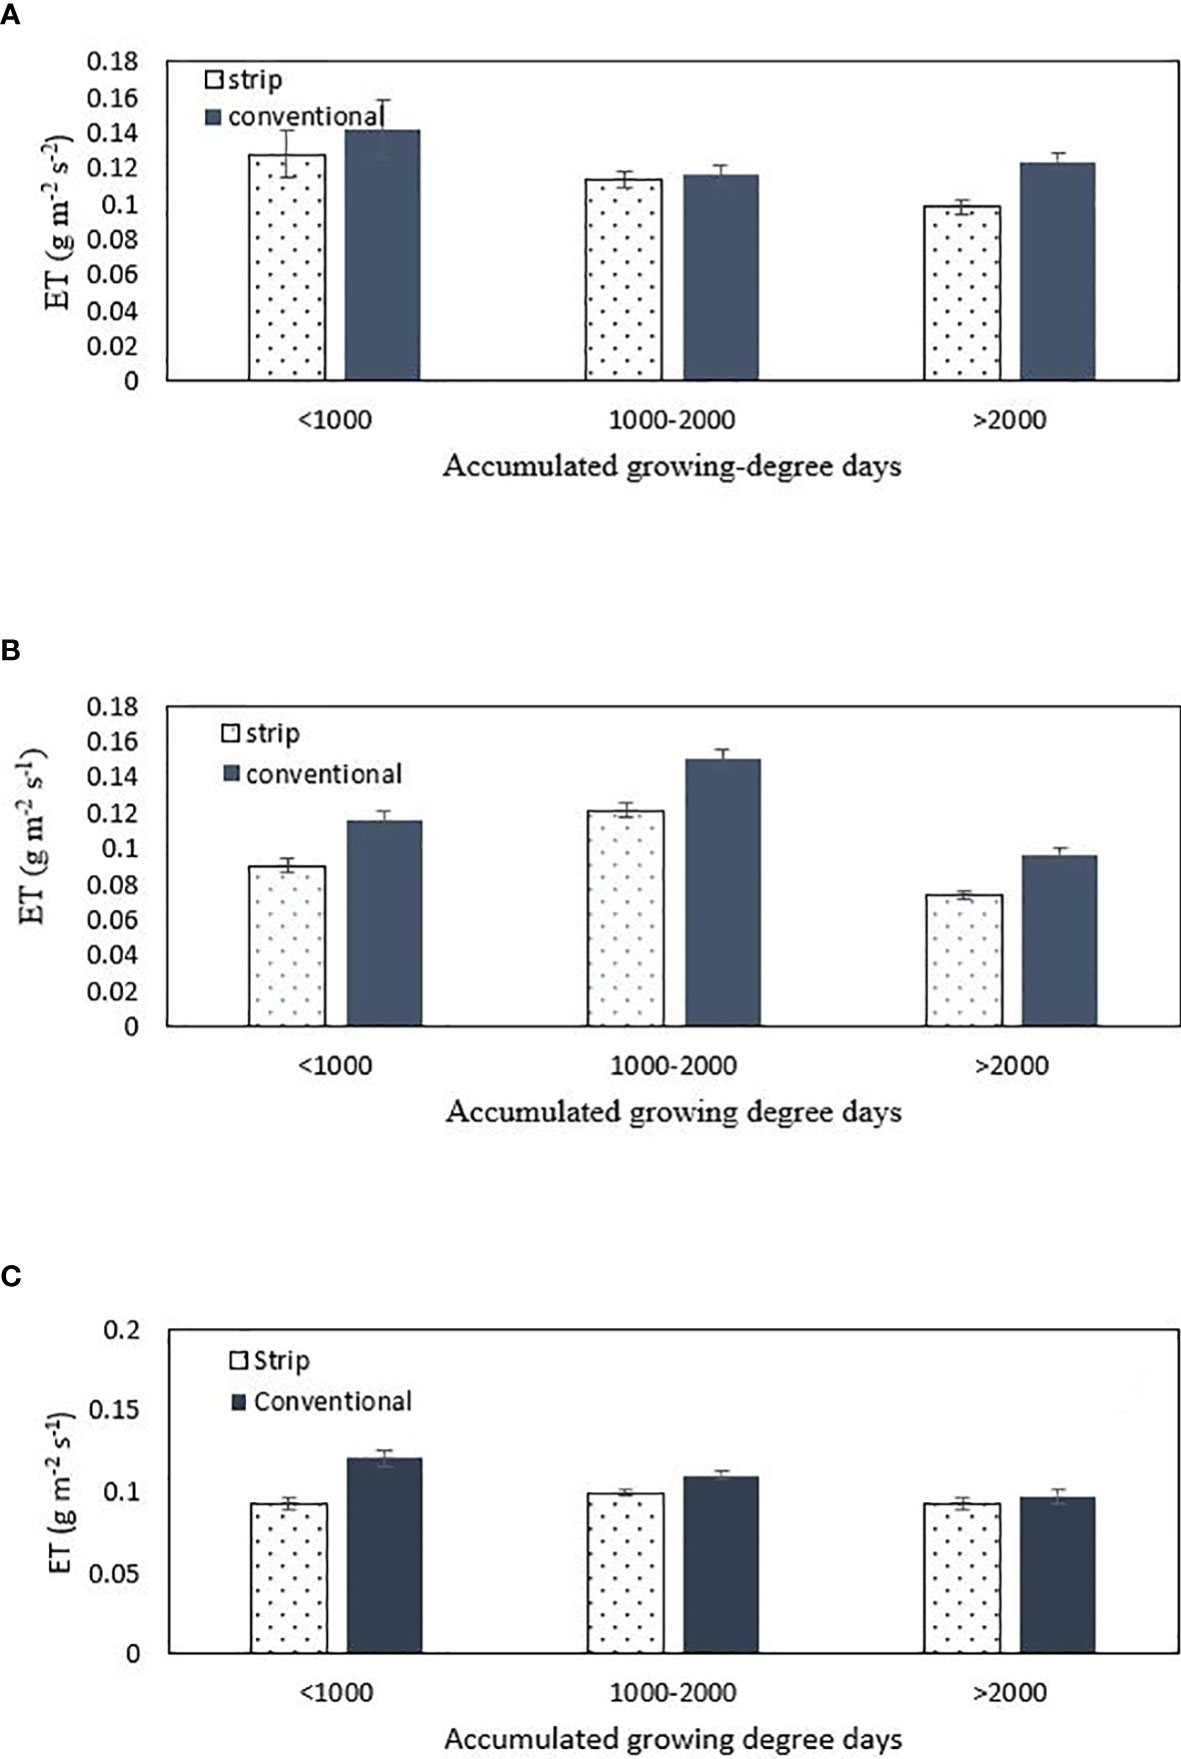
Figure 6 Total average evapotranspiration (ET) during different growth stages for (A) 2019, (B) 2020, and (C) 2021.
3.5 Water-use efficiency
In 2019, the WUE was 40% higher in the strip tillage than that in the conventional tillage at all three growth stages (Figure 7A). However, in 2020, the WUE was higher in the strip tillage field than that in the conventional tillage one when the WUE is low as in the early growth stage. Both tillage systems present similar WUE when the WUE is high as is the case in the early growth stage and in the late growth stage. The WUE is also highest in the conventional tillage in the mid growth stage (Figure 7B). All growth stages in the 2021 growing season showed higher WUE for strip tillage by 18%, 33%, and 47% in the early (aGDD<1,000), mid (aGDD 1,000–2,000), and late (>2,000) growth stages, respectively, compared to those in the conventional tillage (Figure 7C).

Figure 7 Comparison of the total average WUE in (A) 2019, (B) 2020, and (C) 2021.
3.6 Yield
The yield was higher by 33% in the strip tillage field compared to the yield in the conventional tillage field in 2019 (Figure 8). However, in 2020, both tillage systems showed similar yields. Furthermore, the yield in the conventional tillage was 23% higher than that in the conservation tillage in 2021.
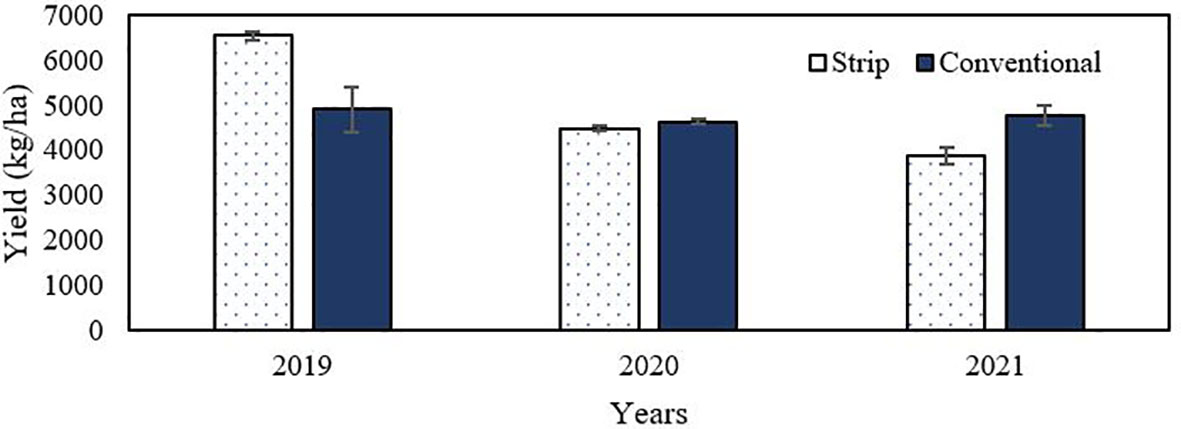
Figure 8 Comparison of the yield between different types of tillage in 2019, 2020, and 2021.
4 Discussion
4.1 Driving factors for the difference in the LAI
Precipitation appears to be the leading factor responsible for the difference in the LAI between the two fields with different tillage systems. The year 2019 was the driest year among the three experimental years (Table 1), and strip tillage typically shows better emergence and growth in dry years by the increased organic matter and cover crop stubs holding and conserving more moisture in earlier growth stages (Wang et al., 2007). This leads to the higher LAI in strip tillage than that in conventional tillage (Figure 4A).
Precipitation and low temperatures during aGDD ~1,800 in 2020 may have helped provide an environment favoring diseases such as early and late leaf spot (Alderman et al, 1989). This could have reduced the LAI in conventional tillage due to the greater defoliation in conventional tillage management when compared to that in strip tillage (Figure 4B). Earlier studies have shown that the leaf spot and TSWV diseases have been more prominent in the conventional tillage than those in the strip tillage (Cantonwine et al., 2006; Monfort et al., 2007; Tubbs et al., 2013). A similar effect was seen in this study according to the Row Crop Plant Disease Clinic, UGA Tifton campus.
The disease rating during 2021 also showed a greater severity of TSWV in the conventional tillage than that in the strip tilled peanut. In 2021, the average TSWV incidence in the strip tillage peanut was 1.6%, whereas the average TSWV incidence in the conventionally tilled peanut was 2.8%. In addition, the total amount of precipitation in 2021 was substantially greater than those in previous years (Figure 3) leading to waterlogged conditions. Using visual observations, the conventional tillage field had a much greater water accumulation (puddles) than the other field. Along with the disease damage, the standing water in the conventional tillage field also likely caused anaerobic respiration hindering plant growth (Hossain and Uddin, 2011). Thus, this likely led to a reduction in the LAI.
4.2 Driving factors for the difference in carbon intake, evapotranspiration (ET), and WUE
Previous studies by Fang and Liang (2008) showed that gross photosynthesis is directly proportional to the LAI. In addition, the net CO2 exchange is closely related to photosynthesis and carbohydrate formation (Evans and von Caemmerer, 2011; Pessarakli, 2018). Therefore, the larger LAI of the strip tillage field in 2019 and 2021 causes larger photosynthesis and then larger net CO2 flux (Figures 5A, C). Leskovar et al. (2016) reported that the strip tillage increases carbohydrate content by increasing photosynthesis, supporting the higher net CO2 flux uptake measured in this experiment. Previous studies have also suggested that conventional tillage fields have higher soil respiration than strip tillage fields (Neogi et al., 2014; Li et al., 2015). This acts to lower the net CO2 exchange in the conventional tillage field as compared to the strip tillage field. However, the defoliation and deformed leaves of peanut and thus the decline in the LAI in the conventional tillage in 2020 attributed to TSWV and low temperature (Table 1) did not lead to lower CO2 flux than that in the strip tillage. The reason for this needs further investigation.
Heavy rainfall occurred during the 2021 growth season (Figure 3). Although the conventionally tilled field and strip tilled field both received similar rainfall, the conventionally tilled field was impacted more than the strip tillage field. Eck and Jones (1992) and Baumhardt et al. (2010) indicated that there is increased soil water drainage and movement of nutrients through the soil profile to depths below the root zone in conservation tillage fields. Likewise, Vyn and Raimbault (1992), Licht and Al-Kaisi (2005), and Hirooka et al. (2019) stated that there was improved soil aggregation in strip tillage systems. Both aspects of conservation tillage systems could have led to the lower impact of heavy rainfall on peanuts in the strip tillage field. However, waterlogging happened in the conventionally tilled peanut field as indicated in Figure 9. For example, the continuous heavy rains prior aGDD of 1,000 in 2021 (as shown in Figure 10A) led to waterlogging as depicted in Figure 9A. Lower CO2 fluxes were observed from the conventional tillage field than those from the strip tillage field afterward (aGDD = 1,200~1,300), while the difference between was not obvious before the heavy rains (Figure 10B). This means that the waterlogging hurt peanut plants and reduced their ability of photosynthesis. The presence of water puddles also led to a spatially heterogeneous peanut growth pattern and a distinctly stunted growth pattern throughout the area. In contrast, the strip tillage field showed homogeneous crop coverage and greater CO2 flux despite having an identical precipitation regime in 2021.
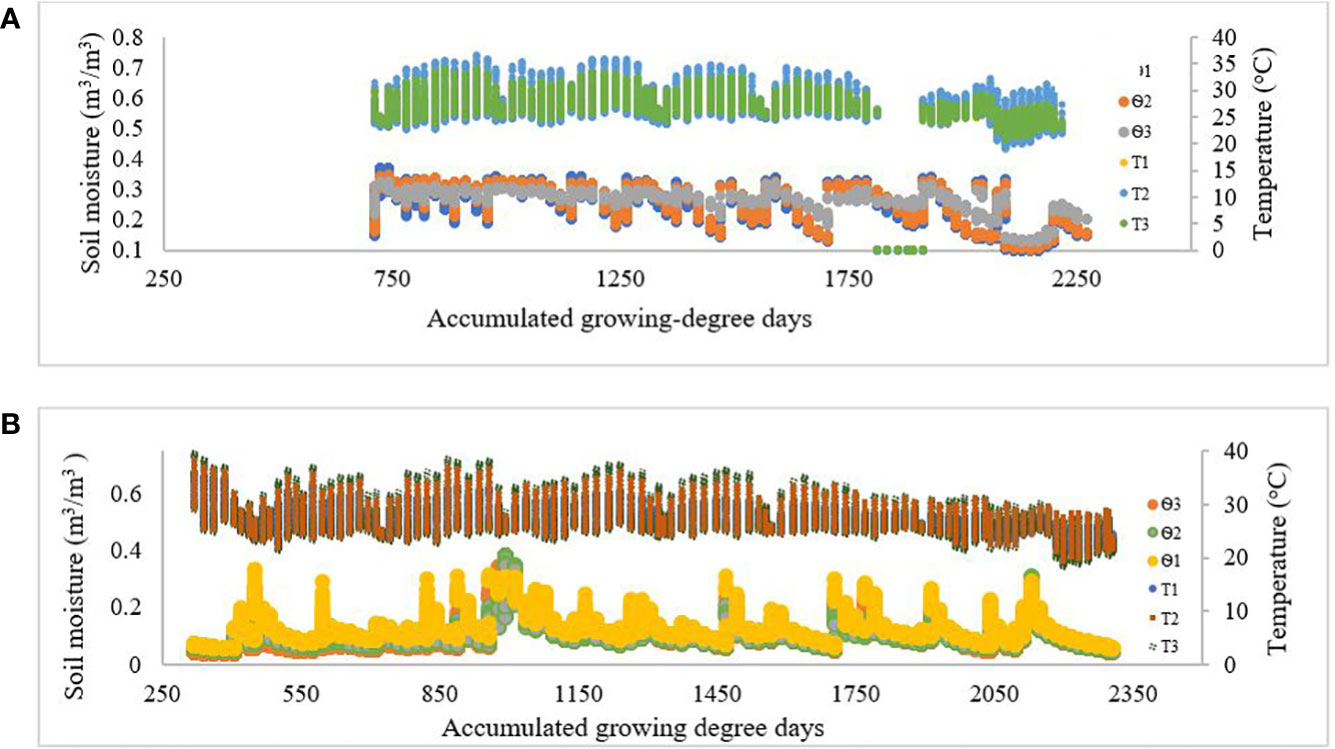
Figure 9 Average 30-min soil moisture and temperature data for (A) the conventional tillage field and (B) the strip tillage field in 2021.
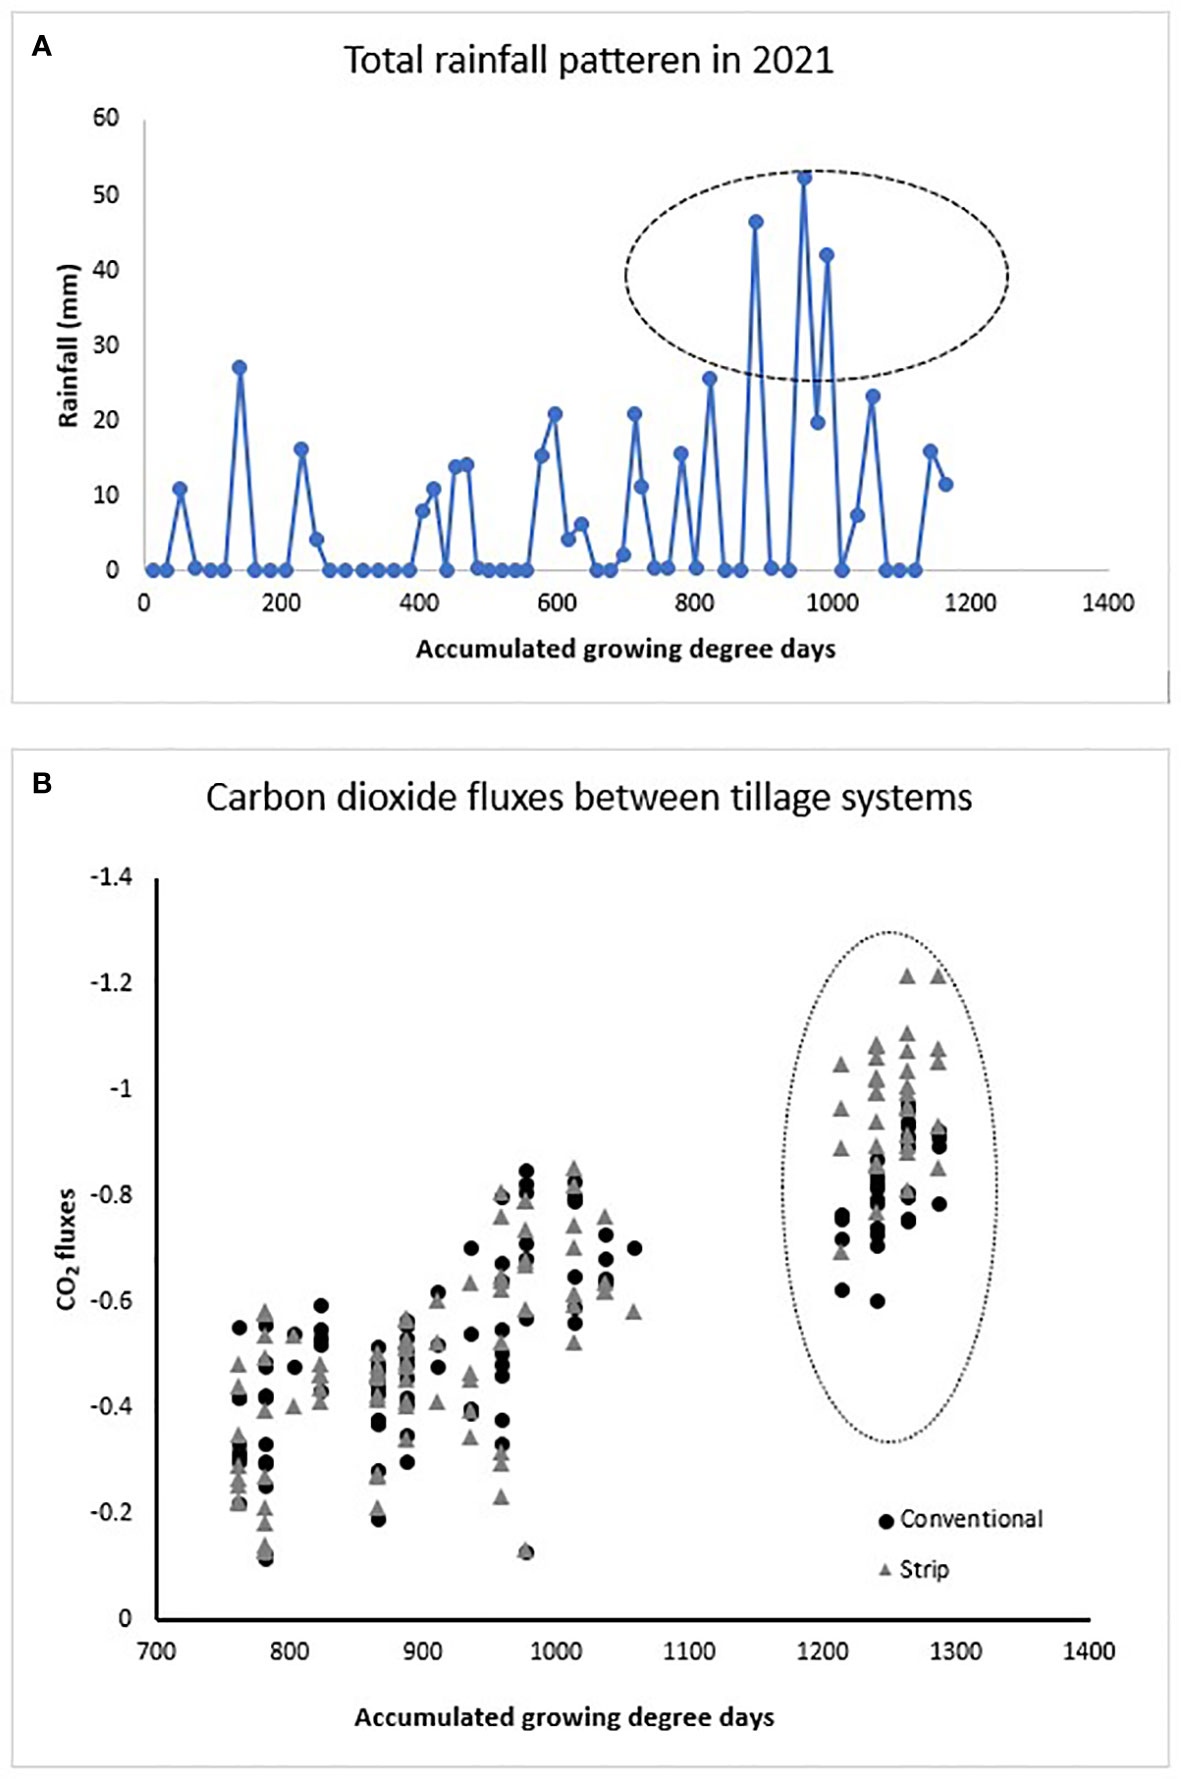
Figure 10 (A) Rainfall variation in 2021 showing continual heavy rains before the aGDD of 1,000 and (B) comparison of CO2 fluxes of peanut canopy between the conventional and the strip tillage.
No significant difference in evapotranspiration (ET) was observed between the two tillage systems in early and mid growth stages in 2019. However, the conventional tillage had the highest evapotranspiration (ET) during the late growth stage (Figure 6A). This result contrasts with previous studies by Morell et al. (2011) and Singh et al. (2015) in which they reported that peanut from the conservation tillage uses less water in a pre-anthesis period (aGDD<1,000) in normal climatic conditions, conserving water for later growth stages. In contrast, larger evapotranspiration (ET) was observed from the strip tillage than the conventional tillage in the earlier growth stage in 2020 and 2021, the same as the previous studies.
Vapor pressure deficit data show that 2019 had a higher evaporative demand than in the two subsequent years (Figure 11). Despite a higher evaporative demand, the strip tillage might have lower soil evaporation due to crop residues (Carman et al, 2018). The soil evaporation fraction to evapotranspiration (ET) is generally considered to be considerably lower relative to transpiration (Medlyn et al., 2017). In the early and middle growth stages, peanut plants are small and bare soil is present. Soil evaporation may be in more considerable part of evapotranspiration (ET). Thus, evapotranspiration (ET) with the strip tillage could be similar to that of the conventional tillage in the current study in 2019, even less than that of the conventional tillage as in our results in 2020 and 2021 and as reported by Morell et al. (2011) and Singh et al. (2015). Kan et al. (2020) also found that evapotranspiration (ET) in the conservation tillage is reduced due to residue mulching and enhanced soil water distribution into deeper soil depths. The higher evapotranspiration (ET) during early growth stages of the conventional tillage fields (Figures 6B, C) can also be due to more exposure to incoming radiation (Tadesse et al., 2021) due to the lack of crop residues as compared to that of the strip tillage.
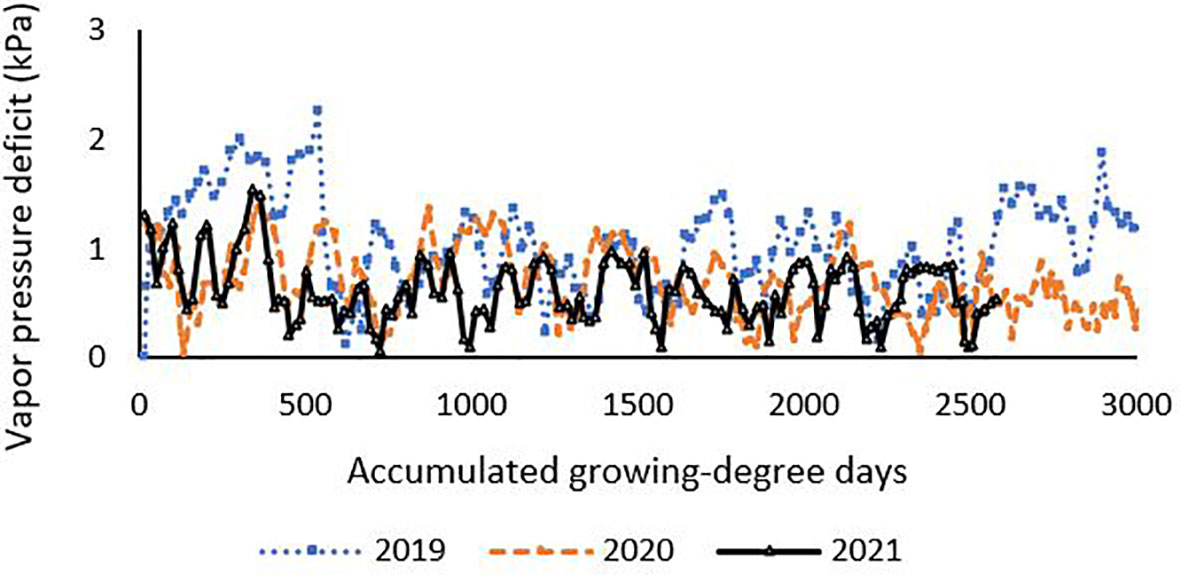
Figure 11 Daily vapor pressure deficit data for the three consecutive growing seasons.
In 2021, there were multiple waterlogged areas in the conventional tillage system (Figure 9A), and thus the evapotranspiration (ET) was also higher specially during aGDD<2,000 (Figure 6C). However, there was no significant difference later in the season (i.e., aGDD >2,000) once the standing water evaporated.
Higher WUE in the strip tillage field than that in the conventional tillage field was observed at all three growth stages in 2019 (Figure 7A). The possible reason for higher WUE could be attributed to the physiological mechanisms under dry conditions in 2019. The VPD data (Figure 11) support that the peanut crop had higher evaporative water demand in 2019, which signifies possible water stress conditions in 2019. Previous studies have shown that mild water stress induces an abscisic acid production in roots and translocation to the leaves, thereby regulating the stomatal openness and transpiration, which in turn improves WUE (Wang et al., 2012; Kang et al., 2021; Schulz et al., 2021). Additionally, the strip tillage increases soil temperature in-row while moisture is conserved for plant growth and development with interrow residue cover as found by Licht and Al-Kaisi (2005). The warmer temperature is considered ideal for early root development. Moreover, the absorption of raindrops due to the crop residues on the surface slows down the impeding water flow and provides more time for infiltration. This could be one of the causes for the greater WUE of strip tillage in 2019.
The 2021 growing season had higher precipitation (with 112-cm rainfall) than the 2020 year. Despite the excessive rainfall, all growth stages showed higher WUE for the strip tillage compared to those for the conventional tillage (Figure 7C). In 2021, the damaged root functions due to waterlogging might have caused stomatal closure impacting the CO2 gas exchange (Voesenek et al., 2013; Arguello et al., 2016). This likely led to lower WUE in the conventional tillage than that in the strip tillage (Figure 7C).
In water-limiting conditions, the strip tillage practice is considered to conserve water throughout the peanut cycle (Wang et al., 2007), resulting in greater photosynthesis. This is likely the reason for the greater yield for the strip tillage in 2019.
5 Conclusion
The study presented ecosystem WUE of peanut grown on conventionally and conservation (strip) tilled fields in early, mid, and late growing season stages over contrasting growing seasons. Carbon and water fluxes as measured with the EC method were used to determine the daytime ecosystem WUE. Results from the present study suggest that, in very dry (2019) or in very wet (2021) years, peanut grown in the strip tillage system exhibits higher WUE. However, in the typical year with the average rainfall in Georgia (2020), there is no difference between the WUE of peanut grown in both tillage systems.
Results from 2019 suggest that the strip tillage peanut consistently exhibited a much larger WUE than that of the conventional tillage system by 105%, 51%, and 32% throughout all three growth stages, respectively. In addition, the TSWV incidence in the field impacted the conventional tillage more than it did the strip tillage.
In 2020, WUE was 14% higher in the strip tillage during the mid growth stage, but the early and late growth stages showed no significant difference. The overall difference in WUE between both tillage systems was nonsignificant. The reason could be the typical rainfall year that favored similar growth in both tillage systems. Even though the TSWV was found in all 3 years, it likely impacted more in the dry year (2019).
Results also suggest that, in 2021, both net carbon uptake and WUE in the strip tillage were considerably higher than those in the conventional tillage field. In 2021, 18%, 33%, and 48% greater ecosystem WUE were found in the strip tillage during early, mid, and late stages, respectively. The main reason for the differences could be waterlogging in the conventional tillage field. Additionally, improved infiltration in the strip tillage might have lowered the impact of waterlogging in 2021.
From the yield perspective, the strip tillage appears to be a better alternative in the dry conditional year. In climates characterized by abundant rainfall, the conventional tillage is likely to lead to higher yield than the strip tillage. This suggests choosing the better type of tillage based on the long-term forecast of rainfall, even though farmers typically use one type of tillage and do not switch.
Data availability statement
The raw data supporting the conclusion of this article will be made available by the authors without undue reservation.
Author contributions
Conceptualization: MYL, RST, WSM. Methodology: MYL and GZ. Field experiments, measurements, and data collection: SB, GZ, SKB, and RST. Data processing and result analysis: SB, GZ, and MYL. Writing–preparing the article with significant contributions from all authors: SB, MYL, GZ, and GLH. Funding acquisition: MYL, RST, and WSM. All authors contributed to the article and approved the submitted version.
Funding
The research was financially supported by the National Peanut Board (grant numbers for the period 2019-2021: RGPNT0001044301, RGPNT0001189201, and RGPNT0001346201) and NASA Georgia Space Grant Consortium.
Acknowledgments
The authors would like to thank Navjot Singh for his assistance during the fieldwork, lab work, and all. We want to thank Cody Mitchell and Sunbelt Agricultural Exposition Darrell Williams Research Farm family in Moultrie, GA, for the cooperation. We wish to also thank Jason Brock from UGA Plant Disease Clinics, Tifton, GA, for disease identification. Last yet not least, we wish to thank Samuel Wright of UGA weather network stations for providing the weather data.
Conflict of interest
The authors declare that the research was conducted in the absence of any commercial or financial relationships that could be construed as a potential conflict of interest.
Publisher’s note
All claims expressed in this article are solely those of the authors and do not necessarily represent those of their affiliated organizations, or those of the publisher, the editors and the reviewers. Any product that may be evaluated in this article, or claim that may be made by its manufacturer, is not guaranteed or endorsed by the publisher.
References
Alderman S. C., Nutter F. W. Jr., Labrinos J. L. (1989). Spatial and temporal analysis of spread of late leaf spot of peanut. Phytopathology 79, 837–844. doi: 10.1094/Phyto-79-837
Alvarez R., Steinbach H. S. (2009). A review of the effects of tillage systems on some soil physical properties, water content, nitrate availability and crops yield in the Argentine Pampas. Soil tillage Res. 104 (1), 1–15. doi: 10.1016/j.still.2009.02.005
Anderson R., Wang D., Skaggs T., Alfieri J., Scanlon T. M., Kustas W. (2017). Impact of water use efficiency parameterization on partitioning evapotranspiration (ET) with the eddy covariance flux variance method. ASA, CSSA, and SSSA International Annual. 2017 Oct 23.
Arguello M. N., Mason R. E., Roberts T. L., Subramanian N., Acuna A., Addison C. K., et al. (2016). Performance of soft red winter wheat subjected to field soil waterlogging: grain yield and yield components. Field Crops Res. 194, 57–64. doi: 10.1016/j.fcr.2016.04.040
Arriga N., Rannik Ü., Aubinet M., Carrara A., Vesala T., Papale D. (2017). Experimental validation of footprint models for eddy covariance CO2 flux measurements above grassland by means of natural and artificial tracers. Agric. For. Meteorology 242, 75–84. doi: 10.1016/j.agrformet.2017.04.006
Aubinet M., Vesala T., Papale D. (2012). Eddy covariance: a practical guide to measurement and data analysis (Berlin, Germany: Springer Science & Business Media), 460.
Baldocchi D. (1994). A comparative study of mass and energy exchange rates over a closed C3 (wheat) and an open C4 (corn) crop: II. CO2 exchange and water use efficiency. Agric. For. Meteorol. 67 (3-4), 291–321. doi: 10.1016/0168-1923(94)90008-6
Baumhardt R. L., Scanlon B. R., Schwartz R. C. (2010). The impact of longterm conventional and no–tillage management on field hydrology and groundwater recharge. Conserv. Agric. Impacts–Local Global, 70.
Beasley J., Bader M., Baldwin J., Harris G., Padgett B., Brown S. L., et al. (1997). Peanut production field guide Vol. 1146 (Tifton, GA: Georgia: Cooperative Extension Service Bulletin), 25.
Blankenagel S., Yang Z., Avramova V., Schön C. C., Grill E. (2018). Generating plants with improved water use efficiency. Agronomy 8 (9), 194. doi: 10.3390/agronomy8090194
Boote K. J. (1982). Growth stages of peanut (Arachis hypogea L.). Peanut Sci. 9 (1), 35–40. doi: 10.3146/i0095-3679-9-1-11
Branch W. D. (2007). Registration of 'Georgia-06G'peanut. J. Plant Registrations 1 (2), 120–120. doi: 10.3198/jpr2006.12.0812crc
Cantonwine E. G., Culbreath A. K., Stevenson K. L., Kemerait R. C. Jr., Brenneman T. B., Smith N. B., et al. (2006). Integrated disease management of leaf spot and spotted wilt of peanut. Plant Dis. 90 (4), 493–500. doi: 10.1094/PD-90-0493
Carman K., Çıtıl E., Marakoğlu T., Gür K., Kırılmaz H. (2018). Comparison of strip tillage systems for sillage maize production in middle anatolia. Selcuk J. Agric. Food Sci. 32 (3), 430–435.
Colvin D. L., Brecke B. J. (1988). Peanut cultivar response to tillage systems. Peanut Sci. 15 (1), 21–24. doi: 10.3146/i0095-3679-15-1-7
Deines J. M., Wang S., Lobell D. B. (2019). Satellites reveal a small positive yield effect from conservation tillage across the US Corn Belt. Environ. Res. Lett. 14 (12), 124038. doi: 10.1088/1748-9326/ab503b
Dekker S. C., Groenendijk M., Booth B. B., Huntingford C., Cox P. M. (2016). Spatial and temporal variations in plant water-use efficiency inferred from tree-ring, eddy covariance and atmospheric observations. Earth System Dynamics 7 (2), 525–533. doi: 10.5194/esd-7-525-2016
Derpsch R. (2003). “Conservation tillage, no-tillage and related technologies,” in Conservation agriculture: environment, farmers experiences, innovations, socio-economy, policy (Dordrecht: Springer Netherlands), 181–190.
Eck H. V., Jones O. R. (1992). Soil nitrogen status as affected by tillage, crops, and crop sequences. Agron. J. 84 (4), 660–668. doi: 10.2134/agronj1992.00021962008400040025x
Engstrom J., Praskievicz S., Bearden B., Moradkhani H. (2021). Decreasing water resources in Southeastern US as observed by the GRACE satellites. Water Policy 23 (4), 1017–1029. doi: 10.2166/wp.2021.039
Evans J. R., von Caemmerer S. (2011). Enhancing photosynthesis. Plant Physiol. 155 (1), 19. doi: 10.1104/pp.110.900402
Eyland D., van Wesemael J., Lawson T., Carpentier S. (2021). The impact of slow stomatal kinetics on photosynthesis and water use efficiency under fluctuating light. Plant Physiol. 186 (2), 998–1012. doi: 10.1093/plphys/kiab114
Faircloth W. H., Rowland D. L., Lamb M. C., Balkcom K. S. (2012). Interaction of tillage system and irrigation amount on peanut performance in the southeastern US. Peanut Sci. 39 (2), 105–112. doi: 10.3146/PS12-1.1
Fang H., Liang S. (2008). Leaf area index models. Encyclopedia Ecol., 2139–2148. doi: 10.1016/B978-008045405-4.00190-7
Fill J. M., Davis C. N., Crandall R. M. (2019). Climate change lengthens southeastern USA lightning-ignited fire seasons. Global Change Biol. 25 (10), 3562–3569. doi: 10.1111/gcb.14727
Golladay S. W., Gagnon P., Kearns M., Battle J. M., Hicks D. W. (2004). Response of freshwater mussel assemblages (Bivalvia: Unionidae) to a record drought in the Gulf Coastal Plain of southwestern Georgia. J. North Am. Benthological Soc. 23 (3), 494–506. doi: 10.1899/0887-3593(2004)023<0494:ROFMAB>2.0.CO;2
Grichar W. J., Boswell T. E. (1987). Comparison of no-tillage, minimum, and full tillage cultural practices on peanuts. Peanut Sci. 14 (2), 101–103. doi: 10.3146/i0095-3679-14-2-13
Hawkins G. L., Kelton J., Smith N., Balkcom K. (2016). A note on comparing rate of soil moisture loss for conventional and conservation tillage production methods for peanut (Arachis hypogaea). Peanut Sci. 43 (2), 168–172. doi: 10.3146/PS16-4.1
Hirooka Y., Shoji K., Watanabe Y., Izumi Y., Awala S. K., Iijima M. (2019). Ridge formation with strip-tillage alleviates excess moisture stress for drought-tolerant crops. Soil Tillage Res. 195, 104429. doi: 10.1016/j.still.2019.104429
Hossain M. A., Uddin S. N. (2011). Mechanisms of waterlogging tolerance in wheat: Morphological and metabolic adaptations under hypoxia or anoxia. Aust. J. Crop Sci. 5 (9), 1094–1101.
Hu Z. M., Yu G. R., Fu Y. L., Sun X. M., Li Y. N., Shi P. L., et al. (2008). Effects of vegetation control on ecosystem water use efficiency within and among four grassland ecosystems in China. Global Change Biol. 14 (7), 1609–1619. doi: 10.1111/j.1365-2486.2008.01582.x
Johnson W. C. III, Brenneman T. B., Baker S. H., Johnson A. W., Sumner D. R., Mullinix B. G. Jr. (2001). Tillage and pest management considerations in a peanut–cotton rotation in the southeastern Coastal Plain. Agron. J. 93 (3), 570–576. doi: 10.2134/agronj2001.933570x
Jordan D. L., Barnes J. S., Bogle C. R., Brandenburg R. L., Bailey J. E., Johnson P. D., et al. (2003). Peanut response to cultivar selection, digging date, and tillage intensity. Agron. J. 95 (2), 380–385. doi: 10.2134/agronj2003.3800
Jordan D. L., Johnson P. D. (2010). “Summary of peanut response to tillage in North Carolina from 1997–2009,” in Proceedings of the 42nd American Peanut Research and Education Society Meeting, College Station, TX. 39.
Kan Z. R., Liu Q. Y., He C., Jing Z. H., Virk A. L., Qi J. Y., et al. (2020). Responses of grain yield and water use efficiency of winter wheat to tillage in the North China Plain. Field Crops Res. 249, 107760. doi: 10.1016/j.fcr.2020.107760
Kang J., Hao X., Zhou H., Ding R. (2021). An integrated strategy for improving water use efficiency by understanding physiological mechanisms of crops responding to water deficit: Present and prospect. Agric. Water Manage. 255, 107008. doi: 10.1016/j.agwat.2021.107008
Kljun N., Calanca P., Rotach M. W., Schmid H. P. (2015). A simple two-dimensional parameterization for Flux Footprint Prediction (FFP). Geoscientific Model. Dev. 8 (11), 3695–3713. doi: 10.5194/gmd-8-3695-2015
Kormann R., Meixner F. X. (2001). An analytical footprint model for non-neutral stratification. Boundary-Layer Meteorology 99, 207–224. doi: 10.1023/A:1018991015119
Leclerc M. Y., Foken T. (2014). “Surface-layer properties and parameterizations,” in Footprints in micrometeorology and ecology (Berlin, Heidelberg: Springer), 21–70.
Leclerc M. Y., Thurtell G. W. (1990). Footprint prediction of scalar fluxes using a Markovian analysis. Boundary-Layer Meteorology 52 (3), 247–258. doi: 10.1007/BF00122089
Leskovar D., Othman Y., Dong X. (2016). Strip tillage improves soil biological activity, fruit yield, and sugar content of triploid watermelon. Soil Tillage Res. 163, 266–273. doi: 10.1016/j.still.2016.06.007
Li S., Jiang X., Wang X., Wright A. L. (2015). Tillage effects on soil nitrification and the dynamic changes in nitrifying microorganisms in a subtropical rice-based ecosystem: A long-term field study. Soil Tillage Res. 150, 132–138. doi: 10.1016/j.still.2015.02.005
Licht M. A., Al-Kaisi M. (2005). Strip-tillage effect on seedbed soil temperature and other soil physical properties. Soil Tillage Res. 80 (1-2), 233–249. doi: 10.1016/j.still.2004.03.017
Medlyn B. E., De Kauwe M. G., Lin Y. S., Knauer J., Duursma R. A., Williams C. A., et al. (2017). How do leaf and ecosystem measures of water-use efficiency compare? New Phytol. 216 (3), 758–770. doi: 10.1111/nph.14626
Medrano H., Flexas J., Galmés J. (2009). Variability in water use efficiency at the leaf level among Mediterranean plants with different growth forms. Plant Soil 317 (1), 17–29. doi: 10.1007/s11104-008-9785-z
Mills W. T. (1964). Heat unit system for predicting optimum peanut harvesting time. Trans. Am. Soc Agric. Engrs 7, 307–310. doi: 10.13031/2013.40765
Moffat A. M., Papale D., Reichstein M., Hollinger D. Y., Richardson A. D., Barr A. G., et al. (2007). Comprehensive comparison of gap-filling techniques for eddy covariance net carbon fluxes. Agric. For. Meteorol. 147 (3-4), 209–232. doi: 10.1016/j.agrformet.2007.08.011
Mokhtar A., He H., Alsafadi K., Mohammed S., He W., Li Y., et al. (2022). Ecosystem water use efficiency response to drought over southwest China. Ecohydrology 15 (5), e2317. doi: 10.1002/eco.2317
Monfort W. S., Culbreath A. K., Stevenson K. L., Brenneman T. B., Perry C. D. (2007). Use of resistant peanut cultivars and reduced fungicide inputs for disease management in strip-tillage and conventional tillage systems. Plant Health Prog. 8 (1), 16. doi: 10.1094/PHP-2007-0614-01-RS
Morell F. J., Lampurlanés J., Álvaro-Fuentes J., Cantero-Martínez C. (2011). Yield and water use efficiency of barley in a semiarid Mediterranean agroecosystem: Long-term effects of tillage and N fertilization. Soil Tillage Res. 117, 76–84. doi: 10.1016/j.still.2011.09.002
Neogi S., Bhattacharyya P., Roy K. S., Panda B. B., Nayak A. K., Rao K. S., et al. (2014). Soil respiration, labile carbon pools, and enzyme activities as affected by tillage practices in a tropical rice–maize–cowpea cropping system. Environ. Monit. Assess. 186 (7), 4223–4236. doi: 10.1007/s10661-014-3693-x
Niu S., Xing X., Zhang Z. H. E., Xia J., Zhou X., Song B., et al. (2011). Water-use efficiency in response to climate change: from leaf to ecosystem in a temperate steppe. Global Change Biol. 17 (2), 1073–1082. doi: 10.1111/j.1365-2486.2010.02280.x
National Oceanic and Atmospheric Administration (NOAA) (2021). Fourth national climate assessment. Our changing Climate 2, 74–76.
Ogle S. M., Swan A., Paustian K. (2012). No-till management impacts on crop productivity, carbon input and soil carbon sequestration. Agriculture Ecosyst. Environ. 149, 37–49. doi: 10.1016/j.agee.2011.12.010
Paz J. O., Fraisse C. W., Hatch L. U., y Garcia A. G., Guerra L. C., Uryasev O., et al. (2007). Development of an ENSO-based irrigation decision support tool for peanut production in the southeastern US. Comput. Electron. Agric. 55 (1), 28–35. doi: 10.1016/j.compag.2006.11.003
Phillips R. E., Thomas G. W., Blevins R. L., Frye W. W., Phillips S. H. (1980). No-tillage agriculture. Science 208 (4448), 1108–1113. doi: 10.1126/science.208.4448.1108
Pimental D., Sparks D. L. (2000). Soil as an endangered ecosystem. BioScience 50 (11), 947. doi: 10.1641/0006-3568(2000)050[0947:SAAEE]2.0.CO;2
Raimbault B. A. (1992). Evaluation of strip tillage systems for corn production in Ontario. Soil Tillage Res. 23 (1-2), 163–176.
Reicosky D. C. (2015). Conservation tillage is not conservation agriculture. J. Soil Water Conserv. 70 (5), 103A–108A. doi: 10.2489/jswc.70.5.103A
Richardson S. G., McCree K. J. (1985). Carbon balance and water relations of sorghum exposed to salt and water stress. Plant Physiol. 79 (4), 1015–1020. doi: 10.1104/pp.79.4.1015
Richburg J. S., Wilcut J. W., Colvin D. L., Wiley G. R. (1996). Weed management in southeastern peanut (Arachis hypogaea) with AC 263,222. Weed Technol. 10 (1), 145–152. doi: 10.1017/S0890037X00045851
Rowland D., Sorensen R., Butts C., Faircloth W. (2006). Determination of maturity and degree day indices and their success in predicting peanut maturity. Peanut Sci. 33, 125–136. doi: 10.3146/0095-3679(2006)33[125:DOMADD]2.0.CO;2
Scanlon T. M., Albertson J. D. (2004). Canopy scale measurements of CO2 and water vapor exchange along a precipitation gradient in southern Africa. Global Change Biol. 10 (3), 329–341. doi: 10.1046/j.1365-2486.2003.00700.x
Schulz P., Piepenburg K., Lintermann R., Herde M., Schöttler M. A., Schmidt L. K., et al. (2021). Improving plant drought tolerance and growth under water limitation through combinatorial engineering of signaling networks. Plant Biotechnol. J. 19 (1), 74. doi: 10.1111/pbi.13441
Singh B., Humphreys E., Gaydon D. S., Yadav S. (2015). Options for increasing the productivity of the rice–wheat system of north west India while reducing groundwater depletion. Part 2. Is conservation agriculture the answer? Field Crops Res. 173, 81–94. doi: 10.1016/j.fcr.2014.11.019
Sun G. (2013). Impacts of climate change and variability on water resources in the Southeast USA. Climate Southeast United States, 210–236. doi: 10.5822/978-1-61091-509-0_10
Tadesse H. K., Moriasi D. N., Gowda P. H., Wagle P., Starks P. J., Steiner J. L., et al. (2021). Comparison of evapotranspiration (ET) and biomass simulation in winter wheat under conventional and conservation tillage systems using apex model. Ecohydrology Hydrobiology 21 (1), 55–66. doi: 10.1016/j.ecohyd.2020.08.003
Tubbs R., Balkcom K., Toews M., Srinivasan R. (2013). “Effects of fertilization, tillage, and phorate on thrips and TSWV incidence in early planted peanuts,” in Proceedings of the American Peanut Research and Education Society. 34.
Tubbs R. S., Gallaher R. N. (2005). Conservation tillage and herbicide management for two peanut cultivars. Agron. J. 97 (2), 500–504. doi: 10.2134/agronj2005.0500
USDA (2021). Crop production 2020 summary, released january 2021 (National Agricultural Statistics Service (NASS), United States Department of Agriculture (Washington, DC: USDA).
Vickers D., Mahrt L. (1997). Quality control and flux sampling problems for tower and aircraft data. J. Atmospheric Oceanic Technol. 14 (3), 512–526. doi: 10.1175/1520-0426(1997)014<0512:QCAFSP>2.0.CO;2
Voesenek L. A. C. J., Sasidharan R., Weber A. (2013). Ethylene- and oxygen signalling-drive plant survival during flooding. Plant Biol. 15, 426–435. doi: 10.1111/plb.12014
Vorosmarty C. J., Green P., Salisbury J., Lammers R. B. (2000). Global water resources: vulnerability from climate change and population growth. Science 289 (5477), 284–288.
Vyn T. J., Raimbault B. A. (1992). Evaluation of strip tillage for corn production in Ontario. Soil Tillage Res. 23(1), 163–176.
Wagle P., Gowda P. H., Xiao X., Anup K. C. (2016). Parameterizing ecosystem light use efficiency and water use efficiency to estimate maize gross primary production and evapotranspiration (ET) using MODIS EVI. Agric. For. Meteorol. 222, 87–97. doi: 10.1016/j.agrformet.2016.03.009
Wagle P., Skaggs T. H., Gowda P. H., Northup B. K., Neel J. P. (2020). Flux variance similarity-based partitioning of evapotranspiration (ET) over a rainfed alfalfa field using high frequency eddy covariance data. Agric. For. Meteorol. 285, 107907. doi: 10.1016/j.agrformet.2020.107907
Wang X. B., Cai D. X., Hoogmoed W. B., Oenema O., Perdok U. D. (2007). Developments in conservation tillage in rainfed regions of North China. Soil Tillage Res. 93 (2), 239–250. doi: 10.1016/j.still.2006.05.005
Wang Z., Kang S., Jensen C. R., Liu F. (2012). Alternate partial root-zone irrigation reduces bundle-sheath cell leakage to CO2 and enhances photosynthetic capacity in maize leaves. J. Exp. Bot. 63 (3), 1145–1153. doi: 10.1093/jxb/err331
Webb E. K., Pearman G. I., Leuning R. (1980). Correction of flux measurements for density effects due to heat and water vapour transfer. Q. J. R. Meteorological Soc. 106 (447), 85–100. doi: 10.1002/qj.49710644707
Wiatrak P. J., Wright D. L., Marois J. J. (2004). Tillage and residual nitrogen impact on wheat forage. Agron. J. 96 (6), 1761–1764. doi: 10.2134/agronj2004.1761
Wieser H., Troger N. (2018). Exploring the inner loops of the circular economy: Replacement, repair, and reuse of mobile phones in Austria. J. Cleaner Production 172, 3042–3055. doi: 10.1016/j.jclepro.2017.11.106
Wilczak J. M., Oncley S. P., Stage S. A. (2001). Sonic anemometer tilt correction algorithms. Boundary-layer meteorology 99 (1), 127–150. doi: 10.1023/A:1018966204465
Williams R. B., Al-Hmoud R., Segarra E., Mitchell D. (2017). An estimate of the shadow price of water in the southern Ogallala Aquifer. Journal of. Water Resource Prot. 9 (3), 289–304. doi: 10.4236/jwarp.2017.93019
Zhang G., Leclerc M. Y., Singh N., Tubbs R. S., Monfort W. S. (2022). Impact of planting date on CO2 fluxes, evapotranspiration (ET) and water-use efficiency in peanut using the eddy-covariance technique. Agric. For. Meteorology 326, 109163. doi: 10.1016/j.agrformet.2022.109163
Zhang G., Leclerc M. Y., Singh N., Tubbs R. S., Montfort W. S. (2023). Influence of planting pattern on peanut daytime net carbon uptake, evapotranspiration (ET), and water-use efficiency using the eddy-covariance method. Front. Agronomy Sec. Climate-Smart Agron. 5. doi: 10.3389/fagro.2023.1204887
Keywords: water-use efficiency, daytime net ecosystem carbon uptake, peanut tillage, evapotranspiration (ET), eddy-covariance flux, conservation tillage
Citation: Bogati S, Leclerc MY, Zhang G, Kaur Brar S, Tubbs RS, Monfort WS and Hawkins GL (2023) The impact of tillage practices on daytime CO2 fluxes, evapotranspiration (ET), and water-use efficiency in peanut. Front. Agron. 5:1228407. doi: 10.3389/fagro.2023.1228407
Received: 24 May 2023; Accepted: 17 July 2023;
Published: 01 September 2023.
Edited by:
Pratap Bhattacharyya, ICAR-NRRI, IndiaReviewed by:
Anchal Dass, Indian Agricultural Research Institute (ICAR), IndiaDengpan Xiao, Hebei Normal University, China
Copyright © 2023 Bogati, Leclerc, Zhang, Kaur Brar, Tubbs, Monfort and Hawkins. This is an open-access article distributed under the terms of the Creative Commons Attribution License (CC BY). The use, distribution or reproduction in other forums is permitted, provided the original author(s) and the copyright owner(s) are credited and that the original publication in this journal is cited, in accordance with accepted academic practice. No use, distribution or reproduction is permitted which does not comply with these terms.
*Correspondence: Monique Y. Leclerc, TUxlY2xlcmNAdWdhLmVkdQ==