 Belay T. Kassie1
 David W. Onstad
 Randy Clark
 Gerie van der Heijden
- 1Research and Development, Corteva Agriscience, Johnston, IA, United States
- 2Research and Development, Corteva Agriscience, Mogi-Mirim, SP, Brazil
Asian soybean rust, caused by the biotrophic basidiomycete Phakospora pachyrhizi, is a foliar disease that often causes considerable damage to soybean crops. The purpose of our work was to create a mechanistic model that can reliably represent epidemics of ASR in commercial soybean fields in Brazil. The most important inputs for the model are weather data (observations and forecast) and the initial observation of disease (or uredospore arrival). Our focus is on the first two or three cycles of infection after immigration into a soybean field. The model includes state variables for latent, infectious and senesced lesions, disease severity, uredospores, and soybean leaf area. Processes modeled include maturation through the latent and infectious periods, germination, sporulation, and processes affecting uredospores in the canopy. The model results were tested against field observations from trials at four locations in Brazil for the 2019/2020 growing season. The predictions generally matched the daily dynamics of disease progress in the field trials. The predictions reproduced the observed severity well with R2 value of 0.84. This high correlation indicates that our model is accurate enough to be used as a tool to predict the dynamics of ASR epidemics during the first few cycles after uredospore invasion into a soybean field. A sensitivity analysis was performed that showed that the model is sensitive to time and duration of the initial spore arrival. This indicates that spore traps or other observations should measure not only the first day of arrival but also subsequent days.
1 Introduction
Asian Soybean Rust (ASR), caused by the biotrophic basidiomycete Phakospora pachyrhizi, is a foliar disease that often causes considerable damage to soybean crops (Glycine max). When environmental conditions are optimal for rust development, ASR causes 70 to 100% yield losses (EMBRAPA, 2004). Since the first outbreak in 2001 in Brazil, ASR has caused more than US$10 billion in crop losses (Yorinori et al., 2005; Langenbach et al., 2016). Farmers attempt to manage the pathogen with fallow period, early planting, early maturing varieties, fungicides and host-plant resistance (Koga et al., 2008; Koga et al., 2011).
Application of fungicides during soybean growing season is the most widely used strategy to control ASR. Scherm et al. (2009) presented a meta-analysis of the results of fungicide trials conducted in Brazil from 2003/2004 to 2006/2007. Timing is done mostly by phenological stage of the crop, with Vx representing vegetative growth stages and R1 (beginning of flowering) till R8 (full maturity) the reproductive growth stages (see for example https://crops.extension.iastate.edu/soybean/production_growthstages.html). Single applications most often occurred in soybean reproductive growth stages R2/R3 with a smaller proportion at R5. When multiple applications were used, they occurred at R1-R2 plus R5. Depending on the regional climate, the current practice for farmers is to use 3-5 fungicide applications during the growing season to control ASR and other soybean diseases. Scherm et al. (2009) determined that response ratios were dependent on ASR disease pressure (expressed as disease severity of the untreated check), with fungicide treatments showing the best reduction in rust severity when ASR pressure was low and the best yield response to fungicide treatments occurring with high disease pressure. In 65% of entries across all trials, disease was present at the time of the first application with median value circa 0.20% severity.
Mathematical models of specific plant diseases can be used to explain the past, predict the future, improve tactical (weekly, monthly) decision making, and develop strategies for long-term management (Zadoks and Schein, 1979; Onstad and Rabbinge, 1985; Del Ponte et al., 2006a). Del Ponte et al. (2006b) used a statistical (linear regression) model to predict final disease severity in soybean crops in Brazil. They found that the cumulative rainfall for the one month following disease detection (R1-R5, early January to early April) was highly correlated with final severity (r=0.95) and had high predictive value, and that (max/min) temperature was less correlated (r=0.43-0.47) and had minimal predictive value for the final disease severity (Del Ponte et al., 2006b). Kim et al. (2005) and Dias et al. (2014) used a simple logistic model with a time step of one day to simulate disease progress. Kim et al. (2005) started their simulations 14 days after planting and assigned a consistent initial severity for all simulations, depending on varietal differences in susceptibility. This value was later heuristically adjusted to minimize error in predicting disease severity. Dias et al. (2014) simulated from first detection of the disease, which was difficult to determine in some cases. The only parameter in these two models was the apparent infection rate, which was a function of fuzzy logic rules applied to climate variables (Kim et al., 2005) or a function of cloudiness on a given day (Dias et al., 2014). After fitting their model to data collected in one season, Kim et al. (2005) tested their results against observations of ASR epidemics made in the next year. Dias et al. (2014) tested their model results against qualitative levels of final disease severity and quantitative observations over 5-9 weeks at four sites in Brazil. The model performed well against the observations of disease progress in Brazil (Dias et al., 2014). The major limitation of statistical models is that, once they are fit to past situations in trials carried out without fungicides applications, the models cannot subsequently account for effects of fungicide treatments on disease dynamics.
Several authors have focused on models that help make decisions about the timing of fungicides against ASR. Kelly et al. (2015) developed simple, fungicide-decision models based on first detection of ASR in either soybean or Pueraria montana and leaf wetness duration or rain events. They initialized their models at R1 and stopped calculating them at R6 when the final treatment normally occurs. The most widely adopted interval between applications for ASR control is 14 days. Kelly et al. (2015) compared different spray treatments and an untreated control over three years in southeastern USA. The treatments were based on crop stage or driven by different models. Their results indicate two fungicide applications during early reproductive stage can reduce yield loss due to ASR, but subsequent applications need to be determined based on disease pressure, weather conditions, and crop growth stage. In Brazil, Igarashi et al. (2016) used the rainfall model of Del Ponte et al. (2006b) and the model of Reis et al. (2004) that combined leaf wetness duration and air temperature during this period to determine when to apply fungicides. Igarashi et al. (2016) also used spore traps to observe uredospore immigration to initiate the models. The models were tested against data from two years in Brazil. Igarashi et al. (2016) concluded that the rainfall model of Del Ponte et al. (2006a) overestimated the final disease severity. Beruski (2018) developed similar models for Brazil but did not include a first detection criterion. Beruski (2018) compared a regime of applications every 14-days after R1 to the model-based treatments over multiple locations in Brazil over two years. Both the Kelly et al. (2015) and Beruski (2018) leaf-wetness models over-estimated disease and recommended more fungicide treatments than necessary.
Statistical models are only valid for the domain on which they are trained with data. Mechanistic models use mathematical expressions that describe the most relevant physical or biological processes. The purpose of our work was to create a mechanistic model that can reliably represent ASR epidemics in commercial soybean fields when the weather and initial observation of disease (or uredospore arrival) are known. Del Ponte and Esker (2008) provided a nice framework that can be used to identify the most important meteorological related factors for epidemic characteristics such as spore release, spore dispersal, spore deposition, infection efficiency, latent period, and spore production of ASR. We chose to create a mechanistic model since they offer the ability to be extended with additional processes. More specifically, we would like to extend the model later to incorporate effects of specific fungicides on spore germination, latent period, and sporulation, as well as their loss of efficacy over time, driven by environmental factors such as temperature, humidity, precipitation, and light intensity. Our focus is on the first two or three cycles of P. packyrhizi infection after its uredospores invade a soybean field. During these periods, the seasonal effectiveness of management tactics will be determined (Scherm et al., 2009).
2 Materials and methods
The following sections describe the mathematical model, the approach to its analysis, and the field trials used to test the model results. The first part includes a literature search to find empirical values for the quantitative processes (functions and parameters) that we used to parametrize the model. This is a model of the temporal dynamics of a disease within a soybean field. Because we do account for uredospores leaving the field and others remaining in the field to land on multiple plants, the size cannot be infinitely large nor extremely small. Therefore, our model is intended for simulating ASR progression in a typical soybean field.
2.1 Time step for calculations and annual period for simulations
The time step for calculating disease progress is one day. Thus, a pathogen cohort is defined as the number germinating each day and subsequently maturing together. However, weather variables are considered on hourly and daily bases. Dew period will be determined on an hourly basis. We calculate hours of dew (HD) and mean temperature (THD) for those hours only, every 24 hours. In other words, first we find which hours have dew or leaf wetness, then we also find mean temperature for those hours. This is used for germination each day. For calculation of degree days for maturation during latent period and daily sporulation, we will just use mean temperature (T) for all 24 hours. Small t is the index for day of simulation.
The purpose of the model is to simulate disease dynamics during early reproductive growth stages of soybean. Depending on when and where the crop is planted in Brazil, this period likely occurs during November through March. Table 1 shows the monthly mean temperatures for these months in Brazil. All means are in the range 21.3-28.3°C. Except for Rio Grande do Sul in southern Brazil, where the mean varied by 3°C over the five months, the mean temperatures at each location varied by<1.5° C demonstrating relatively constant temperatures. Daily fluctuating temperatures will certainly exceed the range 21-28° C, but the model must perform well over this range.
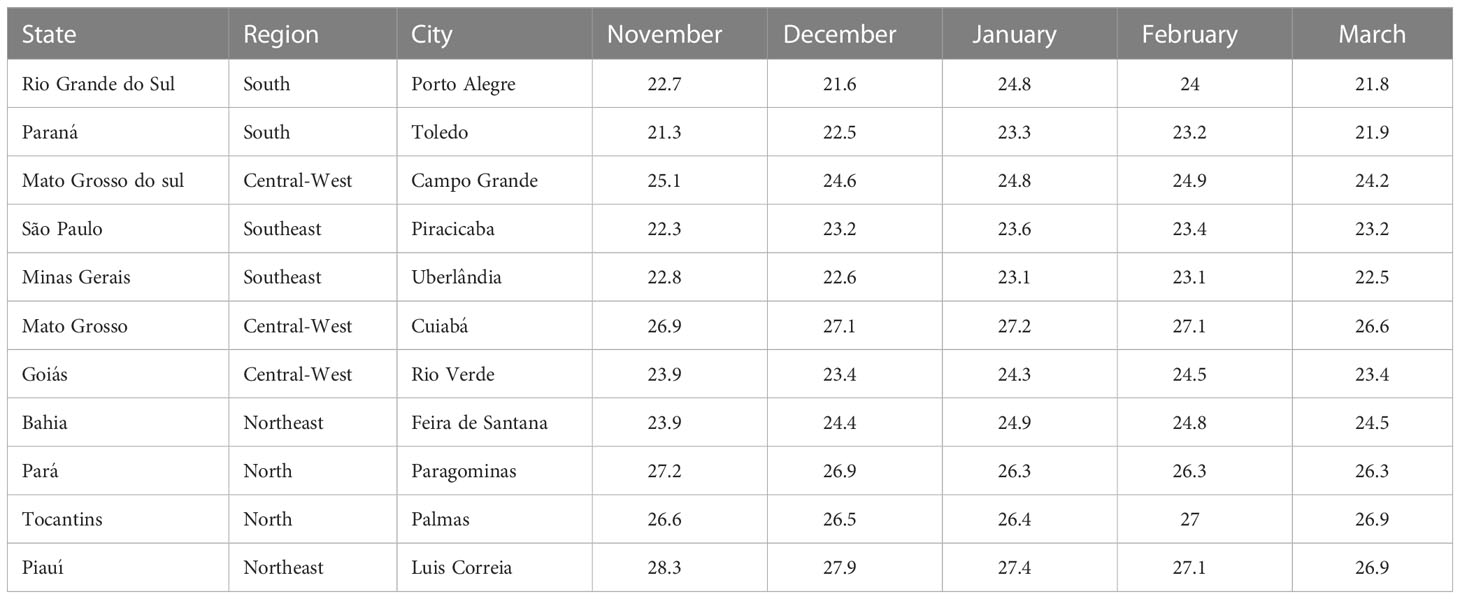
Table 1 Monthly mean temperatures in Brazil from 1982-2012.
2.2 Soybean leaf area development
Leaf area development is a function of soybean physiological days, pd, which is linearly related to temperature on a daily basis (Wilkerson et al., 1985).
where Tav is the average daily temperature, and Tmin, Tmax and Topt are the minimum, maximum and optimum temperatures for growth of soybean. The values of Tmin, Topt and Tmax were obtained from Yang et al. (1991) as Tmin = 7° C, Tmax = 45° C and Topt = 30° C.
Cumulative physiological days, Cpd, equals the sum of pd over all days after germination of soybean. Leaf area per plant is calculated from Cpd using one of the following two equations (Yang et al., 1991).
Equation 2a is for medium and long maturing cultivars and equation 2b is for short maturity cultivars. The leaf area index per m2 (LAI) is calculated after multiplying the leaf area per plant by the number of plants in a m2. We used 30 plants per m2, a typical value for Brazil.
In our model, we assume that the disease does not limit development of leaf area. This simplification is reasonable for low levels of disease severity during the early phases of an epidemic when the management of the disease is either successful or not (Scherm et al., 2009). This soybean development function along with the entire model is inadequate for describing epidemics that overwhelm a soybean crop. If the pathogen invades the crop after all leaves have formed in determinate growth soybeans, then the reduction in leaf growth may be less of a concern.
2.3 Calculation of dew period and associated temperature
Dew period (HD) was calculated using classification and regression tree well known as CART model (Gleason et al., 1994). The CART model utilizes dew point depression (DPD), hourly air temperature, dew point temperature, wind speed (m/s), and relative humidity (RH) data. The mean temperature during the hours of dew each 24-hour period, THD, was calculated as expected by averaging the 24 or fewer hourly temperatures.
2.4 Spore germination
All of the following studies were performed in labs or greenhouses. In Brazil, Alves et al. (2006) found that uredospores germinated at all temperatures ranging from 8 to 30°C and that the optimum temperatures for germination varied from 15 to 25°C. These results agreed with Tan et al. (1996), who showed that the optimum temperature range for uredospore germination in China was 15 to 26°C. Kochman (1979) in Australia found that germination dropped by half between 24.5 and 28.5°C with a maximum proportion of 0.54. According to Singh and Thapliyal (1977) in India, no uredospores germinated at 10 and 35°C. The maximum proportion was 0.33 at 25°C after 24 hours. In a different experiment, they found that proportional germination ranged from 0.05 to 0.18 at constant 30°C to 0.30 when temperatures varied from 20-30°C. As long as temperatures were 20-25°C, germination ranged from 0.45 to 0.61, with germination at higher end as temperature increased. Marchetti et al. (1976) observed a maximum 0.40 proportional germination in darkness for a Taiwanese isolate with the optimal temperatures 20-25°C. They stated that germination declined rapidly between 25 and 28.5°C and ceased between 28.5 and 31°C. In a different experiment with isolates from four countries (not Brazil), Marchetti et al. (1976) observed much higher proportional germination in darkness (0.60-0.80) and a lower range of optimal temperatures. Melching and Bromfield (1975) and Melching et al. (1989) found that temperatures below 9°C or above 28°C did not favor germination of uredospores. Melching and Bromfield also determined that the optimum temperature for germination was from 12 to 21°C, while Melching et al. (1989) found 18-26.5°C optimal. Melching et al. (1988) observed a germination range of 0.41-0.64 at 21°C and discovered that germination rates on agar are much higher than those on leaves after the same period of incubation. Thus, many of the results described above are overestimates. However, after 6 hours, the rates on the two substrates tended to converge to 0.55 proportional germination.
We derived our function for calculating proportional germination from two functions of temperature developed by Bonde et al. (2007) based on observations of a Brazilian isolate. (They did not observe significant differences across the three isolates). They observed an optimum temperature of 22-23°C and their functions have optima at 23-24°C. We simply took the average of the five parameters from their two functions with the same structure and created
where Y is proportion of spore germination as a function of temperature, THD is the mean temperature during the period of germination each day. Bonde et al. (2007) defined Tmin as 9.57 and Tmax as 29.54. The maximum proportion calculated with our version is 0.54.
We considered successful germination would always lead to infection on leaves of susceptible soybean plants. Bonde et al. (2007) also measured infection and determined the minimum and maximum temperatures for infection to be on the average 10.2°C and 29.8°C, which are essentially the same as those for germination.
For temperatures 20-24°C, rust lesions only develop after a minimum 6-hour dew period on leaves (Kitani, 1960; Melching et al., 1989). Marchetti et al. (1976) found the same threshold at temperatures 15-25°C and much more germination after 10 hours of dew. Therefore, germination was estimated as a function of both temperature and dew hours with
where G is the proportion of uredospores on leaves that germinate, and HD is the hours of dew or leaf wetness duration on soybean leaves each day. This function permits higher germination rates for temperatures below 20 °C than those observed by Marchetti et al. (1976) (Figure 1) because of dew period/temperature interactions. Parameter G is multiplied by the number of uredospores in the field about to germinate. If uredospores do not germinate within 24 hours in the model, they are no longer viable.
2.5 Latent period
We define latent period (LP) as the time between host infection and onset of pathogen sporulation. The latent period determines the maturation of latent lesions and the interval between successive generations of pathogens. For our model, we used a temperature-based function to estimate the latent period. Table 2 shows the latent period in days observed in a variety of studies. Melching et al. (1979) studied isolates from around the world. We display the observations for older plants (37-42-days-old soybean) made by Melching et al. (1989).
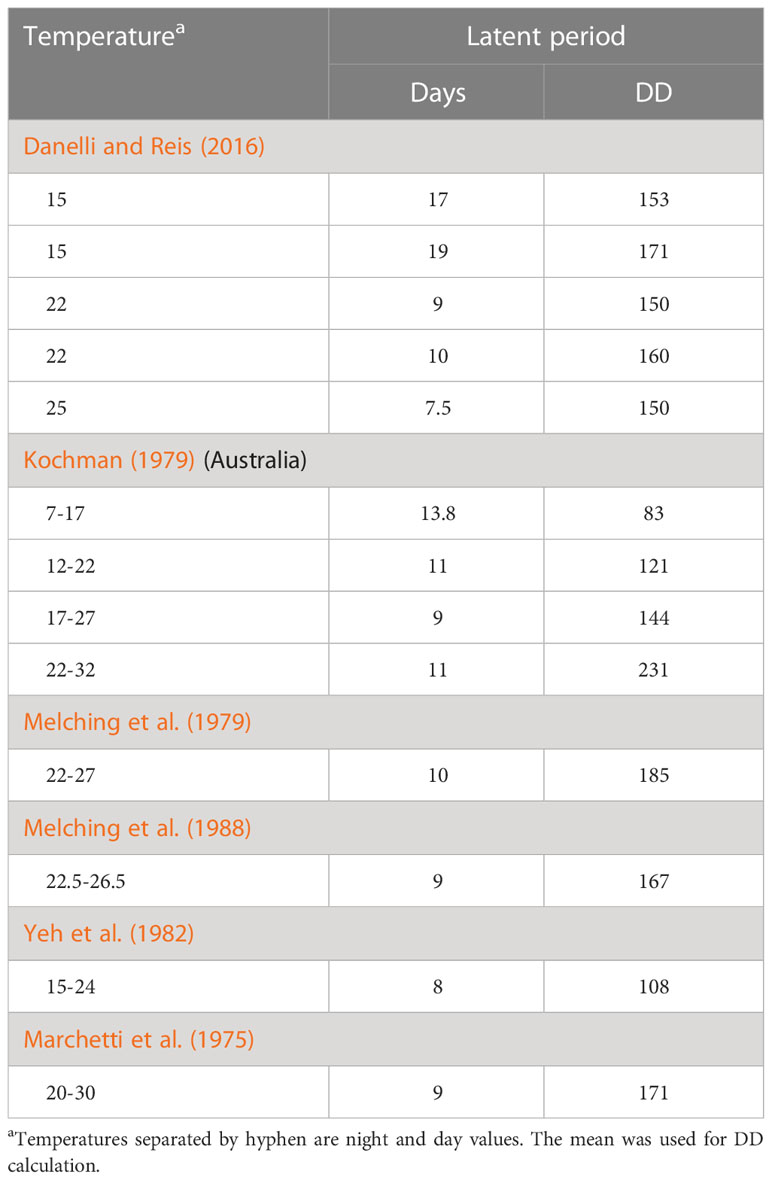
Table 2 Latent periods in days and in cumulative degree days (DD) calculated with base 6°C.
A temperature of 6°C has been used as a base for calculating degree days (Danelli and Reis, 2016). We therefore calculated degree days (DD) by subtracting 6°C from the mean daily temperature in each study (Table 2). The Danelli and Reis (2016); Marchetti et al. (1975); Melching et al. (1979) and Melching et al. (1988) results are in the range 150-185 DD for LP but this may only be valid for mean daily temperatures of 15-30°C (or shorter range). The warmest temperatures used in a study (Table 2) were the 22-32°C range of Kochman (1979). The extremely high calculated DD of 231 suggests that maturation slows above 27-30°C; subtracting 5°C per day (32-27) gives 176 DD. There is significant variability no matter how LP is evaluated. Therefore, we chose to use the most recent and most relevant results (Danelli and Reis, 2016) for Brazil. The calculated mean of the five values is 156.8 DD, but we simplified this to 155 DD for the model. Once the cumulative DD exceeds 155 for each daily cohort of pathogen, the cohort will mature into the infectious period and start sporulating.
2.6 Infectious period
The infectious period (IP) is defined as the period during which cohorts of lesions produce uredospores under favorable environmental conditions. Marchetti et al. (1975) observed a 3-week infectious period. The observations of Melching et al. (1979) and Yeh et al. (1982) support an average IP of 5 weeks. For our model, we used a 35-day IP from first sporulation to end of sporulation. Each day, a cohort of lesions will shift into the next of 35 age classes during the IP. Maturation is calculated first for oldest cohort then proceeds in declining order to youngest cohort. After day 35, the cohort will become senescent (dead).
2.7 Lesion size
Lesion size and number determine the level of disease severity. Melching et al. (1979) studied four Asian and Australian isolates. They inoculated susceptible soybean plants when the fourth trifoliate was fully expanded. Two weeks after inoculation, the mean lesion areas were 0.61-0.77 mm2 for three isolates and 0.3-0.43 mm2 for the Australian isolate. Seven weeks after inoculation, the mean lesion areas for the four isolates were 1.76-1.81, 1.70-1.89, 1.75-2.01, and 1.43-1.45 mm2. Hernández (2004) described lesions as 1-2 mm in diameter, which suggests that circular lesions range in size from 0.79 mm2 to 3.14 mm2. Alves et al. (2006) observed similar lesion sizes at different combinations of leaf wetness duration and temperature. We used a lesion size of 2 mm2 in the model, which is the size also chosen by (Yang et al., 1991).
2.8 Sporulation
Sporulation is mainly determined by air temperature. Bonde et al. (2012) discovered that after germination, relative humidity had no effect on number of lesions or uredospores. Under a greenhouse temperature regime of 20-29°C, Melching et al. (1979) calculated 2,028, 3,768, 6,600, and 6,268 uredospores per lesion for isolates from four different countries. Thus, the mean uredospore production during the lifespan of an infectious lesion on a soybean leaf was 4,666 uredospores per lesion. Production peaked about 10 days into infectious period and declined afterwards.
Bonde et al. (2012) made observations over the first 3 weeks of the IP to determine the number of uredospores produced per lesion as a function of constant temperature. The following pairs of temperature and uredospores per lesion represent their data: (17 °C, 750), (21 °C, 4,050), (25 °C, 5,500), (29 °C, 3,300), and (33 °C, 1,400). No uredospores were produced at 37°C. The mean number of uredospores at the middle three temperatures is 4,283, which is very close to the mean from the Melching et al. (1979) study. We fit a function to the data of Bonde et al. (2012) with zero at 37°C (Figure 1). In the model, the total number of uredospores potentially produced by infectious lesions is calculated as
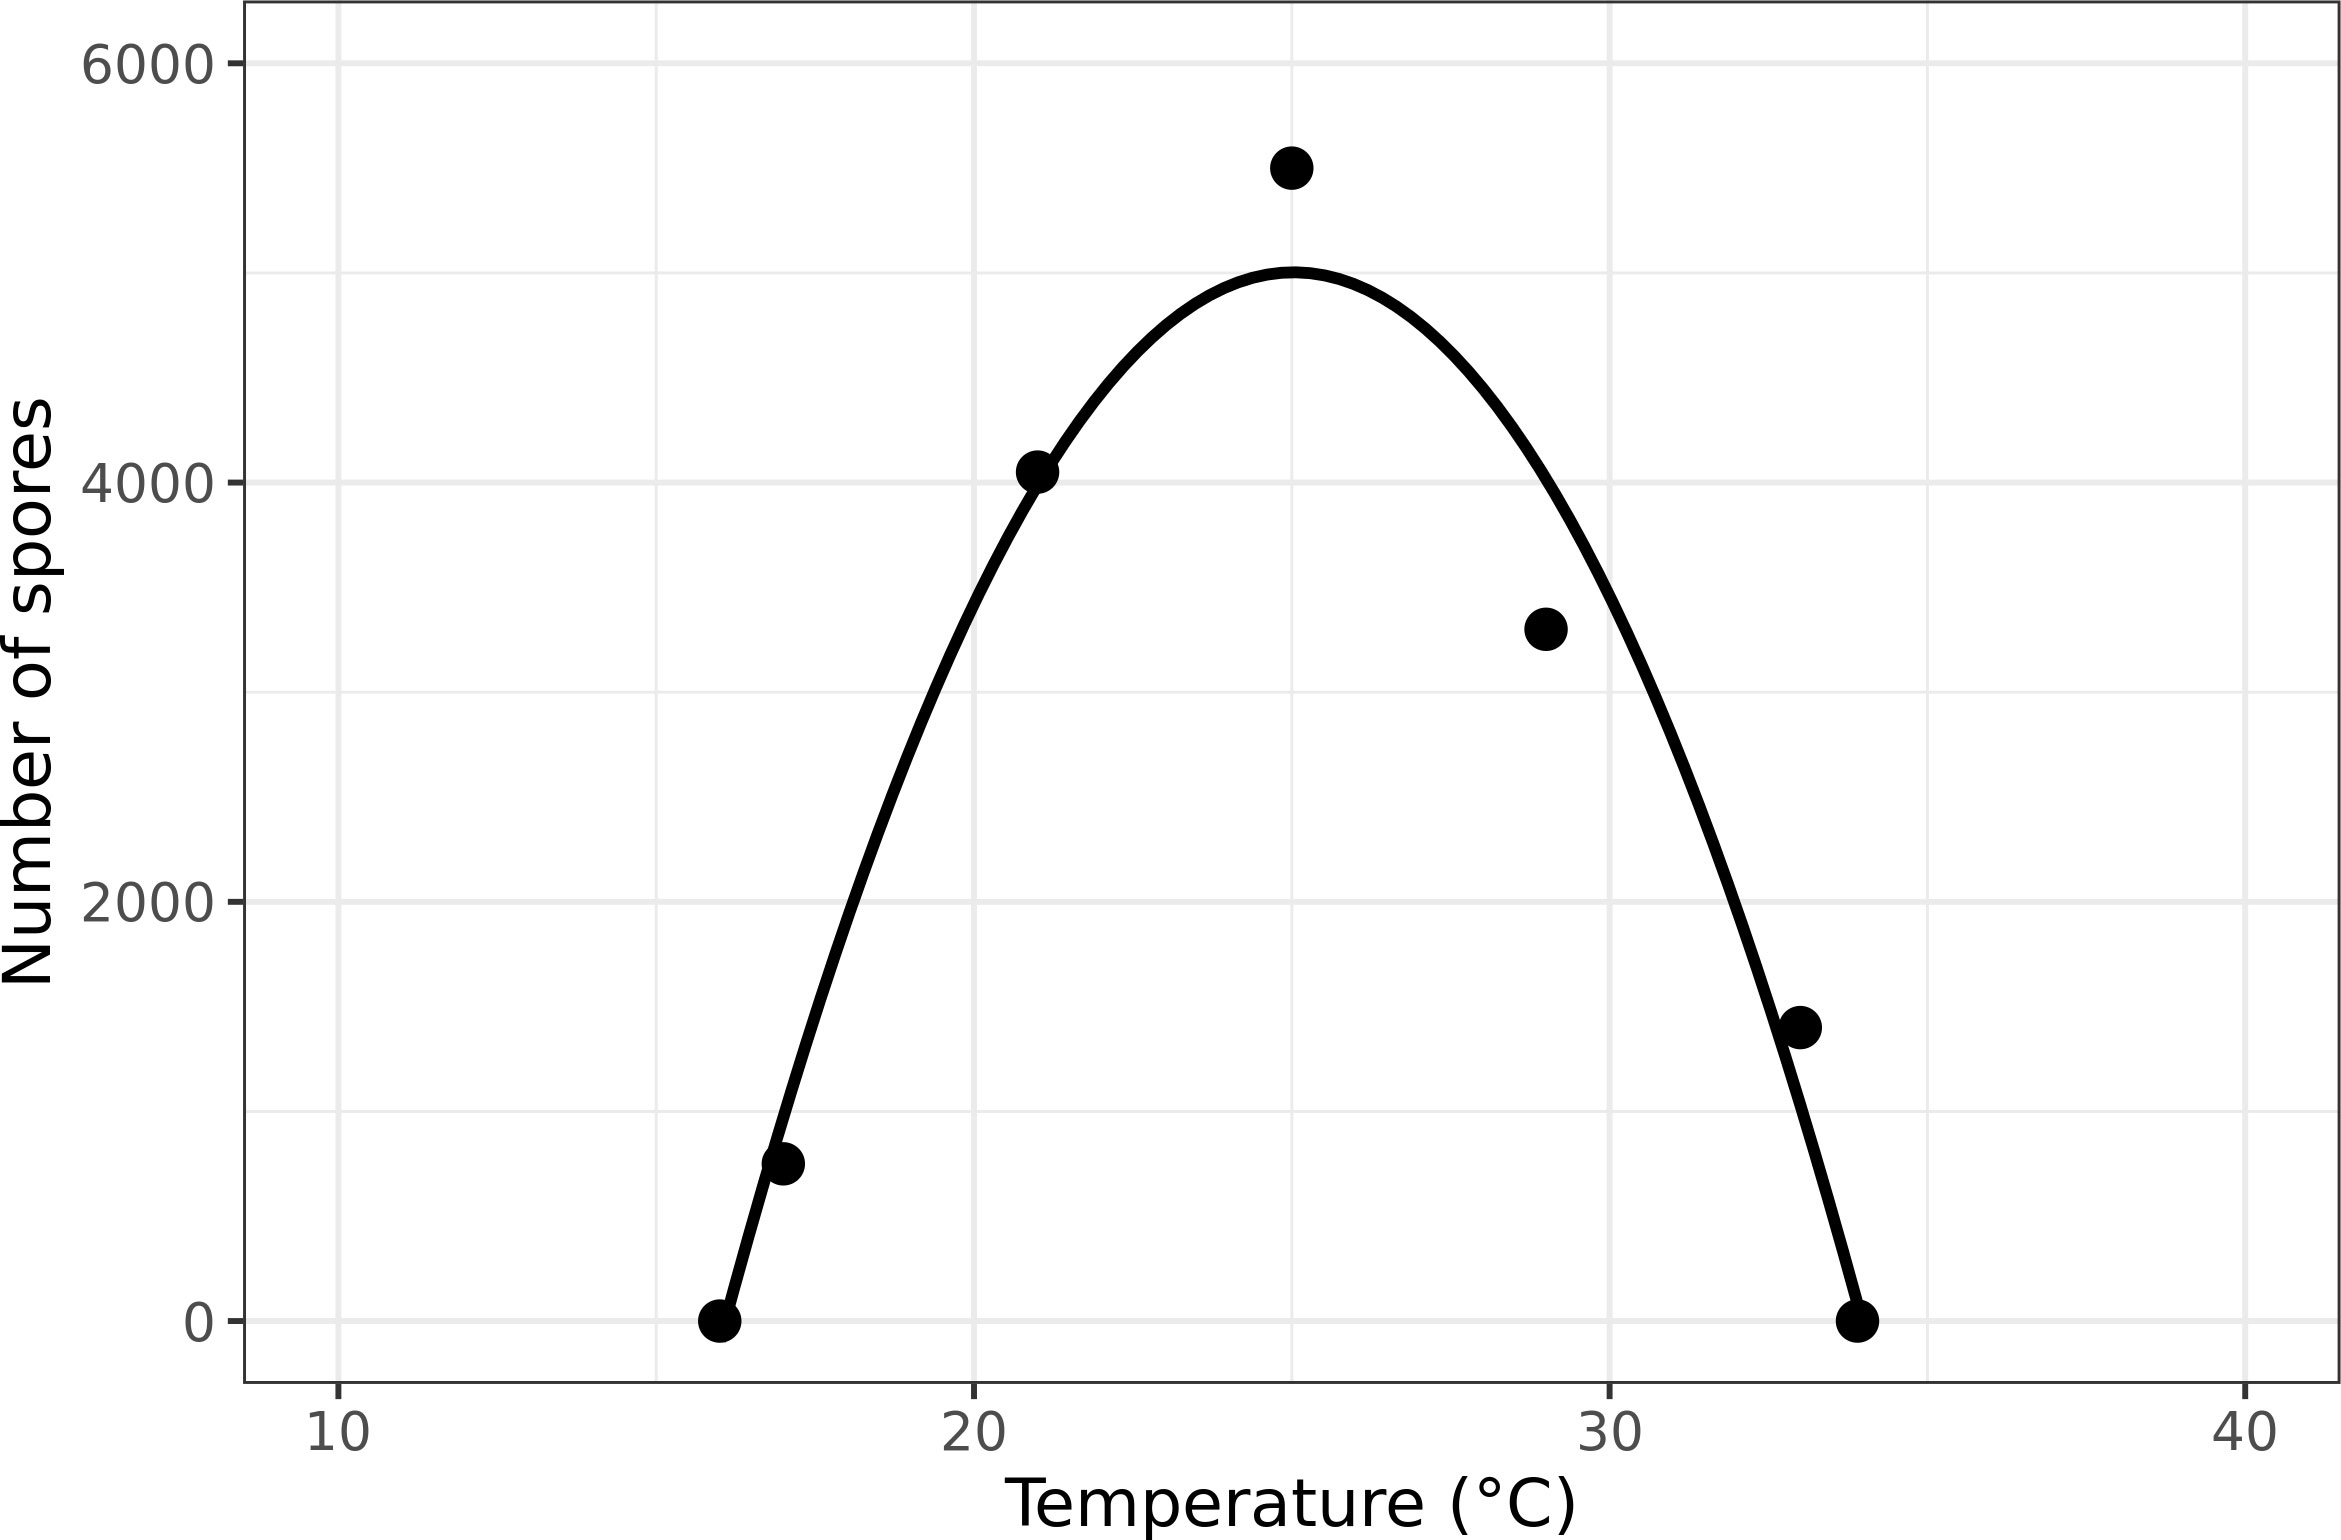
Figure 1 Asian soybean rust sporulation based on temperature (data from Bonde et al., 2012).
where T is mean daily temperature. The R2 = 0.97. The value of Z is circa 0 at temperatures 16 and 34°C. No sporulation occurs beyond those limits.
Based on the triangular shape of production over the infectious age classes seen in figures of Yeh et al. (1982) and Melching et al. (1979), the proportion of uredospores produced in age class j of the IP (with peak at age 10 days) is
Essentially, K distributes the total in Z over the entire IP. Then the number of uredospores produced by each cohort per 24-hour period per unit ground area, Pt is
where j is age class in IP and I is the number of lesions in a cohort. Pt is calculated before maturing cohorts to next age class.
2.9 Number of uredospores adhering to soybean leaves before germination
Uredospores cannot adhere to leaves during the first 30 minutes after landing on the surface (Dufault et al., 2010) and there is a chance that some proportion of uredospores may be removed from the leaf surface (Andrade et al., 2009). Although uredospore removal from soybean leaves depends on several factors including canopy location and duration of rainfall, Dufault et al. (2010) found that, for rain intensities of 45-85 mm, the percentage of uredospores removed from leaves ranged from 23% to 82% as the duration increased from 1 to 30 minutes. However, rainfall of 85 mm in 30 minutes seems extremely high, so we focused on 45 mm as a threshold for designating an hour as contributing to spore removal. Furthermore, because it is difficult for a model with a time horizon of a few months and a time step of 1 day to account for these minutes of rainfall, we chose to model this effect as 1 - exp(-0.1 x HR), where the proportion of uredospores removed is a function of the number of hours in a 24 hour period (HR) in which rainfall exceeds 45 mm in each hour. This implies that an hour with rainfall exceeding 45 mm results in 10% loss of the uredospores and 12 hours with rainfall exceeding 45 mm in each hour results in 70% loss of the uredospores.
The number of uredospores adhering to soybean leaves on day t, Nt is
where H is the number of uredospores immigrating into field, P is the number produced in the field, and E is the proportion emigrating from the field due to wind. Zidek (2007) reported that about 10% of uredospores may escape a closed canopy due to wind and turbulence. Thus, E=0.1 in the model. CC is the proportion of uredospores captured by leaf area, which increases as LAI increases
where 0.75 is light-extinction coefficient for 30 reproductive-stage plants per m2 (Flénet et al., 1996) and D is disease severity (proportion of leaf area covered with infectious and senesced lesions).
The number of lesions in cohort of LP defined by day of germination t, Lt, is
where N is number of uredospores adhering to soybean leaves and G is proportion germinating.
2.10 Disease severity
The proportion of leaf area (undersides only) covered by live or dead lesions is defined as disease severity, D, and calculated per m2 each day as
where Itot(t) is the sum of I(j,t) in a m2 over all age classes j, S is the total number of senesced (dead) lesions in a m2, and 2 is the lesion size in mm2. The factor 106 converts leaf area to number of mm2 patches. Although, our focus is on early stages of an epidemic when disease severity is low, the model does include the following statements to maintain logic as severity gets close to 1. If Dt > 1 in Equation 11, then Dt = 1 and I1, t = [1-Dt-1] x LAI x 0.5 x 10⁶. This last statement adjusts the incoming age 1 infectious lesions to the maximum permitted given the amount of leaf area remaining without lesions.
2.11 Field experiment and data collection
A field experiment was conducted in the 2019/2020 growing season at four locations in Brazil (Table 3). BMX-Potência, an ASR sensitive cultivar, was sowed with spacing of 0.5 m between rows and 15 plants per m of row. The experiment consisted of an early and late sowing date (at three locations) to cover low and high ASR spore inoculum concentration during the growing of soybeans. Date of disease outbreak, disease progress and final disease severity were observed. The progress in ASR disease severity was measured at 7 days interval starting from the beginning of the flowering stage (R1) of soybeans.
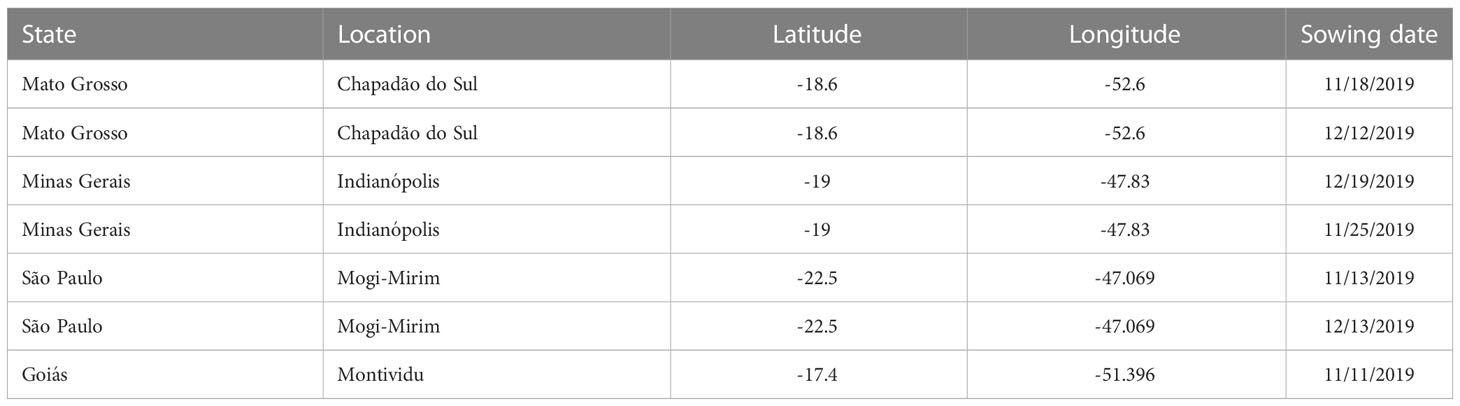
Table 3 Location of ASR field experiments in Brazil in 2019-2020.
Weather variables such as rainfall, temperature, relative humidity and wind speed were obtained from weather stations installed in the field experiment locations. Dew period or leaf wetness duration was calculated using classification and regression tree well known as CART model (Gleason et al., 1994; Kim et al., 2005).
2.12 Validation of the model
The model was simulated to produce the progression of ASR in a soybean field on a daily basis after arrival of the first uredospores. Initial outbreak of disease in the fields were observed 77 to 82 days after planting (DAP) for the early sowed experiments and 52 to 63 days after sowing for the late sowed experiments. We subtracted the typical 9-day LP from date of first disease observation to initialize the model with uredospore arrival. For instance, if the first disease was detected 77 days after sowing, the first uredospores were introduced 68 days after sowing. The number of uredospores initially arriving in the modeled soybean field is 3000 to 4000 per day per m2 over a 10-day period. Thus, equal numbers of uredospores arrive in the field on days 68-77. The initial number was chosen to produce a close fit of modeled severity to the initial observation of disease severity.
Model performance was evaluated using the disease progress data obtained from the field experiments. Model simulated severity curves were compared against the ASR severity observed between 50 and 98 DAP at weekly intervals. The correlation between the model simulated and observed ASR severity was evaluated by calculating a coefficient of determination (R2).
2.13 Sensitivity analysis
Model sensitivity analysis was carried out for the following input parameters: the number of days when uredospores were detected in the soybean field (days with spores), a factor for proportion of uredospores captured by leaf area (canopy cover factor or light-extinction coefficient), wind factor determining escape of uredospores away from field, and rainfall factor removing uredospores from leaves (Table 4). The model was simulated under the conditions observed at each of the four locations for our field studies (Table 3). We used the model sensitivity analysis to explore the response of model output to modest changes in the model input values and to understand the sensitivity of results to uncertainties in the input values of the model.
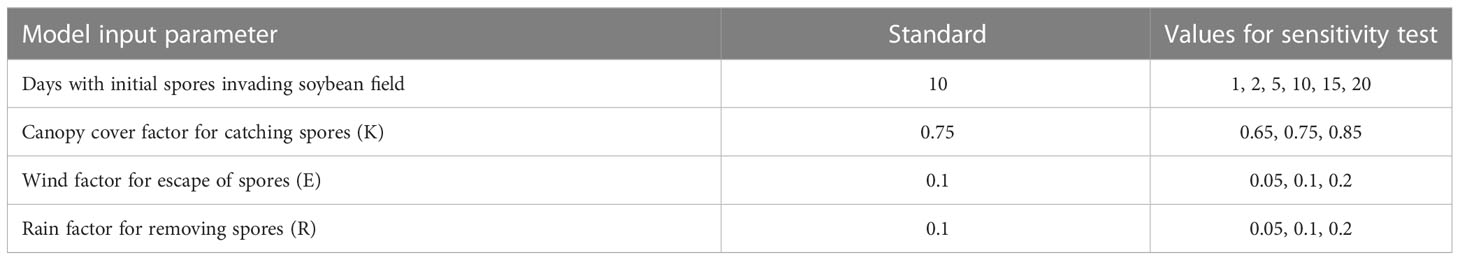
Table 4 Model parameter values used in sensitivity analysis.
3 Results
3.1 Weather conditions and observations of disease in the field
Key weather conditions that drive ASR infection and development are presented in Figure 2. The minimum temperature varies 18 to 19°C and the maximum temperature varies between 28 to 32°C during the growing season of soybeans across the four locations in Brazil. The mean temperature for the locations is in the range of 20.5 to 23.8°C. Based on the weather for the experimental sites, the LP lasted 9 days over most of the observed periods with few LP >9. The average daily leaf wetness duration was 15 to 22 hours. Only 6 days exhibited less than 6 hours leaf wetness duration at Chapadão do Sul (MS), 4 days at Indianapólis (MG) and 1 day at Mogi-Mirim (SP). Once uredospores invaded the soybean plots, the local microclimate was conducive for ASR germination and development to happen.
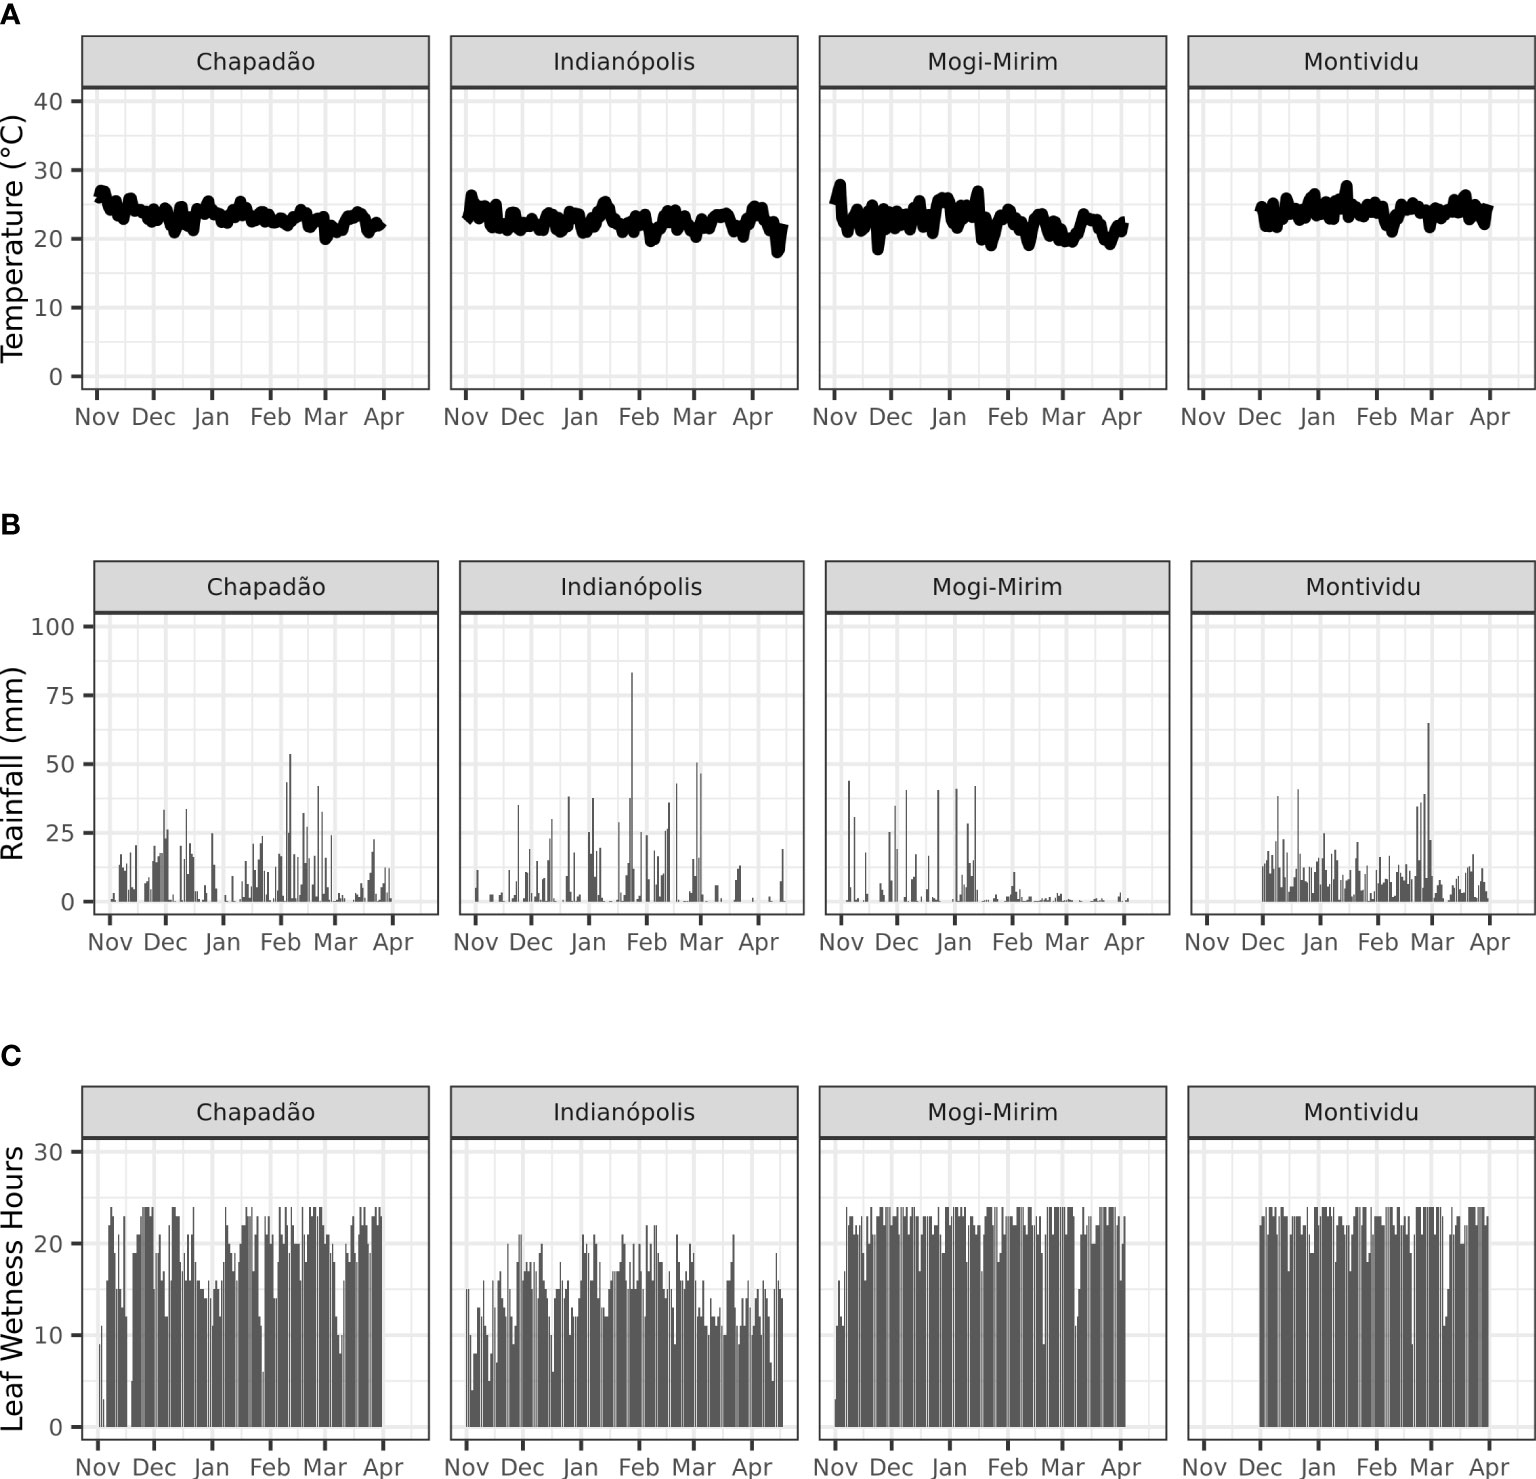
Figure 2 Temperature (A), rainfall (B) and leaf wetness duration (C) at Chapadão do Sul, Indianópolis, Mogi-Mirim and Motividiu during 2019/20 soybean growing season in Brazil.
First symptom of ASR was observed 77 to 84 DAP in early planted experiments and 52 to 63 DAP in late planted experiments. Final ASR severity varied between 31 to 62% in early planted and 37% to 100% in late planted soybeans.
3.2 Validation of the model
As displayed in Figure 3, the model results generally matched the daily dynamics of ASR progress in the field trials. The predictions reproduced the observed ASR severity well with R2 value of 0.84 and root mean square error (RMSE) of 4.71% (Figure 4). The model tends to underestimate some observed severities at low severity levels, however the amount of underestimate varied by trial location and planting period. Additional sensitivity analysis was performed to further investigate the influence of input parameters on the disease severity predictions.

Figure 3 Simulated (solid line with closed symbols) and observed (dashed line with open symbols) Asian soybean rust progression at Chapadão do Sul (A), Indianopólis (B), Mogi-Mirim (C) and Motividiu (D) in Brazil.
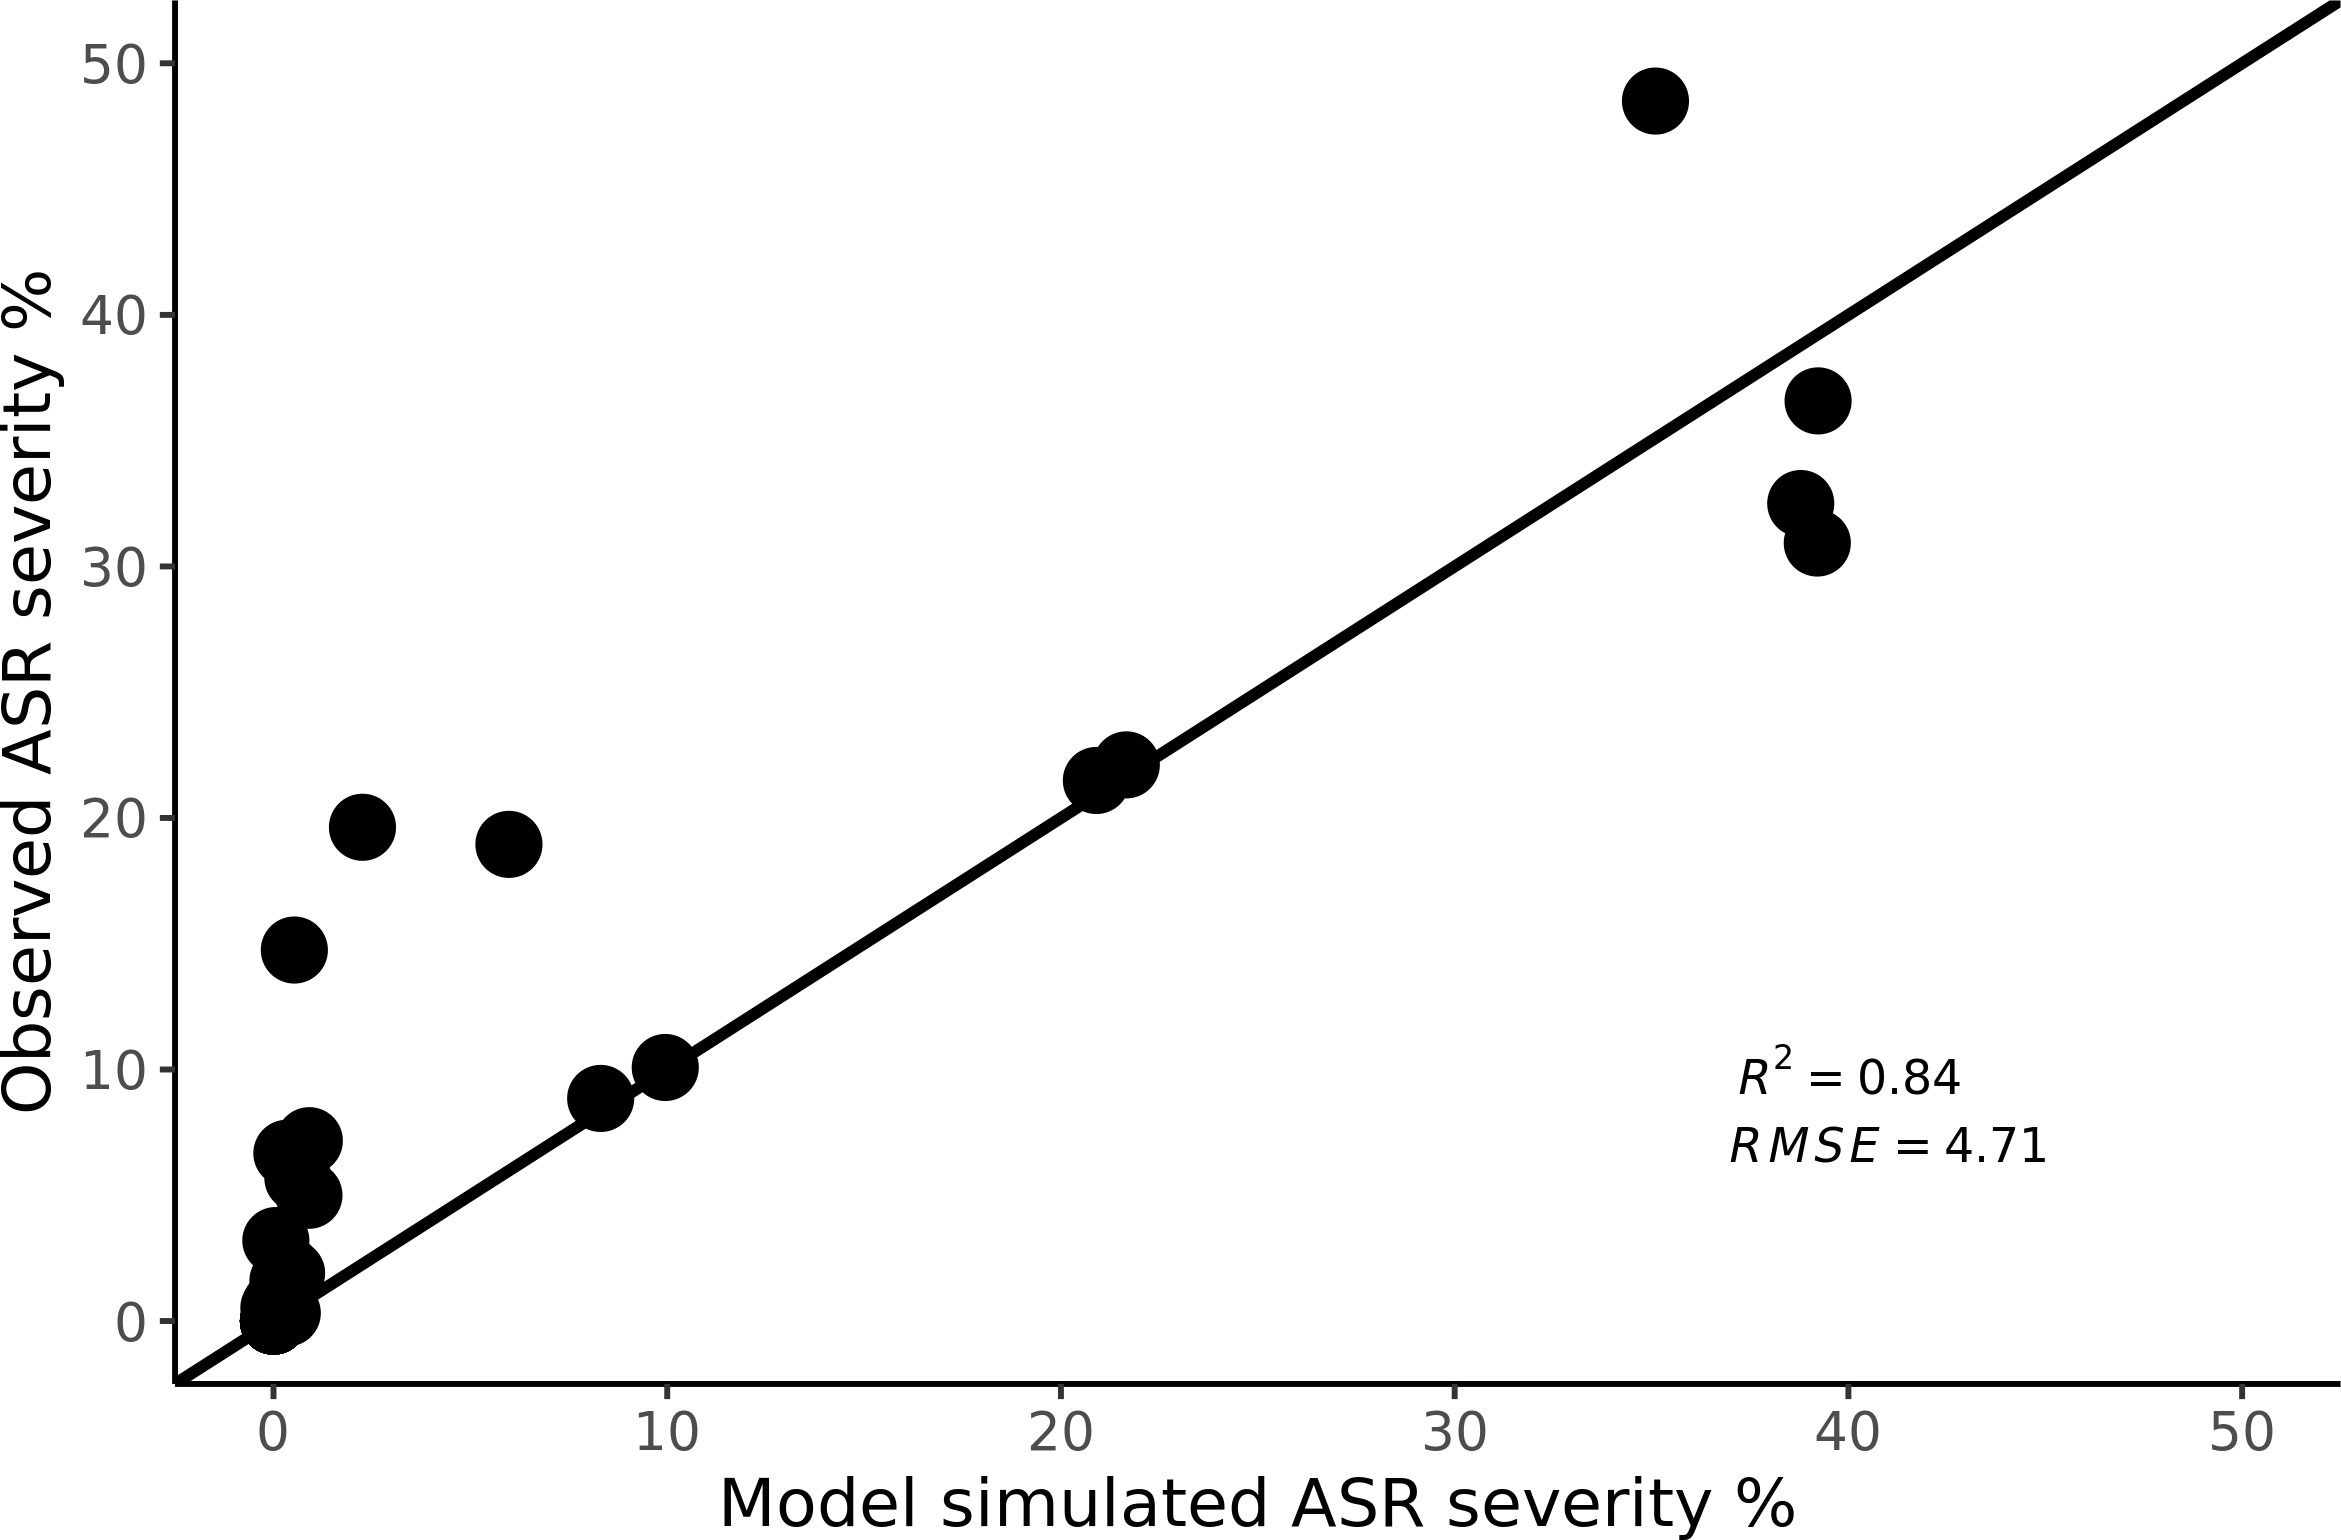
Figure 4 Observed versus simulated ASR severity in 1 to 1-line space. Observed ASR severity data points were measured at weekly intervals at the field trials with record dates ranging from 37 to 107 days after planting (DAP).
3.3 Sensitivity analysis
Changes in simulated ASR severity on day 70 after sowing due to changes in the values of four model input parameters are presented in Figure 5. The results were slightly sensitive to canopy cover factor (light-extinction coefficient). Since ASR tends to infect soybean during its reproductive stage when the canopy is dense, assuming a moderate canopy cover factor (0.75) seems reasonable, but the influence of soybean cultivar should be considered in future work. The results were insensitive to the wind factor and the rain factor.
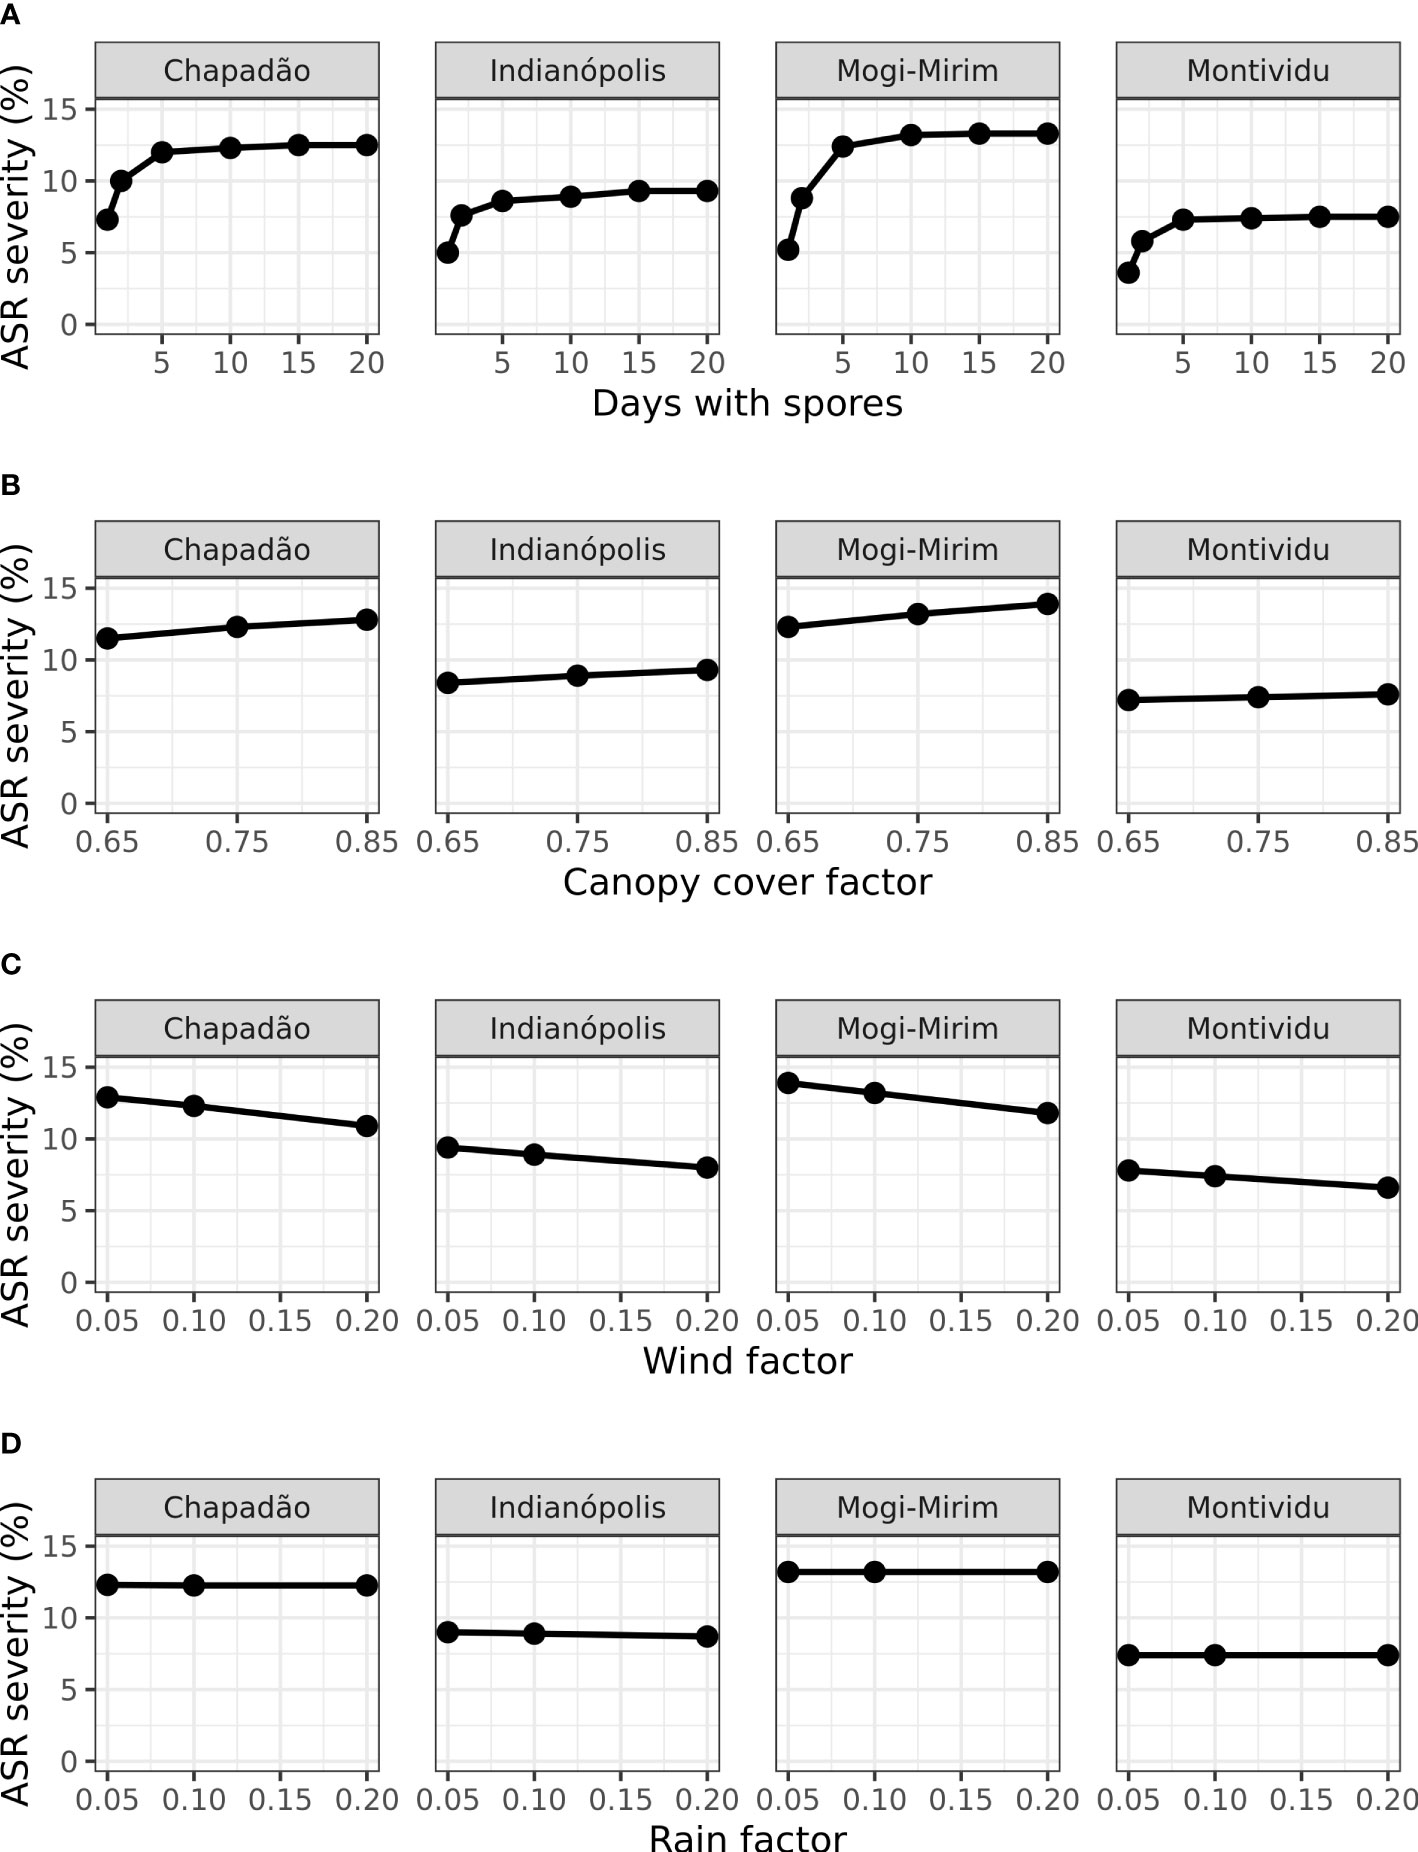
Figure 5 Model simulated ASR severity on 70 days after planting (DAP) at four locations in Brazil (Figure 2) based on changes to four model parameters (Table 4). Days of spores (A) refers to the duration of the initial invasion. Canopy cover factor (B) determines the proportion of uredospores captured by soybean leaves. Wind factor (C) is the proportion of uredospores escaping the field. Rain factor (D) determines the proportion of uredospores removed from leaves.
The results were sensitive to days with initial spores invading the soybean field. Reducing the duration of the initial spore arrival from the standard 10 days to 1-2 days caused an important reduction in the severity, but simulated results for durations of 5-20 days were similar (Figure 5). For instance, the severity at Chapadão do Sul simulated with an invasion period of 10 days of spore was 12.3% and the severity simulated with spore arrival of only 1 day was 6.3% (Figure 5A). These results indicated that spore traps or other observations should measure not only the first day of arrival but the subsequent days. Additional invasion by uredospores after the first week will be less important to the epidemic already started by the earliest detected spores.
4 Discussion
The high correlation between the model simulated and observed disease severity (Figure 4) indicates that our model can be used as a tool to predict the dynamics of ASR epidemics during the first few cycles after uredospore invasion into a soybean field. Sometimes the model did not correctly estimate the exact timing of the steep rise, causing some larger errors in the lower left part of Figure 4. As Scherm et al. (2009) concluded, the most important decisions made by Brazilian growers must occur while the severity is less than 1%.
Our model is the first validated mechanistic model of ASR that includes the influence of moisture and temperature on the main processes in its life cycle. All steps in the modeling and data collection were clearly described. Yang et al. (1991) developed a preliminary model that included a reasonable leaf-area growth sub-model. However, unlike the pathogen sub-model of Yang et al., our model includes germination and sporulation processes and a fully-described validation.
Our model is easily extendible once more data are collected. For example, the effects of fungicide applications and (partial) genetic resistance of soybean varieties can be added. Fungicidal effects (of either type of treatment) are most often associated with reduced germination, prolonged latent period, or reduced sporulation, depending on their mode of action. Experimental studies in a greenhouse or field could be used to estimate the proportional changes of the corresponding parameters relative to the base-line values observed on untreated susceptible varieties. The proportional adjustment for the relevant model parameters may differ for each fungicide and type of resistance.
Scherm et al. (2009) noted that disease severity >0.05% at the time of the first application negatively affected the response ratio for disease severity. This may have been caused by the attempted use of curative applications when there are already visual symptoms of disease. However, curative applications were likely not efficacious because the triazoles and strobilurins applied provide better control when applied preventatively due to their mode of action.
Note that the efficacy of a fungicide will decline over time and may be influenced by external factors, such as rainfall and ultraviolet light intensity. Given the dynamic nature of the model and the use of daily cohorts of ASR, the proportional effects of a residual fungicide on each cohort would likely change daily as the residue decays. Growth of new leaves (that are unprotected with the fungicide) could be incorporated as a further change in the parameters. This complexity may not be needed for modeling host-plant resistance.
Currently, fungicide applications in soybean are based on a calendar schedule which is determined by days after emergence due to the increase in the planting of indeterminate-growth soybeans in Brazil. However, calendar-based decisions to start spraying can lead to inappropriate timing and increase soybean production costs. Our type of model could contribute to a fully automated, fungicide-treatment program for ASR (that could be extended to other soybean diseases), that would combine all the relevant information and accurate weather forecast in a single model to provide farmers with a rational field-specific, series of treatment recommendations.
A further refinement would be to incorporate crop resistance to ASR with a choice of fungicides with different modes of action to help with resistance management. This will provide farmers with a fully automated Integrated Pest Management strategy for durable and efficient crop protection.
Data availability statement
The datasets presented in this article are not readily available because Corteva owns the data. Requests to access the datasets should be directed to Z2VyaWUudmFuZGVyaGVpamRlbkBjb3J0ZXZhLmNvbQ==.
Author contributions
BK and DO are primary authors and performed most of the modeling work. All other authors equally supported the writing and modeling. LK was responsible for field work. All authors contributed to the article and approved the submitted version.
Conflict of interest
This work was done by employees of Corteva Agriscience, a major American agricultural chemical and seed company.
Publisher’s note
All claims expressed in this article are solely those of the authors and do not necessarily represent those of their affiliated organizations, or those of the publisher, the editors and the reviewers. Any product that may be evaluated in this article, or claim that may be made by its manufacturer, is not guaranteed or endorsed by the publisher.
References
Alves S., Furtado G., Bergamin Filho A. (2006). Influência das condições climáticas sobre a ferrugem da soja. Ferrugem asiática da soja, 37–59.
Andrade D., Pan Z., Dannevik W., Zidek J. (2009). Modeling soybean rust spore escape from infected canopies: model description and preliminary results. J. Appl. Meteorology Climatology 48, 789–803. doi: 10.1175/2008JAMC1917.1
Beruski G. C. (2018). Disease warning systems for rational management of Asian soybean rust in Brazil.
Bonde M., Berner D., Nester S., Frederick R. (2007). Effects of temperature on urediniospore germination, germ tube growth, and initiation of infection in soybean by Phakopsora isolates. Phytopathology 97, 997–1003. doi: 10.1094/PHYTO-97-8-0997
Bonde M., Nester S., Berner D. (2012). Effects of daily temperature highs on development of Phakopsora pachyrhizi on soybean. Phytopathology 102, 761–768. doi: 10.1094/PHYTO-01-12-0011-R
Danelli A. L., Reis E. M. (2016). Quantification of incubation, latent and infection periods of Phakopsora pachyrhizi in soybean, according to chronological time and degree-days. Summa Phytopathologica 42, 11–17. doi: 10.1590/0100-5405/1920
Del Ponte E. M., Esker P. D. (2008). Meteorological factors and Asian soybean rust epidemics: a systems approach and implications for risk assessment. Sci. Agric. 65, 88–97. doi: 10.1590/S0103-90162008000700014
Del Ponte E. M., Godoy C. V., Canteri M. G., Reis E. M., Yang X. (2006b). Models and applications for risk assessment and prediction of Asian soybean rust epidemics. Fitopatologia Bras. 31, 533–544. doi: 10.1590/S0100-41582006000600001
Del Ponte E., Godoy C., Li X., Yang X. (2006a). Predicting severity of Asian soybean rust epidemics with empirical rainfall models. Phytopathology 96, 797–803. doi: 10.1094/PHYTO-96-0797
Dias A., Li X., Yang X. (2014). Modeling the effects of cloudy weather on regional epidemics of soybean rust. Plant Dis. 98, 811–816. doi: 10.1094/PDIS-03-13-0269-RE
Dufault N., Isard S. A., Marois J., Wright D. (2010). Removal of wet deposited Phakopsora pachyrhizi urediniospores from soybean leaves by subsequent rainfall. Plant Dis. 94, 1336–1340. doi: 10.1094/PDIS-01-10-0068
EMBRAPA (2004). Tecnologias de produção de soja–Região central do Bazil 2005 Vol. 6 (Sistemas de Produção: Embrapa Soja).
Flénet F., Kiniry J. R., Board J. (1996). Row spacing effects on light extinction coefficients of corn, sorghum, soybean, and sunflower. Agron. J. 88 (2), 185–190. doi: 10.2134/agronj1996.00021962008800020011x
Gleason M. L., Taylor S. E., Loughin T. M., Koehler K. J. (1994). Development and validation of an empirical model to estimate the duration of dew periods. Plant Dis. 78, 1011–1016. doi: 10.1094/PD-78-1011
Hernández J. R. (2004). Invasive and Emerging Fungal Pathogens - Phakopsora pachyrhizi - Asian Soybean Rust (ARS, USDA, U.S: Systematic Mycology and Microbiology Laboratory).
Igarashi W. T., de Franca J. A., de Aguiar e Silva M. A., Igarashi S., Abi Saab O. J. G. (2016). Application of prediction models of asian soybean rust in two crop seasons, in Londrina, Pr. Semina-Ciencias Agrar. 37, 2881–2889. doi: 10.5433/1679-0359.2016v37n5p2881
Kelly H. M., Wright D. L., Dufault N. S., Marois J. J. (2015). Decision models for fungicide applications for soybean rust. Plant Health Prog. 16: 80–83. doi: 10.1094/PHP-RS-14-0050
Kim K. S., Wang T. C., Yang X. B. (2005). Simulation of apparent infection rate to predict severity of soybean rust using a fuzzy logic system. Phytopathology 95, 1122–1131. doi: 10.1094/PHYTO-95-1122
Kochman J. (1979). The effect of temperature on development of soybean rust (Phakopsora pachyrhizi). Aust. J. Agric. Res. 30, 273–277. doi: 10.1071/AR9790273
Koga L. J., Canteri M. G., Calvo É.S., Unfried J. R., Garcia A., Harada A., et al. (2008). Multivariate analysis of resistance components to Asian rust in soybean genotypes. Pesquisa Agropecuária Bras. 43, 1277–1286. doi: 10.1590/S0100-204X2008001000004
Koga L. J., Canteri M. G., Calvo E. S., Xavier S. A., Harada A., Unfried J. R., et al. (2011). Chemical control and responses of susceptible and resistant soybean cultivars to the progress of soybean rust. Trop. Plant Pathol. 36, 294–302. doi: 10.1590/S1982-56762011000500004
Langenbach C., Campe R., Beyer S. F., Mueller A. N., Conrath U. (2016). Fighting Asian soybean rust. Front. Plant Sci. 7, 797. doi: 10.3389/fpls.2016.00797
Marchetti M. A., Melching J. S., Bromfield K. R. (1976). Effects of temperature and dew period on germination and infection by uredospores of phakopsora pachyrhizi. Phytopathology 66, 461–463. doi: 10.1094/Phyto-66-461
Marchetti M. A., Uecker F., Bromfield K. (1975). Uredial development of Phakopsora pachyrhizi in soybeans. Phytopathology 65, 822–823. doi: 10.1094/Phyto-65-822
Melching J., Bromfield K. (1975). Factors Influencing Spore Germination and Infection by Phakopsora pachyrhizi and Intensification and Spread of Soybean Rust Under Controlled Conditions (abst) (American Phytopathological Society), 125.
Melching J. S., Bromfield K. R., Kingsolver C. H. (1979). Infection, colonization and urdospore production on wayne soybean by 4 cultures of phakopsora-pachyrhizi, the cause of soybean rust. Phytopathology 69, 1262–1265. doi: 10.1094/Phyto-69-1262
Melching J., Dowler W., Koogle D., Royer M. (1988). Effect of plant and leaf age on susceptibility of soybean to soybean rust. Can. J. Plant Pathol. 10, 30–35. doi: 10.1080/07060668809501760
Melching J. S., Dowler W. M., Koogle D. L., Royer M. H. (1989). Effect of duration, ferquency and temeperaure of leaf wetness periods of soybean rust. Plant Dis. 73, 117–122. doi: 10.1094/PD-73-0117
Onstad D. W., Rabbinge R. (1985). Dynamic programming and the computation of economic injury levels for crop disease control. Agric. Syst. 18, 207–226. doi: 10.1016/0308-521X(85)90040-X
Reis E. M., Sartori A. F., Camara R. K. (2004). Modelo climático para a previsão da ferrugem da soja. Summa Phytopathologica 30, 290–292.
Scherm H., Christiano R., Esker P., Del Ponte E., Godoy C. (2009). Quantitative review of fungicide efficacy trials for managing soybean rust in Brazil. Crop Prot. 28, 774–782. doi: 10.1016/j.cropro.2009.05.006
Singh K., Thapliyal P. (1977). Some studies on the soybean rust caused by Phakopsora pachyrhizi. Indian J. Mycology Plant Pathol. 7, 27–31.
Wilkerson G. G., Jones J. W., Boote K. J., Mishoe J. W. (1985). Soygro V5.0: Soybean Crop Growth and Yield Model (University of Florida).
Yang X. B., Dowler W. M., Tschanz A. T. (1991). A simulationI model for assessing soybean rust epidemics. J. Phytopathology-Phytopathologische Z. 133, 187–200. doi: 10.1111/j.1439-0434.1991.tb00153.x
Yeh C. C., Sinclair J. B., Tschanz A. T. (1982). Phakopsora pachyrhizi uredial development, uredospore production,and factors affecting teliospore formation on soybeans. Aust. J. Agric. Res. 33, 25–31. doi: 10.1071/AR9820025
Yorinori J. T., Paiva W. M., Frederick R. D., Costamilan L. M., Bertagnolli P. F., Hartman G. E., et al. (2005). Epidemics of soybean rust (Phakopsora pachyrhizi) in Brazil and Paraguay from 2001 to 2003. Plant Dis. 89, 675–677. doi: 10.1094/PD-89-0675
Keywords: modeling, epidemiology, Asian soybean rust, Phakospora pachyrhizi, Brazil, soybean
Citation: Kassie BT, Onstad DW, Koga L, Hart T, Clark R and van der Heijden G (2023) Modeling the early phases of epidemics by Phakospora pachyrhizi in Brazilian soybean. Front. Agron. 5:1214038. doi: 10.3389/fagro.2023.1214038
Received: 28 April 2023; Accepted: 05 July 2023;
Published: 31 July 2023.
Edited by:
Benjamin Richard, Institut Supérieur d’Agriculture Rhône-Alpes, FranceReviewed by:
Marco Camardo Leggieri, Catholic University of the Sacred Heart, ItalyVanita Navnath Salunkhe, National Institute of Abiotic Stress Management (ICAR), India
Copyright © 2023 Kassie, Onstad, Koga, Hart, Clark and van der Heijden. This is an open-access article distributed under the terms of the Creative Commons Attribution License (CC BY). The use, distribution or reproduction in other forums is permitted, provided the original author(s) and the copyright owner(s) are credited and that the original publication in this journal is cited, in accordance with accepted academic practice. No use, distribution or reproduction is permitted which does not comply with these terms.
*Correspondence: Gerie van der Heijden, Z2VyaWUudmFuZGVyaGVpamRlbkBjb3J0ZXZhLmNvbQ==