 Ranju Chapagain
 Tomas A. Remenyi
 Neil Huth
 Caroline L. Mohammed1
95% of researchers rate our articles as excellent or good
Learn more about the work of our research integrity team to safeguard the quality of each article we publish.
Find out more
ORIGINAL RESEARCH article
Front. Agron. , 31 July 2023
Sec. Climate-Smart Agronomy
Volume 5 - 2023 | https://doi.org/10.3389/fagro.2023.1213074
Introduction: Soil type plays a major role in nutrient dynamics and soil water which impacts crop growth and yield. The influence of soil characteristics on crop growth is usually evaluated through field experimentation (in the short term) and through crop-soil modelling (in the long-term). However, there has been limited research which has looked at the effect of model structural uncertainty of model outputs in different soil types.
Methods: To analyze the impact of soil inputs on model structural uncertainty, we developed eight model structures (a combination of two crop models, two soil water models and two irrigation models) within the Agricultural Production Systems sIMulator (APSIM) across three soil types (Ferralsols, Alisols and Chernozems). By decomposing the mean proportion of variance and simulated values of the model outputs (yield, irrigation, drainage, nitrogen leaching and partial gross margin) we identified the influence of soil type on the magnitude of model structural uncertainty.
Results: For all soil types, crop model was the most significant source of structural uncertainty, contributing >60% to variability for most modelled variables, except irrigation demand which was dominated by the choice of irrigation model applied. Relative to first order interactions, there were minimal (<12%) contributions to uncertainty from the second order interactions (i.e., inter-model components). We found that a higher mean proportion of variance does not necessarily imply a high magnitude of uncertainty in actual values. Despite the significant impact of the choice of crop model on yield and PGM variance (contributing over 90%), the small standard deviations in simulated yield (ranging from 0.2 to 1 t ha-1) and PGM (ranging from 50.6 to 374.4 USD ha-1) compared to the mean values (yield: 14.6 t ha-1, PGM: 4901 USD ha-1) indicate relatively low actual uncertainty in the values. Similarly, the choice of irrigation model had a contribution of over 45% to variance, but the relatively small standard deviations ranging from 11 to 33.3 mm compared to the overall mean irrigation of 500 mm suggest low actual uncertainty in the values. In contrast, for the environmental variables- drainage and nitrogen leaching, the choice of crop model had contributions of more than 60% and 70% respectively, yet the relatively large standard deviations ranging from 7.1 to 30.6 mm and 0.6 to 7.7 kg ha-1 respectively, compared to the overall mean values of drainage (44.4 mm) and nitrogen leaching (3.2 kg ha-1), indicate significant actual uncertainty.
Discussion: We identified the need to include not only fractional variance of model uncertainty, but also magnitude of the contribution in measured units (e.g. t ha-1, mm, kg ha-1, USD ha-1) for crop model uncertainty assessments to provide more useful agronomic or policy decision-making information. The findings of this study highlight the sensitivity of agricultural models to the impacts of moisture availability, suggesting that it is important to give more attention to structural uncertainty when modelling dry/wet conditions depending on the output analyzed.
Crop models are useful tools for simulating and predicting development and growth of plants to answer different agronomic questions (Zhao et al., 2019). They are generally classified as empirical or mechanistic. Empirical models use statistical/mathematical equation to describe the correlation between variables (e.g. yield and temperature), whereas mechanistic models can describe the relationship among variables involved in processes related to crop development and growth (Reynolds and Acock, 1985; Whisler et al., 1986; Hammer et al., 2002; Rauff and Bello, 2015; Chapagain et al., 2022). However, neither model can be classified as purely empirical or mechanistic as there is lack of consistency in distinguishing between empirical and mechanistic models (Hammer et al., 2002). The term “process-based” is more appropriate and relevant, as there has been a shift towards using this term instead of mechanistic models e.g (Confalonieri et al., 2016). Henceforth, wherever the authors use the term crop models, we intend to refer to process-based models.
Process-based crop models are computer-based tools that are used to simulate physiological, biophysical and biogeochemical processes in different time intervals to interpret the plant-soil-climate-management relationships (Donatelli and Confalonieri, 2011; Bassu et al., 2014; Kasampalis et al., 2018; Wang et al., 2019; Wu A. et al., 2019; Farina et al., 2021). They have undergone considerable development over the past several decades (Guoqing et al., 2021) and are extensively applied in agronomic research (Seidel et al., 2018). Their diverse application includes crop production (Chimonyo et al., 2016), climate change (Dubey and Sharma, 2018; Boonwichai et al., 2019; Cabezas et al., 2020; Arunrat et al., 2022; Yasin et al., 2022), management practices (Jiang et al., 2019; Rugira et al., 2021), environmental affects and effects (Cichota et al., 2013), resource use efficiency (Mubeen et al., 2020) and breeding (Ramirez-Villegas et al., 2020) analyses. Although their used has been widely recognized, they are subjected to different sources of uncertainties (Chapagain et al., 2022), which have been widely recognized (Porwollik et al., 2017) and generally not explicitly quantified.
Among others (e.g., observation uncertainty, user-induced uncertainty), input uncertainty, parameter uncertainty and structural uncertainty are three main sources of crop model uncertainty (Wallach et al., 2016; Wallach and Thorburn, 2017; Tao et al., 2018; Chapagain et al., 2022). Some of the inputs required for crop models can be hard to measure, unavailable or available only for short duration of time which may lead to additional uncertainties in their estimations because of the need for a statistical approach (Chapagain et al., 2022). Input uncertainty may be due to uncertainties that originate from climate models (Liu et al., 2013) and their downscaling techniques (Cammarano et al., 2017), soil (Wu R. et al., 2019) and crop management (Teixeira et al., 2017), whereas inadequate understanding of biophysical processes, along with lack of quality data from experiments primarily attributes to uncertainties in model structure and parameter tuning (Tao et al., 2018). Furthermore, when developing their experimental design and their research focus, modellers choices contribute to these uncertainties, such as: which processes to represent; the level of complexity; or the details parameterized in the modelling process (Tao et al., 2018). Among these three sources of uncertainty, input uncertainty has been widely investigated, followed by parameter uncertainty, with structural uncertainty the least studied and quantified (Chapagain et al., 2022).
There has been increasing concern about uncertainty resulting from model structure over the past decade (Asseng et al., 2013; Asseng et al., 2015; Martre et al., 2015; Vanuytrecht and Thorburn, 2017; Tao et al., 2018). Through the international collaborative initiatives such the Agricultural Model Intercomparison and Improvement Project (AgMIP) (Rosenzweig et al., 2013), the Joint Programming Initiative on Agriculture, Food Security and Climate Change (FACCE-JPI) (Gøtke et al., 2015) and the Inter-Sectoral Impact Model Intercomparison Project (ISI–MIP) (Warszawski et al., 2014), efforts are being made to quantify and reduce model structural uncertainty (Seidel et al., 2018; Cabezas et al., 2020). It is worth noting that FACCE-JPI has supported various model intercomparison initiatives such as CN-MIP (https://www.faccejpi.net/en/show/CN-MIP.pdf.htm), MASCUR (https://www.macsur.eu/) etc. Details of uncertainty efforts of these initiatives can be found in their websites; AgMIP (https://agmip.org/), FACCE-JPI (https://www.faccejpi.net) and ISI–MIP (www.isi-mip.org). Additionally, there have been increasing efforts undertaken on crop/grassland biogeochemical modelling that go beyond production aspects, such as to simulate soil organic carbon (Farina et al., 2021), carbon–nitrogen responses (Sándor et al., 2023), soil water content and soil temperature (Sándor et al., 2017), soil nitrogen, pasture biomass and soil water (Bilotto et al., 2021) etc. Different crop models have been used to quantify structural uncertainty in previous research (Ramirez-Villegas et al., 2017; Tao et al., 2018; Tao et al., 2020; Kamali et al., 2022; Yin and Leng, 2022), where either each modelling group runs their own model (Kollas et al., 2015; Maiorano et al., 2017) or by single group running multiple models (Wallach et al., 2017). There are, however, few studies that have attempted to quantify structural uncertainty in the same modelling framework (Ramirez-Villegas et al., 2017; Kumar et al., 2021; Chapagain et al., 2023).
The Agricultural Production Systems sIMulator (APSIM) (Keating et al., 2003; Holzworth et al., 2014) is an open-sourced software, available freely (https://github.com/APSIMInitiative) for research and commercial purposes (Holzworth et al., 2014). It comprises of interconnected modules (e.g. plant, soil, irrigation, fertilizer) which provide explanation of the biophysical functions of weather, crop management, soil water, organic matter and soil nutrients (Holzworth et al., 2014; Hao et al., 2021). Over 30 crop types can be simulated in APSIM using its plant modules (Holzworth et al., 2014) These include: maize (Zhu et al., 2022); rice (Sarkar et al., 2022); potato (Ojeda et al., 2021a); pastures (de Souza et al., 2022); and tree species (Elli et al., 2020). APSIM also allows flexibility in agricultural operations and management, allowing users to emulate farmers decision making processes (Moore et al., 2014; Bosi et al., 2020; Chapagain et al., 2023). Furthermore, there are more than 80 crop and soil models in APSIM, which gives rise to different model structures within the same modelling platform. Hence, assessing and quantifying uncertainty of APSIM simulations under various inputs and environmental conditions are important as it allows users to be aware how much uncertainty is transferred to model outputs (Hao et al., 2021). However, there has been very limited studies which looked into structural uncertainty within APSIM (Chapagain et al., 2023).
Soil type, along with topography, play a major role in nutrient dynamics and soil water which impact crop growth (Habib-ur-Rahman et al., 2022). Furthermore, it is environmentally and economically ineffective to manage agricultural operations without considering the spatial variability of soils (Basso et al., 2016). Several studies have considered soil as a source of input uncertainty and variability that causes uncertainty in model outputs (Aggarwal, 1995; Waha et al., 2015; Coucheney et al., 2018; Wang et al., 2018; Maharjan et al., 2019; Ojeda et al., 2020). Most of the previous research focused on input data aggregation (Angulo et al., 2014; Maharjan et al., 2019; Ojeda et al., 2020) and contribution of soil types in output variance (Folberth et al., 2016; Wang et al., 2018). Although the open source soil databases and their use in crop models considerably increased during the last years [e.g. Soil Survey Geographic Database (SSURGO) in the United States (https://www.nrcs.usda.gov/resources/data-and-reports/soil-survey-geographic-database-ssurgo) (Di Luzio et al., 2004) and International Soil Reference and Information Centre (ISRIC) at global scale (https://www.isric.org/) (Han et al., 2019)], there has been limited research investigating impact of soil on structural model uncertainty (Angulo et al., 2014; Waha et al., 2015). To our knowledge, there has been no study which accounted for influence of soils on model structural uncertainty within the same modelling platform.
The objective of this study was to investigate the uncertainty that arises from different model structures looking at biological processes and its interaction with the irrigation module within the same modelling platform across different soil types, which is the main novelty of the work (Figure 1). For this, firstly we developed eight different model structures combining two crop models (we choose potato (Solanum Tuberosum L.) as case study), two soil water models and two irrigation management routines in APSIM for three different soil types. We assessed agronomic (yield and irrigation), environmental (drainage and nitrogen leaching) and economic [partial gross margin (PGM)] model outputs. Secondly, we used analysis of variance (ANOVA) technique to quantify mean proportion of variance on the model outputs. Lastly, we analyzed and compared the actual value contribution of simulated outputs to investigate the impact of soil type on the absolute magnitude of structural uncertainty.
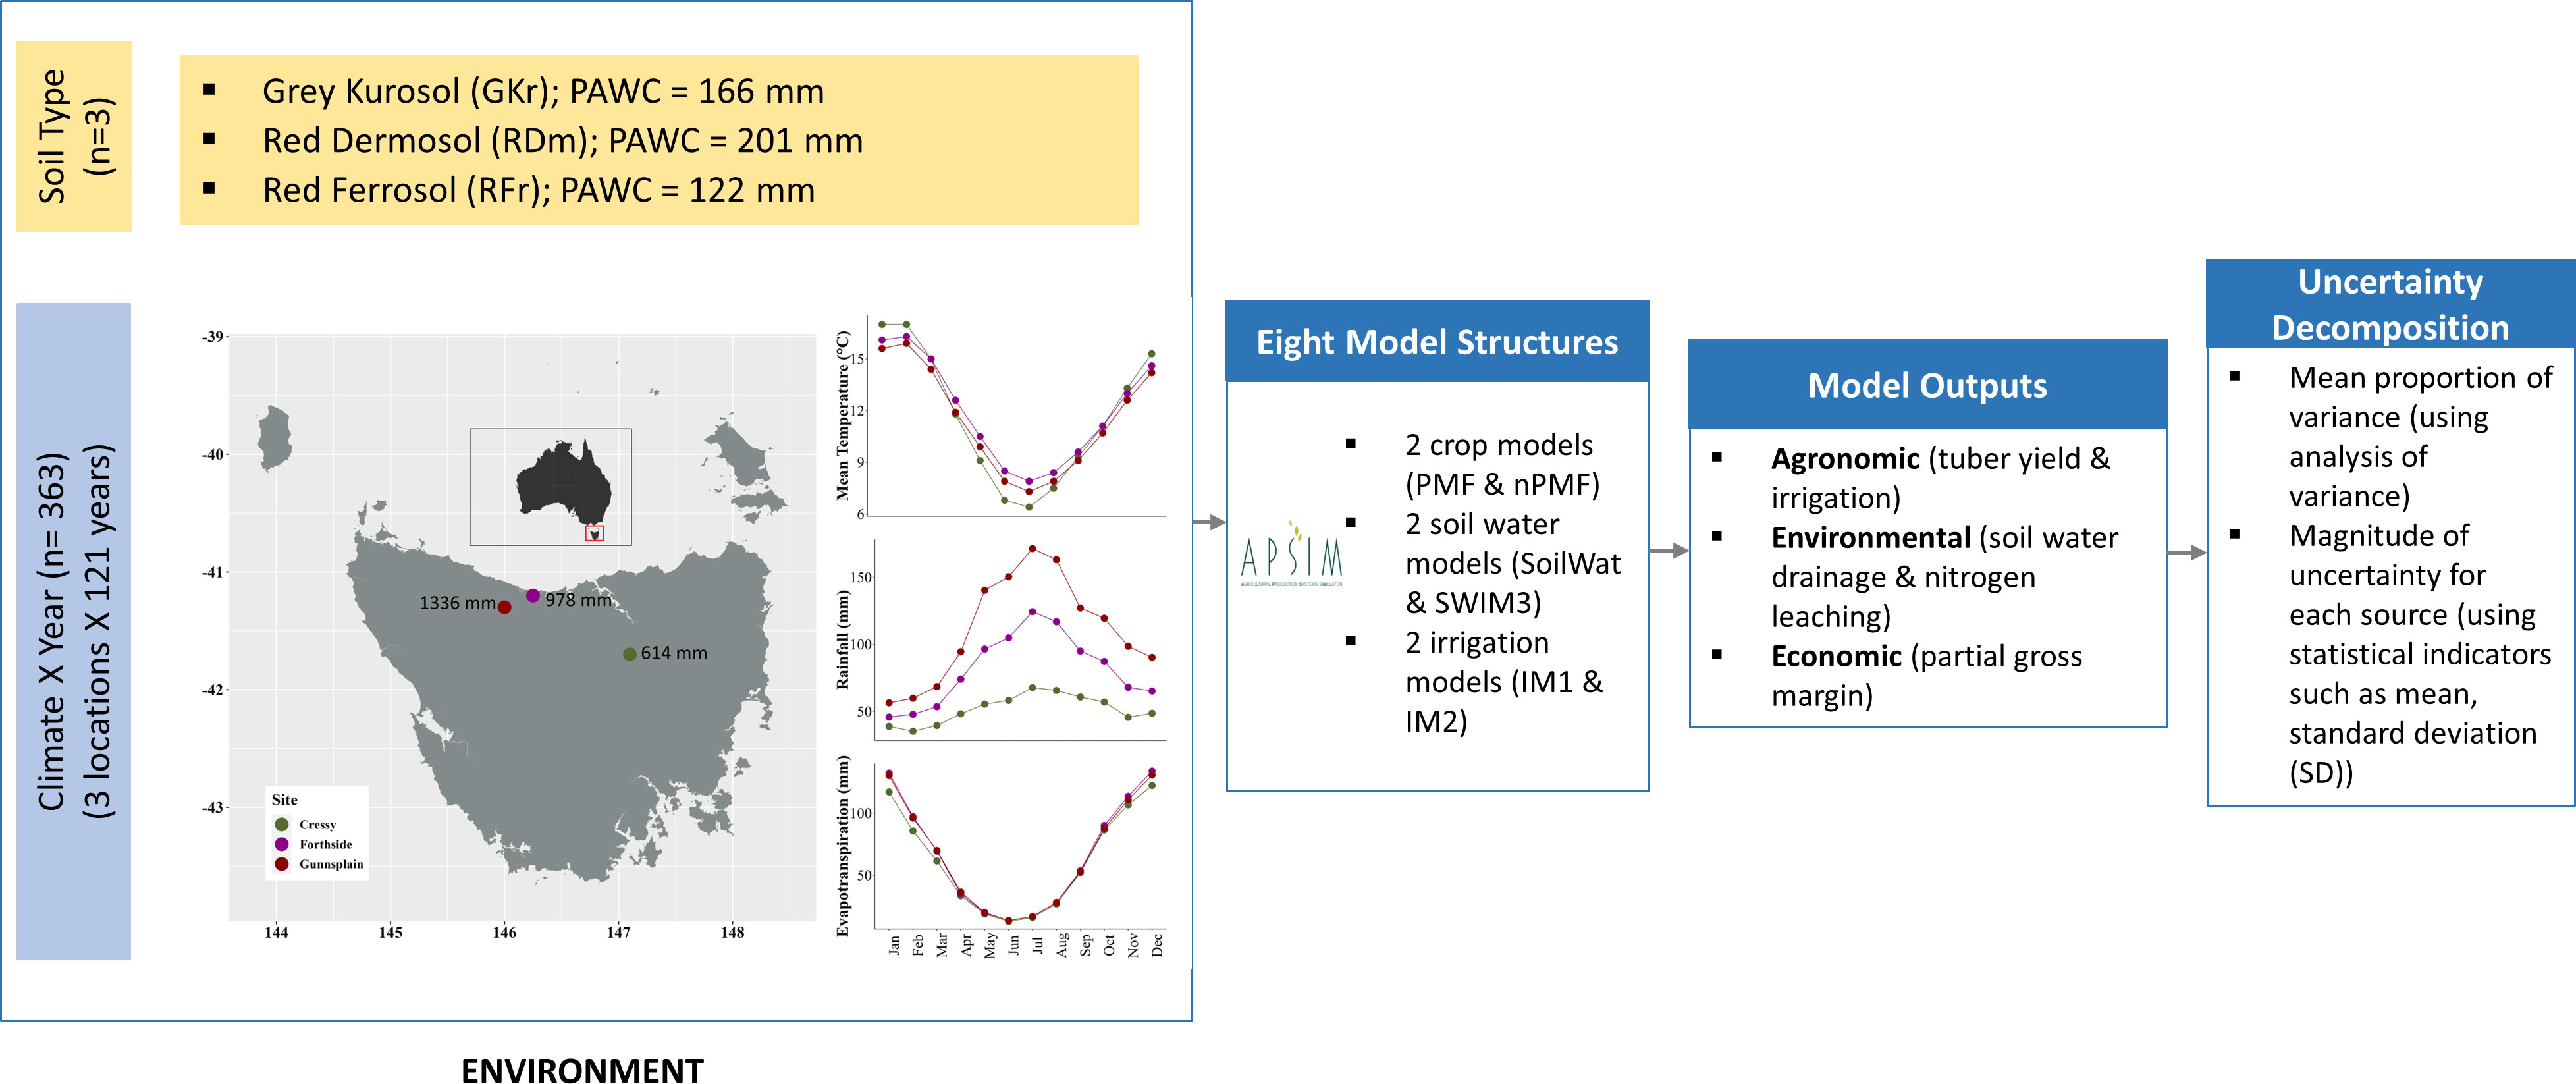
Figure 1 Schematic diagram of research methodology adopted in this study. The simulation study investigated the impact of two environmental factors [climate (3 locations for 121 years) and soil (3 types)] on model structural uncertainty by using different uncertainty decomposition techniques. For this study, agronomic (yield and irrigation), environmental (drainage and nitrogen leaching) and economic (partial gross margin (PGM)) model outputs were assessed. The numbers displayed alongside the locations represent the average annual rainfall. The meaning of each factor and sources of structural uncertainty is described in Sections 2.2–2.4 as design of model structures in APSIM, soil and weather, respectively. The study area map used in this figure has been modified from Chapagain et al. (2023).
The study was conducted across three study sites in Tasmania, Australia: Cressy (41°41’9”S, 147°4’49”E); Forthside (41°13′32.16″S, 146°16′26.22″E); and Gunns Plains (41° 17’ 0”S, 146° 3’ 0”E). The three sites were selected as they represent Tasmania’s climatically diverse potato growing regions. Cressy, Forthside and Gunns Plains are classified as low- (~610 mm y-1), moderate- (~980 mm y-1) and high-rainfall (~1330 mm y-1) environments, respectively, based on their cumulative long-term annual rainfall. Owing to climatic, landscape and geological variations, a variety of soil types (Isbell, 2016) exist in Tasmania. Kurosol, Dermosol, Chromosol, Ferrosol and Sodosol are the main soil types which are found in 74.3% of the areas suitable for growing potato (Ojeda et al., 2020).
For this study, we created a complete factorial between soil type and site to explore the impact of soil type on model structural uncertainty. By testing all possible combinations, we can assess how each factor and their interactions contribute to the model structural uncertainty.
Different models of crop (PMF and nPMF), soil water (SoilWat and SWIM3) and irrigation (IM1 and IM2) were used to create eight independent model structures (Table S1) within APSIM Classic (v7.10) (Chapagain et al., 2023). Simulation of each model structure were carried out for the three soil types in the selected sites from 1900 to 2020 (i.e. 3 soils × 3 locations × 8 model structures × 121 years = 8,712 simulated growing seasons).
Two potato models in APSIM were used for this study. In the first potato model, Plant Modelling Framework (PMF) was used for model development (Brown et al., 2011), whereas a legume-based modelling framework (Robertson et al., 2002) was used for model development in the second potato model (nPMF) (Ridwan Saleh, 2009). These models not only differ in their programming languages, but also they differ in internal processes such as: evapotranspiration; dry matter production; phenological stage determination; nitrogen uptake and partitioning (Chapagain et al., 2023). More details about the characteristics and structure of these two potato models can be found in Brown, Huth (Brown et al., 2011) and Ridwan Saleh (2009), respectively.
SoilWat (Probert et al., 1996) and Soil Water Infiltration and Movement v3.0 (SWIM3) (Huth et al., 2012) are two soil models available in APSIM that have different levels of complexity and used different modelling approaches (Vogeler et al., 2022; Chapagain et al., 2023). SoilWat calculates soil water dynamics using a cascading water balance model, whereas SWIM3 uses the Richards equation approach. SWIM3 has been developed in such a way that it uses the same inputs as SoilWat for processes such as soil water retention and runoff which allows SWIM3 to use the existing soil databases for SoilWat. Further, it also helps users of SoilWat to use SWIM3 (Huth et al., 2012; Chapagain et al., 2023). More details about these soil water models can be found in Probert, Dimes (Probert et al., 1996) and Huth, Bristow (Huth et al., 2012), respectively.
This study used two irrigation models (IM1 and IM2) previously described by Chapagain, Huth (Chapagain et al., 2023) which employed manager scripts in APSIM. Following farming practices described by Ojeda, Rezaei (Ojeda et al., 2021b), two models were developed to provide 15 mm of irrigated water during each irrigation schedule between 3rd November and 7th February. 15 mm is the required deficit in available soil water to apply irrigation and the amount to irrigate (i.e. 15 mm is added if the deficit is above 15 mm when there is an irrigation opportunity). In the case of IM1, a fixed irrigation schedule was established, occurring every 3 days, but irrigation was only implemented when the soil water deficit (SWD) exceeded 15 mm. IM2, on the other hand, computed SWD daily and initiated irrigation when SWD surpassed 15 mm. The management parameters used for SWD computation, the quantity of irrigation water, and irrigation efficiency were the same for both models, with the variations lying in their respective decision-making logic (Chapagain et al., 2023).
The details of the models are presented in Table 1. Model complexity is assessed based on the comparison of the variance between different model structures. The crop model, soil water balance model and irrigation model used to create different model structures in this study have different complexities. The soil and crop models have many more state variables, processes affecting these state variables, and parameters and lines of code used to describe the processes. Thus, they have greater complexity as described by Snowling and Kramer (2001). The irrigation model is smaller. As a model, it is similar in size/complexity to some components used as building blocks for the larger crop model.

Table 1 Description of the different models.
Out of the five main soils found in more than 70% of potato growing areas (Ojeda et al., 2020), we used the three most dominant soils of Tasmania’s potato regions: Red Ferrosol (RFr), Grey Kurosol (GKr) and Red Dermosol (RDm). Approximate FAO equivalent of these soils are Ferralsols, Alisols and Chernozems respectively (Schad, 2016), whereas USDA equivalent are Oxisols, Vertisols and Borolls respectively. Observed data from Hinton, Harrison (Hinton et al., 2018) were used to create soil profiles in APSIM (see Table S2 for more details) which consists of: bulk density; drained upper limit (DUL); drained lower limit (LL15); saturated volumetric water content (SAT); soil pH; organic carbon; and electric conductivity. Maximum plant available water capacity (PAWC) is computed as the difference between DUL and LL15. Among soil types, PAWC ranged from 122 mm in Red Ferrosol (from 0 to 110 cm soil depth) to 201 mm in Red Dermosol (from 0 to 90 cm soil depth).
The daily weather inputs used in APSIM simulations were: precipitation (mm); potential evapotranspiration (mm); maximum and minimum temperature (°C); solar radiation (MJ m− 2); and vapor pressure (hPa). There were separate timeseries for each of the three sites, retrieved for 1900-2020 from the Scientific Information for Land Owners (SILO) database (longpaddock.qld.gov.au/silo/gridded-data) (Jeffrey et al., 2001). In the SILO dataset, the gaps in observational data are filled using interpolation methods, generating continuous data needed for crop modelling.
The crop management inputs used in this study represents the practices of the potato growing areas in Tasmania based on the mean across 112 commercial farm districts during growing seasons between 2003 to 2007 (Ojeda et al., 2021b). Potatoes were harvested upon reaching full senescence. Detailed description of crop management inputs used for the study is given in Table 2.
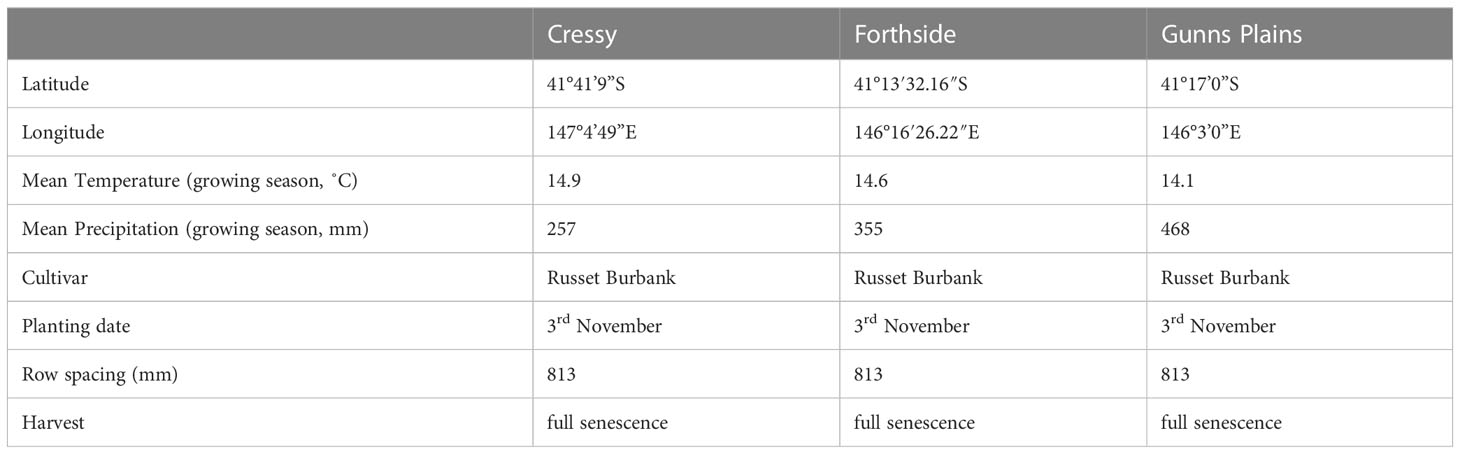
Table 2 Description of locations, climatic pattern and crop management inputs used in this study.
The uncertainty analysis was carried out on the following five outputs: (i) dry tuber yield; (ii) irrigation; (iii) water drainage; (iv) nitrogen leaching; and (v) PGM. Except PGM, all other variables are direct outputs in APSIM. Thus, PGM was computed as follows:
where yield is the dry potato tuber yield (t ha-1); price is the income generated per ton of tubers (342 USD t-1, a constant in this study); irrigation is the cumulative irrigation demand from planting to full crop senescence and irrigation cost is the cost associated with irrigation water (35 USD (ML)-1, a constant in this study). Yield and irrigation values were obtained from APSIM output files, whereas price and irrigation cost were retrieved from AgriGrowth Tasmania (2021). The values were originally reported in AUD and a conversion rate of 1 AUD= 0.7 USD (exchange rate of August 2022) was used to convert it to USD.
Analysis of variance (ANOVA) approach (Iversen et al., 1987; Sawyer, 2009) was applied to quantify the sources of structural uncertainty in different soils. A 3-way ANOVA was carried out with three factors: crop model; soil water model; and irrigation model. The analysis also included the interactions between these elements, to partition the total variance in the selected model outputs resulting from various model structures (Equation 2). The actual uncertainty was expressed in terms of standard deviation.
where, σ2mo = total variance in model output (yield, irrigation, drainage, nitrogen leaching and PGM for this study) due to cm (crop model), swm (soil water model), im (irrigation model) and int (interactions between them);
where: TSS = total sum of squares; and SS= sum of squares.
The absolute difference in simulated output due to the difference in choice of model is calculated using Equation 7.
where: MOdiff = Absolute difference in simulated model output due to the difference in choice of model; OA= simulated output due to model A; OB= simulated output due to model B.
Irrespective of soil types, crop model contributed the most to the mean proportion of variance in most model outputs as compared to other models (see Figure 2 and Table 3). Structural uncertainty resulting from choice of crop model was above 60% for yield, drainage, nitrogen leaching and PGM in all soil types (from 78.3% to 92.2% for Red Ferrosol, from 60.2% to 92.2% for Grey Kurosol and from 63.3% to 93.9% for Red Dermosol). A notable exception was irrigation, where the choice of irrigation model contributed the largest percentage of the structural uncertainty (65.6% for Red Ferrosol, 64.9% for Grey Kurosol and 47.0% for Red Dermosol). The contributions of soil water model and irrigation model varied depending on the soil type and model output (see Figure 2 and Table 3). For example, soil water model contributed 15.4% and 12.7% for drainage and nitrogen leaching in Red Ferrosol, whereas 3.5% and 6.6% in Grey Kurosol and 30.7% and 23.5% in Red Dermosol for the same model outputs.
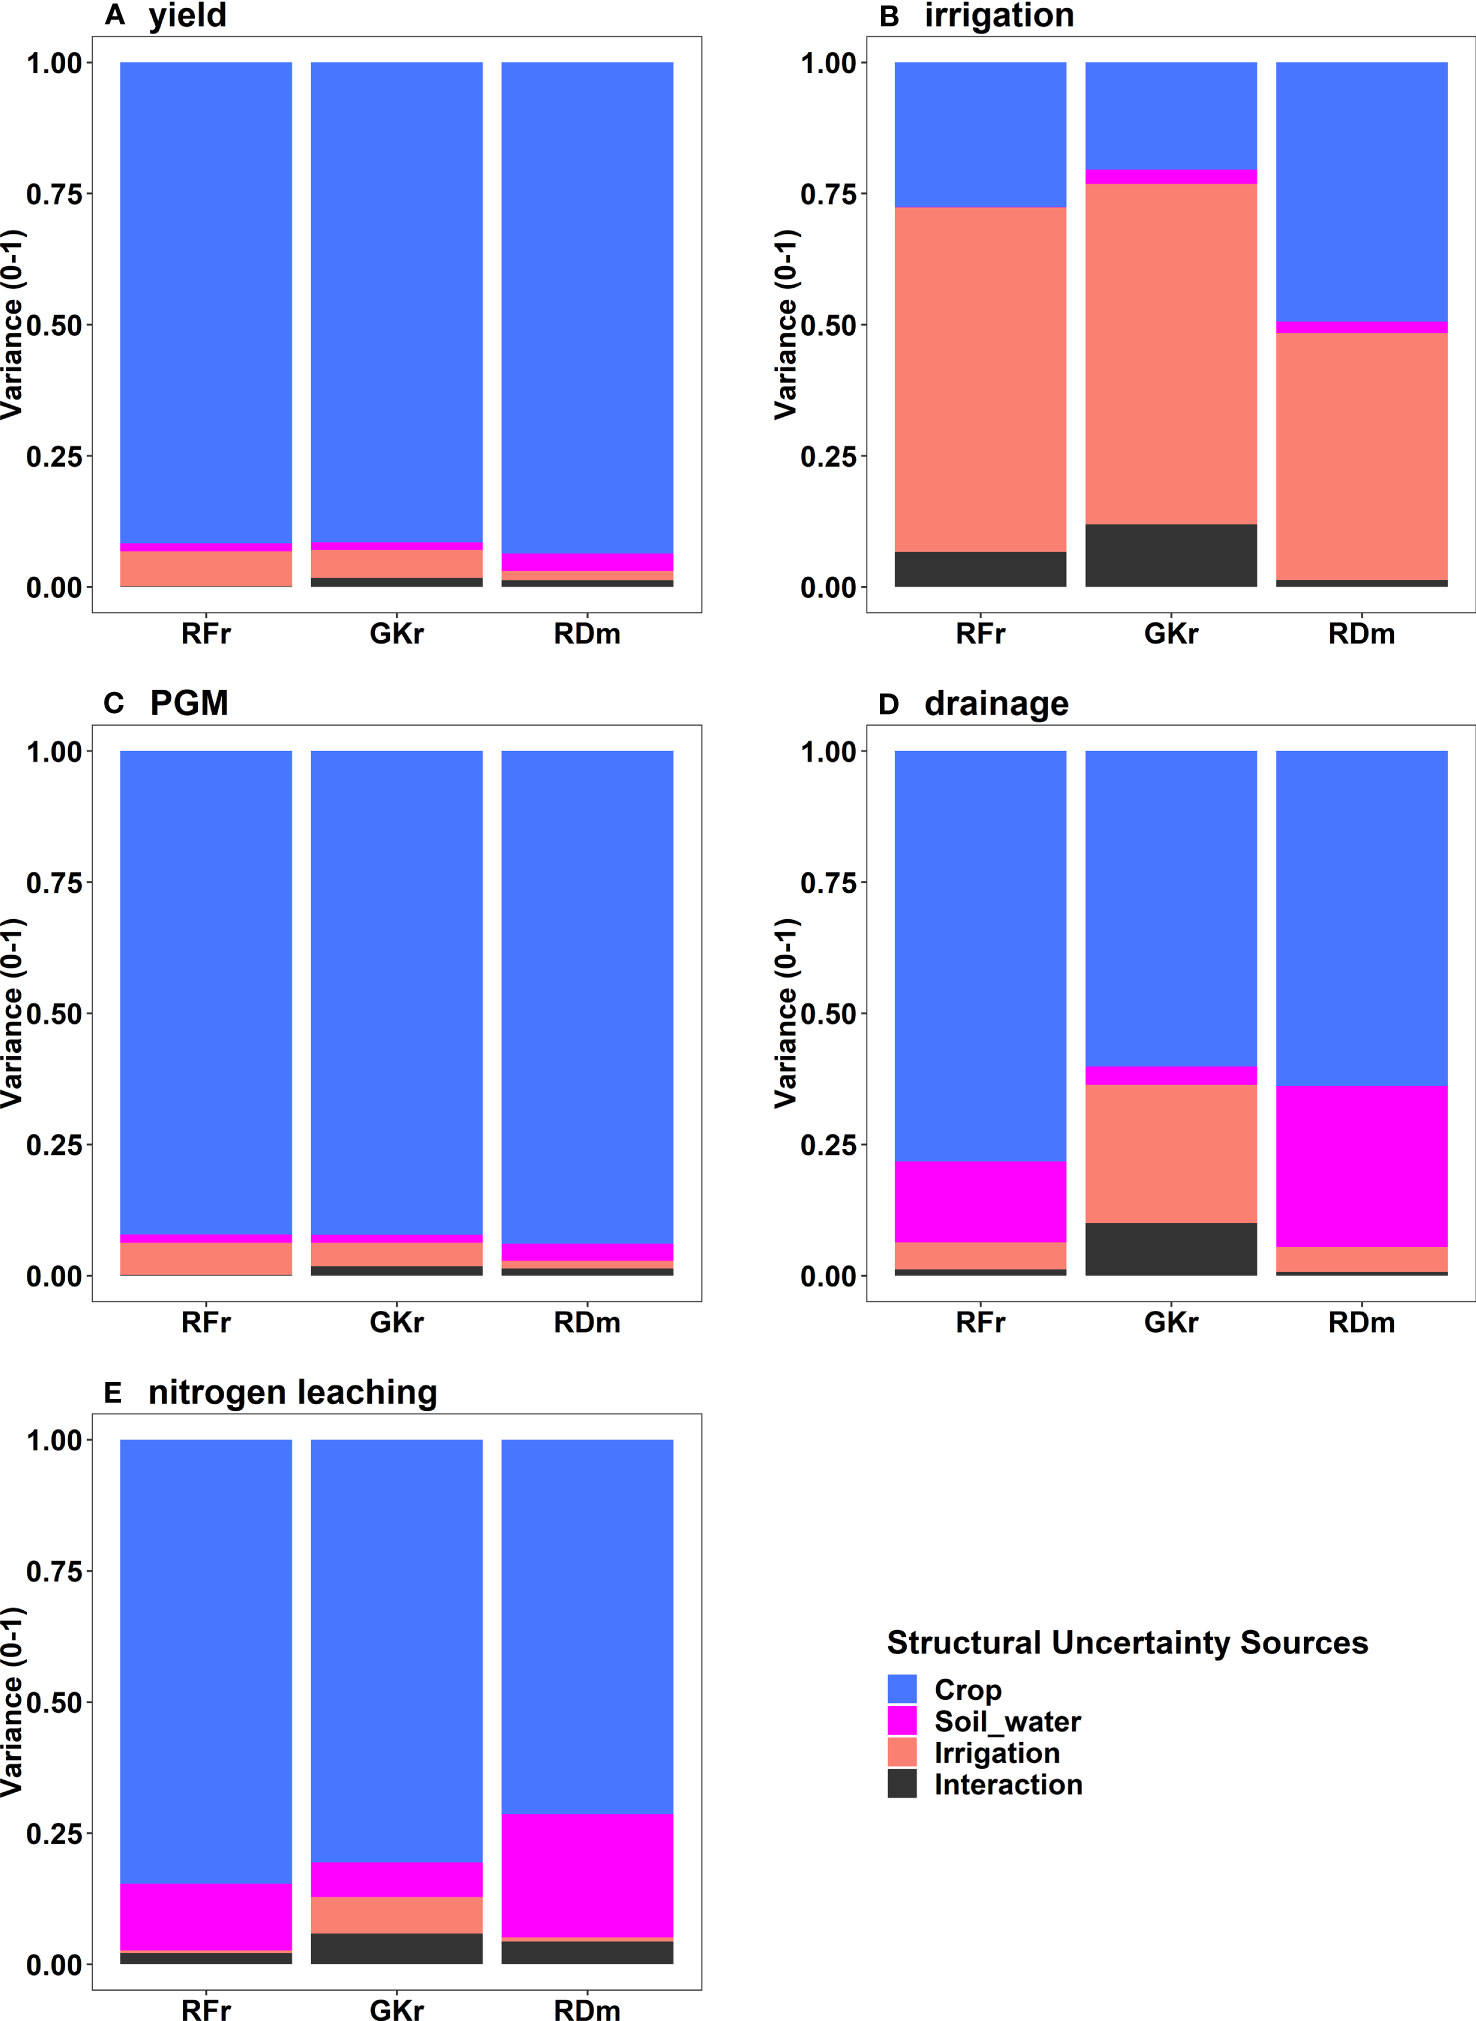
Figure 2 Decomposition of model structural uncertainty (crop model, soil water model, irrigation model and interaction) using the mean proportion of variance for simulated (A) yield; (B) irrigation demand; (C) partial gross margin (PGM); (D) drainage; and (E) nitrogen leaching by soil type (Red Ferrosol (RFr): 122 mm; Grey Kurosol (GKr): 166 mm; and Red Dermosol (RDm): 201 mm).
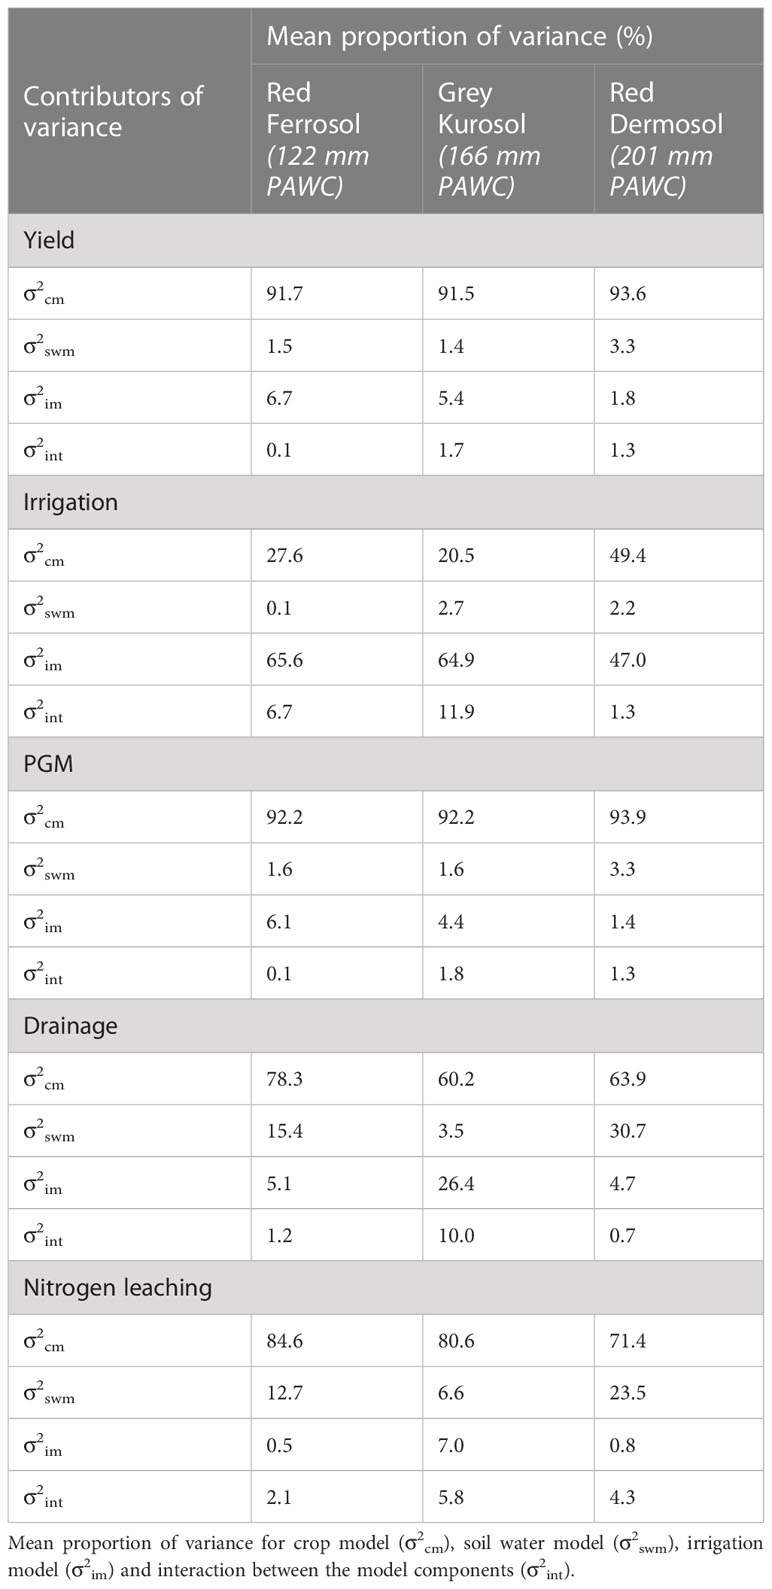
Table 3 Uncertainty decomposition in simulated model outputs resulting from different sources of uncertainty.
First order effects (>88%) due to the choice of model components were found to be dominant over second order interactions (<12%) between model components. Further, interaction between them in Grey Kurosol was always greater than Red Ferrosol and Red Dermosol (Table 3). Additionally, model complexity did not affect uncertainty arising from the choice of model. For example, uncertainty resulting from choice of irrigation model (quite simple models) contributed the largest for irrigation (47-65.6%) as compared to crop model (20.5-49.4%) and soil water model (0.1-2.7%) (Figure 2).
The magnitude of model uncertainty, expressed in terms of standard deviation (SD), differed depending on the output assessed (Table 4). For instance, SD for simulated yield was 0.4-1 t ha-1 for crop model, 0.3-0.9 t ha-1 for soil water model and 0.2-0.9 t ha-1 for irrigation model, whereas the contribution of these three contributors for simulated drainage was 9.9-30.6 mm, 7.5-15.5 mm and 7.1-16.6 mm, respectively. In addition, a significant influence of environmental conditions was observed on the SD of simulated outputs (Table 4).
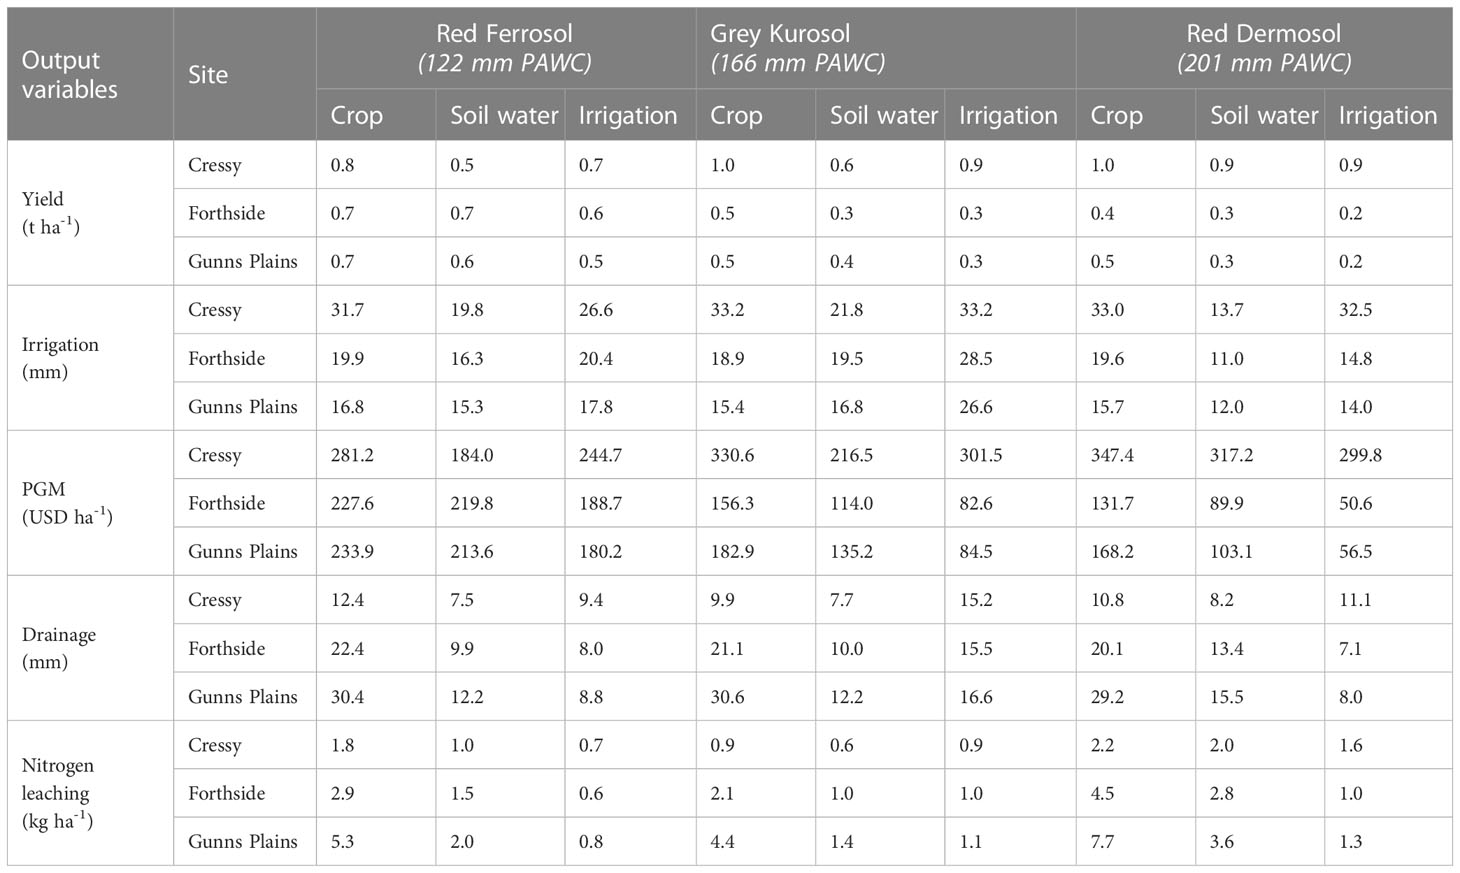
Table 4 Standard deviation of simulated model outputs for the three soil types (Red Ferrosol, Grey Kurosol and Red Dermosol) across the three sites evaluated (Cressy, Forthside and Gunns Plains).
In absolute terms, crop model was the dominant source of variance in most model outputs (Figure 3, Figure S1, Figure S2, Figure S3), except for irrigation demand where the irrigation model was the largest contributor of uncertainty (Figure 4). Overall, the absolute difference in model outputs was markedly influenced by soil type and site (Figures 3, 4; Figures S1–S3). For example, for soil types, the variation in simulated nitrogen leaching due to difference in crop models ranged between 0 kg ha−1 and 37.1 kg ha−1 for Red Ferrosol, 0 kg ha−1 and 35.9 kg ha−1 for Grey Kurosol 0 kg ha−1 and 51.5 kg ha−1 for Red Dermosol, followed by soil model and irrigation model. Conversely, the range was from 0 kg ha−1 to 18.5 kg ha−1 for Cressy, from 0 kg ha−1 to 33.7 kg ha−1 for Forthside and from 0 kg ha−1 to 51.5 kg ha−1 for Gunns Plains, followed by soil model and irrigation model in case of sites.
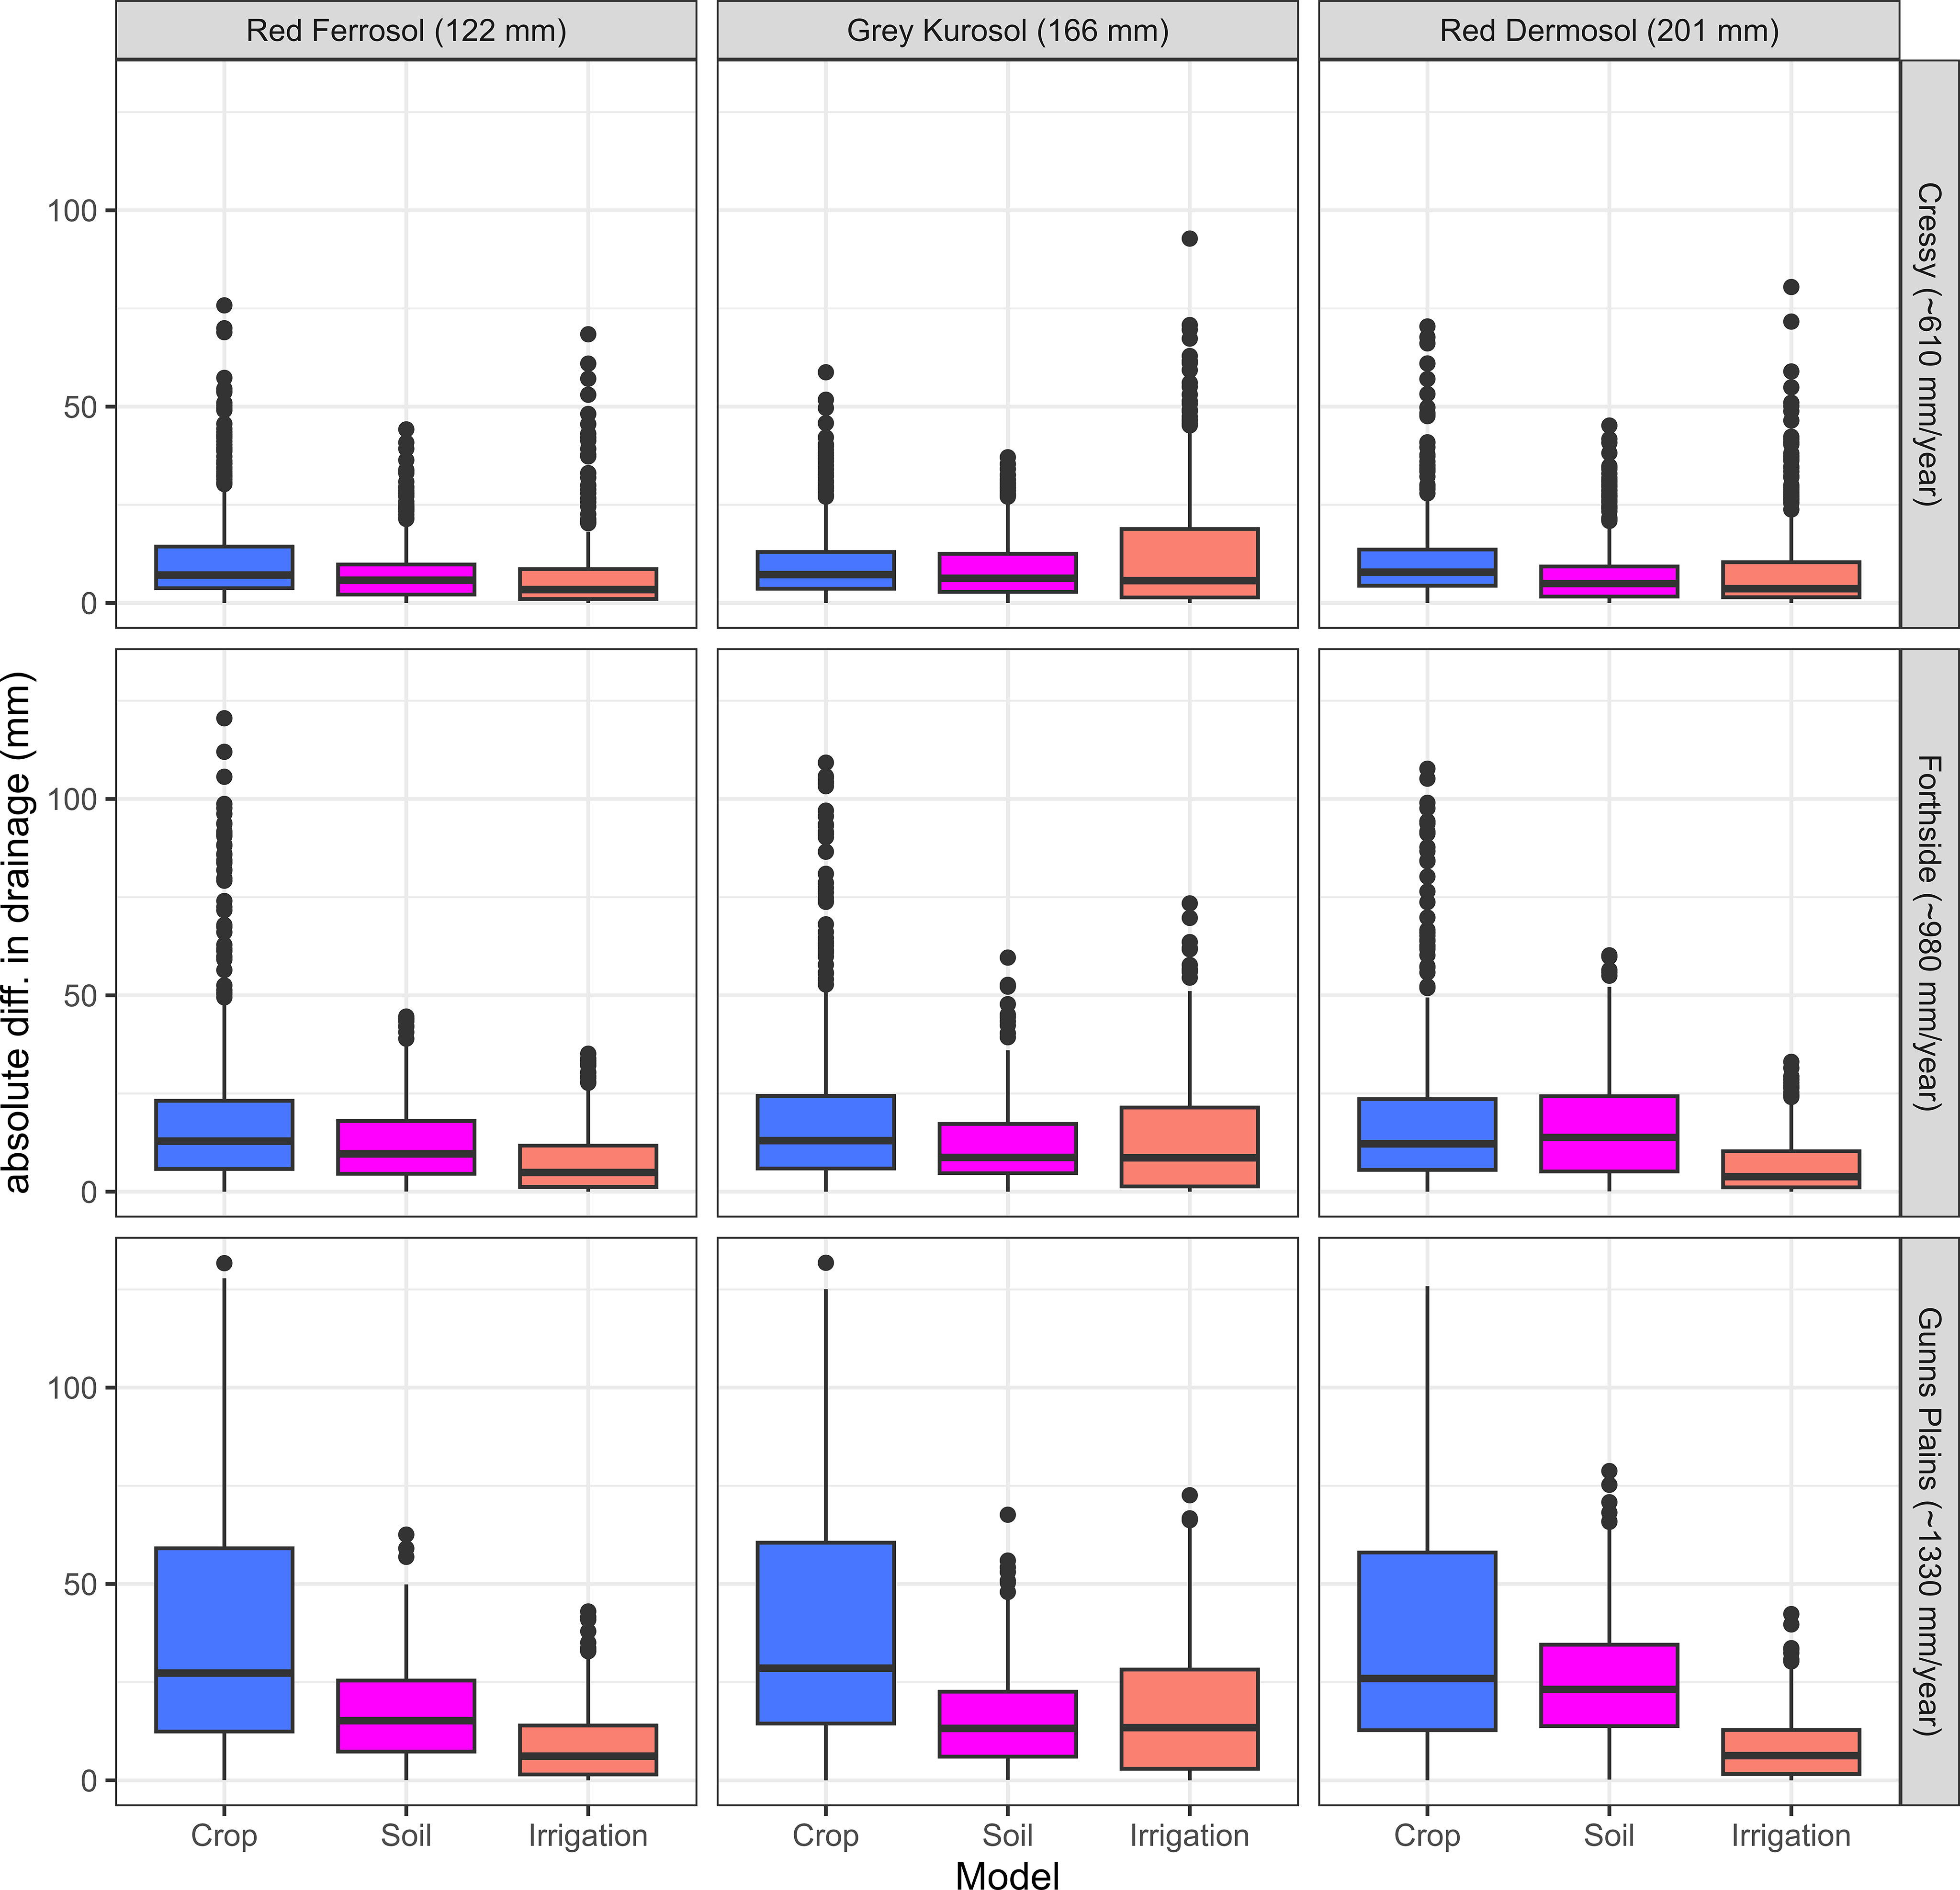
Figure 3 Absolute difference in simulated drainage for three soil types (Red Ferrosol, Grey Kurosol and Red Dermosol) across three sites (Cressy, Forthside and Gunns Plains). Numbers after the site names indicate average annual precipitation.
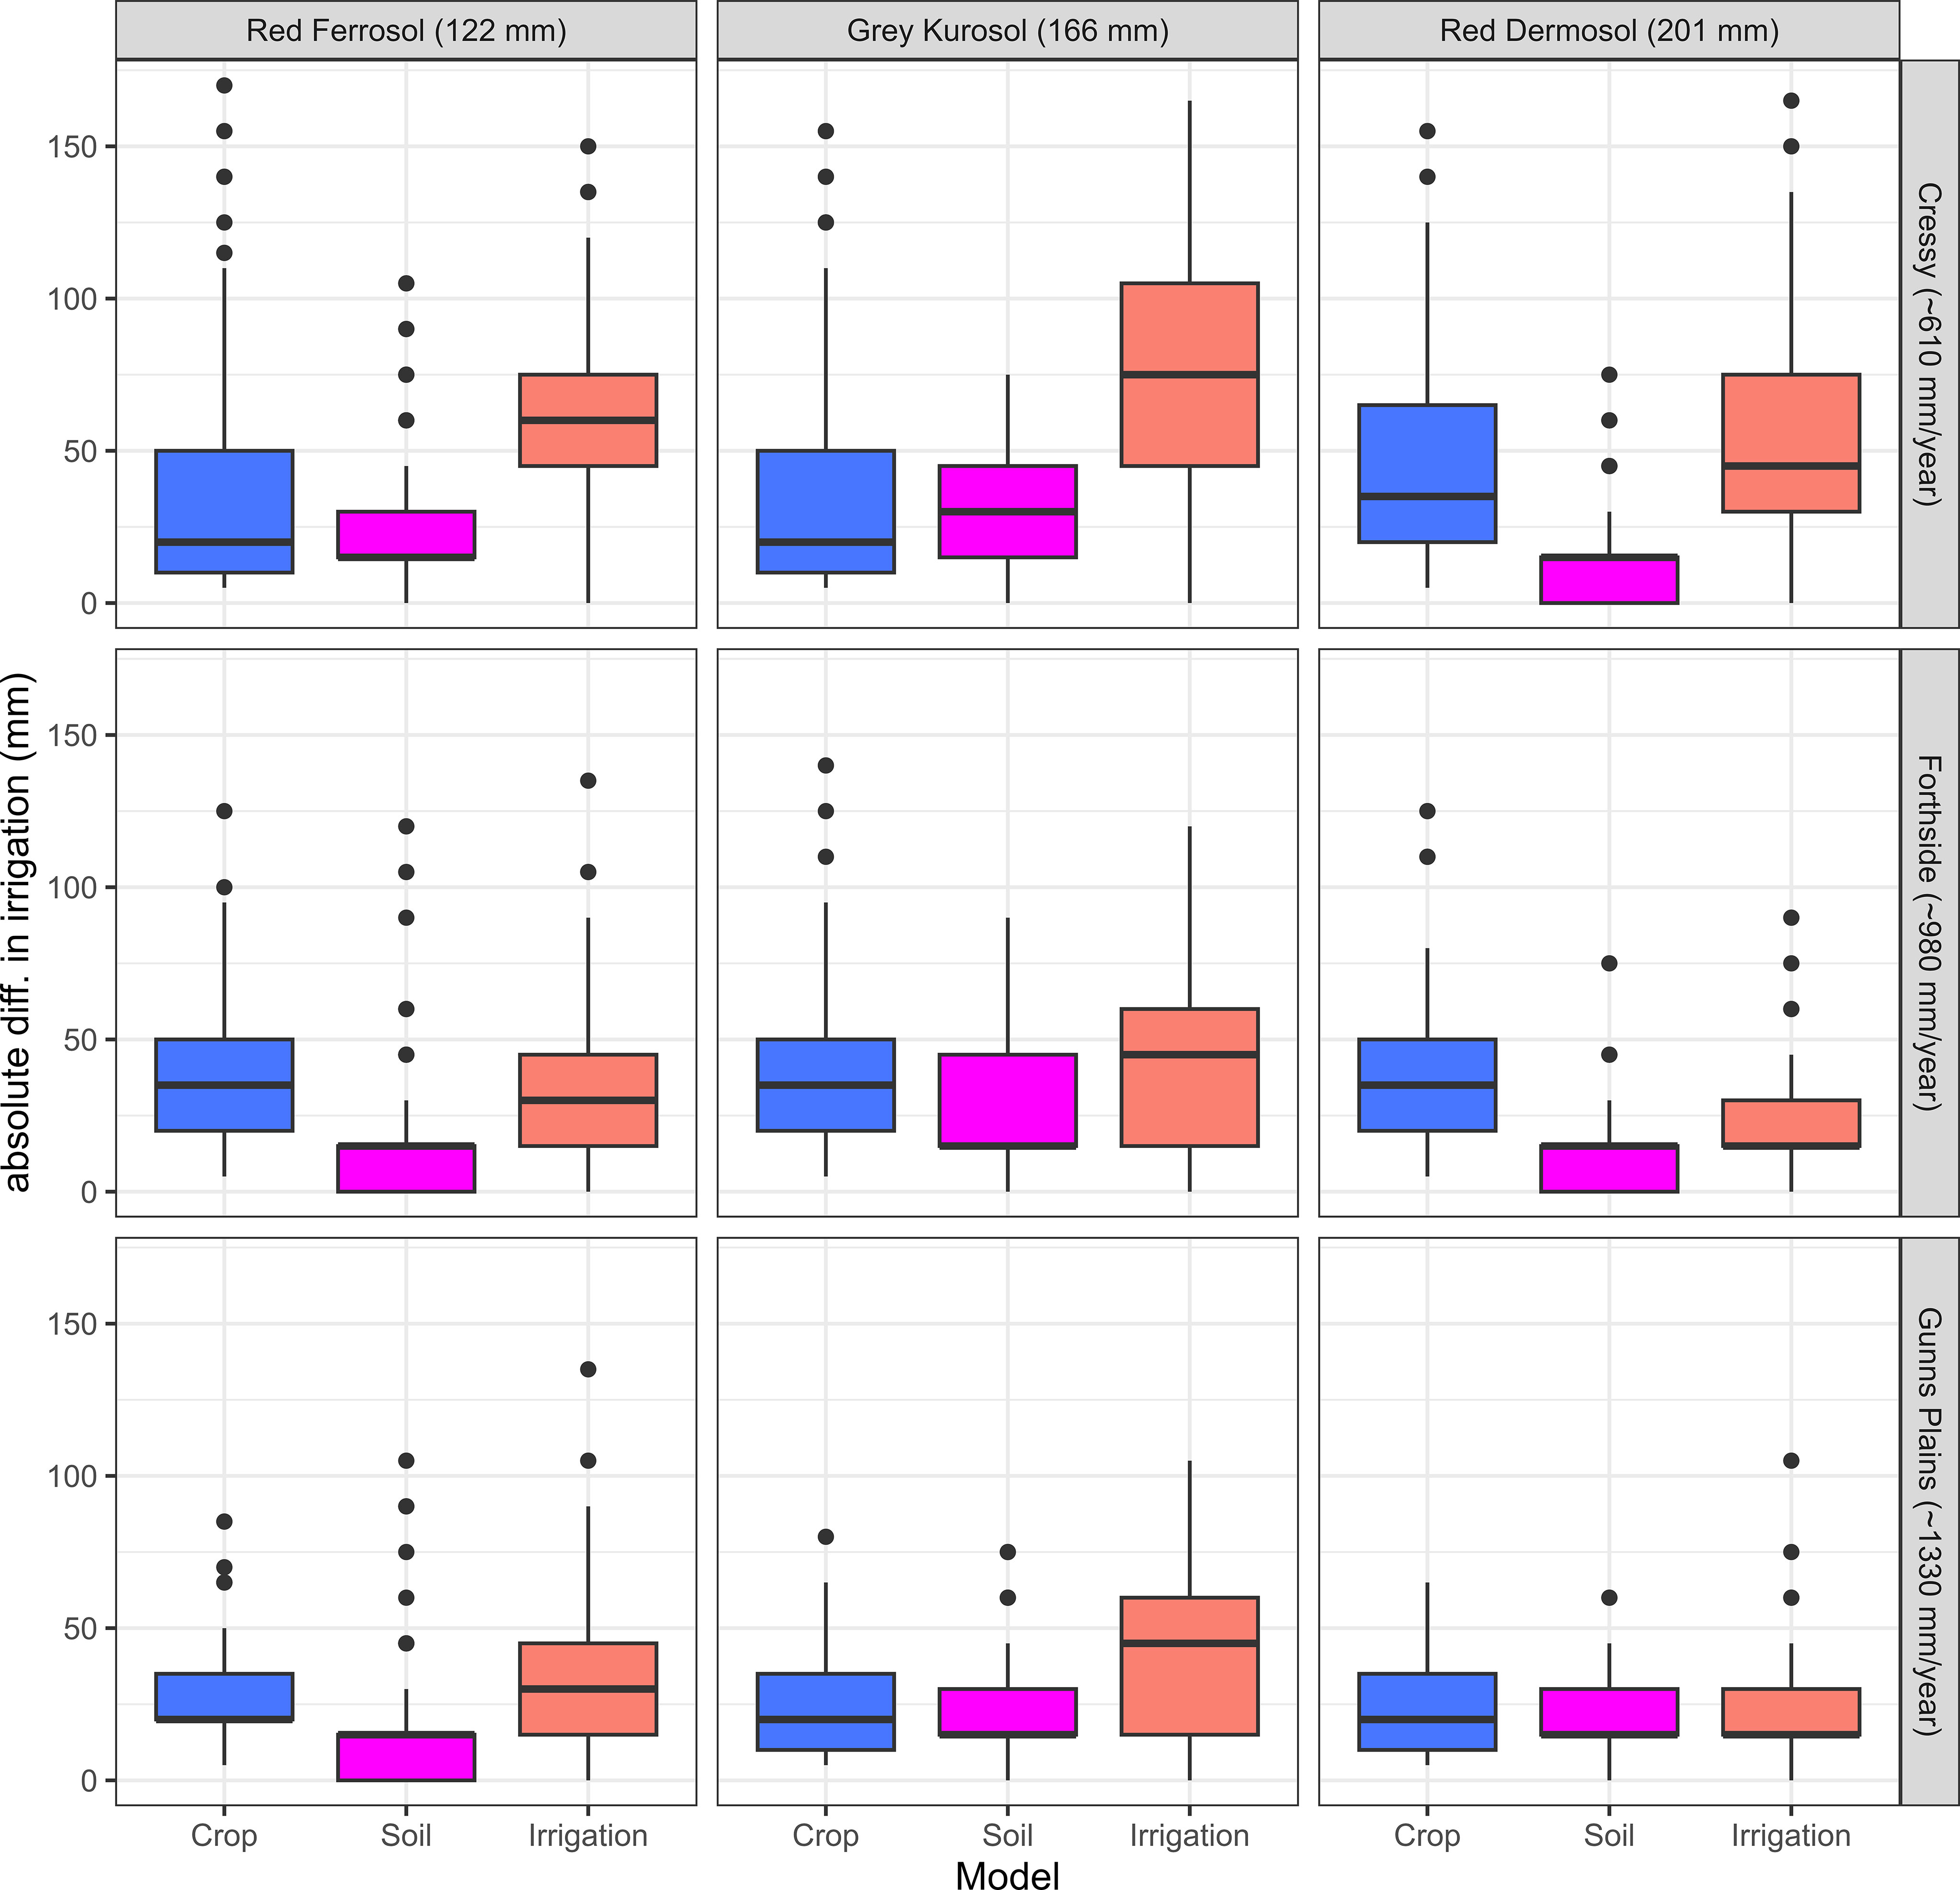
Figure 4 Absolute difference in simulated irrigation demand for three soil types (Red Ferrosol, Grey Kurosol and Red Dermosol) across three sites (Cressy, Forthside and Gunns Plains). Numbers after the site names indicate average annual precipitation.
The mean and standard deviation (SD) of simulated model outputs varied for each model structure (Table S3). In general, the model developed using combination of the PMF model with SoilWat and IM2 (P2_SW_M2) resulted the highest absolute values for yield (16.7 t ha-1), irrigation (346.6 mm) and PGM (5586.9 USD ha-1) across different types of soil. Conversely, the nPMF model combined with SWIM3 and IM1 (P1_SM_M1) produced the lowest absolute values for yield (9.9 t ha-1), irrigation (128.1 mm), and PGM (3285.9 USD ha-1). Similarly, the model developed using combination of the nPMF model with SoilWat and IM2 (P1_SW_M2) yielded the highest absolute values for drainage (110.1 mm) and nitrogen leaching (9.9 kg ha-1), whereas the PMF model combined with SWIM3 and IM1 (P2_SM_M1) produced the lowest absolute values for drainage (2.9 mm) and nitrogen leaching (0.1 kg ha-1).
Density distributions, presented in Figure 5 (and also in Figures S4–S7), consistently showed differences in model outputs between soil types and site conditions. The density distributions were positively skewed for all outputs. For yield and PGM, variability was inversely proportional to amount of rainfall and PAWC (Figures 5, S5). Compared to other sites and soil types, Cressy and Red Ferrosol showed a greater degree of variation. This might be as Cressy receives low rainfall compared to the other two sites and Red Ferrosol has the lowest PAWC among the soil types. Under wetter conditions (the lower right quadrant of the four panels in Figure 5), variability in yield and PGM was dependent mainly on choice of crop model. However, in case of drainage and nitrogen leaching, the distributions concentrated more towards zero, with higher values occurring during wetter seasons (Figures S6, S7).
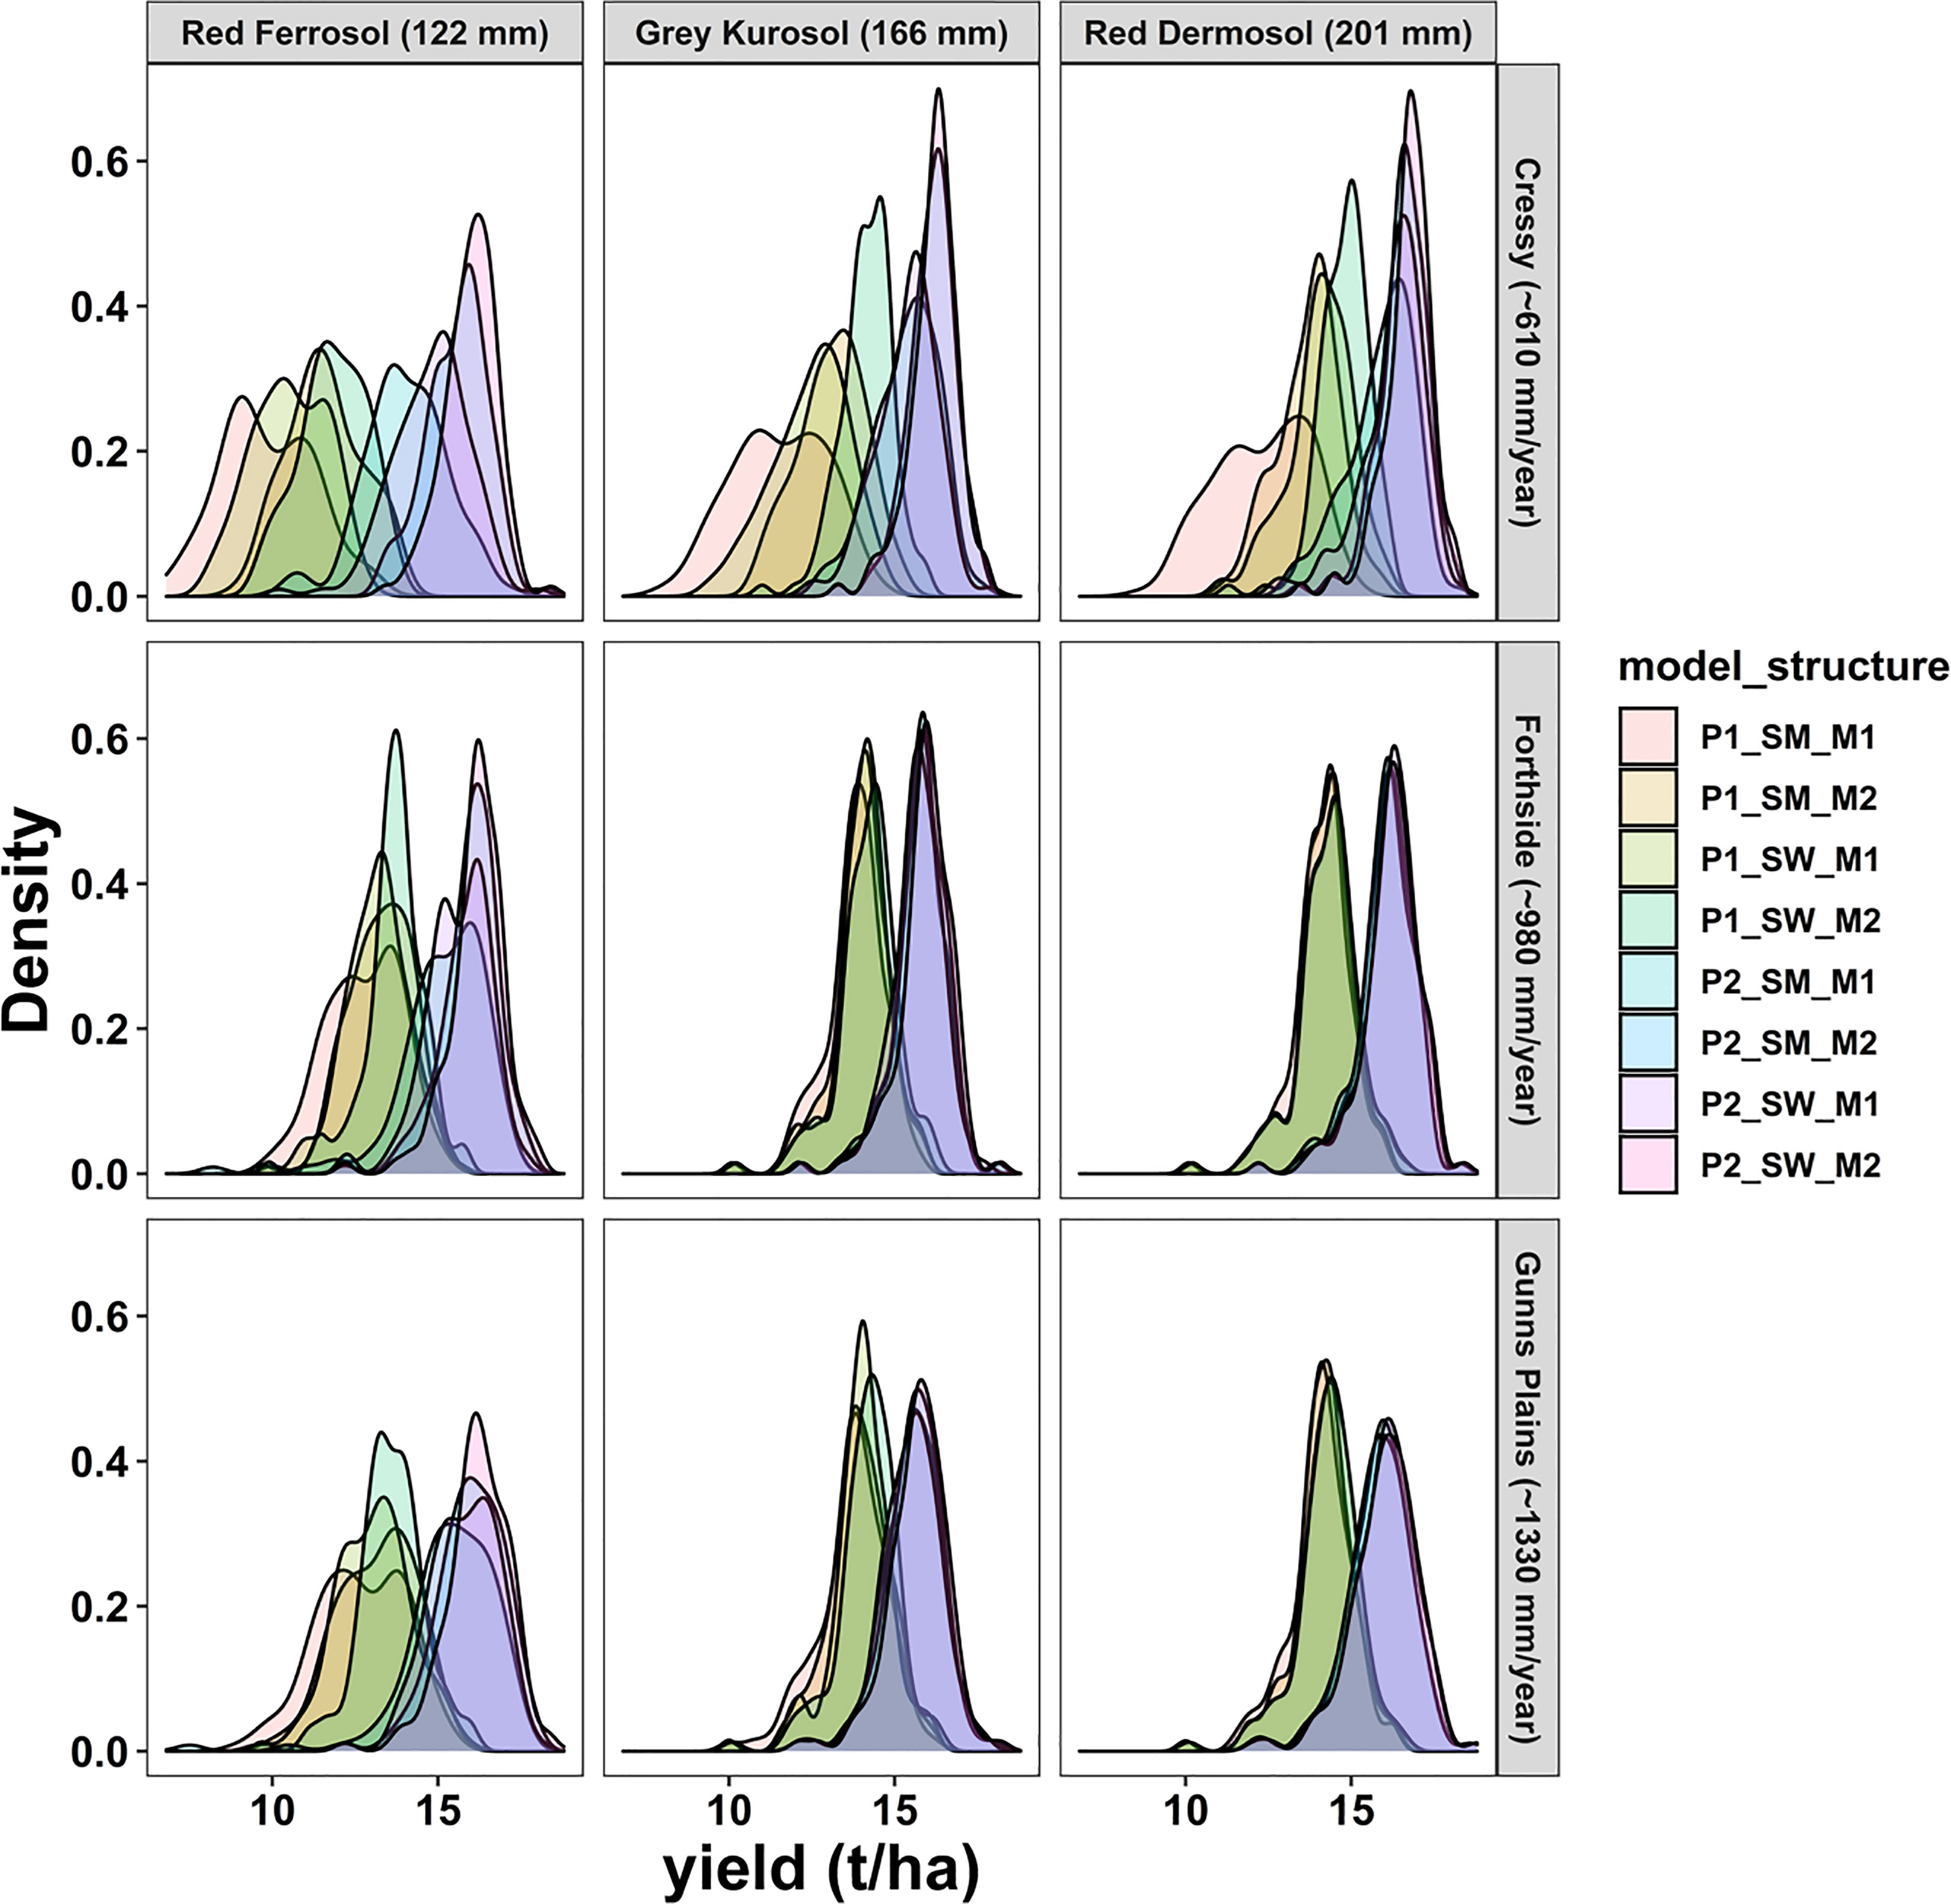
Figure 5 Probability density function of simulated yield (t ha-1) obtained from the eight model structures for the three soils (Red Ferrosol, Grey Kurosol and Red Dermosol) across the three sites (Cressy, Forthside and Gunns Plains). The distinction between use of the PMF or the nPMF crop models is illustrated by the two primary clusters present in the lower right quadrant of the four panels. Conditions with lower moisture (lower rainfall, or lower PAWC) result in increased levels of structural uncertainty.
Our research highlights that environment (soil type × site) has a significant impact on the magnitude of structural uncertainty for the different model outputs. This is reflected from the analysis of relative and actual variance. Our findings align with previous research that indicate soil and weather conditions have marked influence on uncertainty of model outputs (Waha et al., 2015; Coucheney et al., 2018; Ojeda et al., 2020; Rettie et al., 2022; Chapagain et al., 2023).
Uncertainty due to the choice of crop model was overall the largest source of uncertainty in simulated outputs. This may be because several differences exist between these crop models (Table 1), including dry matter production, phenological stages, calculation of evapotranspiration and nitrogen uptake (Chapagain et al., 2023). When uncertainty due to crop models is the largest source of uncertainty, it is concerning because it implies that the predictions made using these models can differ substantially, which can have significant implications in choosing appropriate models for decision-making in agriculture, such as determining crop management practices or policy decisions. If the models are predicting differently, the decisions based on them may not be optimal, leading to potential negative impacts on food security, economic outcomes and environmental sustainability. Therefore, it is essential to identify and address the sources of uncertainty in cropping systems. Our results are consistent with previous uncertainty assessment studies (Araya et al., 2015; Li et al., 2015; Yin et al., 2015; Wang et al., 2017; Tao et al., 2018; Rettie et al., 2022). Yin, Tang (Yin et al., 2015) used four crop models with five global climate models (GCMs) to quantify how climate change will affect China’s major crops in the future and found that crop models provide a greater degree of uncertainty in yield than differences between GCMs in most parts of China. Similarly, Araya, Hoogenboom (Araya et al., 2015) found most variations in maize yields were attributed to the choice of crop models while investigating the effect of climate change on maize yield using two crop models and 20 GCMs in Ethiopia. However, the results reported in this paper are probably one of the first analyses which looked at uncertainty of model structure using the same modelling platform in a vegetable crop such as potato across different environments.
The uncertainty due to choice of model was not necessarily affected by model complexity, which was assessed by comparing the variances across different model structures. It is notable that uncertainty from changes to selection of the simple model can have similar impacts to choice regarding the larger models. For example, irrigation model was the most significant source of uncertainty for irrigation results, despite these being simple models (see Figures 2, 4) as compared to soil water models and crop models (Table 1). This result aligns with Ramirez-Villegas, Koehler (Ramirez-Villegas et al., 2017) where the authors assessed model complexity and uncertainty using two versions of GLAM model for Indian groundnut and reported that skill improved only marginally and in small areas as a result of added complexity.
We highlighted the fact that higher mean proportion of variance does not necessarily equate with higher magnitude of uncertainty in actual terms (Figures 2–4, S1–S3 and Table 3) and should not be the only factor considered in uncertainty assessments. Although the choice of crop model significantly affects both yield and PGM variance (accounting for over 90% of the impact), the narrow ranges of simulated yield (0.2 to 1 t ha-1) and PGM (50.6 to 374.4 USD ha-1) standard deviations in relation to the mean values (yield: 14.6 t ha-1, PGM: 4901 USD ha-1) indicate relatively low uncertainty in these values. Similarly, while the choice of irrigation model contributes more than 45% to the variance, the relatively small standard deviations (ranging from 11 to 33.3 mm) compared to the overall mean irrigation of 500 mm suggest a low level of actual uncertainty in these values. In contrast, when considering environmental variables such as drainage and nitrogen leaching, the crop model choice accounts for over 60% and 70% of the variance, respectively. However, the comparatively large standard deviations (ranging from 7.1 to 30.6 mm for drainage and 0.6 to 7.7 kg ha-1 for nitrogen leaching) compared to the overall mean values of drainage (44.4 mm) and nitrogen leaching (3.2 kg ha-1) indicate a significant level of actual uncertainty in these variables. Thus, it is important to consider the proportion of variance as well as the actual variance (i.e., in the unit of the variable) to provide more accurate and reliable estimates of uncertainty surrounding model outputs. Examining the output variance in relation to the different model structures and variance of inputs can contribute to understanding the model’s sensitivity to changes in those different structures and inputs. However, comparing output variance to the variance of specific inputs is not sufficient for making judgments and should be complemented with a comprehensive evaluation that encompasses multiple validation measures to ensure a robust assessment of the accuracy and reliability of crop models.
Different methods and indicators may be appropriate in different contexts depending on the type of data and the specific uncertainties involved. For example, in some cases, sensitivity analysis, scenario analysis or probabilistic modelling may be useful in assessing uncertainty. In other cases, expert judgment, historical data analysis or qualitative assessments may be more appropriate. By considering a range of methods and indicators, decision-makers can develop a more nuanced understanding of the uncertainties they are facing and take appropriate steps to manage or mitigate those uncertainties. This can ultimately lead to better outcomes and more effective decision-making.
Compared to other sites and soils, Cressy, which is a low rainfall site and Red Ferrosol, which has lowest PAWC, exhibited significantly higher variability in our study which emphasizes the inverse relationship of variability in yield and PGM to the amount of rainfall and PAWC (Figures 5, S5). However, for drainage and nitrogen leaching metrics, wetter conditions provided the larger uncertainty range. Understanding how the range in variability from model outputs is related to rainfall and PAWC for a target site is important for farmers and land managers because it can help inform model selection, which then will inform crop selection and management decisions. Our results highlight how drier (wetter) conditions expose differences within crop models at various stages of modelling whereas, wetter (drier) conditions mask them. If models cannot perform well under drier (wetter) conditions, decision makers may not be able to accurately predict the impacts of dry (wet) conditions on crop yields, food production or environmental impacts. This can lead to suboptimal decision making. For example, if a region has high rainfall and high PAWC, farmers will need different modelling tools to optimize the selection of crop varieties that are more tolerant to wet conditions or implementing drainage systems to mitigate the effects of excess water. Similarly, in regions with low PAWC, farmers need to target modelling tools that optimize handling for practices such as conservation tillage or crop rotations to improve soil water retention and reduce the risk of yield losses during dry periods. Getting these decisions wrong can lead to inefficient use of resources, such as irrigation water or fertilizers, which can further exacerbate the impacts of dry (wet) conditions. Thus, it is necessary to consider the conditions and factors most important to a user, and test and optimize a modelling system for this use case.
PAWC is a constant value in the model, it is calculated as the difference between DUL and LL15 for each soil layer. What is variable is the soil moisture each day depending on the rainfall, evapotranspiration, runoff, drainage, irrigation, etc. Hence, PAWC is static and rainfall and actual soil moisture are dynamic but highly affected by irrigation time and amount. When actual soil moisture is close to DUL, the maximum PAWC is achieved and there is no water stress. Irrigation’s purpose is to limit damaging water stress to a plant. This inherently reduces the differences between soil types, as if soil moisture is constantly kept at an ideal level using optimal irrigation scheduling. Irrigation will reduce the impact of irrigation on yield through variation in soil PAWC. However, varying PAWC will change hydraulic behavior and therefore directly impact leaching losses etc. Varying PAWC will also affect irrigation timing because soils that retain water will require less irrigation (i.e. affect the irrigation trigger, thus affecting the timing of irrigation, affecting the volume of irrigation, thus affecting leaching losses or possible yield impact).
Soil properties affect the movement of water, the availability of water to plant roots and the overall water-holding capacity of the soil. They influence plant growth, nutrient availability and overall performance of crop models and can still impact simulations even if soil moisture is set close to field capacity. There could still be some water stress if the cumulative water demand exceeds the maximum irrigation amount. In dry environments, there could potentially be brief periods of stress. More importantly, the amount of drainage and therefore, nitrogen leaching can be affected. There is potential for nitrogen loss through leaching from the crop. Similarly, denitrification can change in supply, though the amounts could be smaller. Nitrogen losses impact environmental and economic outcomes through loss of fertilizer. Additionally, drainage losses have potential environmental impacts and economic losses as a result of irrigation water losses, which is directly related to increase in water and electricity costs.
This research investigates how models perform in conditions with varying moisture availability, specifically drier (characterized by low rainfall and low PAWC) or wetter (characterized by high rainfall and high PAWC) conditions, through the use of modelling simulations. However, our study does not include a comparison between the simulated results and observations because our primary focus was solely on understanding structural uncertainty and hence, observation was not included to avoid the introduction of observation uncertainty. This absence of a comparison may hinder a comprehensive evaluation of the models’ performance and reliability, and therefore, it should be incorporated into future assessments.
Making agronomic decisions can be challenging when there are differences in outputs arising from differences in model structures. Crop models can help decision-makers to identify the most appropriate agricultural management practices and technologies that balance the trade-offs between different objectives over the short and long term. Ultimately, this can help to ensure sustainable agricultural production that meets the needs of society while minimizing negative impacts on the environment. For example, compared to the nPMF model, the PMF model overpredicted potato tuber yield, irrigation, and PGM, but underpredicted nitrogen leaching and drainage suggesting the two models have different strengths and weaknesses in our study. PMF model may be better at predicting certain aspects of potato production, such as tuber yield, irrigation demand and PGM, but may not perform as well when it comes to predicting environmental impacts such as nitrogen leaching and drainage. On the other hand, nPMF model may be more accurate in predicting environmental outcomes but may not perform as well in predicting yield, irrigation demand and PGM. Thus, our study highlights the need to carefully weigh the pros and cons of using each model and decide which model to use based on the specific needs and goals of the agricultural production system.
The findings of this study contribute to the understanding of prevalent challenge in uncertainty research - the quantification of structural uncertainty in crop model predictions caused by different modelling structures or configurations within the same platform. Although, there are large-scale research efforts such as AgMIP (Rosenzweig et al., 2013), FACCE-JPI (Gøtke et al., 2015) and ISI-MIP (Warszawski et al., 2014) which aim to improve the accuracy and reliability of crop modelling by comparing and evaluating the results from different models applied to the same experimental data or field conditions, our approach of uncertainty quantification is quiet distinct when compared to the approach by these initiatives. Our method involves quantifying uncertainty in both processes and structure using a single modelling platform to account for uncertainty that stems from model algorithms and equations while preventing the inclusion of other uncertainties that result from variations in modelling platforms or the different ways in which different models take input data and provide outputs (Chapagain et al., 2023). Additionally, we have considered multiple agronomic, environmental, and economic outputs to demonstrate how model performance can differ depending on the output analyzed and a careful analysis is required considering the trade-offs between them for informed decision-making. For example, by considering environmental results like nitrogen leaching and drainage, along with yield and partial gross margin, we can perform a balanced analysis and opt for a model that provides the most suitable outcomes for a particular objective. The techniques described in this article have the potential to be used on multiple modelling systems, settings, and crops to anticipate a single or multiple outcomes.
The results of our study should, however, be interpreted considering some limitations. We acknowledge that this study only considered and analyzed the influence of soil type on structural uncertainty of simulated outputs and there may be other factors such as irrigation strategy, sowing date and genotype which may have more significant impact. Secondly, we have developed the different model structures within the same modelling platform (APSIM) and results may differ depending on the crop model used. Additionally, our investigation was restricted to three soil types and three sites, although these three soils are the most prevalent in Tasmania, and we included the three sites to account for a broad range of rainfall conditions. Furthermore, the scope of this study is focused on investigating the structural uncertainty that arises from different model structures within the same modelling platform across different environments. The aim is to analyze how different model structures can lead to variance in simulated model outputs. In this regard, the study does not involve comparing the simulation results with observations. This decision was made because observations themselves inherently possess a certain level of uncertainty, and examining this uncertainty was beyond the intended scope of the study. Instead, the primary objective is to explore the impact of different model structures on the simulation outcomes across different soils and sites, thus providing insights into the structural uncertainties within the same modelling platform. In the future, the analysis framework could be expanded to various spatial scales and environments and upscaled to regional and national levels by employing gridded data.
This paper provides insight into the influence of environment (soil and site) on model structural uncertainty through a component-based modelling framework. This uncertainty assessment approach is capable of not only assessing and decomposing uncertainty but also better understanding uncertainty and its main drivers. Our results reveal the strong influence of environmental conditions on structural uncertainty. The finding indicates that there is an inverse relationship between variability in yield and PGM and the amount of rainfall and PAWC, suggesting that it is important to consider multiple model-structures to best capture the potential range in structural uncertainty. Such knowledge helps to better understand how a cropping system will respond to different environmental conditions and allows for more informed decisions about agricultural practices and policies. Additionally, the findings indicate that the choice of crop model is crucial for reducing the uncertainty in simulated model outputs for all environments assessed in this paper. Furthermore, we highlight the necessity to include both mean proportions of variance and actual variance in uncertainty assessments to provide more accurate information for agronomic or policy decision-making. Future modelling studies should consider decomposing the contribution of uncertainty sources and variability factors as this would help better identify the main drivers of variance in model outputs which increases the confidence in modelling simulations, and therefore, produces more useful advice based on farm-model predictions.
The raw data supporting the conclusions of this article will be made available by the authors, without undue reservation.
RC contributed to the conceptualization, methodology, software, formal analysis, investigation, data curation, visualization, and writing original draft. TR, NH and CM contributed to supervision and writing, review and editing. JO contributed to conceptualization, methodology, supervision, writing, review and editing and funding acquisition. All authors contributed to manuscript revision, read, and approved the submitted version.
The research is financially supported by the University of Tasmania (Tasmania Graduate Research Scholarship, 2019) and Commonwealth Scientific and Industrial Research Organization (CSIRO).
We express our gratitude to all those who helped in enhancing the paper’s quality during its various stages of development.
The authors declare that the research was conducted in the absence of any commercial or financial relationships that could be construed as a potential conflict of interest.
All claims expressed in this article are solely those of the authors and do not necessarily represent those of their affiliated organizations, or those of the publisher, the editors and the reviewers. Any product that may be evaluated in this article, or claim that may be made by its manufacturer, is not guaranteed or endorsed by the publisher.
The Supplementary Material for this article can be found online at: https://www.frontiersin.org/articles/10.3389/fagro.2023.1213074/full#supplementary-material
Aggarwal P. (1995). Uncertainties in crop, soil and weather inputs used in growth models: Implications for simulated outputs and their applications. Agric. Systems 48 (3), 361–384. doi: 10.1016/0308-521X(94)00018-M
AgriGrowth Tasmania. (2021). Farm Business Planning Tools. Available at: https://dpipwe.tas.gov.au/agriculture/investing-in-irrigation/farm-business-planning-tools.
Angulo C., Gaiser T., Rötter R. P., Børgesen C. D., Hlavinka P., Trnka M., et al. (2014). ‘Fingerprints’ of four crop models as affected by soil input data aggregation. Eur. J. Agronomy 61, 35–48. doi: 10.1016/j.eja.2014.07.005
Araya A., Hoogenboom G., Luedeling E., Hadgu K. M., Kisekka I., Martorano L. G. (2015). Assessment of maize growth and yield using crop models under present and future climate in southwestern Ethiopia. Agric. For. Meteorol. 214, 252–265. doi: 10.1016/j.agrformet.2015.08.259
Arunrat N., Sereenonchai S., Chaowiwat W., Wang C. (2022). Climate change impact on major crop yield and water footprint under CMIP6 climate projections in repeated drought and flood areas in Thailand. Sci. Total Environment 807, 150741. doi: 10.1016/j.scitotenv.2021.150741
Asseng S., Ewert F., Martre P., Rötter R. P., Lobell D. B., Cammarano D., et al. (2015). Rising temperatures reduce global wheat production. Nat. Climate Change 5 (2), 143–147. doi: 10.1038/nclimate2470
Asseng S., Ewert F., Rosenzweig C., Jones J. W., Hatfield J. L., Ruane A. C., et al. (2013). Uncertainty in simulating wheat yields under climate change. Nat. Climate Change 3 (9), 827–832. doi: 10.1038/nclimate1916
Basso B., Dumont B., Cammarano D., Pezzuolo A., Marinello F., Sartori L. (2016). Environmental and economic benefits of variable rate nitrogen fertilization in a nitrate vulnerable zone. Sci. Total Environment 545, 227–235. doi: 10.1016/j.scitotenv.2015.12.104
Bassu S., Brisson N., Durand J. L., Boote K., Lizaso J., Jones J. W., et al. (2014). How do various maize crop models vary in their responses to climate change factors? Global Change Biol. 20 (7), 2301–2320. doi: 10.1111/gcb.12520
Bilotto F., Harrison M. T., Migliorati M. D. A., Christie K. M., Rowlings D. W., Grace P. R., et al. (2021). Can seasonal soil N mineralisation trends be leveraged to enhance pasture growth? Sci. Total Environ. 772, 145031. doi: 10.1016/j.scitotenv.2021.145031
Boonwichai S., Shrestha S., Babel M. S., Weesakul S., Datta A. (2019). Evaluation of climate change impacts and adaptation strategies on rainfed rice production in Songkhram River Basin, Thailand. Sci. Total Environment 652, 189–201. doi: 10.1016/j.scitotenv.2018.10.201
Bosi C., Sentelhas P. C., Huth N. I., Pezzopane J. R. M., Andreucci M. P., Santos P. M. (2020). APSIM-Tropical Pasture: A model for simulating perennial tropical grass growth and its parameterisation for palisade grass (Brachiaria brizantha). Agric. Syst. 184, 102917. doi: 10.1016/j.agsy.2020.102917
Brown H., Huth N., Holzworth D. (2011). “A potato model built using the APSIM Plant,” in NET Framework. 19th International congress on modelling and simulation. Perth, Australia: Modelling and Simulation Society of Australia and New Zealand.
Cabezas J., Ruiz-Ramos M., Soriano M., Gabaldón-Leal C., Santos C., Lorite I. (2020). Identifying adaptation strategies to climate change for Mediterranean olive orchards using impact response surfaces. Agric. Syst. 185, 102937. doi: 10.1016/j.agsy.2020.102937
Cammarano D., Rivington M., Matthews K., Miller D., Bellocchi G. (2017). Implications of climate model biases and downscaling on crop model simulated climate change impacts. Eur. J. Agronomy 88, 63–75. doi: 10.1016/j.eja.2016.05.012
Chapagain R., Huth N., Remenyi T. A., Mohammed C. L., Ojeda J. J. (2023). Assessing the effect of using different APSIM model configurations on model outputs. Ecol Modell 483, 110451. doi: 10.1016/j.ecolmodel.2023.110451
Chapagain R., Remenyi T. A., Harris R. M., Mohammed C. L., Huth N., Wallach D., et al. (2022). Decomposing crop model uncertainty: A systematic review. Field Crops Res. 279, 108448. doi: 10.1016/j.fcr.2022.108448
Chimonyo V., Modi A., Mabhaudhi T. (2016). Simulating yield and water use of a sorghum–cowpea intercrop using APSIM. Agric. Water Management 177, 317–328. doi: 10.1016/j.agwat.2016.08.021
Cichota R., Snow V. O., Vogeler I. (2013). Modelling nitrogen leaching from overlapping urine patches. Environ. Model. Software 41, 15–26. doi: 10.1016/j.envsoft.2012.10.011
Confalonieri R., Bregaglio S., Adam M., Ruget F., Li T., Hasegawa T., et al. (2016). A taxonomy-based approach to shed light on the babel of mathematical models for rice simulation. Environ. Model. Software 85, 332–341. doi: 10.1016/j.envsoft.2016.09.007
Coucheney E., Eckersten H., Hoffmann H., Jansson P.-E., Gaiser T., Ewert F., et al. (2018). Key functional soil types explain data aggregation effects on simulated yield, soil carbon, drainage and nitrogen leaching at a regional scale. Geoderma 318, 167–181. doi: 10.1016/j.geoderma.2017.11.025
de Souza D. P., Mendonça F. C., Bosi C., Pezzopane J. R. M., Santos P. M. (2022). APSIM-Tropical Pasture model parameterization for simulating Marandu palisade grass growth and soil water in irrigated and rainfed cut-and-carry systems. Grass Forage Sci. 77, 216–231. doi: 10.1111/gfs.12560
Di Luzio M., Arnold J., Srinivasan R. (2004). Integration of SSURGO maps and soil parameters within a geographic information system and nonpoint source pollution model system. J. Soil Water Conserv. 59 (4), 123–133.
Donatelli M., Confalonieri R. (2011). “Biophysical models for cropping system simulation,” in Bio-Economic Models Applied to Agricultural Systems (Dordrecht: Springer Netherlands), 59–86.
Dubey S. K., Sharma D. (2018). Assessment of climate change impact on yield of major crops in the Banas River Basin, India. Sci. Total Environment 635, 10–19. doi: 10.1016/j.scitotenv.2018.03.343
Elli E. F., Huth N., Sentelhas P. C., Carneiro R. L., Alvares C. A. (2020). Ability of the APSIM Next Generation Eucalyptus model to simulate complex traits across contrasting environments. Ecol. Modelling 419, 108959. doi: 10.1016/j.ecolmodel.2020.108959
Farina R., Sándor R., Abdalla M., Álvaro-Fuentes J., Bechini L., Bolinder M. A., et al. (2021). Ensemble modelling, uncertainty and robust predictions of organic carbon in long-term bare-fallow soils. Global Change Biol. 27 (4), 904–928. doi: 10.1111/gcb.15441
Folberth C., Skalský R., Moltchanova E., Balkovič J., Azevedo L. B., Obersteiner M., et al. (2016). Uncertainty in soil data can outweigh climate impact signals in global crop yield simulations. Nat. Commun. 7 (1), 1–13. doi: 10.1038/ncomms11872
Gøtke N., McKhann H., Albouy I., Bura M., Lesser C., Moran P. A., et al. (2015). FACCE JPI Strategic Research Agenda: Revised edition, 2016 (FACCE-JPI).
Guoqing L., Wenzhi Z., Jiang Y., Chang A., Jingwei W., Huang J., et al. (2021). Sensitivity analysis of the SWAP (Soil-Water-Atmosphere-Plant) model under different nitrogen applications and root distributions in saline soils. Pedosphere 31 (5), 807–821. doi: 10.1016/S1002-0160(21)60038-3
Habib-ur-Rahman M., Raza A., Ahrends H. E., Hüging H., Gaiser T. (2022). Impact of in-field soil heterogeneity on biomass and yield of winter triticale in an intensively cropped hummocky landscape under temperate climate conditions. Precis. Agricult. 23 (3), 912–938. doi: 10.1007/s11119-021-09868-x
Hammer G., Kropff M., Sinclair T., Porter J. (2002). Future contributions of crop modelling—from heuristics and supporting decision making to understanding genetic regulation and aiding crop improvement. Eur. J. Agron. 18 (1-2), 15–31. doi: 10.1016/S1161-0301(02)00093-X
Han E., Ines A. V., Koo J. (2019). Development of a 10-km resolution global soil profile dataset for crop modeling applications. Environ. Model. Software 119, 70–83. doi: 10.1016/j.envsoft.2019.05.012
Hao S., Ryu D., Western A., Perry E., Bogena H., Franssen H. J. H. (2021). Performance of a wheat yield prediction model and factors influencing the performance: A review and meta-analysis. Agric. Syst. 194, 103278. doi: 10.1016/j.agsy.2021.103278
Hinton S., Harrison M., Pengilley G., Phelan D., Hardie M., Ojeda J., et al. (2018). “Water for profit,” in Final Project Report. Australia: Department of Primary Industries, Parks, Water and Environment.
Holzworth D., Huth N. (2009). “Reflection+ XML simplifies development of the APSIM Generic PLANT Model,” in 18th World IMACS congress and MODSIM09 international congress on modelling and simulation. Cairns, Australia: Modelling and Simulation Society of Australia and New Zealand and International Association for Mathematics and Computers in Simulation.
Holzworth D. P., Huth N. I., deVoil P. G., Zurcher E. J., Herrmann N. I., McLean G., et al. (2014). APSIM–evolution towards a new generation of agricultural systems simulation. Environ. Model. Software 62, 327–350. doi: 10.1016/j.envsoft.2014.07.009
Huth N., Bristow K., Verburg K. (2012). SWIM3: model use, calibration, and validation. Trans. ASABE 55 (4), 1303–1313. doi: 10.13031/2013.42243
Iversen G. R., Norpoth H., Norpoth H. P. (1987). Analysis of Variance: Sage. New York, United States: SAGE.
Jeffrey S. J., Carter J. O., Moodie K. B., Beswick A. R. (2001). Using spatial interpolation to construct a comprehensive archive of Australian climate data. Environ. Model. Softw. 16 (4), 309–330. doi: 10.1016/S1364-8152(01)00008-1
Jiang R., He W., Zhou W., Hou Y., Yang J., He P. (2019). Exploring management strategies to improve maize yield and nitrogen use efficiency in northeast China using the DNDC and DSSAT models. Comput. Electron. Agricult. 166, 104988. doi: 10.1016/j.compag.2019.104988
Jones C., Kiniry J. (1986). CERES-Maize: a simulation model of maize growth and development (United States: Texas A&M University Press).
Kamali B., Lorite I. J., Webber H. A., Rezaei E. E., Gabaldon-Leal C., Nendel C., et al. (2022). Uncertainty in climate change impact studies for irrigated maize cropping systems in southern Spain. Sci. Rep. 12 (1), 1–13. doi: 10.1038/s41598-022-08056-9
Kasampalis D. A., Alexandridis T. K., Deva C., Challinor A., Moshou D., Zalidis G. (2018). Contribution of remote sensing on crop models: a review. J. Imaging 4 (4), 52. doi: 10.3390/jimaging4040052
Keating B. A., Carberry P. S., Hammer G. L., Probert M. E., Robertson M. J., Holzworth D., et al. (2003). An overview of APSIM, a model designed for farming systems simulation. Eur. J. Agron. 18 (3-4), 267–288. doi: 10.1016/S1161-0301(02)00108-9
Kollas C., Kersebaum K. C., Nendel C., Manevski K., Müller C., Palosuo T., et al. (2015). Crop rotation modelling—A European model intercomparison. Eur. J. Agronomy 70, 98–111. doi: 10.1016/j.eja.2015.06.007
Kumar U., Morel J., Bergkvist G., Palosuo T., Gustavsson A.-M., Peake A., et al. (2021). Comparative analysis of phenology algorithms of the spring barley model in APSIM 7.9 and APSIM next generation: A case study for high latitudes. Plants 10 (3), 443. doi: 10.3390/plants10030443
Li T., Hasegawa T., Yin X., Zhu Y., Boote K., Adam M., et al. (2015). Uncertainties in predicting rice yield by current crop models under a wide range of climatic conditions. Global Change Biol. 21 (3), 1328–1341. doi: 10.1111/gcb.12758
Littleboy M., Silburn D., Freebairn D., Woodruff D., Hammer G., Leslie J. (1992). Impact of soil erosion on production in cropping systems. I. Development and validation of a simulation model. Soil Res. 30 (5), 757–774.
Liu J., Folberth C., Yang H., Röckström J., Abbaspour K., Zehnder A. J. (2013). A global and spatially explicit assessment of climate change impacts on crop production and consumptive water use. PloS One 8 (2), e57750. doi: 10.1371/journal.pone.0057750
Maharjan G. R., Hoffmann H., Webber H., Srivastava A. K., Weihermüller L., Villa A., et al. (2019). Effects of input data aggregation on simulated crop yields in temperate and Mediterranean climates. Eur. J. Agronomy 103, 32–46. doi: 10.1016/j.eja.2018.11.001
Maiorano A., Martre P., Asseng S., Ewert F., Müller C., Rötter R. P., et al. (2017). Crop model improvement reduces the uncertainty of the response to temperature of multi-model ensembles. Field Crops Res. 202, 5–20. doi: 10.1016/j.fcr.2016.05.001
Martre P., Wallach D., Asseng S., Ewert F., Jones J. W., Rötter R. P., et al. (2015). Multimodel ensembles of wheat growth: many models are better than one. Global Change Biol. 21 (2), 911–925. doi: 10.1111/gcb.12768
Moore A. D., Holzworth D. P., Herrmann N. I., Brown H. E., de Voil P. G., Snow V. O., et al. (2014). Modelling the manager: representing rule-based management in farming systems simulation models. Environ. Model. Software 62, 399–410. doi: 10.1016/j.envsoft.2014.09.001
Mubeen M., Ahmad A., Hammad H. M., Awais M., Farid H. U., Saleem M., et al. (2020). Evaluating the climate change impact on water use efficiency of cotton-wheat in semi-arid conditions using DSSAT model. J. Water Climate Change 11 (4), 1661–1675. doi: 10.2166/wcc.2019.179
Ojeda J. J., Huth N., Holzworth D., Raymundo R., Zyskowski R. F., Sinton S. M., et al. (2021a). Assessing errors during simulation configuration in crop models–A global case study using APSIM-Potato. Ecol. Modelling 458, 109703. doi: 10.1016/j.ecolmodel.2021.109703
Ojeda J. J., Rezaei E. E., Kamali B., McPhee J., Meinke H., Siebert S., et al. (2021b). Impact of crop management and environment on the spatio-temporal variance of potato yield at regional scale. Field Crops Res. 270, 108213. doi: 10.1016/j.fcr.2021.108213
Ojeda J. J., Rezaei E. E., Remenyi T. A., Webb M. A., Webber H. A., Kamali B., et al. (2020). Effects of soil-and climate data aggregation on simulated potato yield and irrigation water requirement. Sci. Total Environment 710, 135589. doi: 10.1016/j.scitotenv.2019.135589
Porwollik V., Müller C., Elliott J., Chryssanthacopoulos J., Iizumi T., Ray D. K., et al. (2017). Spatial and temporal uncertainty of crop yield aggregations. Eur. J. Agronomy 88, 10–21. doi: 10.1016/j.eja.2016.08.006
Probert M., Dimes J., Dalal R., Strong W. (1996). “APSIM, SOILWAT and SOILN: validation against observed data for a cracking clay soil,” in Proceedings of the 8th Australian agronomy conference. Toowoomba, Qld., Australia: Australian Society of Agronomy Inc.
Ramirez-Villegas J., Koehler A.-K., Challinor A. J. (2017). Assessing uncertainty and complexity in regional-scale crop model simulations. Eur. J. Agronomy 88, 84–95. doi: 10.1016/j.eja.2015.11.021
Ramirez-Villegas J., Molero Milan A., Alexandrov N., Asseng S., Challinor A. J., Crossa J., et al. (2020). CGIAR modeling approaches for resource-constrained scenarios: I. Accelerating crop breeding for a changing climate. Crop Sci. 60 (2), 547–567. doi: 10.1002/csc2.20048
Rauff K. O., Bello R. (2015). A review of crop growth simulation models as tools for agricultural meteorology. Agric. Sci. 6 (09), 1098. doi: 10.4236/as.2015.69105
Rettie F. M., Gayler S K. D., Weber T., Tesfaye K., Streck T. (2022). Climate change impact on wheat and maize growth in Ethiopia: A multi-model uncertainty analysis. PloS One 17 (1), e0262951. doi: 10.1371/journal.pone.0262951
Reynolds J. F., Acock B. (1985). Predicting the response of plants to increasing carbon dioxide: a critique of plant growth models. Ecol. Model. 29 (1-4), 107–129. doi: 10.1016/0304-3800(85)90049-3
Ridwan Saleh I. (2009). “Investigating planting environment and seed physiological age interaction on potato crop growth,” in Doctoral dissertation, University of Tasmania, Australia. (University of Tasmania).
Robertson M., Carberry P., Huth N., Turpin J., Probert M. E., Poulton P., et al. (2002). Simulation of growth and development of diverse legume species in APSIM. Aust. J. Agric. Res. 53 (4), 429–446. doi: 10.1071/AR01106
Rosenzweig C., Jones J. W., Hatfield J. L., Ruane A. C., Boote K. J., Thorburn P., et al. (2013). The agricultural model intercomparison and improvement project (AgMIP): protocols and pilot studies. Agric. For. Meteorol. 170, 166–182. doi: 10.1016/j.agrformet.2012.09.011
Rugira P., Ma J., Zheng L., Wu C., Liu E. (2021). Application of DSSAT CERES-maize to identify the optimum irrigation management and sowing dates on improving maize yield in Northern China. Agronomy 11 (04), 674. doi: 10.3390/agronomy11040674
Sándor R., Barcza Z., Acutis M., Doro L., Hidy D., Köchy M., et al. (2017). Multi-model simulation of soil temperature, soil water content and biomass in Euro-Mediterranean grasslands: Uncertainties and ensemble performance. Eur. J. Agronomy 88, 22–40. doi: 10.1016/j.eja.2016.06.006
Sándor R., Ehrhardt F., Grace P., Recous S., Smith P., Snow V., et al. (2023). Residual correlation and ensemble modelling to improve crop and grassland models. Environ. Model. Software 161, 105625. doi: 10.1016/j.envsoft.2023.105625
Sarkar S., Gaydon D. S., Brahmachari K., Poulton P. L., Chaki A. K., Ray K., et al. (2022). Testing APSIM in a complex saline coastal cropping environment. Environ. Model. Software 147, 105239. doi: 10.1016/j.envsoft.2021.105239
Sawyer S. F. (2009). Analysis of variance: the fundamental concepts. J. Manual Manipulative Ther. 17 (2), 27E–38E. doi: 10.1179/jmt.2009.17.2.27E
Schad P. (2016). “The international soil classification system WRB, 2014,” in Novel Methods for Monitoring and Managing Land and Water Resources in Siberia (Cham, Switzerland: Springer), 563–571.
Seidel S. J., Palosuo T., Thorburn P., Wallach D. (2018). Towards improved calibration of crop models–Where are we now and where should we go? Eur. J. Agron. 94, 25–35. doi: 10.1016/j.eja.2018.01.006
Snowling S., Kramer J. (2001). Evaluating modelling uncertainty for model selection. Ecol. Model. 138 (1-3), 17–30. doi: 10.1016/S0304-3800(00)00390-2
Tao F., Palosuo T., Rötter R. P., Díaz-Ambrona C. G. H., Mínguez M. I., Semenov M. A., et al. (2020). Why do crop models diverge substantially in climate impact projections? A comprehensive analysis based on eight barley crop models. Agric. For. Meteorol. 281, 107851. doi: 10.1016/j.agrformet.2019.107851
Tao F., Rötter R. P., Palosuo T., Gregorio Hernández Díaz-Ambrona C., Mínguez M. I., Semenov M. A., et al. (2018). Contribution of crop model structure, parameters and climate projections to uncertainty in climate change impact assessments. Global Change Biol. 24 (3), 1291–1307. doi: 10.1111/gcb.14019
Teixeira E. I., Zhao G., de Ruiter J., Brown H., Ausseil A.-G., Meenken E., et al. (2017). The interactions between genotype, management and environment in regional crop modelling. Eur. J. Agronomy 88, 106–115. doi: 10.1016/j.eja.2016.05.005
Vanuytrecht E., Thorburn P. J. (2017). Responses to atmospheric CO 2 concentrations in crop simulation models: a review of current simple and semicomplex representations and options for model development. Global Change Biol. 23 (5), 1806–1820. doi: 10.1111/gcb.13600
Vogeler I., Lilburne L., Webb T., Cichota R., Sharp J., Carrick S., et al. (2022). S-map parameters for APSIM. MethodsX 9, 101632. doi: 10.1016/j.mex.2022.101632
Waha K., Huth N., Carberry P., Wang E. (2015). How model and input uncertainty impact maize yield simulations in West Africa. Environ. Res. Lett. 10 (2), 024017. doi: 10.1088/1748-9326/10/2/024017
Wallach D., Nissanka S. P., Karunaratne A. S., Weerakoon W., Thorburn P. J., Boote K. J., et al. (2017). Accounting for both parameter and model structure uncertainty in crop model predictions of phenology: A case study on rice. Eur. J. Agronomy 88, 53–62. doi: 10.1016/j.eja.2016.05.013
Wallach D., Thorburn P. J. (2017). Estimating uncertainty in crop model predictions: Current situation and future prospects (Amsterdam, Netherlands: Elsevier), A1–A7.
Wallach D., Thorburn P., Asseng S., Challinor A. J., Ewert F., Jones J. W., et al. (2016). Estimating model prediction error: Should you treat predictions as fixed or random? Environ. Model. Softw. 84, 529–539. doi: 10.1016/j.envsoft.2016.07.010
Wang E., Brown H. E., Rebetzke G. J., Zhao Z., Zheng B., Chapman S. C. (2019). Improving process-based crop models to better capture genotype× environment× management interactions. J. Exp. Bot. 70 (9), 2389–2401. doi: 10.1093/jxb/erz092
Wang B., Liu D. L., Waters C., Yu Q. (2018). Quantifying sources of uncertainty in projected wheat yield changes under climate change in eastern Australia. Climatic Change 151 (2), 259–273. doi: 10.1007/s10584-018-2306-z
Wang E., Martre P., Zhao Z., Ewert F., Maiorano A., Rötter R. P., et al. (2017). The uncertainty of crop yield projections is reduced by improved temperature response functions. Nat. Plants 3 (8), 1–13. doi: 10.1038/nplants.2017.102
Wang E., Smith C. J., Bond W. J., Verburg K. (2004). Estimations of vapour pressure deficit and crop water demand in APSIM and their implications for prediction of crop yield, water use, and deep drainage. Aust. J. Agric. Res. 55 (12), 1227–1240. doi: 10.1071/AR03216
Warszawski L., Frieler K., Huber V., Piontek F., Serdeczny O., Schewe J. (2014). The inter-sectoral impact model intercomparison project (ISI–MIP): project framework. Proc. Natl. Acad. Sci. 111 (9), 3228–3232. doi: 10.1073/pnas.1312330110
Whisler F., Acock B., Baker D., Fye R., Hodges H., Lambert J., et al. (1986). Crop simulation models in agronomic systems. Adv. Agronomy 40, 141–208. doi: 10.1016/S0065-2113(08)60282-5
Wu A., Hammer G. L., Doherty A., von Caemmerer S., Farquhar G. D. (2019). Quantifying impacts of enhancing photosynthesis on crop yield. Nat. Plants 5 (4), 380–388. doi: 10.1038/s41477-019-0398-8
Wu R., Lawes R., Oliver Y., Fletcher A., Chen C. (2019). How well do we need to estimate plant-available water capacity to simulate water-limited yield potential? Agric. Water Manage. 212, 441–447. doi: 10.1016/j.agwat.2018.09.029
Yasin M., Ahmad A., Khaliq T., Habib-ur-Rahman M., Niaz S., Gaiser T., et al. (2022). Climate change impact uncertainty assessment and adaptations for sustainable maize production using multi-crop and climate models. Environ. Sci. pollut. Res. 29 (13), 18967–18988. doi: 10.1007/s11356-021-17050-z
Yin X., Leng G. (2022). Observational constraint of process crop models suggests higher risks for global maize yield under climate change. Environ. Res. Lett. 17 (7), 074023. doi: 10.1088/1748-9326/ac7ac7
Yin Y., Tang Q., Liu X. (2015). A multi-model analysis of change in potential yield of major crops in China under climate change. Earth System Dynamics 6 (1), 45–59. doi: 10.5194/esd-6-45-2015
Zhao C., Liu B., Xiao L., Hoogenboom G., Boote K. J., Kassie B. T., et al. (2019). A simple crop model. Eur. J. Agronomy 104, 97–106. doi: 10.1016/j.eja.2019.01.009
Keywords: crop model uncertainty, uncertainty decomposition, soil types, APSIM, potato
Citation: Chapagain R, Remenyi TA, Huth N, Mohammed CL and Ojeda JJ (2023) Investigating the effects of APSIM model configuration on model outputs across different environments. Front. Agron. 5:1213074. doi: 10.3389/fagro.2023.1213074
Received: 27 April 2023; Accepted: 13 July 2023;
Published: 31 July 2023.
Edited by:
Gianni Bellocchi, French National Institute for Agriculture, Food and Environment, FranceReviewed by:
Nándor Fodor, Centre for Agricultural Research, HungaryCopyright © 2023 Chapagain, Remenyi, Huth, Mohammed and Ojeda. This is an open-access article distributed under the terms of the Creative Commons Attribution License (CC BY). The use, distribution or reproduction in other forums is permitted, provided the original author(s) and the copyright owner(s) are credited and that the original publication in this journal is cited, in accordance with accepted academic practice. No use, distribution or reproduction is permitted which does not comply with these terms.
*Correspondence: Ranju Chapagain, UmFuanUuY2hhcGFnYWluQHV0YXMuZWR1LmF1
Disclaimer: All claims expressed in this article are solely those of the authors and do not necessarily represent those of their affiliated organizations, or those of the publisher, the editors and the reviewers. Any product that may be evaluated in this article or claim that may be made by its manufacturer is not guaranteed or endorsed by the publisher.
Research integrity at Frontiers
Learn more about the work of our research integrity team to safeguard the quality of each article we publish.