 Gengsheng Zhang
 Monique Y. Leclerc1
95% of researchers rate our articles as excellent or good
Learn more about the work of our research integrity team to safeguard the quality of each article we publish.
Find out more
ORIGINAL RESEARCH article
Front. Agron. , 15 June 2023
Sec. Climate-Smart Agronomy
Volume 5 - 2023 | https://doi.org/10.3389/fagro.2023.1204887
This article is part of the Research Topic New Generation Agronomy for Net-Zero Greenhouse Gas Emissions View all 5 articles
Peanut is planted in a pattern of either single or twin rows in Georgia, USA. However, limited attention has been paid to the impact of planting pattern on the carbon footprint and how the net carbon uptake is intertwined with the amount of water used to determine the ecosystem water-use efficiency (WUE) in peanut. This paper reports on the relationship between the amount of carbon produced to the amount of water used in peanut, carbon dioxide flux, and crop evapotranspiration of peanut in a single- or in a twin-row planting pattern measured using the eddy-covariance method. To the best of our knowledge, the present study is unique in that it examines for the first time the effect of planting pattern on the net carbon uptake and WUE. The two-year study took place in contrasting weather conditions with the 2016 year experiencing a higher vapor pressure deficit and lower precipitation than in the 2018 year. In this study, field-scale daytime net carbon ecosystem exchange (CO2 fluxes), ET and WUE of single- and twin-row peanut were compared using the eddy-covariance technique. Results showed that in 2018, both the net carbon uptake from the atmosphere and the WUE of twin-row peanut were significantly greater than those in the single-row peanut by 7-10% and ~9% respectively, for pod filling and seed maturity growth stages (aGDD 1000-2000 and aGDD > 2000). In 2016, the net daytime carbon uptake and WUE of peanut were similar for both planting patterns during pod filling (aGDD 1000-2000). Higher precipitation and lower VPD in 2018 likely resulted in greater peanut yield in twin-row as compared to single-row with abundant precipitation. Owing to the fast canopy growth rate in twin-row peanut, results suggest that during the vegetative stage (aGDD<500) in 2016, both daytime net carbon uptake from the atmosphere and WUE were considerably greater in twin-row than single-row by 32% and 27%, respectively. Given that in both years, the ET from both planting patterns was similar, it appears that the determination of WUE in both planting patterns was more impacted by changes in daytime net carbon uptake than evapotranspiration. The results of this study suggest the possibility that the higher WUE at the critical stages of twin-row peanut in 2018 are likely to lead to greater yield than single-row peanut. This should be confirmed with further year-to-year investigations.
The United States ranks fourth in the world in terms of peanut (Arachis hypogaea L.) production after China, India, and Nigeria (www.nationalpeanutboard.org). Peanut is commercially produced in thirteen states of the USA, with Georgia producing about 52% of total peanut production in the USA in 2020-2022 (USDA/NASS, 2023). In 2022, peanut was planted on 586, 916 ha across the USA and 277,210 ha in Georgia (USDA/NASS, 2023).
Depending on growers’ preference or equipment availability, peanut is planted in a pattern of either single or twin rows in Georgia. Several studies have reported yield advantages of twin-row over single-row peanut (Colvin et al., 1985; Baldwin et al., 2001; Brown et al., 2003; Lanier et al., 2004; Tillman et al., 2006; Tubbs et al., 2011). Twin-row peanut often expresses less incidence of tomato spotted wilt virus (Tospovirus) (TSWV) and southern stem rot (Sclerotium rolfsii) compared to single-row (Brown et al., 2003; Lanier et al., 2004; Tillman et al., 2006; Culbreath et al., 2008). Sorensen and Lamb (2009) and Sorensen et al. (2004) reported improved market grade of twin-row over single-row peanut but no such difference was reported by Jaaffar and Gardner (1988) and Tubbs et al. (2011). The benefits of twin-row peanut over single-row on yield, the reduction in TSWV, and the decrease in southern stem rot are also recognized in Peanut Rx, a best management practices guide for peanut production (Kemerait et al., 2018).
However, limited attention has been paid to the impact of planting pattern on the carbon footprint and how the net carbon uptake is intertwined with the amount of water used to determine the ecosystem water-use efficiency (WUE) in peanut. Considering the recent increase in frequency and severity of drought (IPCC, 2014), the impact of climate variability on crops (Solomon et al., 2007; Ortiz et al., 2008), and the increasing competition for water resources, quantifying the efficiency of the water use in peanut production is necessary. WUE reflects the ability of the crop to produce yield or biomass by using a unit amount of water and is conventionally calculated as the ratio of the yield or biomass to the consumed water. It can be in various scales from leaf to plant to canopy or ecosystem to global scales (Sinclair et al., 1984; Tu et al., 2008; Beer et al., 2009).
Traditionally, lysimeters and calculating water applied throughout the growing season have been used for the WUE research (Wright et al., 1988; Hatfield et al., 1990). However, Wright et al. (1993) pointed out that accurate measurements of WUE using lysimeters is difficult. Discrepancies may occur in the estimation of the exact amount of water from irrigation and precipitation. Another widely used method is the carbon isotope discrimination method (Farquhar et al., 1982; Hubick et al., 1986; Wright et al., 1994; Rowland et al., 2012). This method correlates the WUE with the isotopic discrimination of 13C during the photosynthetic pathway in peanut.
Water-use efficiency has also been estimated using the ratio of CO2 gained to water lost through evapotranspiration (ET) (Baldocchi, 1994). With the development of the eddy-covariance technique that was originally described by Wesely et al. (1970), the fluxes of CO2 and water vapor and thus WUE can be estimated at the ecosystem scale and continuously throughout the growing season (Law et al., 2002; Beer et al., 2009; Wang et al., 2018; Zhang et al., 2022). Ecosystem WUE can be estimated as the ratio of gross primary productivity (GPP) to evapotranspiration (ET) (Wang et al., 2018), gross ecosystem productivity (GEP) to ET (Law et al., 2002; Niu et al., 2011), or net carbon uptake to ET (Baldocchi, 1994; Scanlon and Albertson, 2004; Niu et al., 2011; Zhang et al., 2022).
In this paper, the latter definition of WUE is used. This approach confers the ability to identify WUE characteristics for different accumulated growing degree days (aGDD). The aGDD or thermal units is an efficient method to predict peanut maturity (Mills, 1964; Emery and Gupton, 1968; Rowland et al., 2006). The objectives of the study were to examine the differences in the CO2 flux, ET, and WUE of peanut measured between single- and twin-row planting patterns in different aGDD periods using the eddy-covariance method.
A two-year study (2016 and 2018) was conducted in irrigated fields of the Southwest Georgia Research and Education Center located in Plains, Georgia, USA (32° 2’ 48.912” N 84° 22’ 14.3178” W) (Figure 1). Soil was Greenville sandy loam (fine, kaolinitic, thermic Rhodic Kandiudults) (USDA/NRCS, 2019). Both single- and twin-row peanut were used as two treatments. In 2016, single- and twin-row peanut were planted in two adjacent fields in an area of 3.8 ha and 4.0 ha, respectively. In 2018, both single- and twin-row peanut were planted in two adjacent 4.0 ha fields. Different fields were used each year for crop rotation.
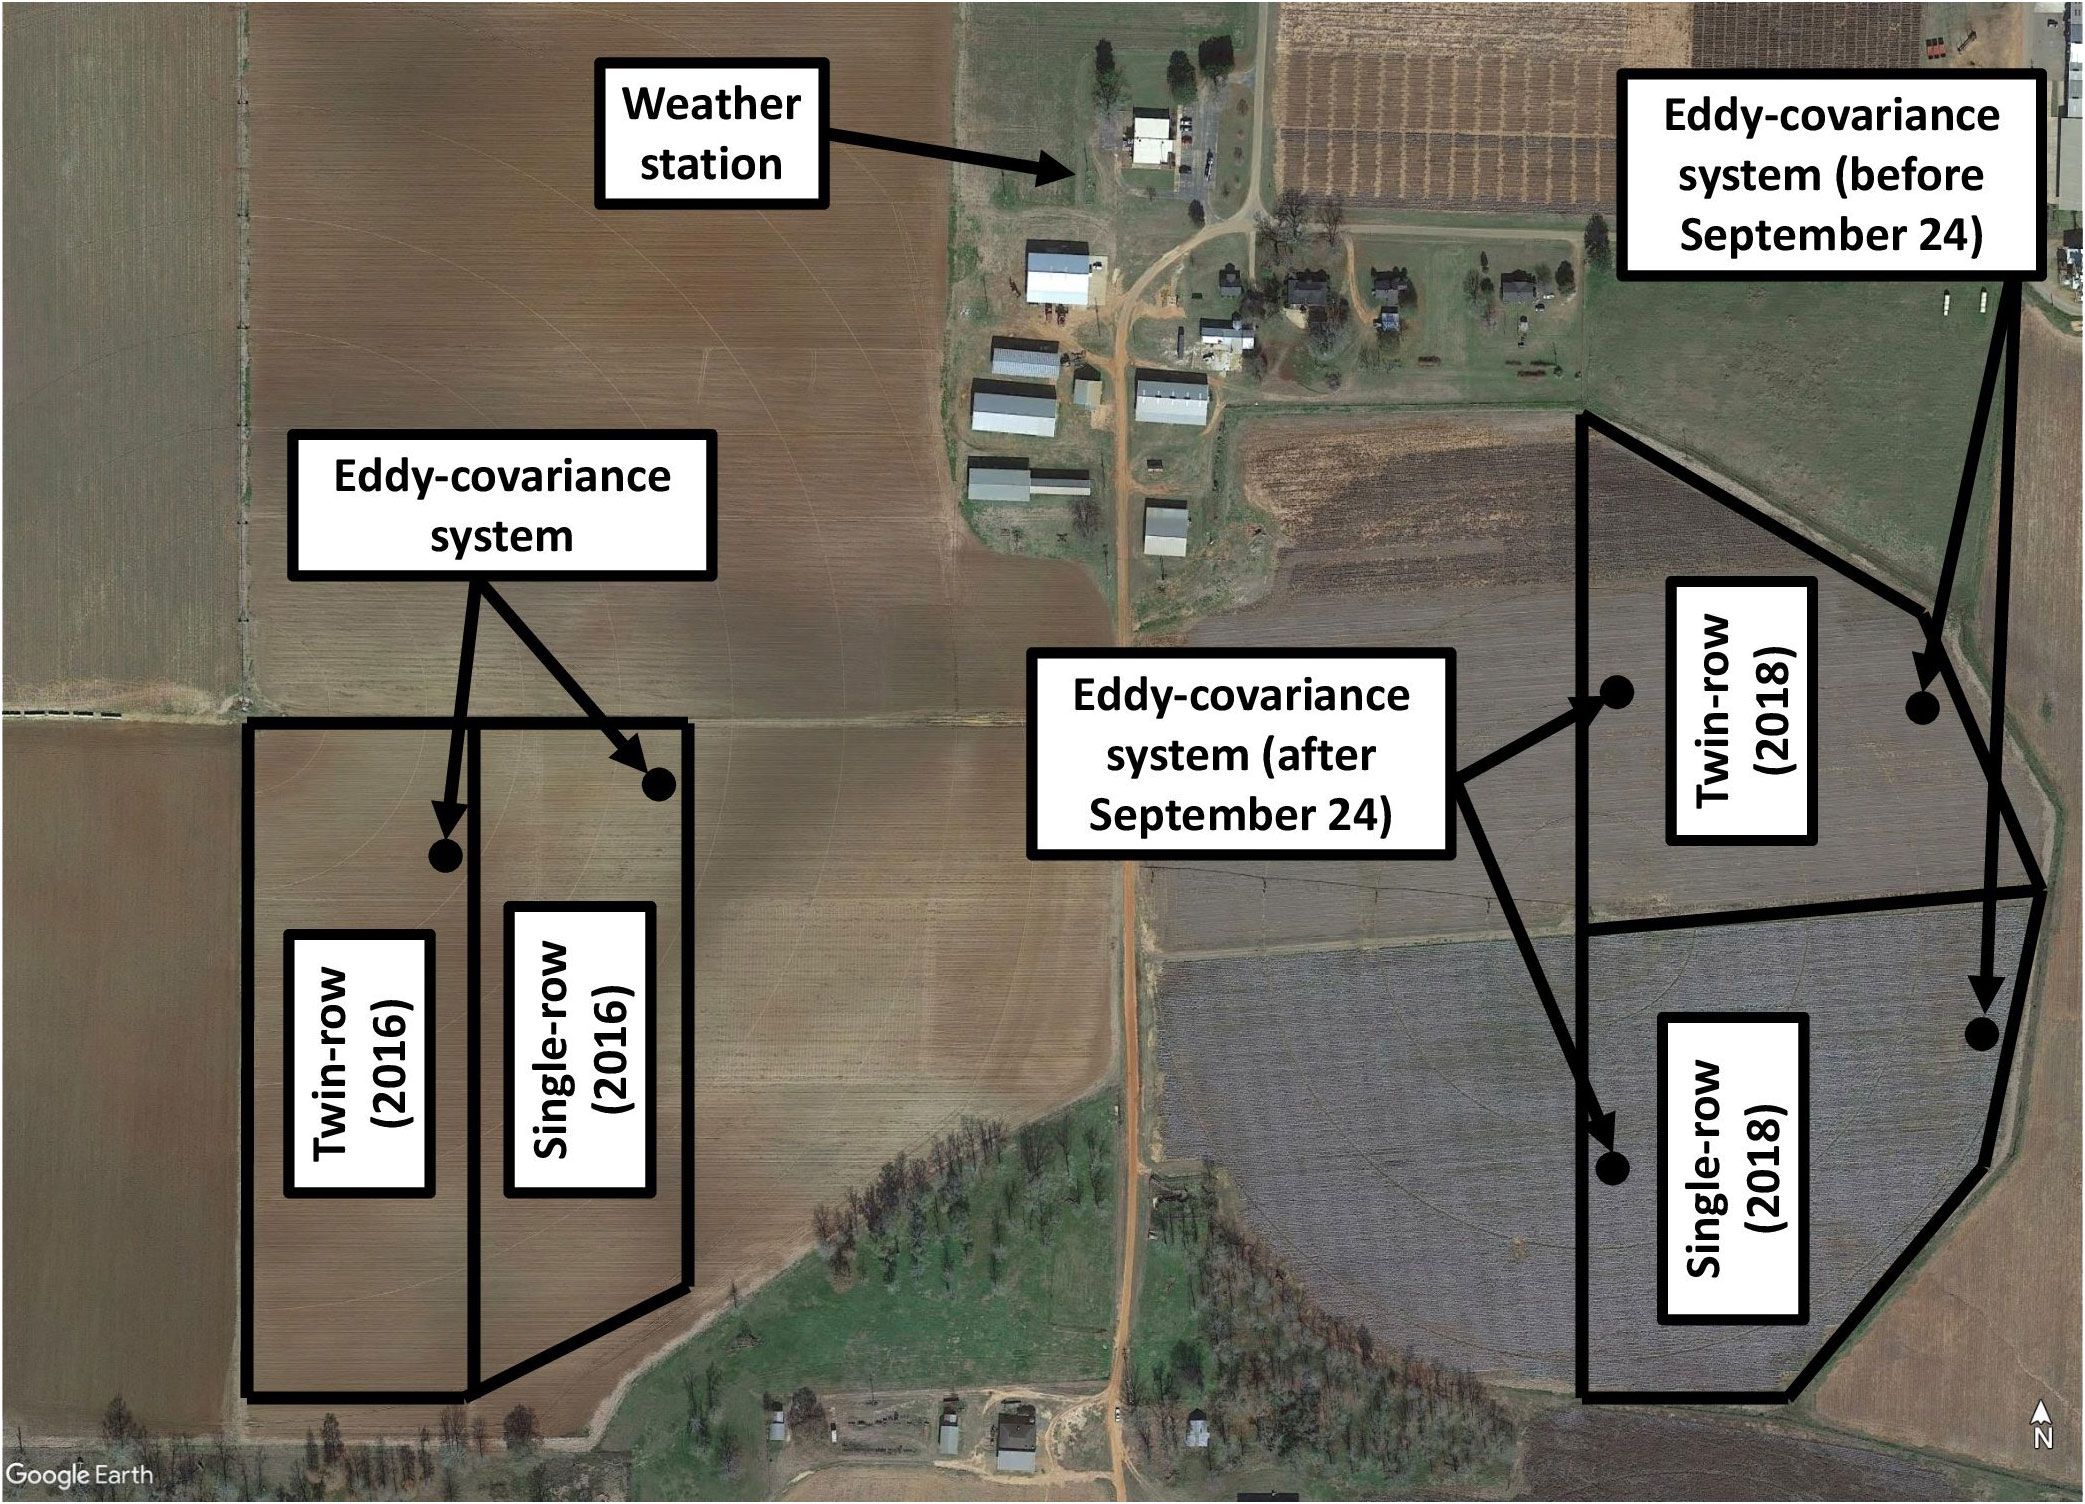
Figure 1 Research site at Plains, GA for 2016 and 2018.
The runner-type peanut cultivar Georgia-06G (Branch, 2007) was used for its high yield potential and resistance to TSWV. Peanut was planted in the single-row (91 cm inter-row spacing) and twin-row patterns (15 cm spacing between the twins and 91 cm between centers of rows) set to industry standard. The single-row was planted with 20 seeds m-1 and twin-row with 10 seeds m-1 per furrow, to maintain the same planting density for both planting patterns. Both single- and twin-row peanut were managed according to the University of Georgia Cooperative Extension service recommendations and applied the same irrigation scheduling (University of Georgia Cooperative Extension, 2022). In 2016, single- and twin-row peanut were planted on May 05, dug on September 15, and harvested on September 20. In 2018, peanut in both planting patterns were planted on May 14, dug on October 15, and harvested on October 22. The digging and harvesting were delayed because of unexpected heavy precipitation.
The eddy-covariance method was used to measure CO2 and water exchange between the peanut canopy and the atmosphere, i.e., CO2 flux (Fc) and evapotranspiration (ET), respectively. One eddy-covariance system was installed in each single- or twin-row peanut field. Each system consisted of an omnidirectional sonic anemometer (CSAT3, Campbell Scientific, Logan, UT, USA) and a fast response open-path CO2/H2O gas analyzer (LI-7500, LI-COR Inc., Lincoln, NE, USA) mounted at 1.5 m from the ground on a tripod (Figure 2). The CSAT3 anemometer was installed towards the prevailing wind direction. Both height and location of the eddy-covariance systems were chosen to measure fluxes from within the footprint of the flux tower.
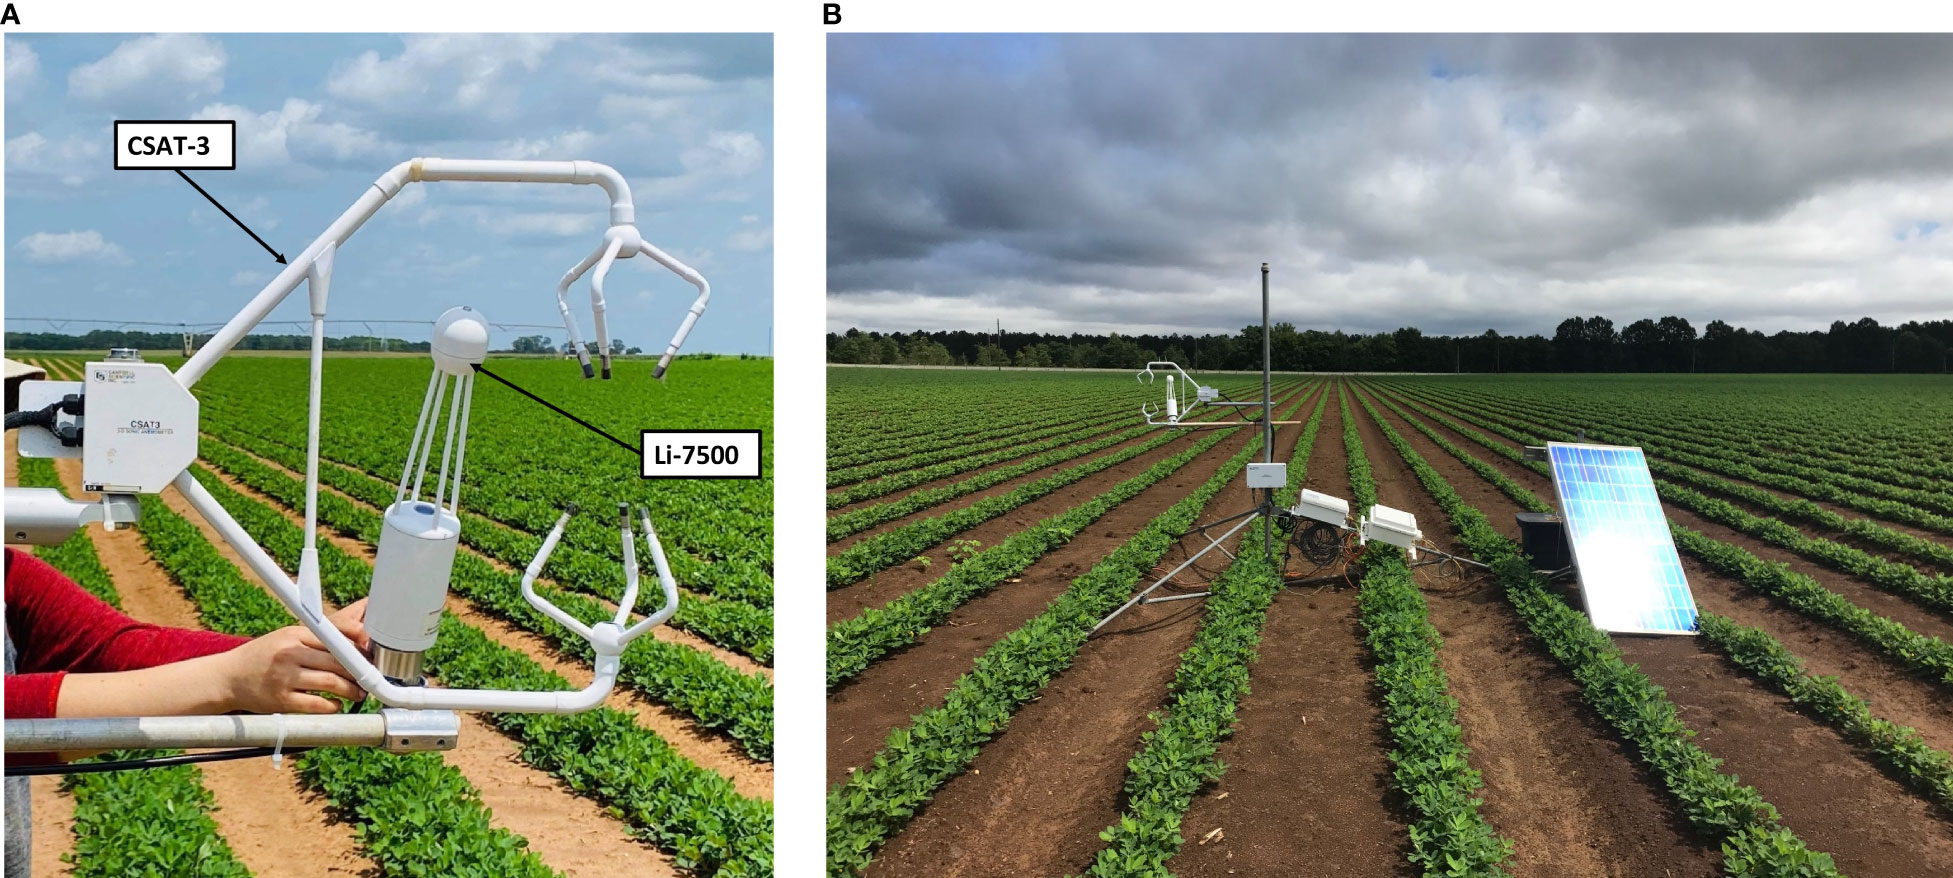
Figure 2 (A) Eddy-covariance system consisting of the omnidirectional sonic anemometer (CSAT-3) and the fast-response open-path CO2/H2O gas analyzer (LI-7500) and (B) the eddycovariance system installed in a single-row peanut field.
The LI-7500 was calibrated following the manufacturer instructions using CO2 and H2O free gas (for zero calibration), 500 ppm CO2 gas ( ± 1% uncertainty), and a Li-610 dew-point generator (LI-7500, LI-COR Inc., Lincoln, NE, USA). 10 Hz data from the eddy-covariance system was logged to a memory card in a datalogger (CR1000, Campbell Scientific, Logan, UT, USA). Each system was powered by two 12 V DC deep cycle batteries which were charged by a 120 W solar panel. The eddy-covariance data was processed using EddyPro (2019) and MATLAB R2018b (Mathworks, Inc.)
Weather data were collected from a weather station located 450 m and 350 m away from the experiment site during 2016 and 2018, respectively near the research site (Figure 1). The weather station was installed and maintained by the University of Georgia Climate Network Solar radiation was measured with a pyranometer (CS301, Apogee Instruments, Logan, Utah, USA), air temperature and relative humidity with a humidity and temperature transmitter (HMP60, Vaisala, Vantaa, Finland), wind speed and direction with a wind sensor (034B, Met One, Grants Pass, Oregon, USA), and precipitation was measured with a data-logging rain gauge (TB4, HyQuest Solutions, Liverpool NSW, Australia). The vapor pressure deficit was calculated as the difference between the vapor pressure in the air and the saturated vapor pressure with the air temperature at that time. The prevailing wind direction during the study was predominantly easterly during spring and fall and westerly during summer.
Peanut leaf area index (LAI) was measured weekly with a plant canopy analyzer (LI-2000, LI-COR Inc., Lincoln, NE, USA). In each field, LAI was measured at ten locations spaced at an interval of 0.5 m. At each location, one reading above the peanut canopy and four readings at positions located equally between two rows beneath the canopy on the ground were taken to determine the LAI. In the meantime, the peanut plant height and width were also measured.
Peanut was dug with a KMC inverter (Kelley Manufacturing Co., Tifton, GA, USA) at the harvest maturity according to the peanut maturity profile (Williams and Drexler, 1981) and left in the field for seven days to dry before harvesting. The harvesting of peanut in 2018 was delayed due to heavy precipitation after the crop was dug. Six representative locations in each field were randomly selected for the yield measurements. Each location was 12.2 m long and 1.8 m wide and peanut were harvested with a KMC two row peanut picker (Kelley Manufacturing Co., Tifton, GA, USA). Pod yield was adjusted to 7% moisture.
The eddy-covariance data was processed and CO2 flux and evapotranspiration were calculated using EddyPro (2019) and MATLAB R2018b (Mathworks, Inc). Low-quality data points, i.e. those characterized by abnormal “automatic gain controls (AGC)” values from the gas analyzers, were removed. These points originate due to rainwater or dew or dust on the sensor’s optical paths. Any 30-min period with more than 10% missing data was discarded. Spikes in time series of data were detected and removed according to Vickers and Mahrt (1997). The planar-fit method (Wilczak et al., 2001) was applied to the sonic anemometer data to correct tilt errors. Linear trend in time series of data was also detected and removed. Density fluctuation corrections due to heat and water vapor transfer were made following the Webb-Pearman-Leuning (WPL) method (Webb et al., 1980). A footprint analysis, using the method by Kormann and Meixner (2001), was performed in each field to make sure that the fluxes originated from the desired area of the field.
Due to the limited fetch of the field, the eddy-covariance system was installed at the edge of each field in the prevailing wind direction. The fetch was calculated by measuring the distance from the eddy-covariance system to the edge of the field at 10°C intervals using the Google Earth Pro (2019) (see Figure 3 as an example). During 2018, the eddy-covariance systems in both fields were relocated on September 24 to reflect the change in the seasonal prevailing wind.
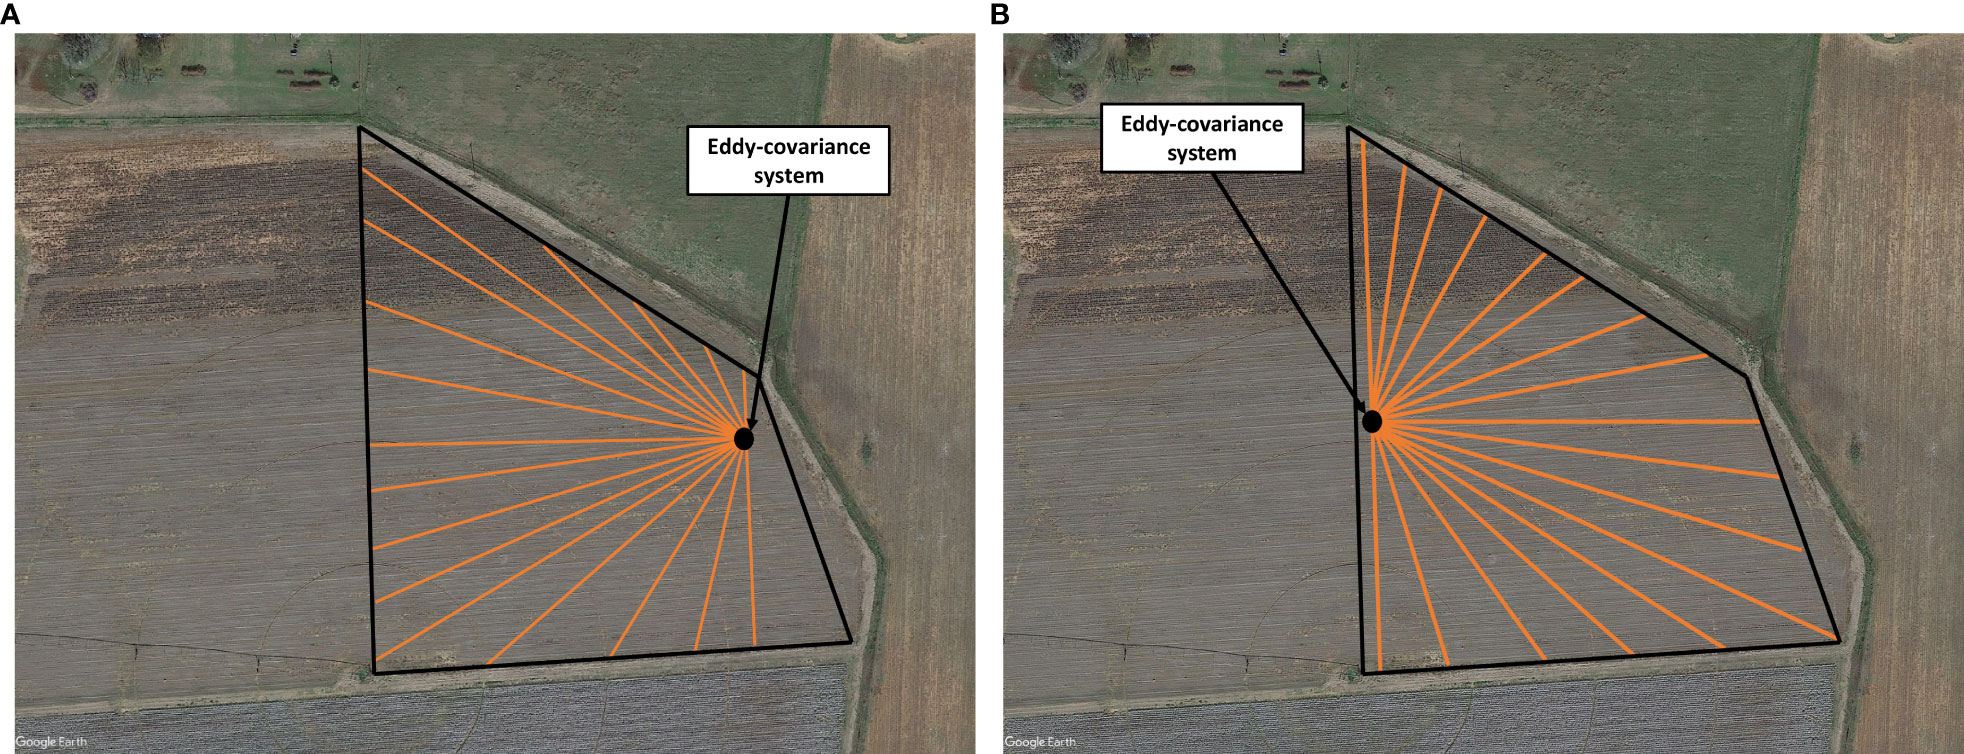
Figure 3 The fetch determined as a function of wind direction in an interval of 10° over the single-row field in 2018 (A) before system relocation and (B) following system relocation on September 24.
The footprint is defined as the spatial extent of the source area of fluxes measured at the eddy-covariance system location (Leclerc and Thurtell, 1990; Leclerc and Foken, 2014). In this study, the analytical solution of the footprint calculations of Kormann and Meixner (2001) was used to ensure that the measured CO2 flux and evapotranspiration reflect the peanut field of interest. In this model, the contributing distances towards the fluxes are calculated using the equation:
where is the flux contribution from the area between the anemometer and the point source at , is the distance in the upwind direction from the sonic anemometer, is the flux length scale that depends on the height above the ground z, zero plan displacement height d and canopy roughness height z0 of the peanut canopy where and , where hc is peanut canopy that varied in the range of 0 - 55 cm in the experiments of this study. μ is a dimensionless model constant, and Γ(μ) is the gamma function. This procedure was performed using the EddyPro software. The fluxes with equal to or more than 90% was selected for further processing. If the footprint was larger than the fetch, the flux was partly sourced outside the field of interest and was filtered out.
The daytime WUE of the peanut ecosystem was calculated as the ratio of net carbon uptake (or CO2 fluxes) to evapotranspiration (Baldocchi, 1994; Scanlon and Albertson, 2004; Niu et al., 2011; Anapalli et al., 2019; Zhang et al., 2022), i.e.
The data was partitioned into four periods based on Accumulated Growing-Degree Days (aGDD) to account for the variation in the CO2 flux, ET, and WUE with crop growth (Table 1). The day after planting (DAP) and the growth stages corresponding to these four periods are also listed in Table 1. The Mill’s Growing-Degree Day (GDD) method (Mills, 1964) was taken in the study, as it showed the best relationship with peanut maturity (Rowland et al., 2006). GDD was calculated as:
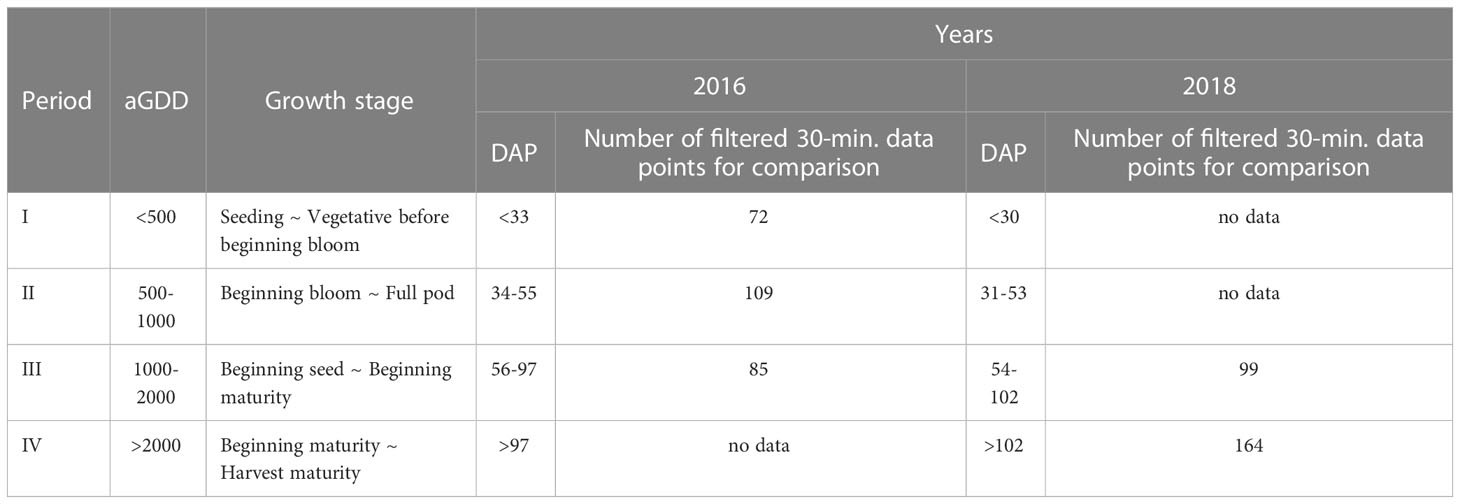
Table 1 The partition of mean 30-min filtered data according to accumulated growing degree days (aGDD) and days after planting (DAP) and corresponding peanut growth stages (Boote et al., 1982).
where = maximum daily air temperature, = maximum daily air temperature limited to the threshold of 35 °C, = minimum daily air temperature, and . aGDD is a cumulative sum of the GDDs from planting date to the interested date. The student’s t-test (p< 0.1) was performed to compare single and twin-row peanut for CO2 flux, ET, WUE, and yield using the JMP software (JMP, 2018).
Figure 4 presents the averages and their standard errors of (a) daily total solar radiation, (b) daily mean air temperature, and (c) daily mean vapor pressure deficit, and (d) total rainfall in different ranges of accumulated growing-degree days in 2016 and 2018, respectively. The year of 2018 had more rainfall and smaller vapor pressure deficit, and thus less solar radiation due to more cloudiness, and lower air temperature in all the aGDD ranges of<500, 500-1000, 1000-2000, and >2000 that the year of 2016. The largest difference occurred in the early growing season of peanut with aGDD< 500.
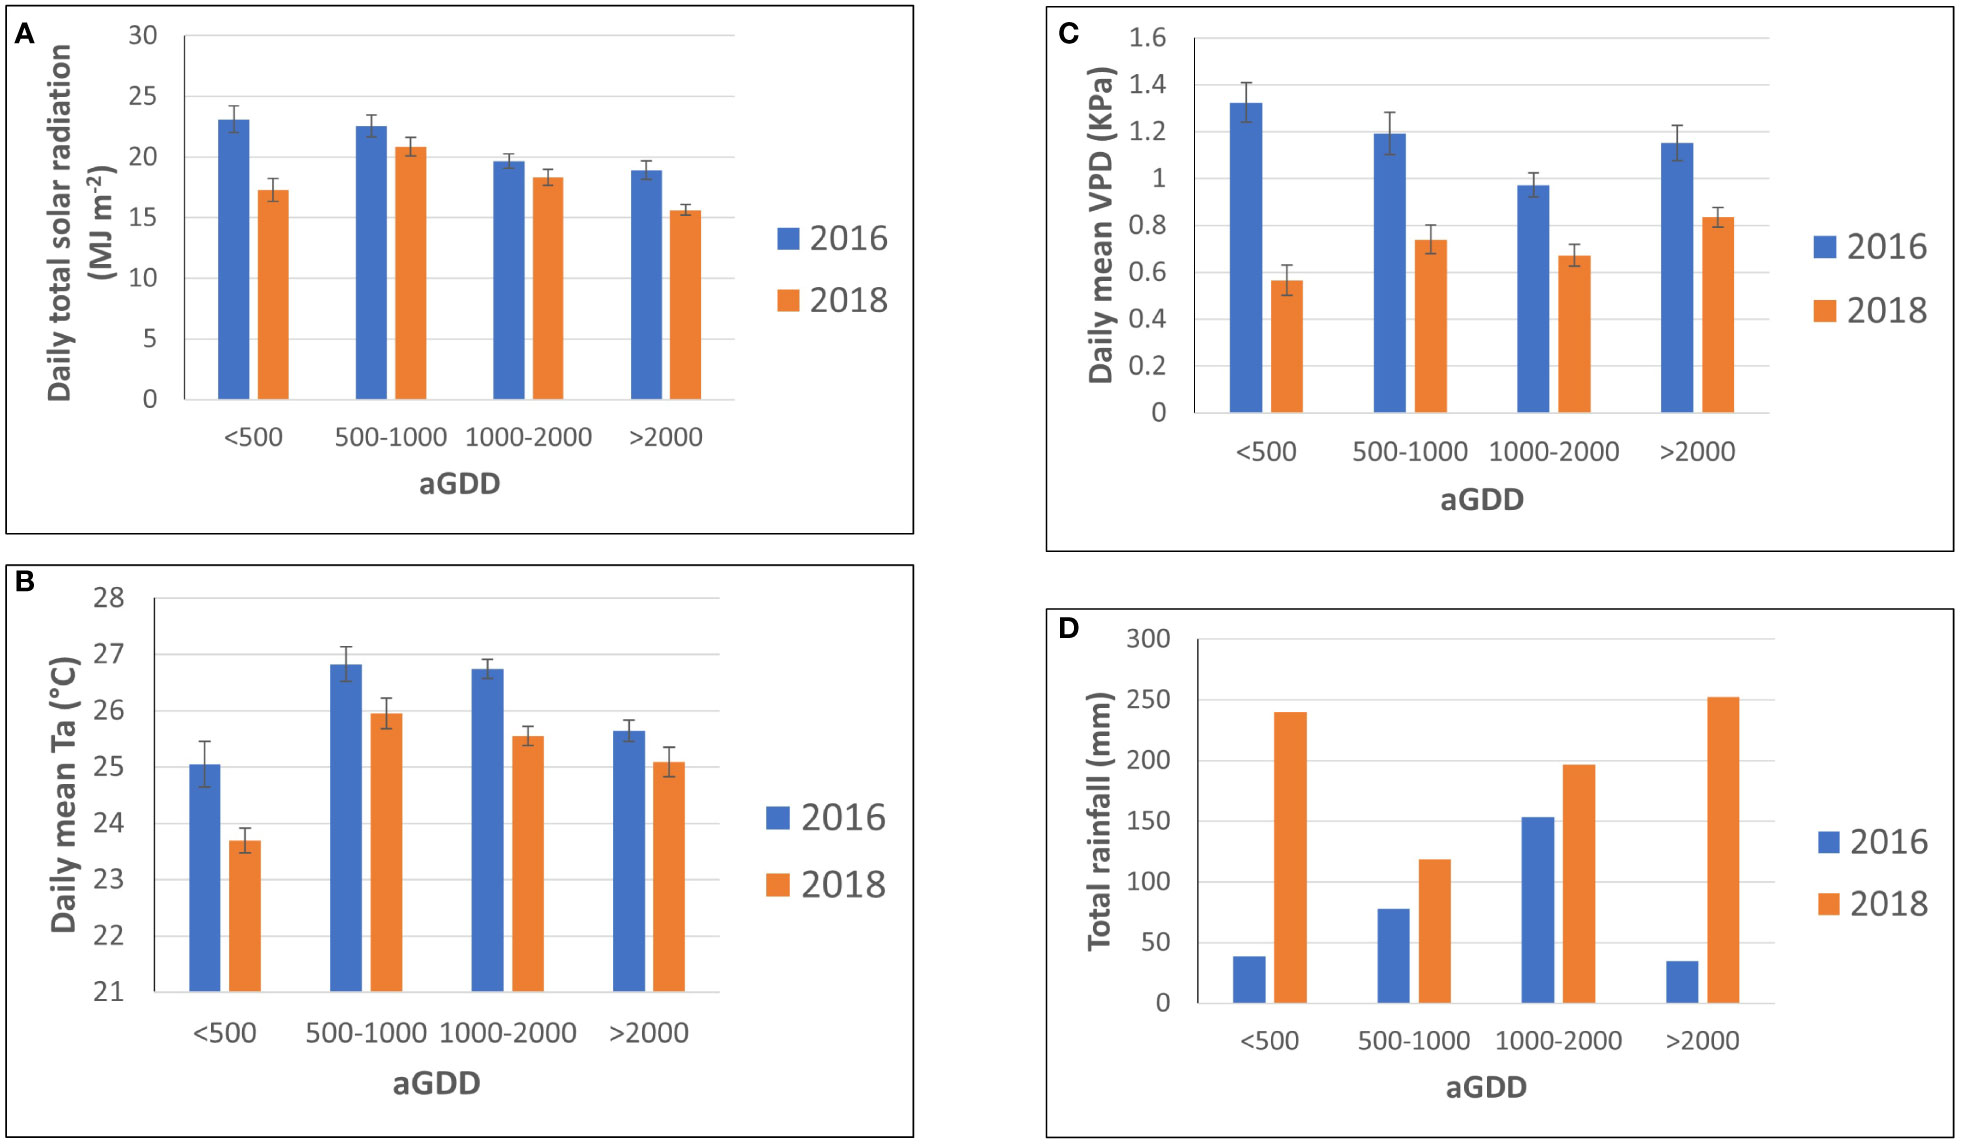
Figure 4 Comparison of the average and its standard error of (A) daily total solar radiation, (B) daily mean air temperature, and (C) daily mean vapor pressure deficit, and (D) total rainfall in different ranges of accumulated growing degree days (aGDD) between 2016 and 2018.
The year 2018 with a total rainfall of 808 mm was considerably wetter than the year 2016 with a total rainfall of 315mm. Although peanut was irrigated in an amount of 168 mm in 2016 and 134 mm in 2018, respectively, the total water supply in 2018 was approximately twice that of 2016 (Figure 5). The irrigation serves as a supplement to precipitation but cannot meet the entire crop demand. Moreover, the impact of lower precipitation can be seen on the VPD in 2016. The daily average VPD in 2016 was greater than 2018 (Figure 6), reaching a maximum of 2 kPa, during the vegetative, pod filling, and beginning maturity stages. Its influence on photosynthesis, water-use efficiency and yield will be discussed in the following sections.
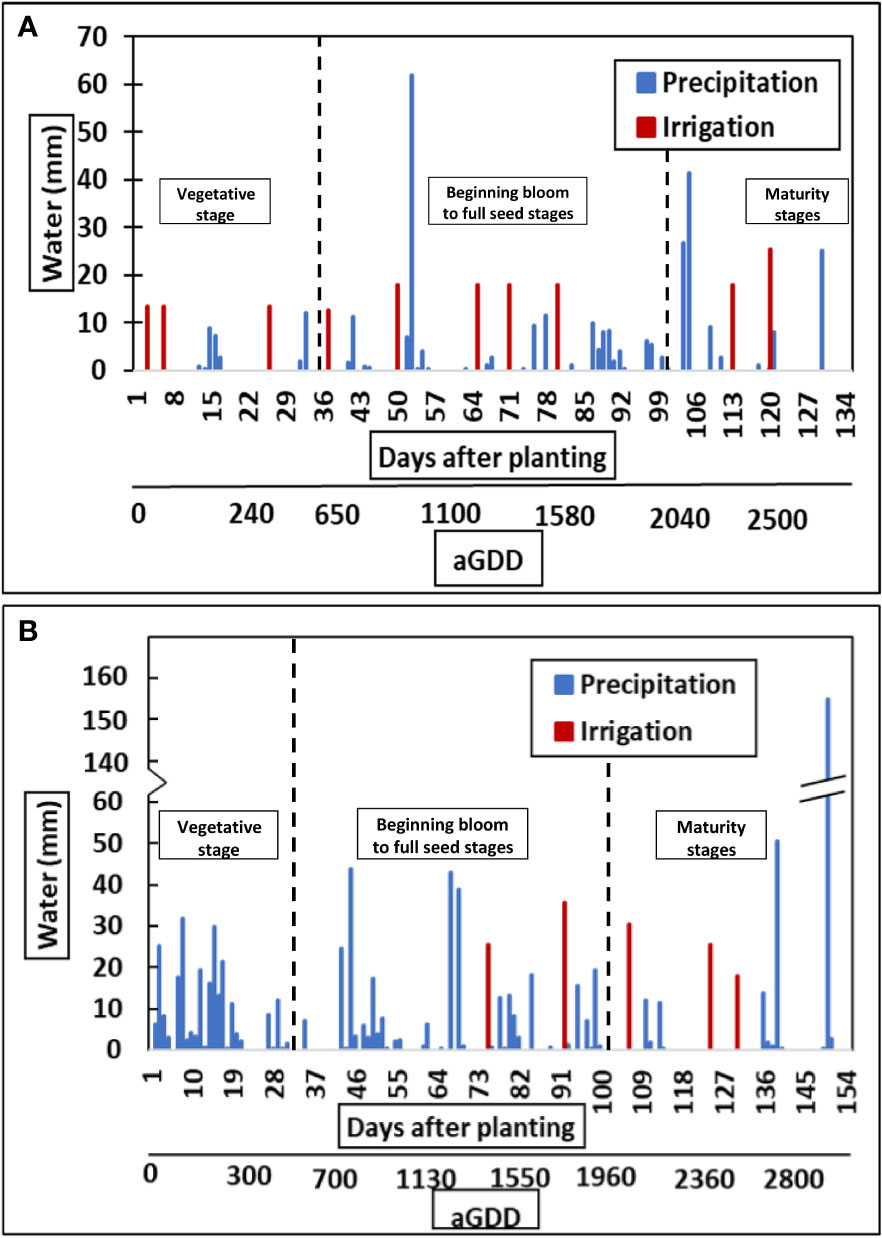
Figure 5 Total amount of water applied at the research site through precipitation and irrigation for (A) 2016 and (B) 2018.
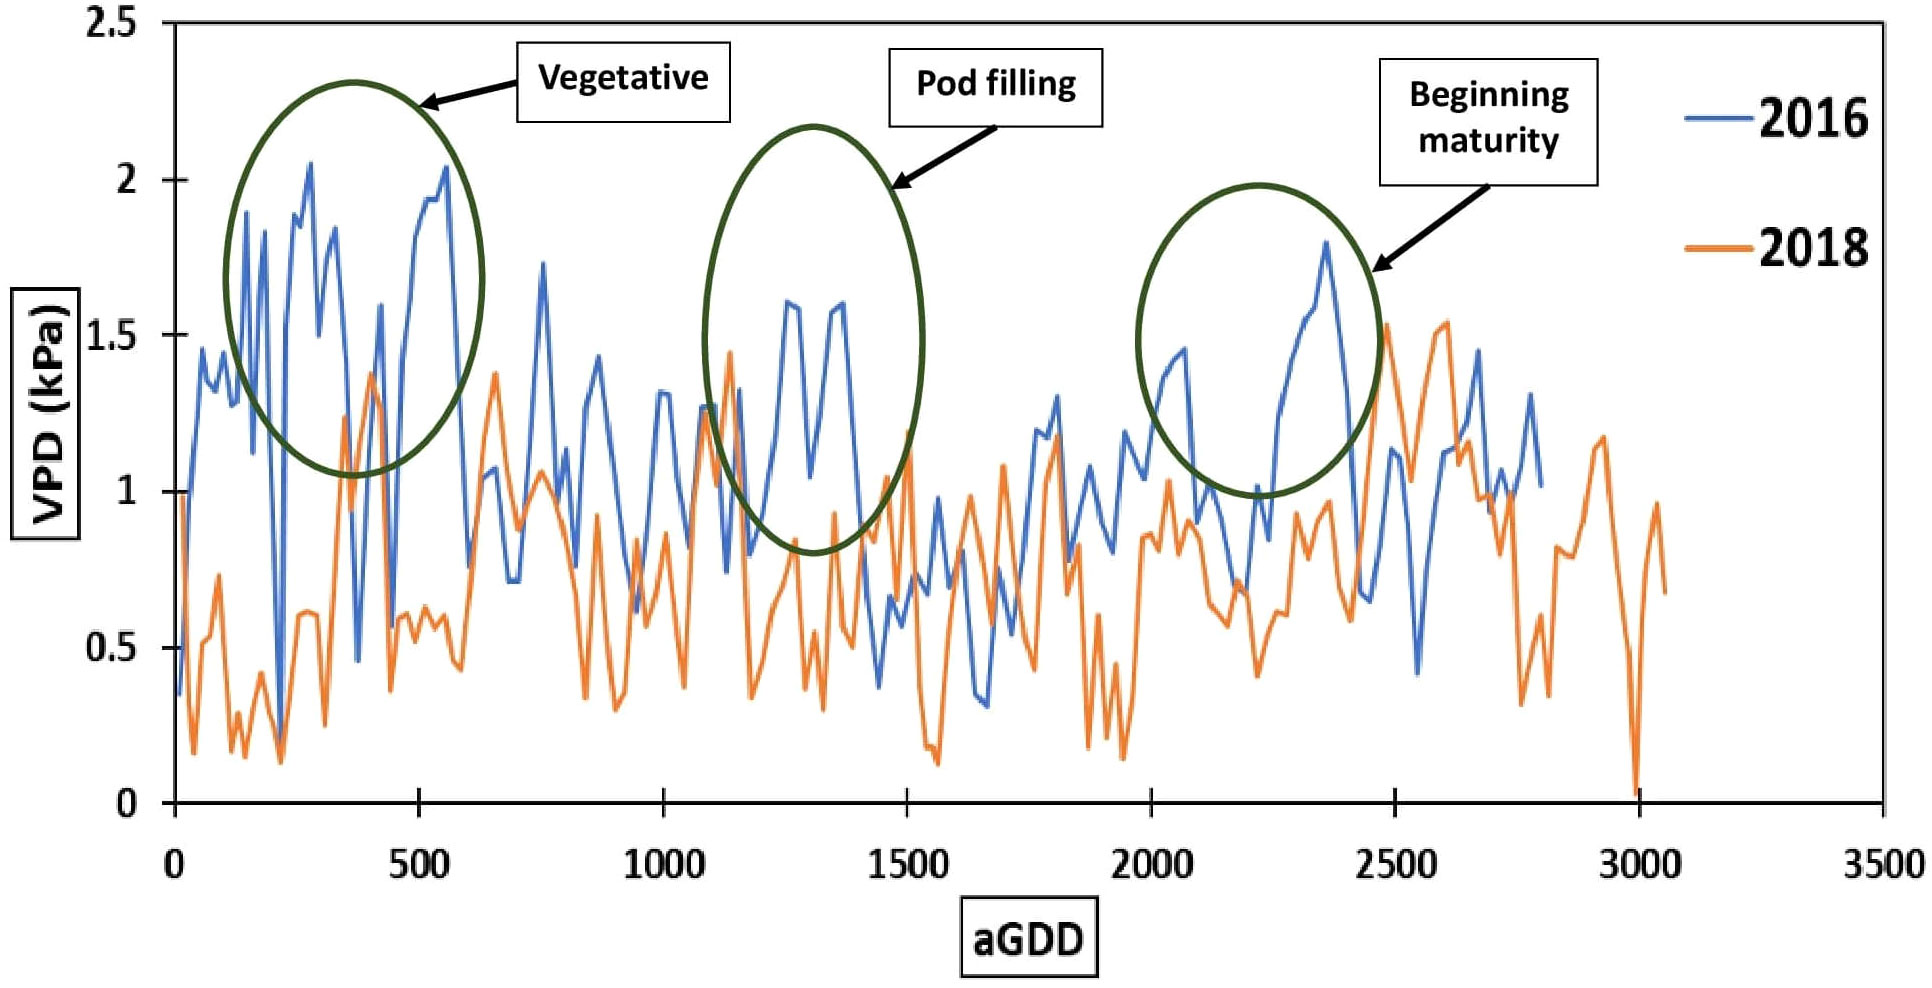
Figure 6 Daily average vapor pressure deficit (VPD) for different accumulated growing-degree days (aGDD).
The impact of different planting patterns on the daytime CO2 flux in both years is presented in Figures 7, 8. The CO2 flux between the peanut canopy and the atmosphere is the result of three main processes: canopy photosynthesis, autotrophic respiration by plants and heterotrophic respiration by soil organisms. The CO2 flux represents the net carbon uptake from the atmosphere by the peanut ecosystem, with negative values indicating that CO2 is transported downward from the atmosphere and absorbed by peanut plants. As peanut plants grow, CO2 flux magnitude increases and reaches a maximum during the mid-season with aGDD 1000-2000 (Figure 8).
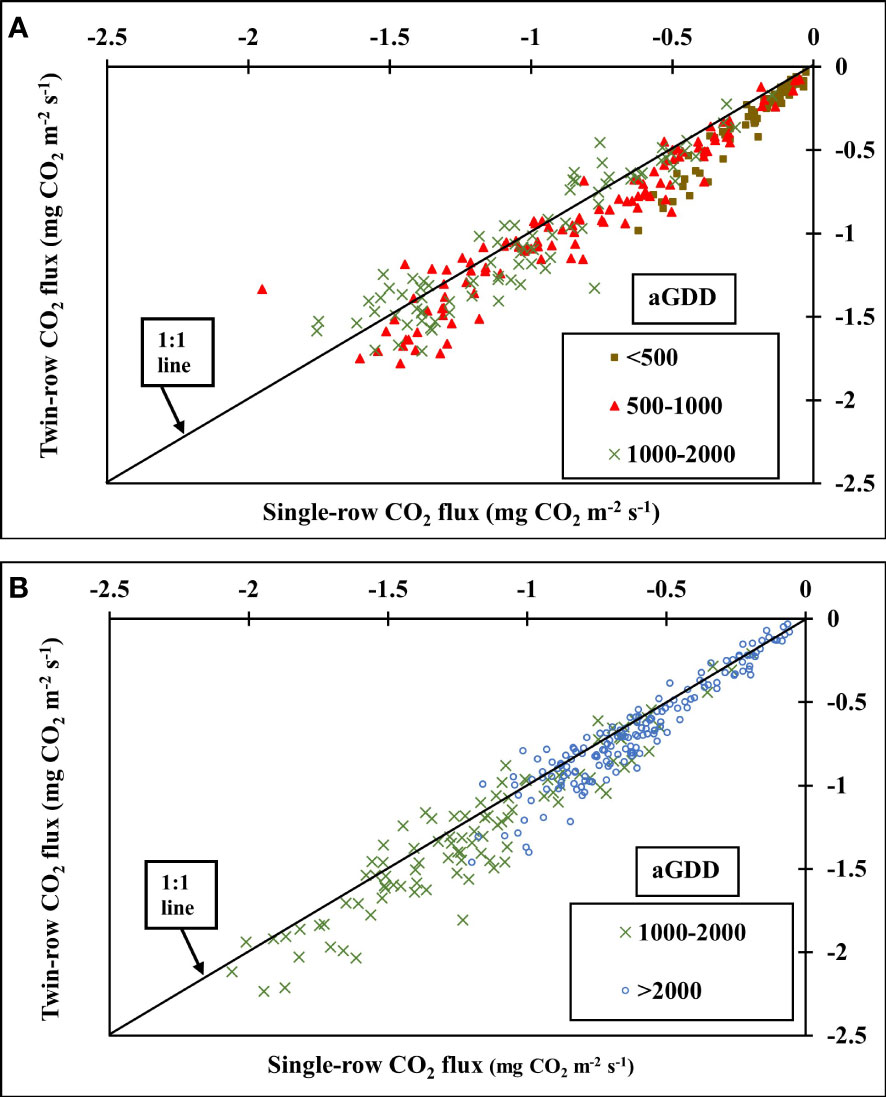
Figure 7 Comparison of 30-minute averaged CO2 flux (mg CO2 m-2 s-1) of single- and twin-row planting patterns for different accumulated growing degree days (aGDD) in (A) 2016 and (B) 2018.
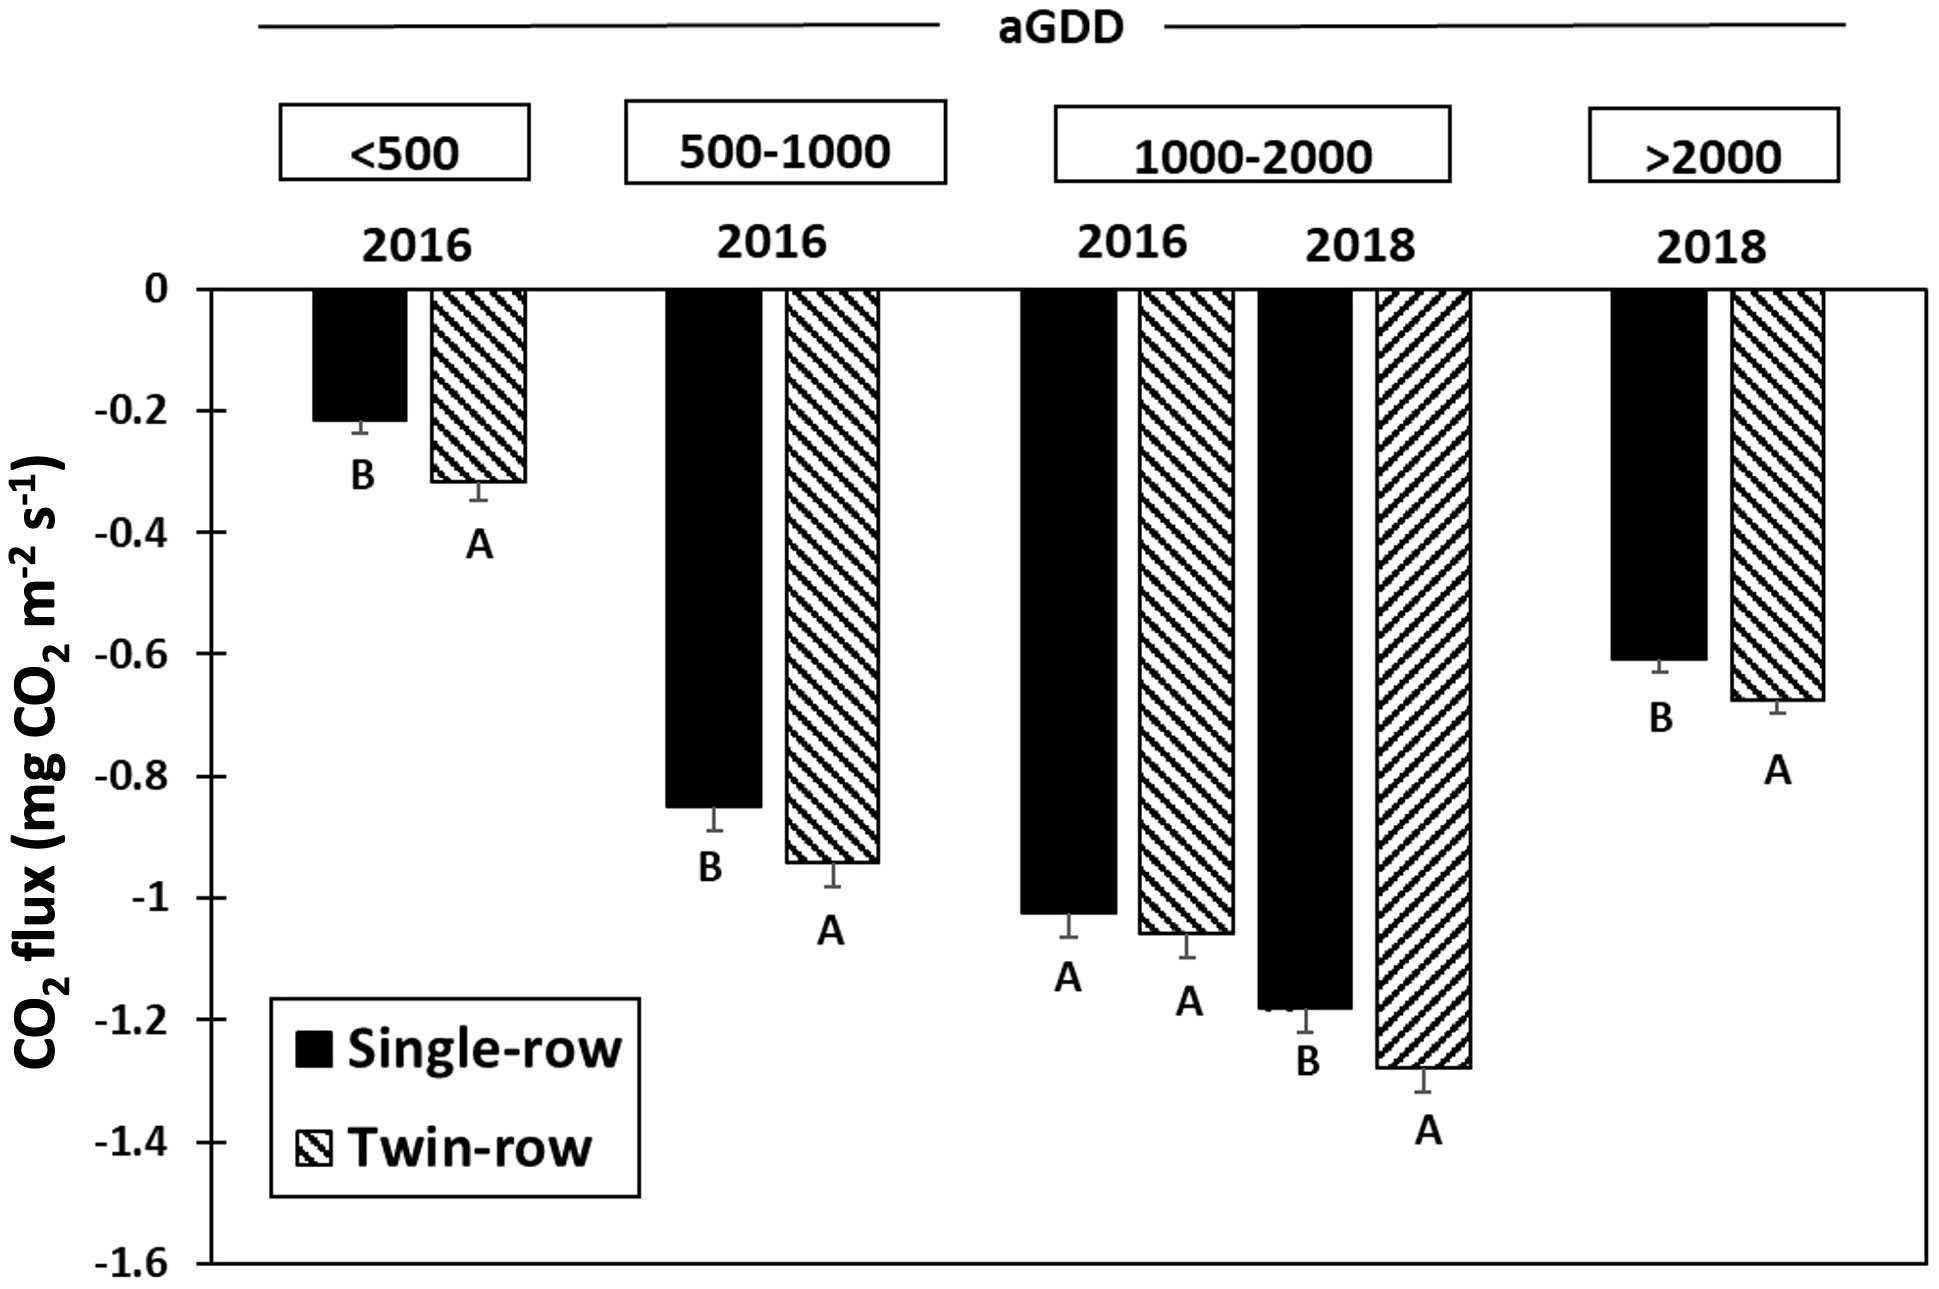
Figure 8 Mean and standard errors of 30-min average CO2 flux (mg CO2 m-2 s-1) of single- and twin-row planting patterns for different accumulated growing-degree days (aGDD). For every aGDD category in each year, letters A, B mean a significant difference at the α=0.1.
In 2016, CO2 flux of twin-row peanut was significantly greater than single-row during the vegetative stage (aGDD<500) by 31.8% and aGDD 500-1000 by 10%. During the aGDD 1000-2000 in 2016, despite the faster crop growth rate of twin-row peanut, CO2 fluxes of single- and twin-row peanut was comparable. During 2018, however, CO2 fluxes of twin-row peanut were greater than single-row peanut for aGDD 1000-2000 by 7.7% and aGDD >2000 by 10% (Figure 7B).
The comparison in evapotranspiration between single- and twin-row planting patterns for different aGDDs each year is depicted in Figure 9. Peanut canopy ET varied with aGDDs, from an average of about 0.07 g H2O m-2 s-1 with aGDDs< 500, increasing to around 0.13-0.14 g H2O m-2 s-1 with 500< aGDDs< 2000, and dropping to about 1.0 g H2O m-2 s-1 with aGDDs > 2000. However, there is no significant difference between single- and twin-row planting patterns for different aGDDs in both years.
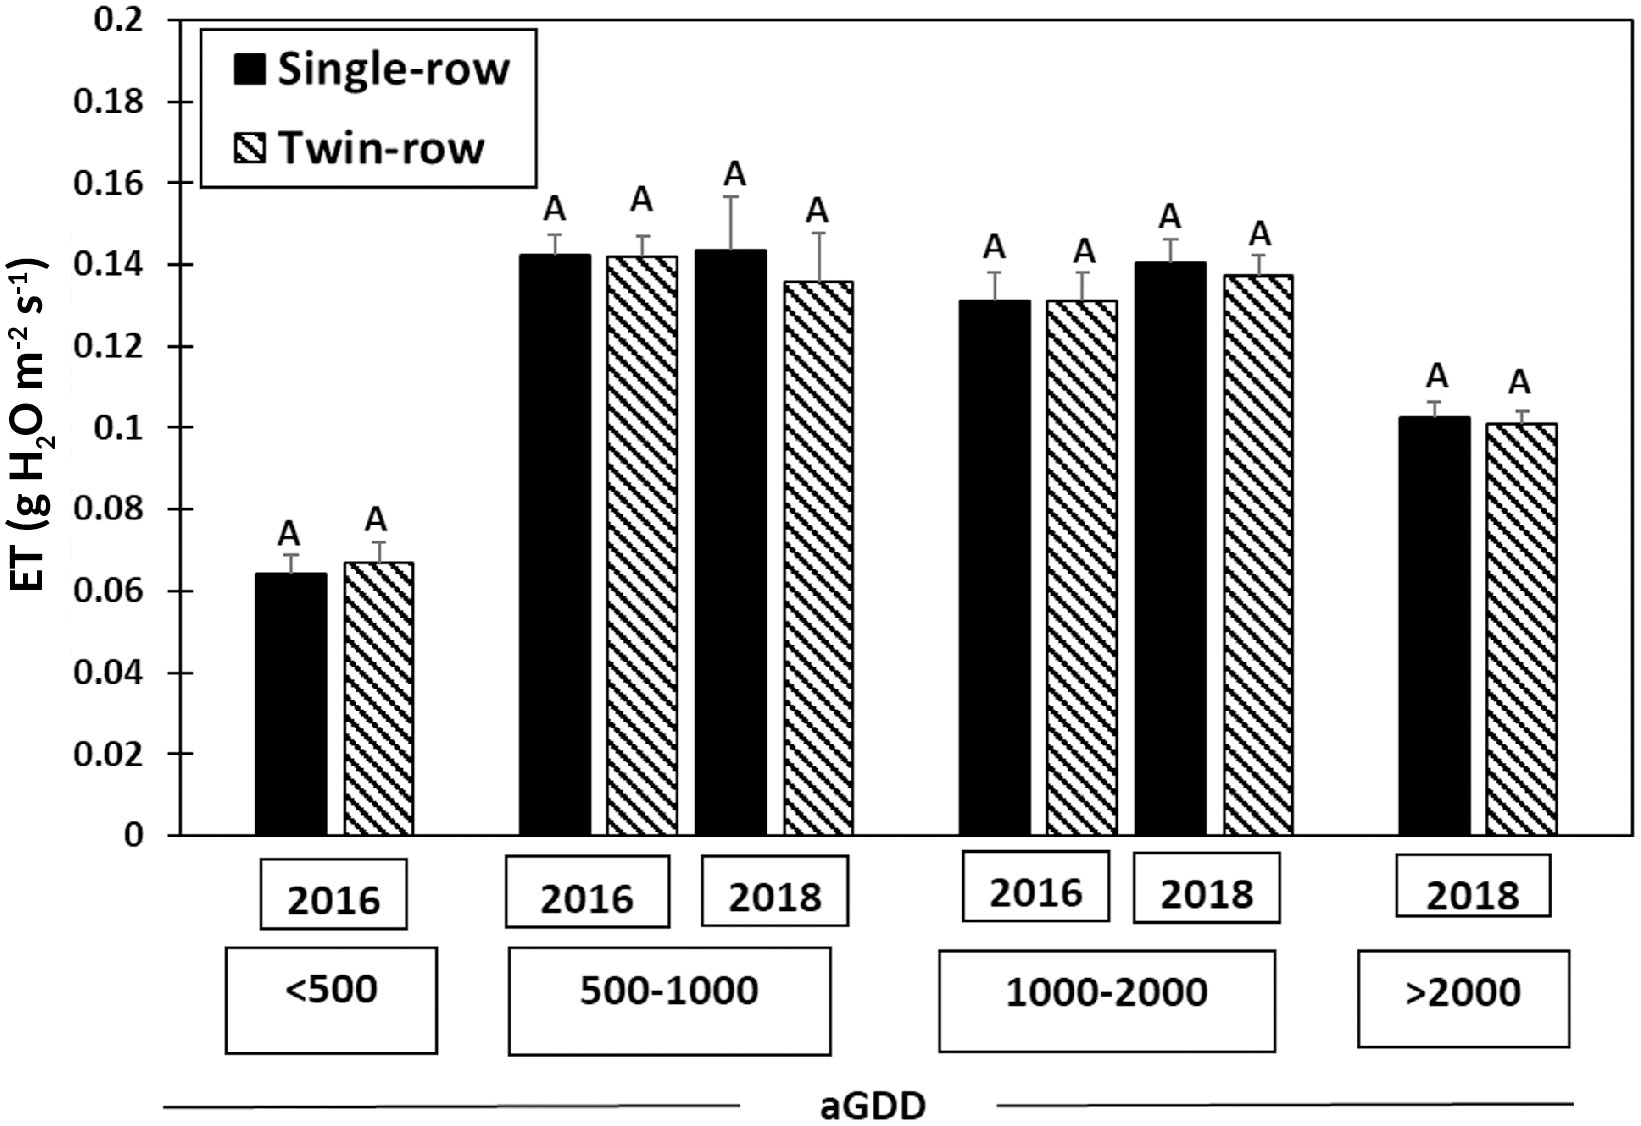
Figure 9 Mean and standard error of 30-min averaged evapotranspiration rate (g H2O m-2 s-1) of single- and twin-row planting patterns for different accumulated growing degree-days (aGDD). The same letter A for different planting patterns in every aGDD category each year means no significant difference between two planting patterns at the α=0.1.
The comparison in the daytime WUE between single- and twin-row planting patterns in various aGDDs each year is presented in Figures 10, 11. During 2016, the daytime WUE of twin-row peanut was greater than single-row peanut by 27.4% in the early growth stage for aGDD<500 and by 11.1% for aGDD 500-1000. However, the WUE was similar for the aGDD 1000-2000. During 2018, the WUE of twin-row was significantly greater than single-row by 9.3% for periods with aGDD 1000-2000 and by 9.5% for aGDD>2000.
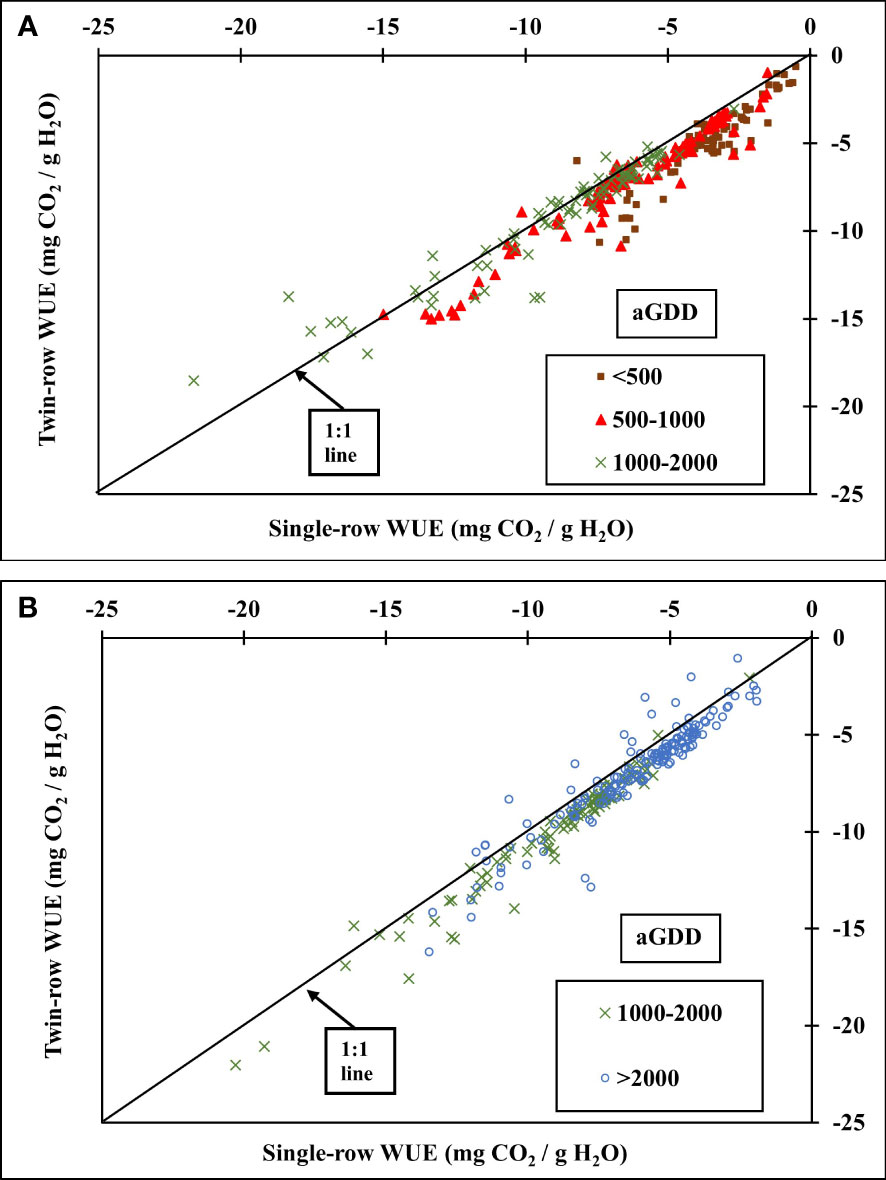
Figure 10 Comparison of the 30-min. average water-use efficiency (WUE) (mg CO2/g H2O) of single- and twin-row planting patterns for different aGDDs in (A) 2016 and (B) 2018.
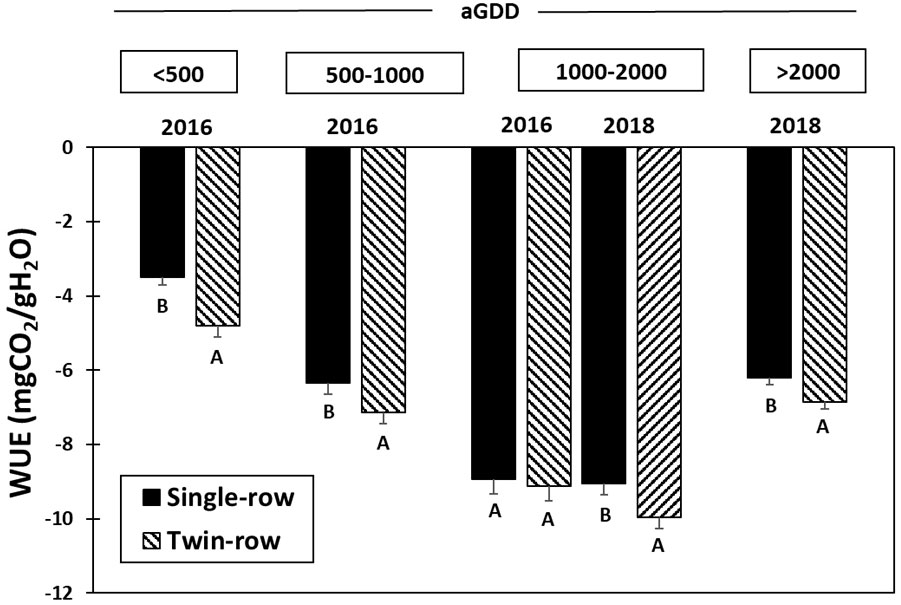
Figure 11 Mean and standard error of the 30-min. averaged water-use efficiency (WUE) (mg CO2/g H2O) of single- and twin-row planting patterns for different accumulated growing-degree days (aGDD). For every aGDD category in each year, letters A and B mean a significant difference at the α=0.1.
The yield in 2018 for both single- and twin-row peanut was greater than in 2016 (Figure 12). The twin-row pattern exhibited a greater yield than the single-row peanut in 2018. Single- and twin-row peanut yields were not significantly different in 2016.
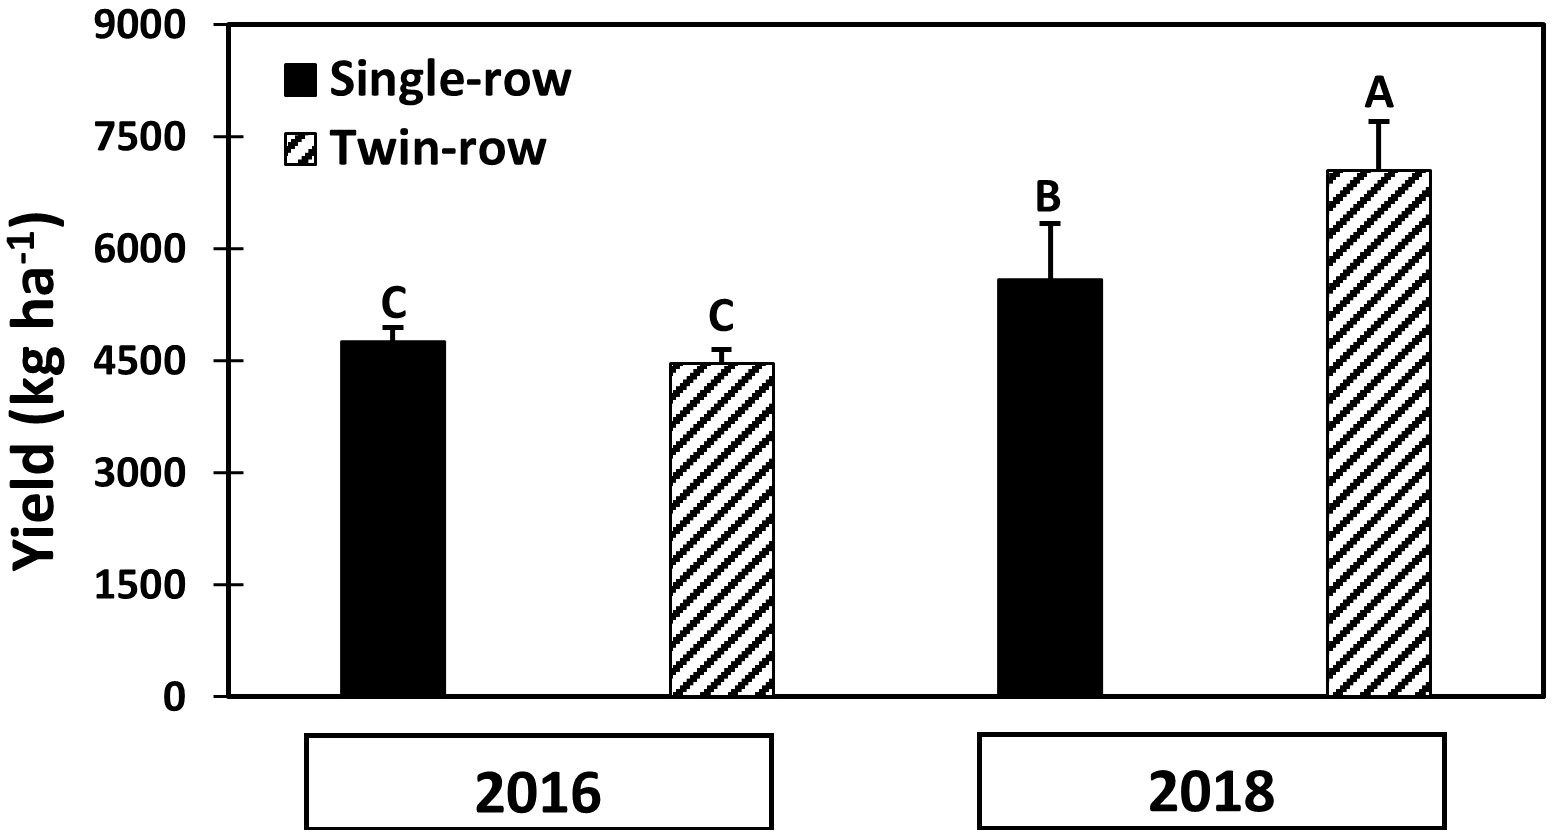
Figure 12 Mean and standard error of peanut yield (kg ha-1) of both planting patterns. Different letters mean a significant difference (α=0.1).
Net ecosystem exchange of CO2 increases as peanut plants grow and reaches a maximum during the mid-season with aGDD in the range of 1000-2000 (Figure 8). This seasonal variation follows the variations of solar radiation and temperature (Figures 4A, B) and the change in plant biomass throughout the growing season as indicated by peanut leaf area index (Figure not shown).
In this study, CO2 flux of twin-row peanut was significantly greater than single-row during the vegetative stage in 2016. This greater CO2 flux is a result of faster canopy closure (Table 2) and hence faster crop growth rate in twin-row peanut than in single-row. Leaf area index in 2016 also presented higher values for twin-row peanut than single row when DOY< 60 (Figure 13A). A greater crop growth in twin-row peanut is also reported by Colvin et al. (1985); Jaaffar and Gardner (1988), and Plumblee (2015). Jaaffar and Gardner (1988) also linked the faster canopy closure of peanut in twin-row to its higher growth rate and light interception.
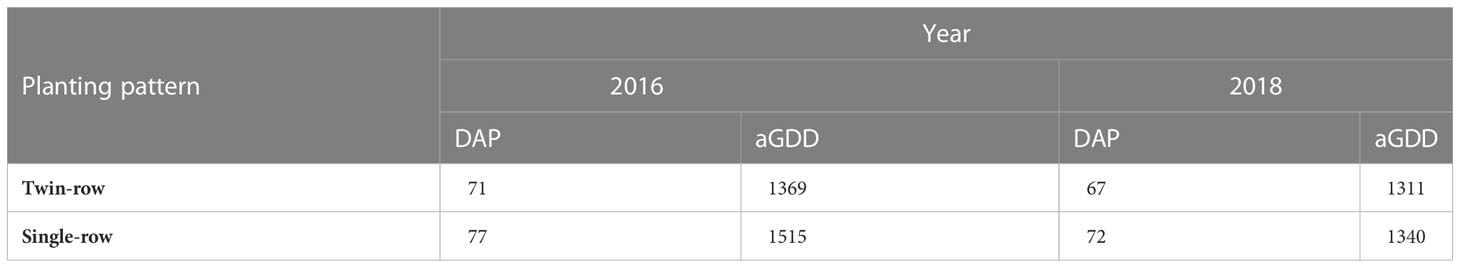
Table 2 Visually observed canopy-closure time in terms of days after planting (DAP) and accumulated growing degree days (aGDD) for single- and twin-row peanut.
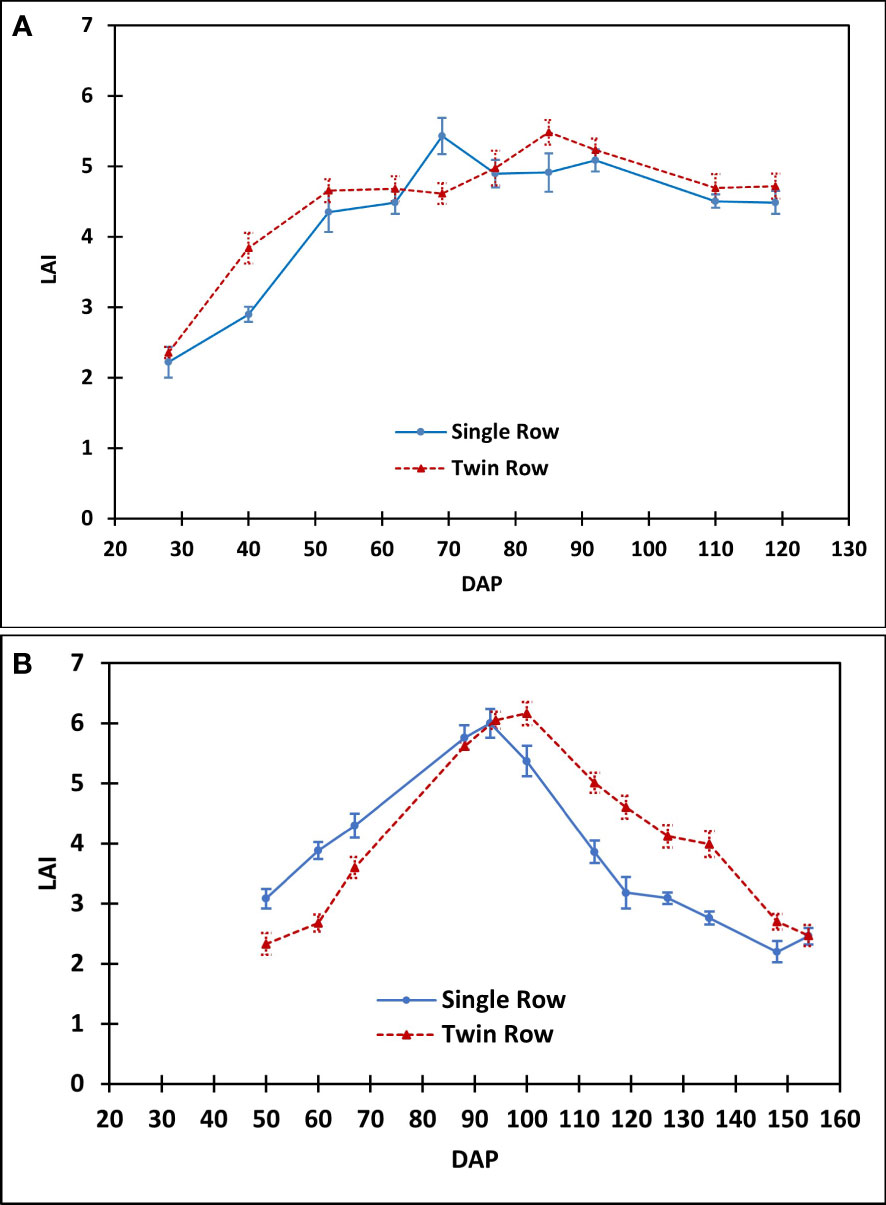
Figure 13 The comparison of peanut leaf area index between single- and twin-row planting patterns in (A) 2016 and (B) 2018.
During the mid-season in 2016CO2 fluxes of single- and twin-row peanut was comparable. As stated earlier, low precipitation and high VPD happened during various growth periods in 2016. Larger VPD enhances the evaporative demand hence increasing the water loss from the crop. To conserve water under a higher evaporative demand period, stomates close to limit transpiration (Stockle, 1990; Gholipoor et al., 2010; Schoppach and Sadok, 2012; Jiao et al., 2019). Consequently, the stomatal closure results in lower photosynthesis (Taylor et al., 1983; Stockle, 1990; Sinclair et al., 2017; Jiao et al., 2019). Therefore, the weather conditions of higher VPD and lower precipitation in 2016 were unfavorable to peanut growth potential to present. This would result in a similar CO2 flux in single- and twin-row peanut during these periods.
During 2018, precipitation and VPD were not limiting to peanut growth as compared to 2016. Thus, CO2 fluxes of twin-row peanut were greater than single-row peanut for aGDD 1000-2000 and aGDD >2000 (Figure 7B). This is consistent with that twin-row peanut showed larger LAI than single row when DOY > 94 (Figure 13B). The peak in LAI values was observed to be in a range of 5.4-6.1, in line with previous values of about 4.5-6.7 in Alabama, US by Davis and Mack (1991), 5.0-7.0 in Texas, US by Kiniry et al. (2005), about 4.5-6.8 in Georgia, US by Rowland et al. (2010), 5.1-5.3 in South China by Qi et al. (2020), and 4.9-6.5 in Georgia, US by Zhang et al. (2022). The observed higher CO2 flux can be attributed to lower intra-row competition for space, light, water and nutrients in twin-row as compared to single-row peanut (Hauser and Buchanan, 1981; Wehtje et al., 1984). This competition is supported by general higher canopy height of single-row peanut than that of twin row observed in this study (Figure 14).
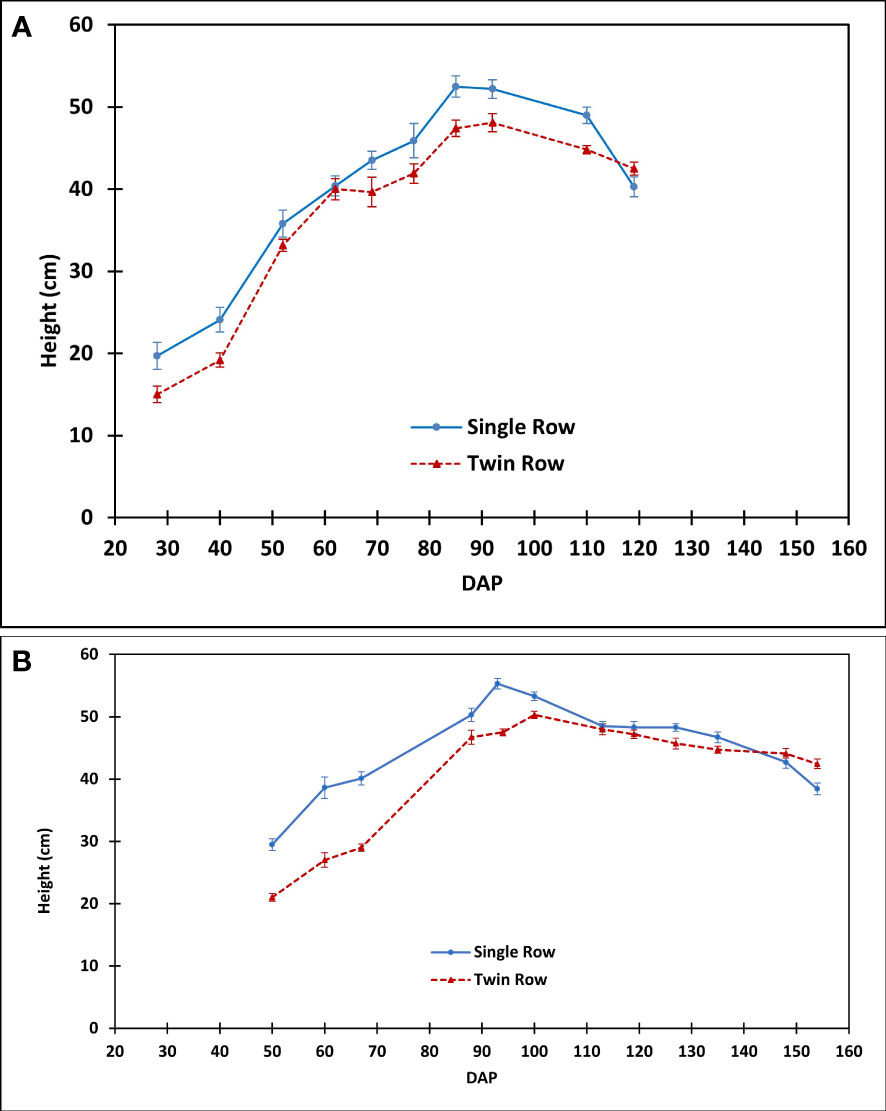
Figure 14 The comparison of peanut canopy height between single- and twin-row planting patterns in (A) 2016 and (B) 2018.
Evapotranspiration of single- and twin-row peanut was similar throughout the growing season in the current study (Figure 9). The crop evapotranspiration was calculated using the eddy-covariance method. The difference in the number of days leading to canopy closure (Table 2) was expected to cause a difference in the ET during the early season due to fast canopy closure. However, such a difference was not observed. Fast canopy closure results in a greater crop biomass and a lower soil exposure. Consequently, twin-row peanut with faster canopy closure should have higher transpiration but lower soil evaporation than the single-row peanut. The total of them (i.e., ET) was found to be similar for both planting patterns.
As the ratio of CO2 flux to ET, the daytime WUE of twin-row peanut during 2016 was greater than single-row peanut in the early growth stage for aGDD< 1000 (Figures 10, 11). These results suggest that the greater WUE during the early season of 2016 is likely linked to the faster crop growth in twin-row peanut. As noted, the fast canopy closure in the twin-row (Table 2) implies a fast crop growth rate and hence a greater CO2 flux. However, the ET during this period was similar. As a result, the WUE of twin-row peanut was greater than single-row during the 2016 early growing season. The WUE values of different planting patterns were similar each other for the aGDD 1000-2000 in 2016, while the WUE of twin-row was observed significantly greater than single-row for periods with aGDD > 1000 in 2018 (Figures 10, 11). As discussed above, the difference in precipitation and VPD between 2016 and 2018 could cause the change in CO2 flux difference and thus WUE difference between single- and twin-row peanut.
In this study, peanut yield in 2018 for both single- and twin-row peanut was greater than in 2016, and the twin-row pattern exhibited a greater yield than the single-row peanut in 2018 while single- and twin-row peanut yields were not significantly different in 2016 (Figure 12). These results may be attributed to the difference in precipitation and vapor pressure deficit (VPD) between the year 2016 and 2018. As stated earlier, 2016 was a year characterized by lower rainfall and higher VPD that in 2018. Even though peanut was irrigated in both years, the total water supply in 2016 was approximately half of that in 2018. The irrigation serves as a supplement to precipitation but cannot meet the entire crop demand. As discussed earlier, a high VPD leads stomates to close to limit transpiration when in water stress. This results in a similar CO2 flux and yield in single- and twin-row peanut in 2016. On the other hand, peanut growth potential present in conditions of more rainfall and smaller VPD in 2018, resulting in larger CO2 flux and yield for twin-row planting pattern than single-row planting pattern.
Moreover, due to a higher VPD during vegetative, pod filling and beginning maturity stages and the lower precipitation regime of 2016, weather conditions were not favorable for peanut growth. As a result, a lower yield was noted in 2016 compared to 2018. These results are in line with the analysis of Jiao et al. (2019); Sinclair et al. (2017), and Taylor et al. (1983) on the negative impact of a higher VPD on crop growth.
Pod filling and seed maturity stages are considered the most critical growth stages for peanut yield (Klepper, 1973; Reddy et al., 1981; Boote et al., 1982). The pod filling stage corresponds to aGDD values ranging between 1000 and 2000. Water-use efficiency was greater for twin-row peanut for this period in 2018 when precipitation was abundant. Furthermore in 2018, the yield of twin-row peanut was greater than in single-row peanut. On the other hand, no difference was observed between single- and twin-row peanut in 2016, a year characterized by low summer precipitation. Therefore, it is possible that the higher WUE at the critical stages of twin-row peanut in 2018 correlates with greater yield when compared with single-row peanut. A more exhaustive year-to-year investigation is required to confirm these results with incontrovertible assurance.
In this study, field-scale daytime net carbon ecosystem exchange (CO2 fluxes), ET and WUE of single- and twin-row peanut were compared using the eddy-covariance technique. To the best of our knowledge, the present study is unique in that it examines for the first time the effect of planting pattern on WUE. Results showed that in 2018, a wetter year with lower VPD, both the net daytime carbon uptake from the atmosphere and the WUE of twin-row peanut were significantly greater than those in the single-row peanut by 7-10% and ~9% respectively, during the critical pod filling and seed maturity growth stages (aGDD 1000-2000 and aGDD > 2000). In contrast, in 2016, a year with lower precipitation and higher VPD during several stages, the net daytime carbon uptake and WUE of peanut were similar for both planting patterns during pod filling (aGDD 1000-2000). Higher precipitation and lower VPD in 2018 likely resulted in greater peanut yield in twin-row as compared to single-row with abundant precipitation.
This study also suggests that during the vegetative stage (aGDD<500) in 2016, both daytime net carbon uptake from the atmosphere and WUE were considerably greater in twin-row than single-row by 31.7% and 27.4%, respectively. This was due to the faster crop growth rate as indicated by the faster canopy closure in twin-row peanut compared to single-row. In both years, the ET from both planting patterns was similar. This indicates that the variation in WUE, between the two planting patterns, was more impacted by changes in the daytime net carbon uptake than changes in evapotranspiration.
This experiment can be used as a blueprint to study ecosystem WUE of different peanut cultivars and peanut with different tillage practices and in other crops too. Further studies could help growers if given a focus on the determination of the effect of management practices on WUE, carbon sequestration from the atmosphere, water conservation and yield.
The raw data supporting the conclusions of this article will be made available by the authors, without undue reservation.
Conceptualization, ML. Methodology, ML and GZ. Field experiments, measurements, and data collection, GZ, NS, and RT. Data processing and result analysis, NS, GZ, and ML. Writing - preparing the manuscript with significant contributions from all authors, NS, GZ, and ML. Funding acquisition, ML, RT, and WM. All authors contributed to the article and approved the submitted version.
The National Peanut Board supported this research.
The research was financially supported by National Peanut Board. The authors would like to thank the farm crew at the Southwest Georgia Research and Education center at Plains, the University of Georgia, Plains, USA.
The authors declare that the research was conducted in the absence of any commercial or financial relationships that could be construed as a potential conflict of interest.
All claims expressed in this article are solely those of the authors and do not necessarily represent those of their affiliated organizations, or those of the publisher, the editors and the reviewers. Any product that may be evaluated in this article, or claim that may be made by its manufacturer, is not guaranteed or endorsed by the publisher.
Anapalli S. S., Fisher D. K., Reddy K. N., Krutz J. L., Pinnamaneni S. R., Sui R. (2019). Quantifying water and CO2 fluxes and water use efficiencies across irrigated C3 and C4 crops in a humid climate. Sci. Total Environ. 663, 338–350. doi: 10.1016/j.scitotenv.2018.12.471
Baldocchi D. (1994). A comparative study of mass and energy exchange rates over a closed C3 (wheat) and an open C4 (corn) crop: II. CO2 exchange and water use efficiency. Agric. For. Meteorol. 67, 291–321. doi: 10.1016/0168-1923(94)90008-6
Baldwin J., Todd J., Weeks J., Gorbet D., Culbreath A., Luke-Morgan A., et al. (2001). A regional study to evaluate tillage, row patterns, in-furrow insecticide, and planting date on the yield, grade, and tomato spotted wilt virus incidence of the Georgia green peanut cultivar. Proc. Annu. South. Conserv. Tillage Conf. Sustain. Agric. 24, 26–34.
Beer C., Ciais P., Reichstein M., Baldocchi D., Law B. E., Papale D., et al. (2009). Temporal and among-site variability of inherent water use efficiency at the ecosystem level. Global Biogeochem. Cycles 23, GB2018. doi: 10.1029/2008GB003233
Boote K., Stansell J. R., Schubert A. M., Stone J. F. (1982). “Irrigation, water use, and water relations,” in Peanut science and technology. Eds. Patte H. E., Young C. T. (Youkam, Texas: American Peanut Research and Education Association), 164–205.
Branch W. (2007). Registration of ‘Georgia-06G’peanut. J. Plant Regis. 1, 120–120. doi: 10.3198/jpr2006.12.0812crc
Brown S., Todd J., Culbreath A., Baldwin J., Beasley J., Kemerait B., et al. (2003). Minimizing spotted wilt of peanut. Univ. Georgia Coop. Ext. Serv. Bull., 1165.
Colvin D. L., Walker R. H., Patterson M. G., Wehtje G., McGuire J. A. (1985). Row pattern and weed management effects on peanut production. Peanut Sci. 12, 22–27. doi: 10.3146/pnut.12.1.0006
Culbreath A., Tillman B., Gorbet D., Holbrook C., Nischwitz C. (2008). Response of new field-resistant peanut cultivars to twin-row pattern or in-furrow applications of phorate for management of spotted wilt. Plant Dis. 92, 1307–1312. doi: 10.1094/PDIS-92-9-1307
Davis D. P., Mack T. P. (1991). Relations between leaf area index and growth characteristics of florunner, southern runner, and sunrunner peanut. Peanut Sci. 18 (1), 30–37. doi: 10.3146/i0095-3679-18-1-10
Emery D., Gupton C. (1968). Reproductive efficiency of Virginia type peanuts. II. the influence of variety and seasonal growth period upon fruit and kernel maturation. Oléagineux 23, 99–104.
Farquhar G. D., O'Leary M. H., Berry J. A. (1982). On the relationship between carbon isotope discrimination and the intercellular carbon dioxide concentration in leaves. Funct. Plant Biol. 9, 121–137. doi: 10.1071/PP9820121
Gholipoor M., Prasad P. V., Mutava R. N., Sinclair T. R. (2010). Genetic variability of transpiration response to vapor pressure deficit among sorghum genotypes. Field Crops Res. 119, 85–90. doi: 10.1016/j.fcr.2010.06.018
Hatfield P. M., Wright G. C., Tapsall W. R. (1990). A large, retractable, low cost and re-locatable rain out shelter design. Exp. Agric. 26, 57–62. doi: 10.1017/S0014479700015404
Hauser E., Buchanan G. (1981). Influence of row spacing, seeding rates and herbicide systems on the competitiveness and yield of peanuts. Peanut Sci. 8, 74–81. doi: 10.3146/i0095-3679-8-1-18
Hubick K. T., Farquhar G. D., Shorter R. (1986). Correlation between water-use efficiency and carbon isotope discrimination in diverse peanut (Arachis) germplasm. Funct. Plant Biol. 13, 803–816. doi: 10.1071/PP9860803
IPCC (2014). Climate Change 2014: Synthesis Report. Contribution of Working Groups I, II and III to the Fifth Assessment Report of the Intergovernmental Panel on Climate Change. Eds. Core Writing Team, Pachauri R. K., Meyer L. A.. (Geneva, Switzerland: IPCC). 151
Jaaffar Z., Gardner F. (1988). Canopy development, yield, and market quality in peanut as affected by genotype and planting pattern. Crop Sci. 28, 299–305. doi: 10.2135/cropsci1988.0011183X002800020024x
Jiao X.-C., Song X.-M., Zhang D.-L., Du Q.-J., Li J.-M. (2019). Coordination between vapor pressure deficit and CO2 on the regulation of photosynthesis and productivity in greenhouse tomato production. Sci. Rep. 9, 8700. doi: 10.1038/s41598-019-45232-w
Kemerait R., Culbreath A., Prostko E., Brenneman T., Tubbs S., Srinivasan R., et al. (2018). Minimizing diseases of peanut in the southeastern United States. The 2018 version of peanut disease risk index. Peanut Rx. University of Georgia, University of Florida, Auburn University, Mississippi State University, Clemson University. Available at: https://peanuts.caes.uga.edu/content/dam/caes-subsite/peanuts/docs/2018/2018-Peanut-Rx-Disease-Risk-Index.pdf.
Kiniry J. R., Simpson C. E., Schubert A. M., Reed J. D. (2005). Peanut leaf area index, light interception, radiation use efficiency, and harvest index at three sites in Texas. Field Crops Res. 91 (2-3), 297–306. doi: 10.1016/j.fcr.2004.07.021
Klepper B. (1973). Water relations of peanut plants. Peanut culture and uses. Amer. Peanut Res. Educ. Assoc. (Stillwater, OK, USA), 265–269.
Kormann R., Meixner F. X. (2001). An analytical footprint model for non-neutral stratification. Boundary-Layer Meteorol. 99, 207–224. doi: 10.1023/A:1018991015119
Lanier J. E., Jordan D. L., Spears J. F., Wells R., Johnson P. D., Barnes J. S., et al. (2004). Peanut response to planting pattern, row spacing, and irrigation. Agron. J. 96, 1066–1072. doi: 10.2134/agronj2004.1066
Law B. E., Falge E., Gu L., Baldocchi D. D., Bakwin P., Berbigier P., et al. (2002). Environmental controls over carbon dioxide and water vapor exchange of terrestrial vegetation. Agric. For. Meteorol. 113, 97–120. doi: 10.1016/S0168-1923(02)00104-1
Leclerc M. Y., Foken T. (2014). Footprints in micrometeorology and ecology. (Berlin, Heidelberg, Germany: Springer), 239.
Leclerc M., Thurtell G. (1990). Footprint prediction of scalar fluxes using a markovian analysis. Boundary-Layer Meteorol. 52, 247–258. doi: 10.1007/BF00122089
Mills W. (1964). Heat unit system for predicting optimum peanut-harvesting time. Trans. ASAE 7, 307–0309. doi: 10.13031/2013.40765
Niu S., Xing X., Zhang Z., Xia J., Zhou X., Song B., et al. (2011). Water-use efficiency in response to climate change: from leaf to ecosystem in a temperate steppe. Global Change Biol. 17, 1073–1082. doi: 10.1111/j.1365-2486.2010.02280.x
Ortiz R., Sayre K. D., Govaerts B., Gupta R., Subbarao G., Ban T., et al. (2008). Climate change: can wheat beat the heat? Agricult. Ecosyst. Environ. 126, 46–58. doi: 10.1016/j.agee.2008.01.019
Plumblee M. T. (2015). Row pattern, row spacing, and seeding rate effects on corn and peanut (Athens, Ga, USA: Master's thesis). Theses, University of Georgia).
Qi H., Zhu B., Wu Z., Liang Y., Li J., Wang L., et al. (2020). Estimation of peanut leaf area index from unmanned aerial vehicle multispectral images. Sensors 20 (23), 6732. doi: 10.3390/s20236732
Reddy V., Tanner J., Roy R., Elliot J. (1981). The effects of irrigation, inoculants and fertilizer nitrogen on peanuts (Arachis hypogaea l.). II. yield. Peanut Sci. 8, 125–128. doi: 10.3146/i0095-3679-8-2-12
Rowland D., Beasley J., Faircloth W. (2010). Genotypic differences in current peanut (Arachis hypogaea l.) cultivars in phenology and stability of these traits under different irrigation scheduling methods. Peanut Sci. 37 (2), 110–123. doi: 10.3146/PS08-023.1
Rowland D., Puppala N., Beasley J. J., Burrow M., Gorbet D., Jordan D., et al. (2012). Variation in carbon isotope ratio and its relation to other traits in peanut breeding lines and cultivars from US trials. Plant Breed. Crop Sci. 4, 144–155. doi: 10.5897/JPBCS12.031
Rowland D., Sorensen R., Butts C., Faircloth W. (2006). Determination of maturity and degree day indices and their success in predicting peanut maturity. Peanut Sci. 33, 125–136. doi: 10.3146/0095-3679(2006)33[125:DOMADD]2.0.CO;2
Scanlon T. M., Albertson J. D. (2004). Canopy scale measurements of CO2 and water vapor exchange along a precipitation gradient in southern Africa. Global Change Biol. 10, 329–341. doi: 10.1046/j.1365-2486.2003.00700.x
Schoppach R., Sadok W. (2012). Differential sensitivities of transpiration to evaporative demand and soil water deficit among wheat elite cultivars indicate different strategies for drought tolerance. Environ. Exp. Bot. 84, 1–10. doi: 10.1016/j.envexpbot.2012.04.016
Sinclair T. R., Devi J., Shekoofa A., Choudhary S., Sadok W., Vadez V., et al. (2017). Limited-transpiration response to high vapor pressure deficit in crop species. Plant Sci. 260, 109–118. doi: 10.1016/j.plantsci.2017.04.007
Sinclair T. R., Tanner C. B., Bennett J. M. (1984). Water-use efficiency in crop production. Bioscience 34, 36–40. doi: 10.2307/1309424
Solomon S., Qin D., Manning M., Chen Z., Marquis M., Averyt K., et al. (2007). “Climate change 2007: the physical science basis,” in Contribution of working group I to the fourth assessment report of the intergovernmental panel on climate change (Cambridge New York: Cambridge University Press).
Sorensen R., Lamb M. (2009). Peanut yield, market grade, and economics with two surface drip lateral spacings. Peanut Sci. 36, 85–91. doi: 10.3146/PS07-107.1
Sorensen R., Sconyers L., Lamb M., Sternitzke D. (2004). Row orientation and seeding rate on yield, grade, and stem rot incidence of peanut with subsurface drip irrigation. Peanut Sci. 31, 54–58. doi: 10.3146/pnut.31.1.0012
Stockle C. O. (1990). Variability in crop radiation-use efficiency associated with vapor-pressure deficit. Field Crops Res. 25 (3-4), 171. doi: 10.1016/0378-4290(90)90001-R
Taylor H. M., Jordan W. R., Sinclair T. R. (1983). Limitations to efficient water use in crop production. (Madison, WI, USA: American Society of Agronomy), 538 pp.
Tillman B., Gorbet D., Culbreath A., Todd J. (2006). Response of peanut cultivars to seeding density and row patterns. Crop Manage. 5, 1. doi: 10.1094/CM-2006-0711-01-RS
Tu K., Knohl A., Mambelli S., Ma S., Baldocchi D., Dawson T. (2008). Observations and scaling of water use efficiency from leaf to globe. Geophys. Res. Abst. 10, EGU2008–A-07012.
Tubbs R. S., Beasley J. P. Jr., Culbreath A. K., Kemerait R. C., Smith N. B., Smith A. R. (2011). Row pattern and seeding rate effects on agronomic, disease, and economic factors in large-seeded runner peanut. Peanut Sci. 38, 93–100. doi: 10.3146/PS10-19.1
University of Georgia Cooperative Extension (2022). Peanut production guide. Bulletin 1146. (Athens, GA, USA: University of Georgia) 178 pp. Available at: https://secure.caes.uga.edu/extension/publications/files/pdf/B%201146_2.PDF
USDA/NASS (2023). USDA/NASS crop values 2022 summary (USA: United States Department of Agriculture, National Agricultural Statistics Service). February 2023. Available at: https://downloads.usda.library.cornell.edu/usdaesmis/files/k35694332/b85171637/3r0767797/cpvl0223.pdf
USDA/NRCS (2019). Official soil series descriptions (Washington, D.C: USDA Natural Resources Conservation Serv.). Available at: http://soils.usda.gov/technical/classification/osd/index.html.
Vickers D., Mahrt L. (1997). Quality control and flux sampling problems for tower and aircraft data. J. Atmos. Ocean. Technol. 14, 512–526. doi: 10.1175/1520-0426(1997)014<0512:QCAFSP>2.0.CO;2
Wang T., Tang X., Zheng C., Gu Q., Wei J., Ma M. (2018). Differences in ecosystem water-use efficiency among the typical croplands. Agric. Water Manage. 209, 142–150. doi: 10.1016/j.agwat.2018.07.030
Webb E. K., Pearman G. I., Leuning R. (1980). Correction of flux measurements for density effects due to heat and water vapour transfer. Q. J. R. Meteorol. Soc. 106, 85–100. doi: 10.1002/qj.49710644707
Wehtje G., Walker R., Patterson M., McGuire J. (1984). Influence of twin rows on yield and weed control in peanuts. Peanut Sci. 11, 88–91. doi: 10.3146/i0095-3679-11-2-10
Wesely M., Thurtell G., Tanner C. (1970). Eddy correlation measurements of sensible heat flux near the earth's surface. J. Appl. Meteorol. 9, 45–50. doi: 10.1175/1520-0450(1970)009<0045:ECMOSH>2.0.CO;2
Wilczak J. M., Oncley S. P., Stage S. A. (2001). Sonic anemometer tilt correction algorithms. Boundary-Layer Meteorol. 99, 127–150. doi: 10.1023/A:1018966204465
Williams E. J., Drexler J. S. (1981). A non-destructive method for determining peanut pod maturity. Peanut Sci. 8, 134–141. doi: 10.3146/i0095-3679-8-2-15
Wright G. C., Hubick K. T., Farquhar G. D. (1988). Discrimination in carbon isotopes of leaves correlates with water-use efficiency of field-grown peanut cultivars. Funct. Plant Biol. 15, 815–825. doi: 10.1071/PP9880815
Wright G. C., Hubick K. T., Farquhar G. D., Rao R. N. (1993). “Genetic and environmental variation in transpiration efficiency and its correlation with carbon isotope discrimination and specific leaf area in peanut,” in Stable isotopes and plant carbon-water relations. Ed. Ehleringer J. R. (Academic press), 247–267. doi: 10.1016/B978-0-08-091801-3.50025-8
Wright G. C., Rao R. C., Farquhar G. D. (1994). Water-use efficiency and carbon isotope discrimination in peanut under water deficit conditions. Crop Sci. 34, 92–97. doi: 10.2135/cropsci1994.0011183X003400010016x
Keywords: eddy-covariance method, water-use efficiency, daytime net ecosystem, carbon uptake, evapotranspiration, peanut planting pattern
Citation: Zhang G, Leclerc MY, Singh N, Tubbs RS and Montfort WS (2023) Influence of planting pattern on peanut ecosystem daytime net carbon uptake, evapotranspiration, and water-use efficiency using the eddy-covariance method. Front. Agron. 5:1204887. doi: 10.3389/fagro.2023.1204887
Received: 12 April 2023; Accepted: 18 May 2023;
Published: 15 June 2023.
Edited by:
Pratap Bhattacharyya, ICAR-NRRI, IndiaReviewed by:
Abhishek Chakraborty, Indian Space Research Organisation, IndiaCopyright © 2023 Zhang, Leclerc, Singh, Tubbs and Montfort. This is an open-access article distributed under the terms of the Creative Commons Attribution License (CC BY). The use, distribution or reproduction in other forums is permitted, provided the original author(s) and the copyright owner(s) are credited and that the original publication in this journal is cited, in accordance with accepted academic practice. No use, distribution or reproduction is permitted which does not comply with these terms.
*Correspondence: Gengsheng Zhang, emhhbmdAdWdhLmVkdQ==
Disclaimer: All claims expressed in this article are solely those of the authors and do not necessarily represent those of their affiliated organizations, or those of the publisher, the editors and the reviewers. Any product that may be evaluated in this article or claim that may be made by its manufacturer is not guaranteed or endorsed by the publisher.
Research integrity at Frontiers
Learn more about the work of our research integrity team to safeguard the quality of each article we publish.