 Alison L. Thompson
 Kelly R. Thorp
 Matthew M. Conley
 Duke Pauli
94% of researchers rate our articles as excellent or good
Learn more about the work of our research integrity team to safeguard the quality of each article we publish.
Find out more
METHODS article
Front. Agron., 23 November 2023
Sec. Climate-Smart Agronomy
Volume 5 - 2023 | https://doi.org/10.3389/fagro.2023.1195030
This article is part of the Research TopicMethods in Climate-Smart AgronomyView all 5 articles
Background: Advancements in field spectrometry have the potential to increase understanding of crop growth and development in response to hot and dry environments. However, as with any instrument used for scientific advancement, it is important to continue developing and optimizing data collection protocols to promote efficiency, safety, and data quality. The goal of this study was to develop a novel data collection method, involving a proximal sensing cart with onboard cooling equipment, to improve deployments of a field spectroradiometer in a hot and dry environment. Advantages and disadvantages of the new method were compared with the traditional backpack approach and other approaches reported in literature.
Results: The novel method prevented the spectroradiometer from overheating and nearly eliminated the need to halt data collection for battery changes. It also enabled data collection from a significantly larger field area and from more field plots as compared to the traditional backpack method. Use of a custom cooling box to stabilize operating temperatures for the field spectroradiometer also improved stability of white panel data both within and among collections despite outside air temperatures in excess of 30°C.
Conclusions: As compared to traditional data collection approaches for measuring spectral reflectance of field crops in a hot and dry environment, use of a proximal sensing cart with a customized equipment cooling box improved spectroradiometer performance, increased practicality of equipment transport, and reduced operator safety concerns.
Since the 1980s, hyperspectral sensing has been utilized in agricultural field studies to measure interactions of radiation with plant and soil surfaces (Thorp and Tian, 2004). The spectral reflectivity of crop vegetation is primarily affected by the plant biochemical properties (i.e., chlorophyll and other pigments) and the biophysical attributes of the plant canopy (i.e., biomass and canopy architecture) (Curran, 1989). Through deployment of spectral sensing equipment, crop scientists can measure these spectral properties and use the information to estimate spatial and temporal variation in crop health and productivity. Notably, field spectroradiometers, which measure spectral reflectance in hundreds or thousands of narrow wavebands (≤ 5 nm), have been a primary technology for studying crop spectral properties and validating spectral indices of crop growth and health (Lu et al., 2020). Advancements in field spectrometry have led to a variety of novel proximal sensing applications in agriculture, such as evaluating and monitoring foliar plant diseases (Zhang et al., 2020), predicting nutrition values in dairy feed (Duranovich et al., 2020), estimating nitrogen levels in wheat (Lu et al., 2020), biomass determination in maize (Montes et al., 2011), and phenotyping upland cotton varieties for breeding applications (Thorp et al., 2015). Furthermore, the technology has improved understanding of crop evapotranspiration for irrigation scheduling (Thorp et al., 2018), foliar disease presence for pesticide use efficiency (Appeltans et al., 2020), and solar induced florescence for crop stress monitoring (Gomez-Chova et al., 2006).
Changes in world-wide climate conditions have spurred tremendous scientific effort to understand the effects of high air temperature and low precipitation on agricultural cropping systems. Toward this goal, the above-mentioned advancements in spectral sensing technology make these sensors ideal for understanding the impacts of abiotic stress in plants. Compared to traditional plant sampling methods, spectral measurements are more rapid and less destructive (Sahoo et al., 2015) and offer several advantages for increasing the frequency and spatial coverage of crop growth and health estimates (Duranovich et al., 2020). However, practical considerations for proximal sensor deployment remain a limiting factor on the amount and quality of spectral data that can be collected, particularly under adverse environmental conditions (White et al., 2012). For example, high air temperatures have caused field spectroradiometers to overheat and shutdown (Huang et al., 2016; Hankerson, 2018), because extreme heat can overwhelm their onboard thermal electric cooling systems. Also, Danner et al. (2015) reported that excessive heat and direct sun exposure can prevent a field spectroradiometer from maintaining an optimal internal temperature. Extreme environmental conditions can also impact the human operators of scientific equipment; fatigue or illness, including heat exhaustion or heat stroke, is a real concern for some researchers. Field spectroradiometers are often sold with a backpack or hand-held data collection device, indicating the industry assumes human effort will be used to transport and operate the equipment throughout the field. Thus, not only are human operators exposed to the high air temperatures imposed by the environment, but they are also expected to increase their exertion under these conditions. When scientific equipment and its operators are affected by adverse environmental conditions, the end results may include jeopardized scientific data quality, wasted time and resources, and dissatisfied scientific personnel. Efforts are needed to develop spectral data collection methods that minimize the effects of these extraneous environmental factors on the reliability of the scientific data and the expenditure of both human and material resources for the scientific effort.
At field sites near Maricopa, Arizona, where the environment is hot and dry, field spectroradiometers and other proximal sensing equipment have been used in plant phenotyping efforts to identify upland (Gossypium hirsutum L.) and Pima (G. barbadense) cotton germplasm with improved adaptation to abiotic stressors (Thorp et al., 2015; Pauli et al., 2016; Thompson et al., 2018b; Melandri et al., 2021). Over the years, high air temperatures have consistently decreased quality and/or efficiency of spectral data collections. Maricopa is in the Arizona low desert where temperatures routinely exceed 37°C (100°F) during the cotton growing season, particularly during the months of June through September. Prolonged exposure to these temperatures has impacted the performance of electronic sensing equipment, including field spectroradiometers (Hankerson, 2018; Thompson et al., 2022; Conley et al., 2023). In addition, the high air temperatures pose real health risks to field workers at Maricopa, including heat exhaustion, heat stroke, or even death. The Center for Disease Control and Prevention (CDC) has defined the threshold for human tolerance to excessive temperatures as sustained periods of 40.6°C (105°F) (Petitti et al., 2013). These temperatures are routinely exceeded in Maricopa and are also common in other parts of the world where agricultural research is conducted (Riccò, 2018). To ensure data quality and data collection efficiency in this challenging environment, novel techniques are needed to monitor and maintain the reliable performance of electronic sensing equipment. Furthermore, efforts to improve the safety and ergonomics of data collections will prevent injury or other heat related illnesses.
The overall goal of this study was to develop a novel data collection method for proximal hyperspectral field measurements in a hot and dry environment. The specific objectives were to 1) develop a method that reduced equipment malfunction and concerns for operator health while collecting cotton leaf spectral reflectance data using a field spectroradiometer and 2) identify advantages and disadvantages of the novel method compared to traditional approaches.
Upland cotton (Gossypium hirsutum L.) leaf radiometric measurements were collected on upper-most fully expanded pre-marked leaves using a field spectroradiometer (ASD FieldSpec3, Malvern Panalytical, Inc., Westborough, MA, USA) with the leaf clip accessory attached to a 1-m fiber optic cable. The clip contained a 4.5-W halogen light source and two reflectance standards. As described by Melandri et al. (2021), one standard was made of white polytetrafluoroethylene material (white panel) for radiance measurements and the second standard was made of black painted vinyl as a background for leaf measurements. Radiometric information was reported in 2,151 narrow wavebands from 350 to 2,500 nm in 1 nm intervals. The same two individuals collected the leaf radiometric measurements for all the cotton field trials described below.
The spectroradiometer was transported through the field using two different approaches, including the traditional backpack (BP) and proximal sensing cart (PSC) methods. With the BP method, the spectrometer was manually carried by the operator using the backpack provided by the manufacturer, and a separate apparatus held the required laptop computer toward the front of the operator’s body (Figure 1). The equipment was powered using the battery packs provided by the manufacturer. The weight of the backpack, spectroradiometer with batteries, leaf clip, fiber optic cable, and laptop with carrying apparatus, which must all be manually carried during collections, was 13.6 kg (30 lbs.). The addition of optional cooling packs, which were used for the third BP collection (day of year 239 in 2019, Table 1), added 0.45 kg to the total weight. With the BP setup, one operator typically carried the spectrometer and managed the data collection using the laptop-based control software, while a second operator carried the leaf clip and managed its attachment to the cotton leaves. However, it is possible, though cumbersome, for a single operator to manage all the required tasks. With the PSC method, the equipment was installed on the custom, hand-pushed field cart previously described by Thompson et al. (2018a), which included improvements suggested by White and Conley (2013). The PSC method required one person to operate the spectrometer and another to operate the leaf clip and its attachment to the cotton leaves. A third person was useful for pushing the PSC but was not strictly required. In this study, the BP method was used for three collections, and the PSC method was used for 16 collections (Table 1).
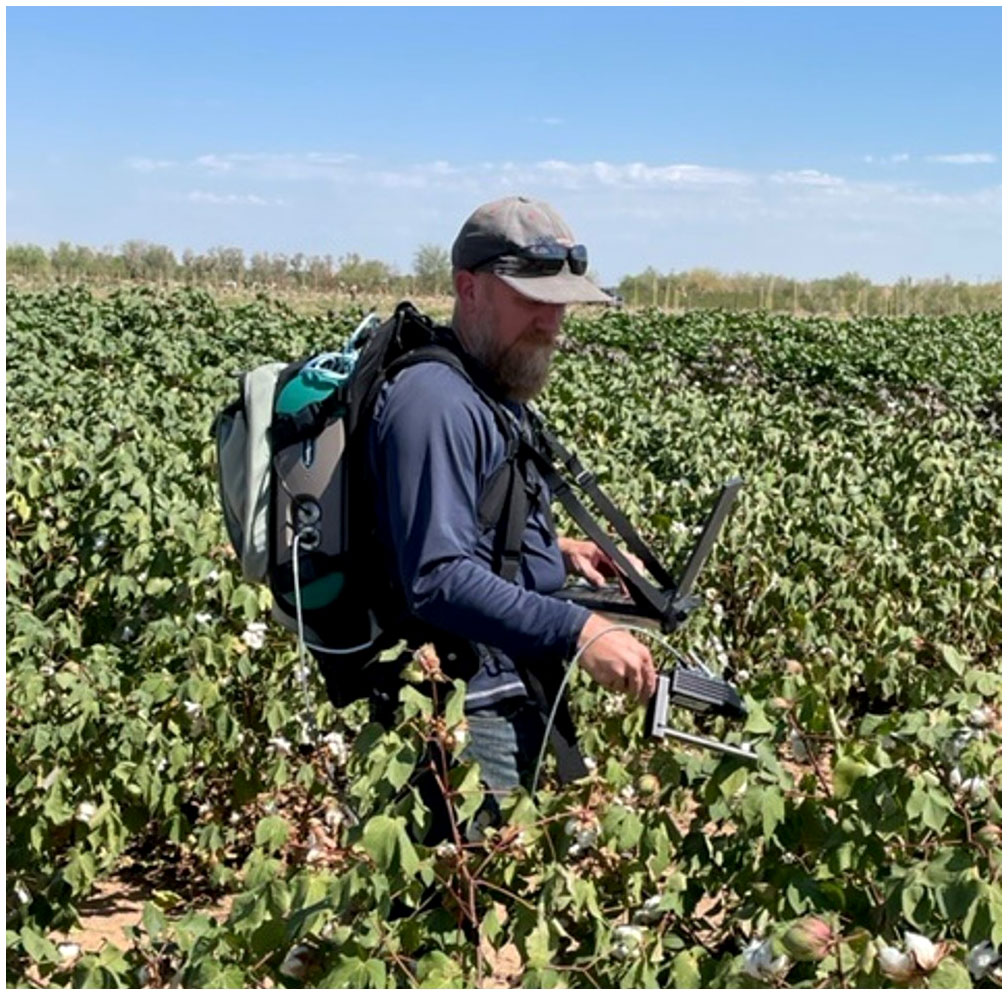
Figure 1 An operator demonstrating the backpack (BP) method by manually carrying the spectroradiometer, laptop computer, leaf clip accessory, and other components. The total weight of the equipment was 13.6 kg without cooling packs for the device. The image was taken 23 September 2022 in Maricopa AZ.
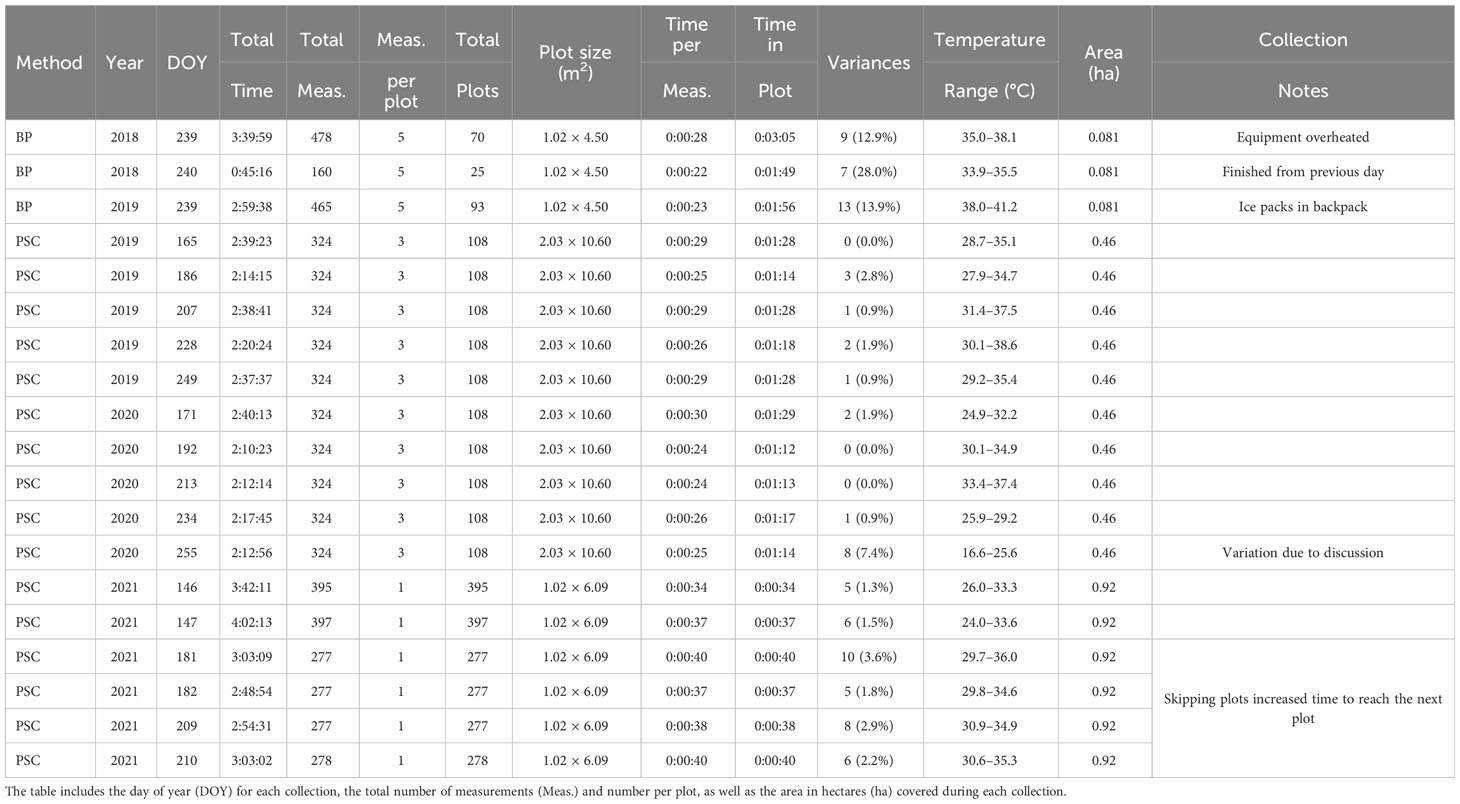
Table 1 Summarization table of the calculated and measured metrics used to compare the efficiency and effectiveness of the backpack (BP) and proximal sensing cart (PSC) data collection methods.
To limit exposure of the spectroradiometer to high air temperatures, a custom thermoelectric cooling box (TCB) was designed and installed on the PSC (Figure 2A). The TCB was made from a polystyrene beaded insulated shipping box, 63W × 43D × 39H cm, and equipped with thermal electronic cooling Peltier modules (Lsgoodcare, TEC1-12706 kit, Amazon.com link) that maintained the internal box temperature between 26.5–26.9°C (79.7–80.7°F) and added 12 cm of height to the polystyrene box (Figure 2B). Custom foam inserts were added to ensure the spectroradiometer was secured inside the box (Figure 2C), and square paper ducting ensured air circulation throughout the box (Figure 2D). Power was supplied to the TCB, spectroradiometer, and laptop by two, 12-volt lithium-ion batteries (Optima D34 Yellow Top, OPTIMA, Mexico) and a 110-volt inverter (Tripp-Lite PowerVerter, Eaton, Chicago, IL, USA), which were also installed on the PSC (Figure 2A). Standard power cords with transformers to reduce voltage, as provided by the equipment manufacturers, were used to connect the spectroradiometer and laptop computer to the inverter.
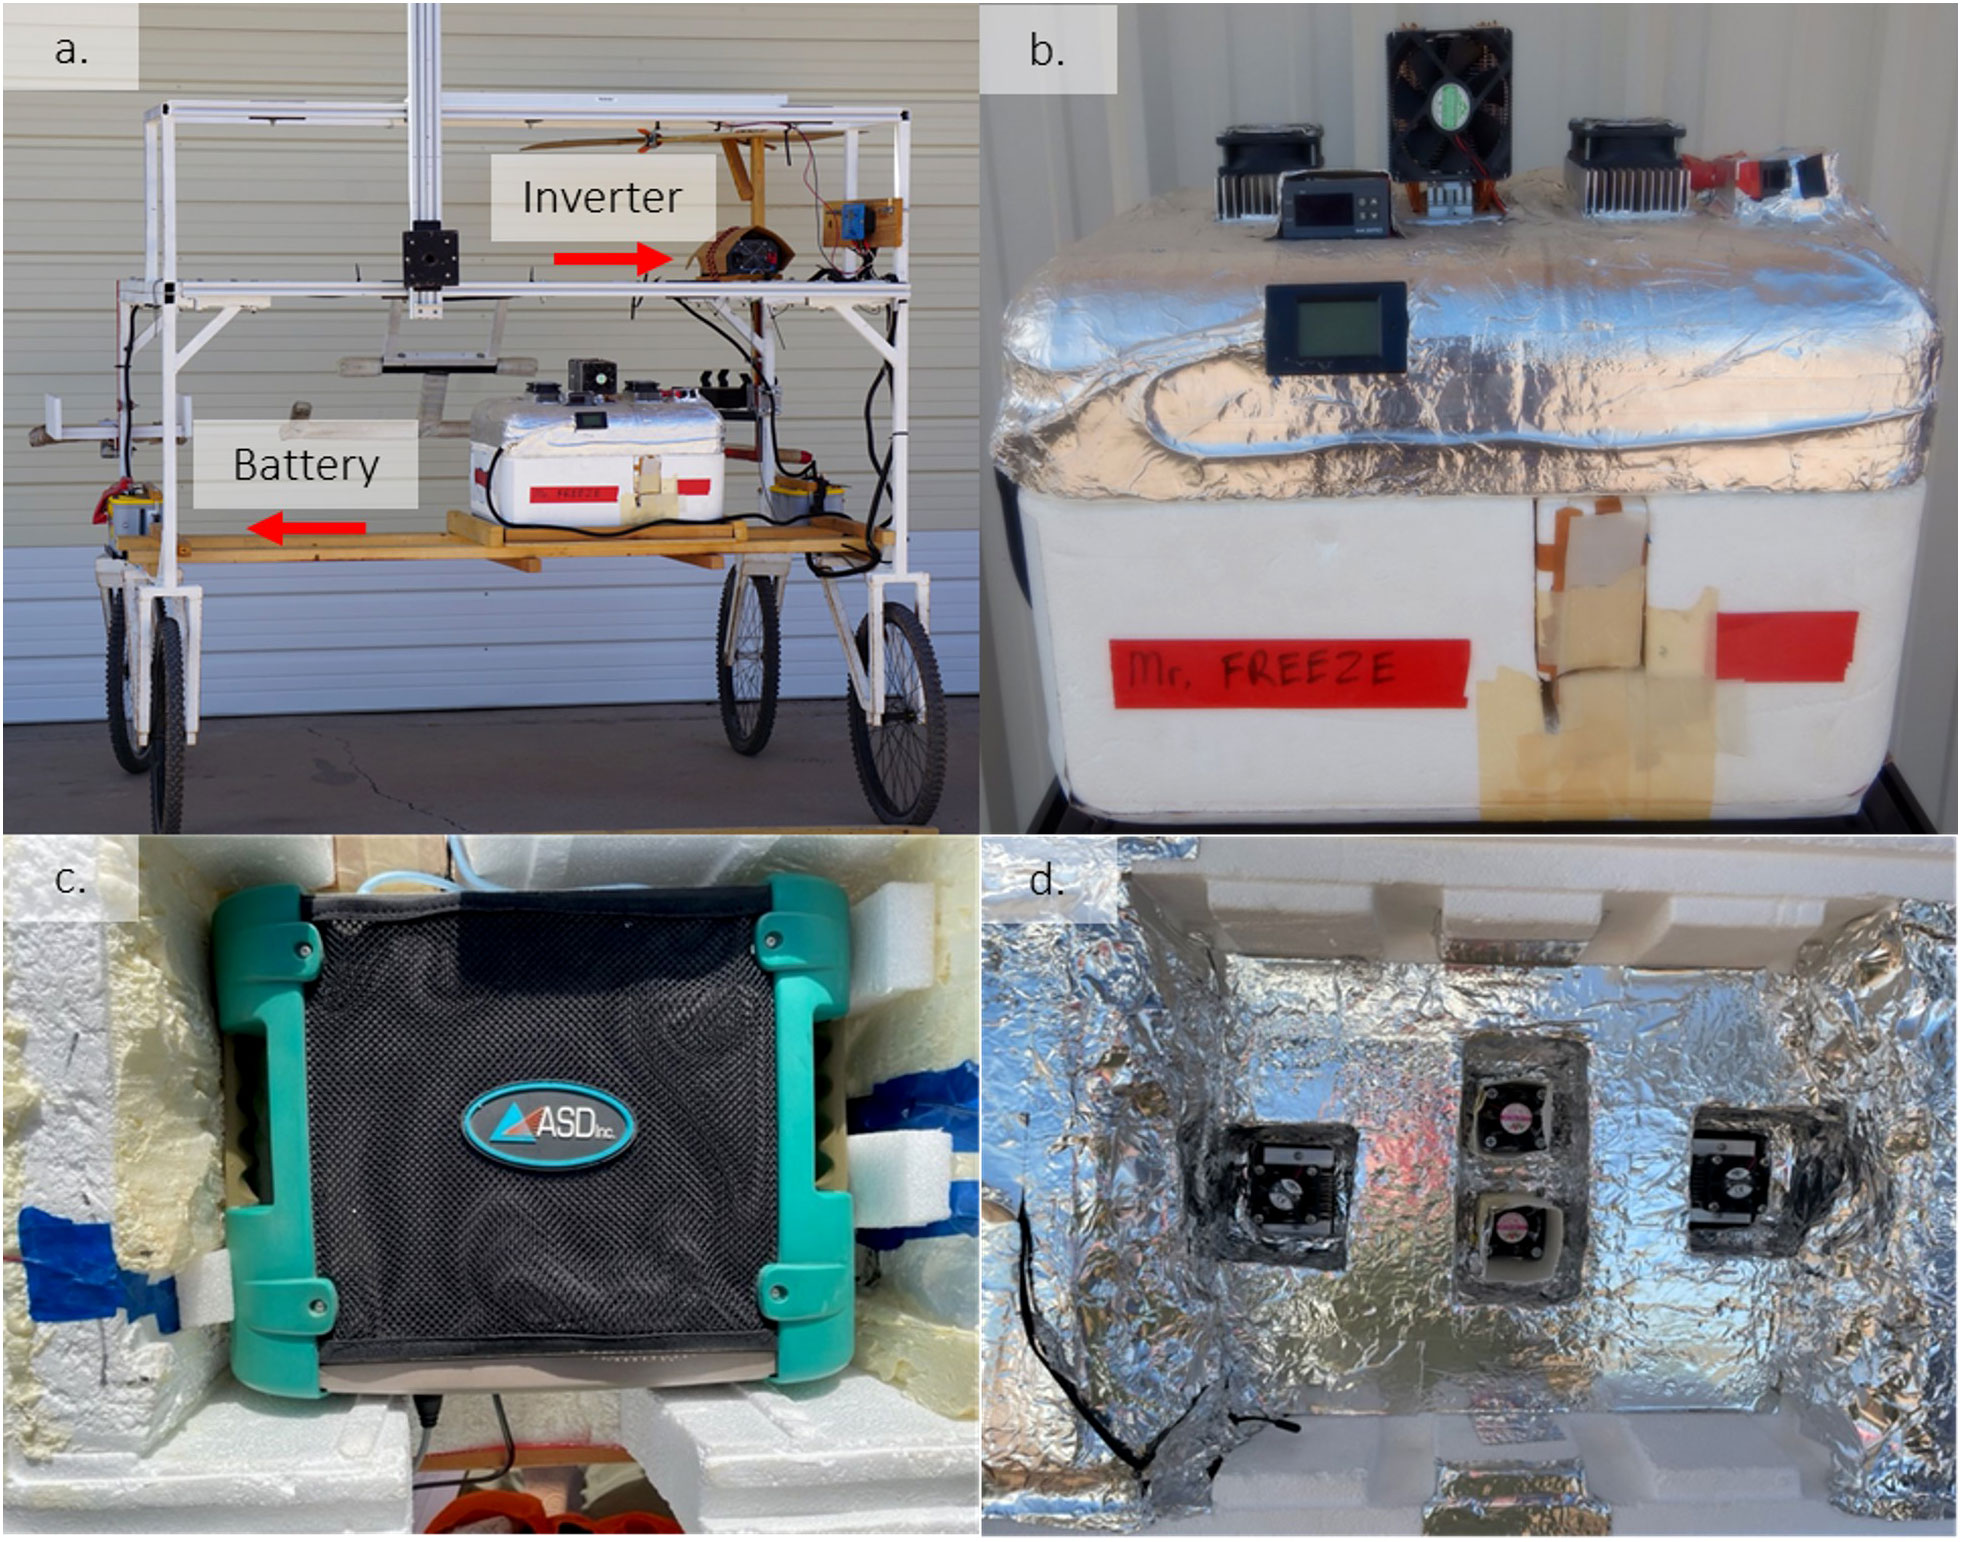
Figure 2 The custom proximalsensing cart used to carry the thermoelectric cooling box, batteries, inverter, and spectral sensing equipment for field collections (A). The polystyrene box equipped wih Peltier modules and an electronic thermometer to monitor the internal temperature (B). The field spectroradiometer inside the box with foam inserts to secure the instrument (C). The lid of the box with the paper ducing to improve air circulation inside. The black wire in the lower left is the internal temperature sensor (D).
All field trials were conducted at the Maricopa Agricultural Center (MAC) in Maricopa, Arizona, USA (33.079° N, 111.977° W, 360 m above sea level) during the 2018–2021 cotton growing seasons (April–October). The BP method (2018–2019) was evaluated in an upland cotton trial arranged in a randomized complete block design with 24 cotton entries, two irrigation treatments, and two replicates per entry for each treatment. Plots were 4.50 m in length with 1.21 m alleys between plots and a total area of 0.081 ha (Melandri et al., 2021). The PSC method was evaluated in two different field trials, the first from 2019–2020 and the second in 2021. The 2019–2020 field trial was arranged in a (0–1) alpha lattice design with six cotton entries, two planting dates, three irrigation treatments, and three replicates per entry for each irrigation × planting date treatment. Plots were 10.60 m in length with 2.3 m alleys and a total area of 0.46 ha. The 2021 field trial was arranged in an augmented block design with 379 cotton entries and two replicates per entry. Plots were 6.09 m long with 1.2 m alleys and a total area of 0.92 ha. The environmental conditions during all collections were recorded by the Arizona Meteorological Network (AZMET) weather station located 0.8–1.2 km away from the plots. The weather station measured hourly air temperature which was used to determine the minimum and maximum air temperatures recorded during each collection.
The timestamp for each spectral scan (either plant leaf or white reference panel) was recorded at the time of measurement and used to evaluate both the BP and PSC methods for collection duration and variances. Variances included instrument malfunction or failure due to overheating, battery changes, and water breaks for the operators. The following calculations were made using the recorded timestamps, the total number of measurements for the collection, and the total number of plots measured during the collection.
Total collection time = T1 – T0
Time per measurement (TPM) = (T1 – T0)/total number of measured leaves
Time in plot (TIP) = (T1 – T0)/total number of measured plots
where T1 is the last recorded timestamp of the collection and T0 is the first recorded timestamp of the collection. Each plot was assessed to determine if the time in plot exceeded the average time in plot for that collection to determine the frequency of variances for each method. A variance (VAR) was determined if the time in plot was ≥ 5 seconds longer than the average time in plot for that collection. The percentage of plots with variances for each collection was also calculated (%VAR).
To determine the statistical significance of each calculated metric between the two collection methods, the SAS (SAS Institute, Cary, NC, USA) for Windows software v. 9.4 GLM (general linear model) procedure was used. The model included the collection method as the class independent variable and the calculated metric as the dependent variable. The MANOVA statement was used to test the effect of each dependent variable.
Radiance measurements from the white reference panel inside the leaf clip were expected to be consistent both within and among collections, because illumination was provided by an internal light source. However, the user manual of the spectroradiometer (ASD Inc, 2010) indicates temperature changes can affect its performance which will in-turn affect the measurements (Section B.1.5). Therefore, the white reference panel scans were assessed for stability both within and among collections, as recommended by the manufacturer (Section B.1.5). Erroneous white panel scans were removed from the dataset before evaluation. Causes for such errors included light leakage due to improper closure of the leaf clip and operator failure to switch the leaf clip from the dark panel to the white panel. Erroneous scans were easily identified in plots of spectral data versus wavelength. The minimum, mean, and maximum radiance values at each wavelength (nm) among the white reference panel scans across collections for each method were calculated. To simplify the analysis of white panel data, one collection from each year was chosen randomly for the PSC method totaling three collections, while all three BP collections were considered. To demonstrate white reference stability, the minimum, mean, and maximum radiance values for each method were graphed using the ‘matplotlib’ package for Python 3.0. The percent change at each wavelength across collections was calculated and assessed for statistical significance as described above.
The total collection times for the backpack (BP) method ranged from 00:45:16 to 03:39:59 (hh:mm:ss) while collection times for the proximal sensing cart (PSC) ranged from 02:10:23 to 04:02:13 (Table 1). No significant differences were found for total collection time (Pr > F 0.5845) or for time per measurement (Pr > F 0.0866) between the two methods. The total area covered by the BP method was 0.081 ha while the area covered by the PSC method was 0.46 ha in 2019–2020 and 0.92 ha in 2021; thus, the area covered by the PSC was significantly greater than that for the BP method (Pr > F 0.0008). The total number of variances (VAR) found for the BP ranged from 9 to 13 with percent variation (%VAR) from 12.9% to 28% (Table 1). The total variances for the PSC ranged from 0 to 10, with percent variation from 0% to 7.4% and were significantly less than the BP method (Pr > F 0.0087 and Pr > F 0.0001) respectively. Significant differences were found for time in plot (Pr > F 0.0003), where the BP method averaged 50 seconds longer in plot than the PSC method. This was due to the increased number of measurements per plot and the increased number of variances with the BP method compared to the PSC method.
Differences in the minimum and maximum air temperatures for collections with the BP method were between 1.6 and 3.2°C (34.9 and 37.8°F) while that for the PSC method were between 3.3 and 9.0°C (37.9 and 48.2°F) (Table 1). The statistical analysis showed the data collections via the PSC were conducted over a significantly (Pr > F 0.0053) wider range in air temperature as compared to the BP. The highest temperature recorded by AZMET during data collections with the BP was 41.2°C (106.2°F) while that for the PSC was 38.6°C (101.5°F) (Table 1), and they were not significantly different (Pr > F 0.0599). A significant difference (Pr > F 0.0001) was found for white panel stability between the two methods where the percent change over time and collections ranged from 1.38% to 20.36% for the BP method and 0.81% to 14.02% for the PSC method (Figure 3). Further analysis showed that the increased percent change with the BP method was due primarily to the first collection (day of year 239 in 2018, Table 1; Figure 3A) where no ice packs were used to cool the equipment. The increased radiance from collections taken in 2019, 2020 and 2021 as compared to 2018 was due equipment servicing prior to the 2019 season.
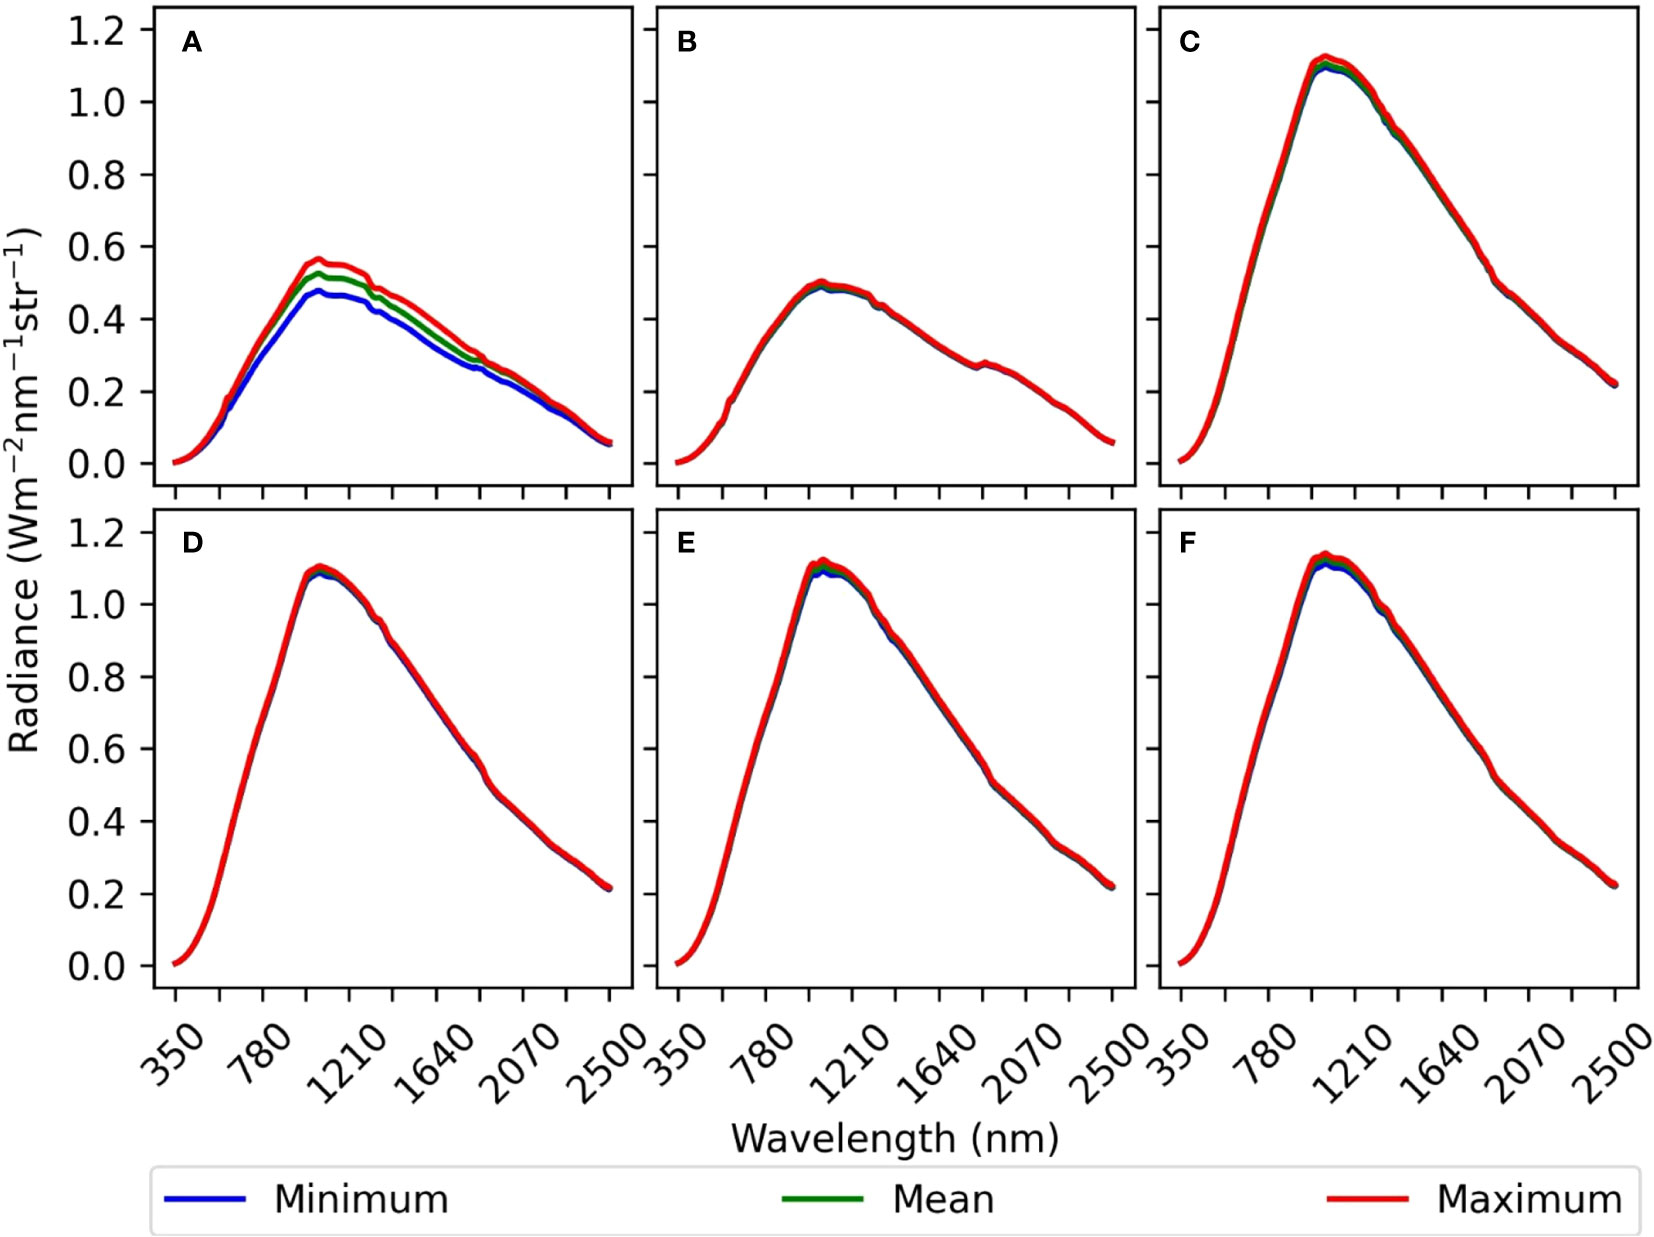
Figure 3 The minimum, mean, and maximum white panel radiance values from the 2018 (A, B) and 2019 backpack collections (C); and the randomly selected cart collections from 2019 (D), 2020 (E), and 2021 (F).
The data analysis, along with operator impressions, identified several advantages and disadvantages of the BP and PSC spectral data collection methods (Table 2). The results were described in three main categories: 1) spectroradiometer performance, 2) equipment transport, and 3) operator health and safety. The results show that the spectroradiometer operation was more efficient with the PSC method and included fewer variations caused by equipment malfunctions and battery changes. An obvious advantage for the PSC was the lack of requirement for operators to carry equipment through the field. Operators noted reduced fatigue and the ability to take more health breaks as needed. Once the BP equipment was attached to the operator’s body, it was inefficient to remove the equipment for breaks, and the operators tended toward overexertion to finish the job quickly and thus end the misery. With the PSC approach, in-field discussions amongst the operators also increased (i.e., friendly chatting), and the data collection occurred with elevated moods. The two primary disadvantages noted for the PSC method were reduced maneuverability within the field and a preference for an extra operator to help push the PSC (Table 2).
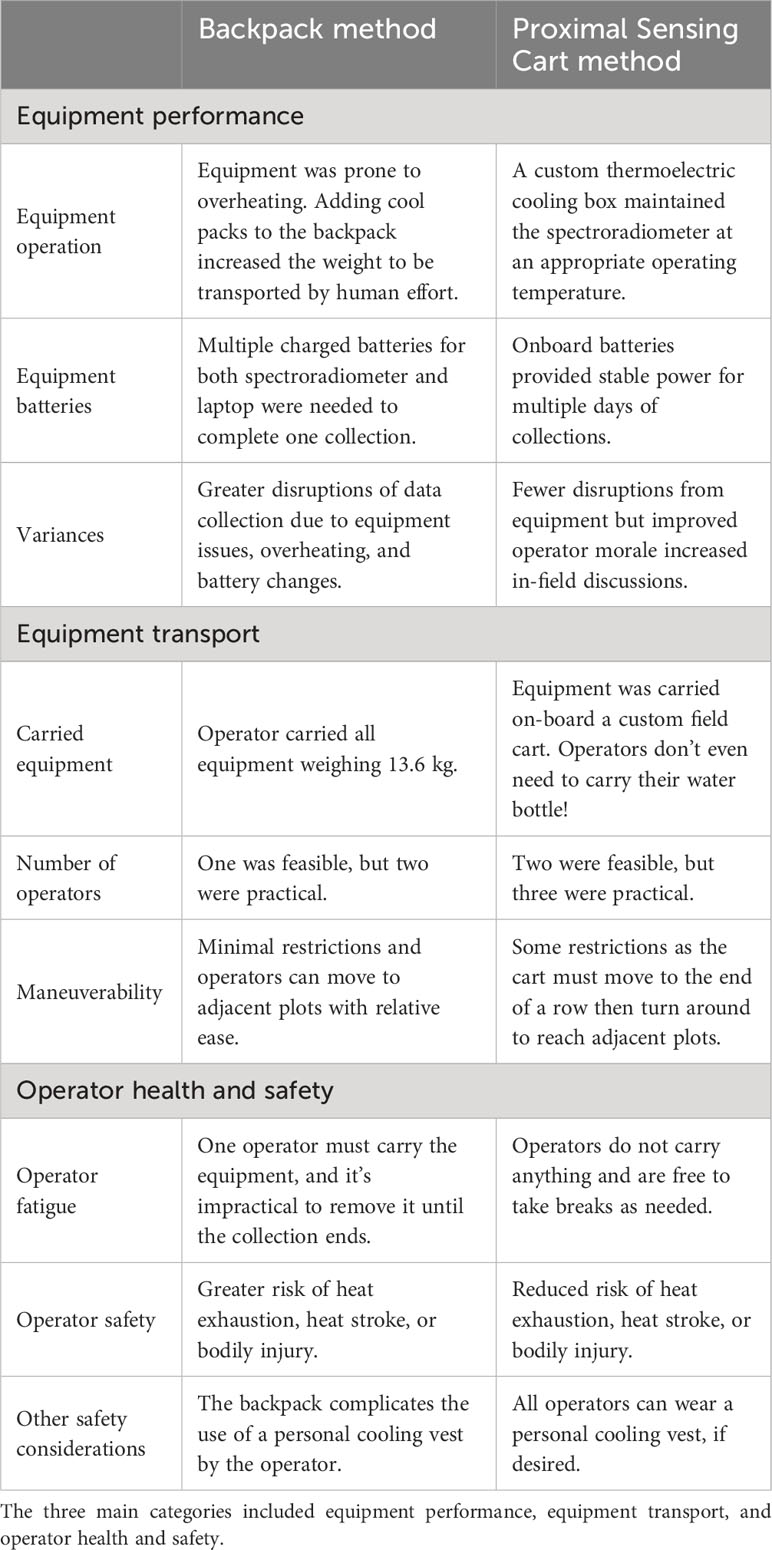
Table 2 Advantages and disadvantages for the backpack (BP) and the proximal sensing cart (PSC) methods.
Two methods were evaluated for collecting cotton leaf radiometric measurements in the field using a field spectroradiometer: the traditional backpack (BP) method and a proximal sensing cart (PSC) method. In the desert environment of the field site, the spectroradiometer, when carried in the backpack provided by the manufacturer, was prone to overheating and equipment failure. Specifically, a thermal sensor inside the spectrometer would disallow spectral data collection until the instrument was returned to normal operating temperatures. Additionally, semi-frequent battery changes were required for the BP method, which further disrupted data collection efforts and led to additional variances. The requirement to manually carry the equipment through the field was also labor intensive for the operator and increased risks for personnel safety due to operator fatigue and potential heat exhaustion. These three issues, instrument malfunction due to overheating, battery change requirements, and multiple operator safety concerns, limited the scope of spectral data collections with the BP method at daily, weekly, and seasonal scales. To alleviate these problems, a PSC equipped with a custom, thermoelectric cooling box (TCB) and onboard batteries was developed. Evaluated over three cotton seasons, the PSC with TCB method 1) prevented equipment malfunction due to overheating, 2) significantly decreased and nearly eliminated delays for battery changes as compared to the BP method, and 3) substantially reduced operator safety concerns.
The PSC method resulted in significantly reduced variations and percent variations compared to the BP method, primarily because the spectroradiometer had no overheating events and did not require battery changes when installed on the PSC. While air temperature inside the cooling box was not logged, it was measured, displayed, and frequently monitored during data collection. Stable values between 26.5–26.9°C (79.7–80.7°F) were noted throughout data collection. While future efforts could focus on logging the air temperatures as measured at multiple locations inside the box, visual assessments of monitored temperatures during data collections indicated that the TCB was effective to maintain the spectrometer at an appropriate operating temperature. Also, because no significant differences were found between the maximum temperature recorded during BP and PSC collections, the spectroradiometer had equal opportunity to overheat and fail if the TCB had been ineffective. The white panel reference data also indicated the PSC and TCB method improved the performance of the spectroradiometer, particularly by reducing variability in the white panel data within collections. This could indicate that future collections with the PSC would require fewer white panel reference measurements and reduce the overall time in the field, but further investigations are needed.
Since variances due to equipment failure or battery changes were effectively reduced with the PSC and onboard TCB, the variances that did occur with this method were primarily attributed to increased water breaks and discussion amongst the operators and other field personnel. The increased variance due to discussion is particularly evident in the last PSC collection for 2020. The recorded air temperatures for that day were relatively low which would have reduced the number of breaks for water. A similar effect of increased discussion amongst field workers was noted by Hagler et al. (2018) when comparing a vacuum method to a simple sweep-net method for arthropod collections in a cotton field. In Hagler et al. (2018), the operator and secondary field personnel were both wearing body-cameras so the number and duration of pauses due to discussion could be quantified. For future collections with the PSC, cameras could be worn by the operators to specifically identify the reasons for variances and potentially further improve collection efficiency. Despite the increased discussion amongst field personnel, the PSC method offered a marked improvement over the BP method for operator safety. Studies have shown that agricultural workers can significantly reduce their odds of heat-related illnesses by decreasing exertion and increasing water breaks and rest periods (Petitti et al., 2013), both of which were possible with the PSC method.
While the PSC equipped with the TCB was effective in preventing variances and increasing operator safety in comparison to the BP method, there were two key disadvantages. First, operating the PSC required at least two people (although three were ideal) whereas the BP collections could be conducted with one person (although two were ideal). Second, the PSC could not easily maneuver across rows to adjacent plots and instead had to be pushed to the end of the row to make the turn into adjacent plots. The maneuverability issues also caused some problems as the plants grew bigger and branches encroached into the interrow area; some damage occurred to these branches as the PSC was pushed through. With the BP method, the operator could move to adjacent plots with relative ease and could minimize damage to encroaching branches by stepping over them when feasible. No other PSC maneuverability issues or plant damage were observed during collections; however, cart performance was not a primary objective for this work, so specific notes were not taken. The PSC design has been extensively studied in several row crops at Maricopa, and additional details on performance can be found in White and Conley (2013) and Thompson et al. (2018a). The disadvantages of PSC data collection could potentially be alleviated by using a smaller PSC design as described by Thompson et al. (2018b), but further investigations are needed.
Overall, the PSC with onboard TCB provided improvements as compared to traditional methods for use of field spectroradiometers, especially with high air temperature conditions. Hankerson (2018) prevented spectroradiometer overheating by shortening data collections to avoid extreme heat, thereby reducing the amount of data collected. In the present study, the PSC with TCB enabled researchers at Maricopa to significantly increase the total field area and the number of collections in a season without experiencing equipment overheating and while also decreasing operator safety concerns. Huang et al. (2016) reported use of compressed air to cool the electronic components of an overheated hyperspectral camera, but this was not always effective at restoring camera function. They also noted that the heat altered the sensitivity of the camera, and spectral measurements from calibration panels were required more frequently. In the present study, the PSC and TCB effectively prevented overheating and increased the stability of white panel measurements, indicating the number of white panel measurements could be reduced. The PSC with onboard TCB method provides an effective method for field spectroradiometer data collections in hot and dry environments. With this method researchers can increase data collections and improve understanding of the effects of high temperatures on agricultural cropping systems.
Proximal hyperspectral measurements can provide important information on crop growth and adaption to environmental stress. To ensure collection of high-quality data throughout an Arizona cotton season (May–October) when temperatures often exceed 37°C (100°F), a proximal sensing cart with an onboard temperature-controlled equipment box was developed (Figure 2). This method reduced the number of variances caused by equipment overheating and battery changes as compared to the traditional backpack approach (Table 1). It also reduced operator fatigue and increased safety, which increased the number of collections that could feasibly be conducted throughout the growing season. Examination of white panel radiance scans showed the data from the field spectroradiometer was more stable with the novel proximal sensing cart method compared to the traditional backpack method (Figure 3). The PSC method offers a methodological improvement for obtaining spectral reflectance measurements of field crops as compared to the traditional backpack approach and other approaches reported in literature.
The datasets generated and/or analyzed during the current study are available from the corresponding author on reasonable request.
Written informed consent was obtained from the individual(s) for the publication of any potentially identifiable images or data included in this article.
AT, KT, and MC conceived of the project and its components. All authors performed collections along with acknowledged personnel. AT performed the data analysis. All authors contributed to the article and approved the submitted version.
This work was supported by Cotton Incorporated Research Grants (13-738, 17-642, and 18-384), University of Arizona Start-Up funds (Pauli), and the United States Department of Agriculture, Agricultural Research Service (2020-2100-013-00D and 2020-13660-008-00D).
We would like to thank Suzette Maneely, Matthew Hagler, Melissa Noble, Timothy Ayankojo, Angelique Abbott, Andrew Nelson, Bruno Rozzi, Sebastian Celleja, and Matthew Herritt for assistance with data collections and field management; Henry Shrock for assistance with the cooling box development; and Roger Clemo for building the custom proximal sensing cart.
The authors declare that the research was conducted in the absence of any commercial or financial relationships that could be construed as a potential conflict of interest.
All claims expressed in this article are solely those of the authors and do not necessarily represent those of their affiliated organizations, or those of the publisher, the editors and the reviewers. Any product that may be evaluated in this article, or claim that may be made by its manufacturer, is not guaranteed or endorsed by the publisher.
Mention of trade names or commercial products in this publication is solely for the purpose of providing specific information and does not imply recommendation or endorsement by the USDA. The USDA is an equal opportunity employer.
BP, backpack; PSC, proximal sensing cart; TCB, thermoelectric cooling box; MAC, Maricopa Agricultural Center; AZMET, Arizona Meteorological Network; VAR, variance; VAR%, percent variance; GLM, general linear model.
Appeltans S., Guerrero A., Nawar S., Pieters J., Mouazen A. M. (2020). Practical recommendations for hyperspectral and thermal proximal disease sensing in potato and leek fields. Remote Sens 12, 1939. doi: 10.3390/rs12121939
ASD Inc (2010). FieldSpec® 3 user manual. ASD document 600540 rev. J. Available at: www.asdi.com.
Conley M. M., Thompson A. L., Hejl R. (2023). Proximal active optical sensing operational improvement for research using the CropCircle ACS-470, Implications for measurement of normalized difference vegetation index (NDVI). Sensors 23, 11, 5044. doi: 10.3390/s23115044
Curran P. J. (1989). Remote sensing of foliar chemistry. Remote Sens. Environ. 30 (3), 271–278. doi: 10.1016/0034-4257(89)90069-2
Danner M., Locherer M., Hank T., Richter K. (2015). Spectral sampling with the ASD FieldSpec 4 – Theory, measurement, problems, interpretation. EnMAP Field Guides Tech. Report GFZ Data Serv. 008. doi: 10.2312/enmap.2015.008
Duranovich F. N., Yule I. J., Lopez-Villalobos N., Shadbolt N. M., Draganova I., Morris S. T. (2020). Using proximal hyperspectral sensing to predict herbage nutritive value for dairy farming. Agronomy 10, 1826. doi: 10.13390/agronomy10111826
Gomez-Chova L., Alonso-Chorda L., Amoros-Lopez J., Vila-Frances J., del Valle-Tascon S., Calpe J., et al. (2006). Solar induced fluorescence measurements using a field spectroradiometer. AIP Conf. Proc. 852 (1), 274–281. doi: 10.1063/1.2349354
Hagler J. R., Thompson A. L., Stefanek M. A., Machtley S. A. (2018). Use of body-mounted cameras to enhance data collection: an evaluation of two arthropod sampling techniques. J. Insect Sci. 18 (2), 40. doi: 10.1093/jisesa/iey033
Hankerson J. (2018). Automated motion control of a ground-viewing radiometer system. The University of Arizona, Graduate College, M.S. Thesis. Available at: http://hdl.handle.net/10150/631328.
Huang Y., Lee M. A., Thomson S. J., Reddy K. N. (2016). Ground-based hyperspectral remote sensing for weed management in crop production. Int. J. Agric. Biol. Eng. 9 (2), 98–109. doi: 10.3965/j.ijabe.20160902.2137
Lu B., Dao P. D., Liu J., He Y., Shang J. (2020). Recent advances of hyperspectral imaging technology and applications in agriculture. Remote Sens. 12, 2659. doi: 10.3390/rs12162659
Melandri G., Thorp K. R., Broeckling C., Thompson A. L., Hinze L., Pauli D. (2021). Assessing drought and heat stress-induced changes in the cotton leaf metabolome and their relationship with hyperspectral reflectance. Front. Plant Sci. 12. doi: 10.3389/fpls.2021.751868
Montes J. M., Technow F., Dhillon B. S., Mauch F., Melchinger A. E. (2011). High-throughput non-destructive biomass determination during early plant development in maize under field conditions. Field Crops Res. 121, 268–273. doi: 10.1016/j.fcr.2010.12.017
Pauli D., Andrade-Sanchez P., Carmo-Silva S., Gazave E., French A. N, Heun J, et al. (2016). Field-based high-throughput plant phenotyping reveals the temporal patterns of quantitative trait loci associated with stress-responsive traits in cotton. G3 6, 865–879. doi: 10.1534/g3.115.023515
Petitti D. B., Harlan S. L., Chowell-Puente G., Ruddell D. (2013). Occupational and environmental heat-associated deaths in Maricopa Country, Arizona: A case-control study. PloS One 8 (5), e62596. doi: 10.1371/journal.pone.0062596
Riccò M. (2018). Air temperature exposure and agricultural occupational injuries in the autonomous province of Trento, (2000-2013, north-eastern Italy). Int. J. Occup. Med. Environ. Health 31 (3), 317–331. doi: 10.13075/ijomeh.1896.01114
Sahoo R. N., Ray S. S., Manjunath K. R. (2015). Hyperspectral remote sensing of agriculture. Curr. Sci. 108 (5), 848–859.
Thompson A. L., Conley M. M., Herritt M. T., Thorp K. R. (2022). Response of upland cotton (Gossypium hirsutum L.) leaf chlorophyll content to high heat and low-soil water in the Arizona low desert. Photosynthetica 60 (2), 123–135. doi: 10.32615/ps.2022.014
Thompson A. L., Conrad A. V., Conley M. ,. M. (2018a). A how-to-build guide for Deadpool, a proximal sensing cart. Ag Data Commons. doi: 10.15482/USDA.ADC/1436769
Thompson A. L., Thorp K. R., Conley M., Andrade-Sanchez P., Heun J. T., Dyer J. M., et al. (2018b). Deploying a proximal sensing cart to identify drought-adaptive traits in upland cotton for high-throughput phenotyping. Front. Plant Sci. 9. doi: 10.3389/fpls.2018.00507
Thorp K. R., Gore M. A., Andrade-Sanchez P., Carmo-Silva A. E., Welch S. M., White J. W., et al. (2015). Proximal hyperspectral sensing and data analysis approaches for field-based plant phenomics. Comput. Electron. Ag 118, 225–236. doi: 10.1016/j.compag.2015.09.005
Thorp K. R., Thompson A. L., Harders S. J., French A. N., Ward R. W. (2018). High-throughput phenotyping of crop water use efficiency via multispectral drone imagery and a daily soil water balance model. Remote Sens. 10, 1682. doi: 10.3390/rs10111682
Thorp K. R., Tian L. F. (2004). A review on remote sensing of weeds in agriculture. Precis. Ag. 5, 477–508. doi: 10.1007/s11119-004-5321-1
White J. W., Andrade-Sanchez P., Gore M. A., Bronson K. F., Coffelt T. A., Conley M. M., et al. (2012). Field-based phenomics for plant genetics research. Field Crops Res. 133, 101–112. doi: 10.1016/j.fcr.2012.04.003
White J. W., Conley M. M. (2013). A flexible, low-cost cart for proximal sensing. Crop Sci. 53, 1646–1649. doi: 10.2135/cropsci2013.01.0054
Keywords: hyperspectral, spectroradiometer, upland cotton, high temperature, method
Citation: Thompson AL, Thorp KR, Conley MM and Pauli D (2023) A proximal sensing cart and custom cooling box for improved hyperspectral sensing in a desert environment. Front. Agron. 5:1195030. doi: 10.3389/fagro.2023.1195030
Received: 27 March 2023; Accepted: 06 November 2023;
Published: 23 November 2023.
Edited by:
Francesco Morari, University of Padua, ItalyCopyright © 2023 Thompson, Thorp, Conley and Pauli. This is an open-access article distributed under the terms of the Creative Commons Attribution License (CC BY). The use, distribution or reproduction in other forums is permitted, provided the original author(s) and the copyright owner(s) are credited and that the original publication in this journal is cited, in accordance with accepted academic practice. No use, distribution or reproduction is permitted which does not comply with these terms.
*Correspondence: Alison L. Thompson, YWxpc29uLnRob21wc29uQHVzZGEuZ292
Disclaimer: All claims expressed in this article are solely those of the authors and do not necessarily represent those of their affiliated organizations, or those of the publisher, the editors and the reviewers. Any product that may be evaluated in this article or claim that may be made by its manufacturer is not guaranteed or endorsed by the publisher.
Research integrity at Frontiers
Learn more about the work of our research integrity team to safeguard the quality of each article we publish.