 Yahaya Mohammad Yusuf
 Donald Kelechi Madukwe2
94% of researchers rate our articles as excellent or good
Learn more about the work of our research integrity team to safeguard the quality of each article we publish.
Find out more
ORIGINAL RESEARCH article
Front. Agron., 07 August 2023
Sec. Plant-Soil Interactions
Volume 5 - 2023 | https://doi.org/10.3389/fagro.2023.1181045
Phosphorus (P) is an essential nutrient for tomato (Solanum lycopersicum L.) production, as it stimulates root growth by improving water use efficiency and nutrient uptake. It also helps control the metabolic processes of ATP (energy), sugars, and nucleic acids. Therefore, it is imperative to effectively manage the phosphorus requirements of tomatoes to bolster their productivity. The objective of this study was to evaluate the effectiveness of three different soil P testing methods that are suitable for the soils of Kano State, Nigeria, and to develop a critical P-value for fertilizer recommendations for tomatoes. Accordingly, sixty topsoil samples were collected for soil available P testing according to the Bray II, Mehlich 3, and Olsen methods. Moreover, to establish the phosphorus critical value (Pc) for tomatoes, a field experiment was conducted with seven different rates of P using triple super phosphate fertilizer (TSP), viz., 0, 15, 30, 45, 60, 75, and 90 kg P/ha, laid out in a randomized complete block design with three replications on 15 experimental sites representing the various agroecological zones of the state. Phosphorus fertilizer was applied and incorporated into the soil 1 week before tomato transplanting. Then, soil samples from 0 to 20 cm depth were taken 3 weeks after transplanting from all the plots across the experimental sites for separate Mehlich 3, Bray II, and Olsen extractable P analysis to determine the critical soil P (Pc) test. The study revealed that available P was varied and increased in the order of Olsen (2.19 ppm)< Mehlich 3 (5.37 ppm)< Bray II (5.44 ppm), and the Mehlich 3 and Bray II extraction methods were strongly correlated, whereas Olsen underestimated the available P, showing a weak correlation with both Mehlich 3 and Bray II. Furthermore, the study showed that phosphorus critical (Pc) values were 17.00, 14.00, and 4 ppm for Mehlich 3, Bray II, and Olsen respectively. Finally, Bray II was a more reliable method for estimating the available P on moderately acid soils as it showed the highest correlation r = 0.83 with the relative yield of the tomatoes and, therefore, was the most effective method for developing the equation for the soil test-based phosphatic fertilizer recommendation for maximizing tomato production in the soils of Kano State. Hence, the equation developed for the P fertilizer recommendation (Pr) for tomatoes in Kano State was found to be “Pr (kg P2O5 ha−1) = (14.0 − Pi) × 9.02”.
Tomato (Solanum lycopersicum L.) is one of the most significant plants cultivated for its delicious fruits. It is also a great source of vitamins, minerals, and antioxidants, which reduce the risk of cancer and heart disease and promote overall good health in people (Tibagonzeka et al., 2018). According to the National Horticultural Research Institute (NIHORT, 2023), Nigeria produces 2.3 million metric tons of tomatoes annually, making it the second largest producer in Africa. However, this falls short of the expected annual demand of 3 million metric tons (NIHORT, 2023). Hence, there is a need to increase local tomato production to bridge the gap between the demand and supply. Kano State is one of the largest producers of tomatoes in Nigeria (Usman, 2019), accounting for approximately 7.5% (44,020 ha) of the nation’s total land area under tomato production (Plaisier et al., 2019). The state has a favorable environment that is excellent for the cultivation of tomatoes and is situated where the Central and Northern regions of Nigeria converge (Van der Waal, 2015). The most populous state in Nigeria and the commercial hub of the entire northern region is Kano State (National Population Commission, 2006). However, low soil fertility is acknowledged as a significant obstacle in raising food production and farm income in Nigeria (Okojie, 2018). Phosphorus (P) is generally one of the most growth-limiting nutrients for crop production in tropical soils, second only to nitrogen. According to Ogundare et al. (2015), the nutrients most commonly deficient in Nigerian soils that most frequently limit crop yield are nitrogen, phosphorus, potassium, magnesium, and, to a lesser degree, sulfur and zinc. Phosphorus is an essential component of life on the planet. It is essential for all living organisms because it is involved in nearly every important metabolic activity (Smil, 2000). For example, adenosine triphosphate (ATP) plays a key role in energy transfer. According to Smil (2000) and Ruttenberg (2003), phosphorus is found in cell membranes as phospholipids, a component of nucleotides, and a key component in the construction of deoxyribonucleic acid (DNA) and ribonucleic acid (RNA). Furthermore, plants rely on phosphorus to ensure photosynthetic energy production (Nisar et al., 2019). Phosphorus plays a central role in tomato production by stimulating and developing the roots, thereby improving water use and nutrient uptake efficiency, increasing fruit yield and ripening, and reducing the number of green fruits at harvest (Dias et al., 2009). The main objective of soil P testing has always been to determine the “optimum” soil phosphorus concentration required for optimum plant growth, and the need for additional fertilization or manuring so that the financial return on investment in phosphatic fertilizer could then be predicted (Sims, 2000). Additionally, according to Sims (2000), soil P testing can be used to categorize soils based on the likelihood of an economic response to P based on their physical and chemical properties; to keep track of the P supplying capacity of soils, estimating the time before fertilization would once again be necessary; and, most recently, to monitor the environmental effects of P fertilization.
Nutrient mining has occurred because of the low-input agriculture practiced in the nation, as farmers use insufficient nutrient inputs, inappropriate quality, and inefficient fertilizer combinations. However, there has been no concerted effort to develop phosphorus fertilizer recommendations for tomato production in Nigeria based on soil tests (Ogundare et al., 2015). This trend results in a profoundly unbalanced composition of soil nutrients, which eventually lowers potential crop yield. (Tonfack et al., 2009). Research on phosphatic fertilizer recommendations using soil test methods is in the early phases in Nigeria. Most of the research on P fertilizer recommendations in Nigerian soil has been based on agronomic and blanket recommendations (Ogundare et al., 2015). Furthermore, the fertilizer recommendations for nitrogen and phosphorus developed by the Food and Agricultural Organization (FAO) 40 years ago (Food and Agriculture Organization FAO, 1984) and extended to various agro-ecologies in the country did not consider the nutrient requirements of different crop types, variations in nutrient availability in different soil types, or the effect of climate on nutrient availability. So far, this approach has resulted in over- or under-estimation of fertilizer demand, resulting in either financial loss or lower productivity, or posing consequences to the environment. Hence, this study was therefore designed to (i) evaluate different P extraction methods (Olsen, Bray II, and Mehlich 3) for sustainable and economic use of phosphorus fertilizers, (ii) test the efficacy and effectiveness of selected soil test P methods, and to develop a critical phosphorus level for fertilizer recommendation for tomatoes.
This study was conducted between January and June 2022 in five Local Government Areas of Kano State. Areas of the state with a high tomato production density were chosen for the research, including Dawakin Kudu, Bunkure, Wudil, Warawa, and Gezawa Local Government Areas (LGA). The state is situated on a territory of 20,280 km2 in the Northern part of Nigeria between latitude 12.05°N and longitude 8.20°E) of the Greenwich Meridian. (Google Earth, 2022). The mean annual rainfall is 700 mm in the north to 1,200 mm in the southeast, and the monthly distribution pattern is the same throughout the area (Abah et al., 1979). This study was conducted using flood irrigation during the dry season, from January to June 2022. The climate of Kano State is ideal for growing tomatoes (Van der Waal, 2015). The region experiences tropical, rainy, and dry weather conditions. The dry season lasts from mid-October to May, during which the mean monthly temperature is between 21°C and 23°C, with a daily temperature range of 12°C to 14°C. At this moment, the Harmattan winds are dominant. Similar to the dry season, the wet season lasts from June to September; the mean monthly temperature during this period is more than 30°C, and the daily range is up to 20°C.
A three-stage sampling procedure was used to select locations with a high density of tomato farmers. From a list of regions recognized by the Kano State Agricultural and Rural Development Authority (KNARDA) as significant tomato production areas, five Local Government Areas (LGAs) were selected at random for the first stage (Figure 1). In the second stage, a voluntary sampling method was adopted to select 15 communities that were actively involved in intensive tomato production, taking into consideration the variability of the sites. So, Shadai, Sarai, Jido, (Dawakin Kudu LG), Tsamabaki, Zanga, Jaroji, (Bunkure LG), Yarka, Utai, Makera (Wudil LG), Imawa, Garin Dau, Tangar (Warawa), Abasawa, Dagazam, and Gunduwawa (Gezawa LG) were the communities selected. In the third stage, 15 tomato farmers (one from each community) were selected for the study using a simple random sampling procedure.
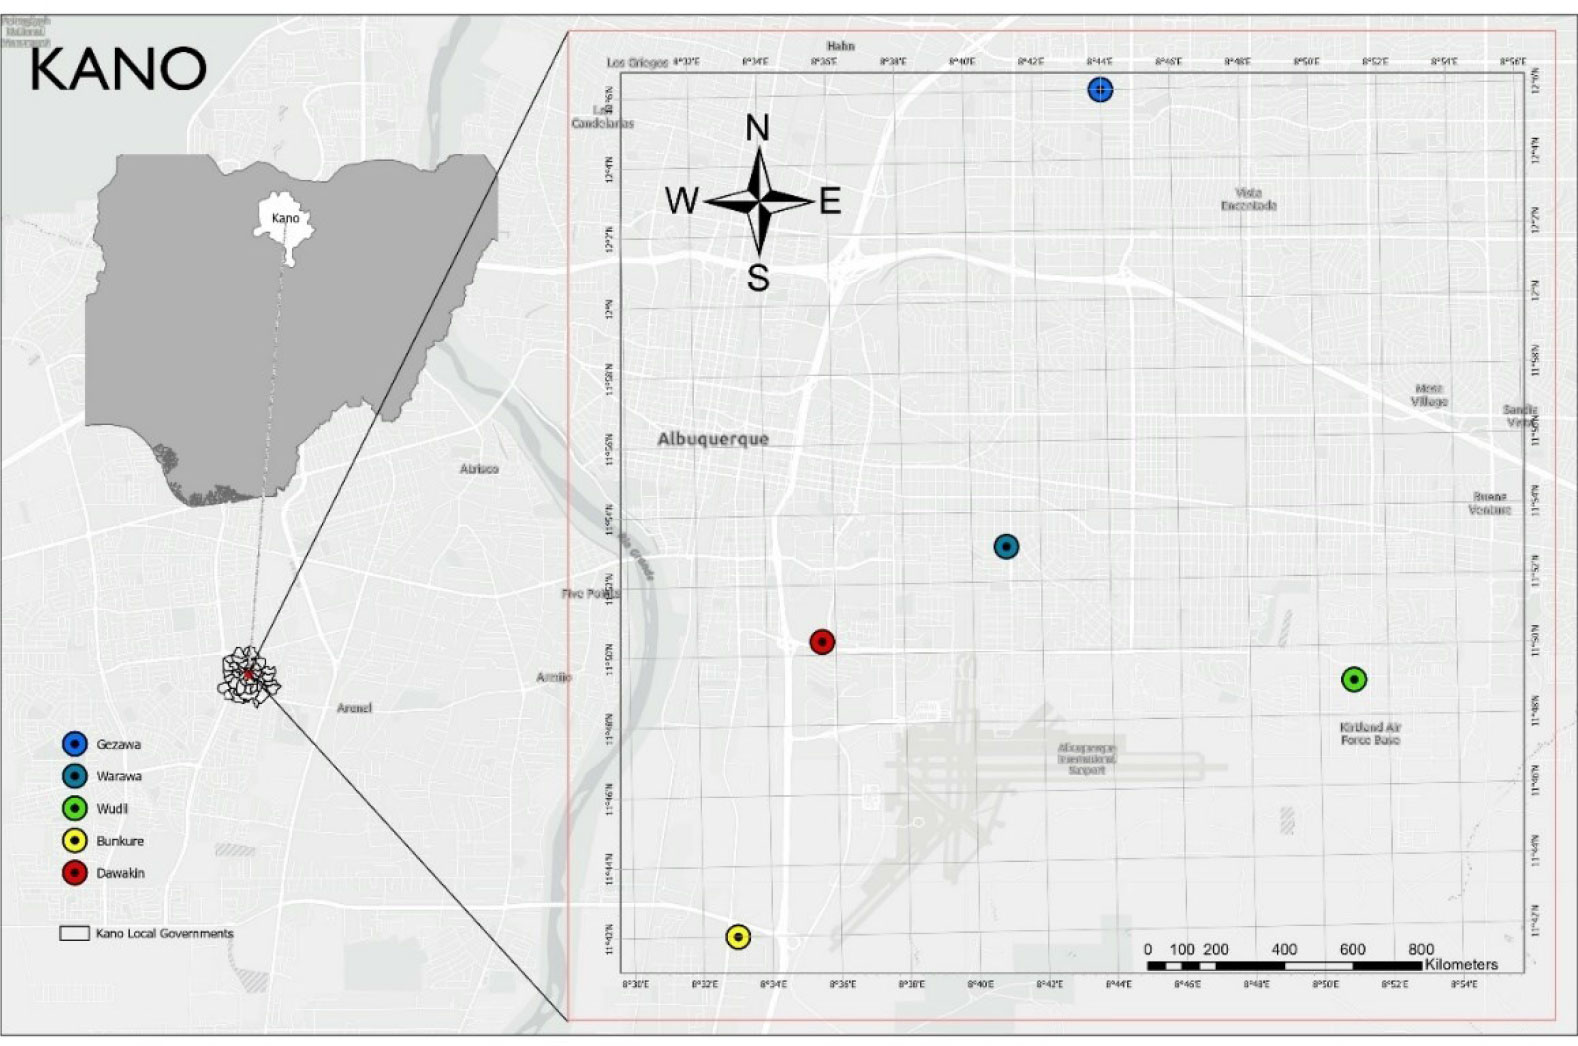
Figure 1 Location Map of the selected five local governments in Kano State, Nigeria.
To determine the physical and chemical properties of the soils from all the experimental sites, soil samples were collected from each of the 15 sites, and then pH, soil particle size distribution, cation exchange capacity (CEC), and total nitrogen were determined using the macro-Kjeldahl method (Bremner and Mulvaney, 1982). Exchangeable acidity, Ca and Mg contents, and soil organic carbon were analyzed.
Five (5) sampling points were chosen randomly from each of the 15 farmers’ fields. Samples were collected at a depth of 0–20 cm using a simple random sampling procedure. Four (4) composite soil samples were collected from the plots of each farmer. A total of 60 composite soil samples were collected. After sampling, the soil was dried at 37°C, sieved through a thickness of 2 mm, and stored at room temperature. The available P was then analyzed using the three different methods, namely Bray II, Mehlich 3, and Olsen P.
In this study, three methods for the determination of soil available P (Olsen-P, Bray II, and Mehlich III) were used as described below.
Bray II: This technique was applied in accordance with Bray and Kurtz (1945). Two grams of the soil sample was weighed into a 50-mL Erlenmeyer flask. The beaker was filled with (20 mL) of a 0.03 mol/L NH4F solution and shaken for 5 min at 200 rpm at a temperature between 24°C and 27°C. To obtain a colorless filtrate, 1 cm3 (~200 mg) of charcoal was added to the flask. The extracts were filtered through Whatman No. 42 filter paper, and the filtrate was measured for P using a spectrophotometer (882 nm) with a blank and standards were prepared in the Bray II extraction solution.
Mehlich III: This method was introduced by Mehlich (1984). Two grams of the soil sample was weighed into a 50-mL Erlenmeyer flask. Twenty milliliters of 0.2 mol/L of CH3COOH solution was added to the flask and shaken at 200 rpm for 5 min at room temperature (24–27°C). To obtain a colorless filtrate, 1 cm3 (~200 mg) of charcoal was added to the flask. The extracts were filtered through a Whatman No. 42 filter paper. and the filtrate was measured for P using a spectrophotometer (882 nm) with a blank and standards were prepared in the Mehlich 3 extraction solution.
Olsen P: Olsen extraction procedure (Olsen et al., 1954). In this method, 50 mL of 0.5-M sodium bicarbonate (NaHCO3) pH-adjusted to 8.5 was used to remove soil P from 2.5 g of soil. P was quantified using a spectrophotometer after the mixture was shaken for 30 min, the suspension was filtered, and the filtrate was acidified (882 nm).
The P-critical and P-requirement factors and hence the equation for the P fertilizer recommendation, were determined through field experiments.
The experiment was conducted using a randomized complete block design (RCBD) under a flood irrigation system. For the determination of P-critical and P-factor, seven (7) P treatment levels (P0 = 0, P15 = 15, P30 = 30, P45 = 45, P60 = 60, P75 = 75, and P90 = 90 kg P ha−1) were tested with three replications on 15 farmers’ fields, resulting in 315 experimental plots. The rates were chosen to have a wide range of doses to avoid under- and over-fertilization with P fertilizer. The full dose of phosphorus indicated in each treatment was applied in the form of triple superphosphate (TSP) by broadcasting 3 days before tomato seedling transplantation and incorporated into the soil. This was done to ensure that the fertilizer was properly incorporated into the soil and was available for plant uptake because longer incubation times can lead to a decrease in the availability of the P fertilizer for plant uptake, as reported by Akhtar and Alam (2001). All treatments received an equal amount of nitrogenous fertilizer at 150 kg N ha−1 in the form of urea and potassic fertilizers at 200 kg K2O ha−1 in the form of muriate of potash. This was applied following the trial conducted by Kareem et al. (2020), who reported that a seasonal nitrogen application of 150 kg/ha and potash of 200 kg K2O is nearly always adequate for maximum tomato fruit yield and quality. The rate was applied to the split technique of application, in which the first half was applied during transplantation and the second one at 6 weeks after transplantation. Calcium nitrate (CN) was also applied 6 weeks after transplantation as a source of both nitrogen and calcium (100 kg ha−1). CN was applied to supply the required amount of calcium and to balance the remaining nitrogen.
After 3 weeks of applied P fertilizer and transplanting, soil samples were collected randomly at a depth of 0–20 cm from each of the 315 experimental plots and analyzed using the Bray II, Olsen P, and Mehlich 3 methods. Before transplanting, seeds of tomato (variety Chibli) were sown in the nursery in a greenhouse for 1 month. In the field, the experimental sites were manually cleared using a cutlass and later demarcated with hoes. Seedlings were transplanted at a rate of one plant per hole at a spacing of 75 cm × 50 cm. The plot size was 3 m × 2 m (6 m2). The spacing between each plot and replication was 0.5 m and 1 m, respectively.
At maturity, the relative yield was calculated from each of the 315 experimental plots (expressed as a percentage of maximum yield) as follows (Lima et al., 2020):
where yield = from the control plot, and maximum yield = from the fertilized plot.
The Cate–Nelson graphical technique (Cate and Nelson, 1965) was used to determine the critical P level for each of the available P determination methods. It was determined by plotting the relative yields (%) on the y-axis against the soil test P-values (ppm) on the x-axis. Subsequently, the Quadrant Diagram of the Plant–Soil Relationship (Higo et al., 2018) was used. This method separates the points into four quadrants (i.e., I, II, III, and IV), and the objective of this approach is to reduce the number of points in the upper-left and lower-right quadrants. The data points in the upper-left and lower-right quadrants indicate deviations from the expected behavior. Data points lying in the upper left quadrant indicate situations in which the soil test level is below the critical level; thus, a response would be expected. When the soil test level is above the critical level, the points in the bottom-right quadrant represent situations in which no response is anticipated.
The P requirement factor (Pf), which is the amount of P in a kilogram in a sample needed to raise the soil P by 1 ppm (Abebe and Abreham, 2019), was calculated (Table 1). This enables the determination of the amount of fertilizer required per hectare to bring P to the critical level.
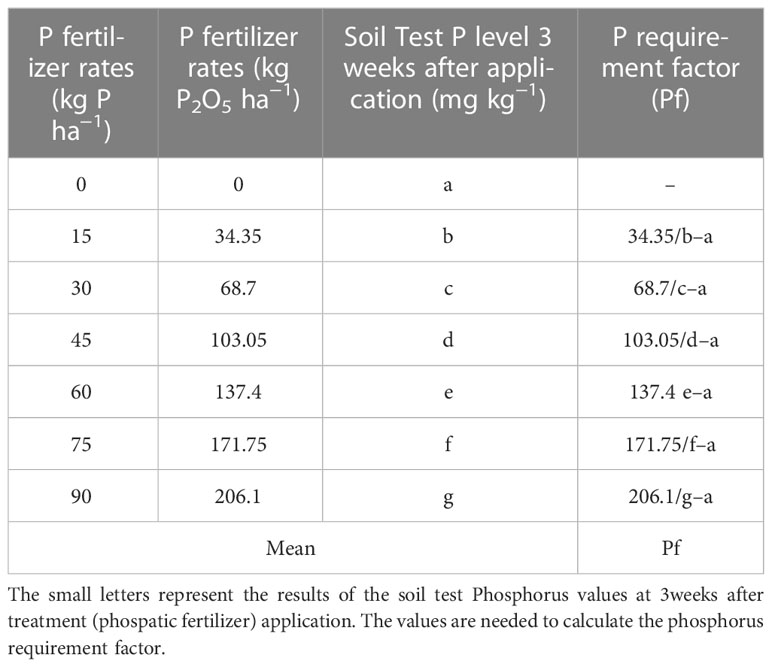
Table 1 Steps followed to calculate P requirement factor (Pf).
Phosphorus fertilizer requirement (Pr), i.e., the amount of P (kg P2O5 ha−1) to be applied, was calculated using the following formula
where Pr is the P fertilizer requirement (kg P2O5 ha−1), Pc is the P critical value, Pi is the initial soil P value, and Pf is the P requirement factor.
The data generated from the soil analysis using the three methods were analyzed using descriptive statistics. The mean, median, and coefficient of variation (standard deviation, and minimum and maximum values) were calculated to compare methods. Similarly, Pearson correlation coefficients were calculated by using the R software system to know how well they correlate; and the lm () function in R (R Core Team, 2019) was used to determine linear relationships between soil test results, and graphs were produced using the ggplot2 package (Wickham, 2016).
The physical and chemical properties of the soils at the study sites are listed in Table 2. It was clear that thesoils differed in their properties. The textures, levels of organic carbon, cation exchange capacity (CEC) characteristics, calcium (Ca), magnesium (Mg), and pH differed significantly between the sites. On average, the soils were light textured, slightly acidic, and relatively poor in organic carbon. The pH (in water) ranged from a moderately acidic value of 4.55 in Imawa, Warawa Local Government, to a slightly acidic value of 6.81 in Shadai, Dawakin Kudu Local Government of Kano State. The difference in pH among the locations was probably due to the variation in the amount of precipitation across the location. For example, the Warawa local government is in the northern part of the state with a high amount of rainfall of approximately 1,100 mm, which decreases northward from over 1,100 mm to 550 mm (Aliyu, 2009). The organic carbon contents of the soils ranged from 0.32% to 1.32% and the CEC ranged from 2.25 to 8.23 Cmolc/kg soils. On average, it was also clear from the ratio of sand, silt, and clay in the soils that the soils were primarily sandy loam in texture. As shown in Table 2, the evolution of available phosphorus in the soils and the efficiency of the extraction method are affected by differences in soil pH and Ca content, which is in agreement with the findings of Abdu (2006), who reported that the solubility, availability, and extractability of P in the soil are influenced by the prevailing pH and Ca content.
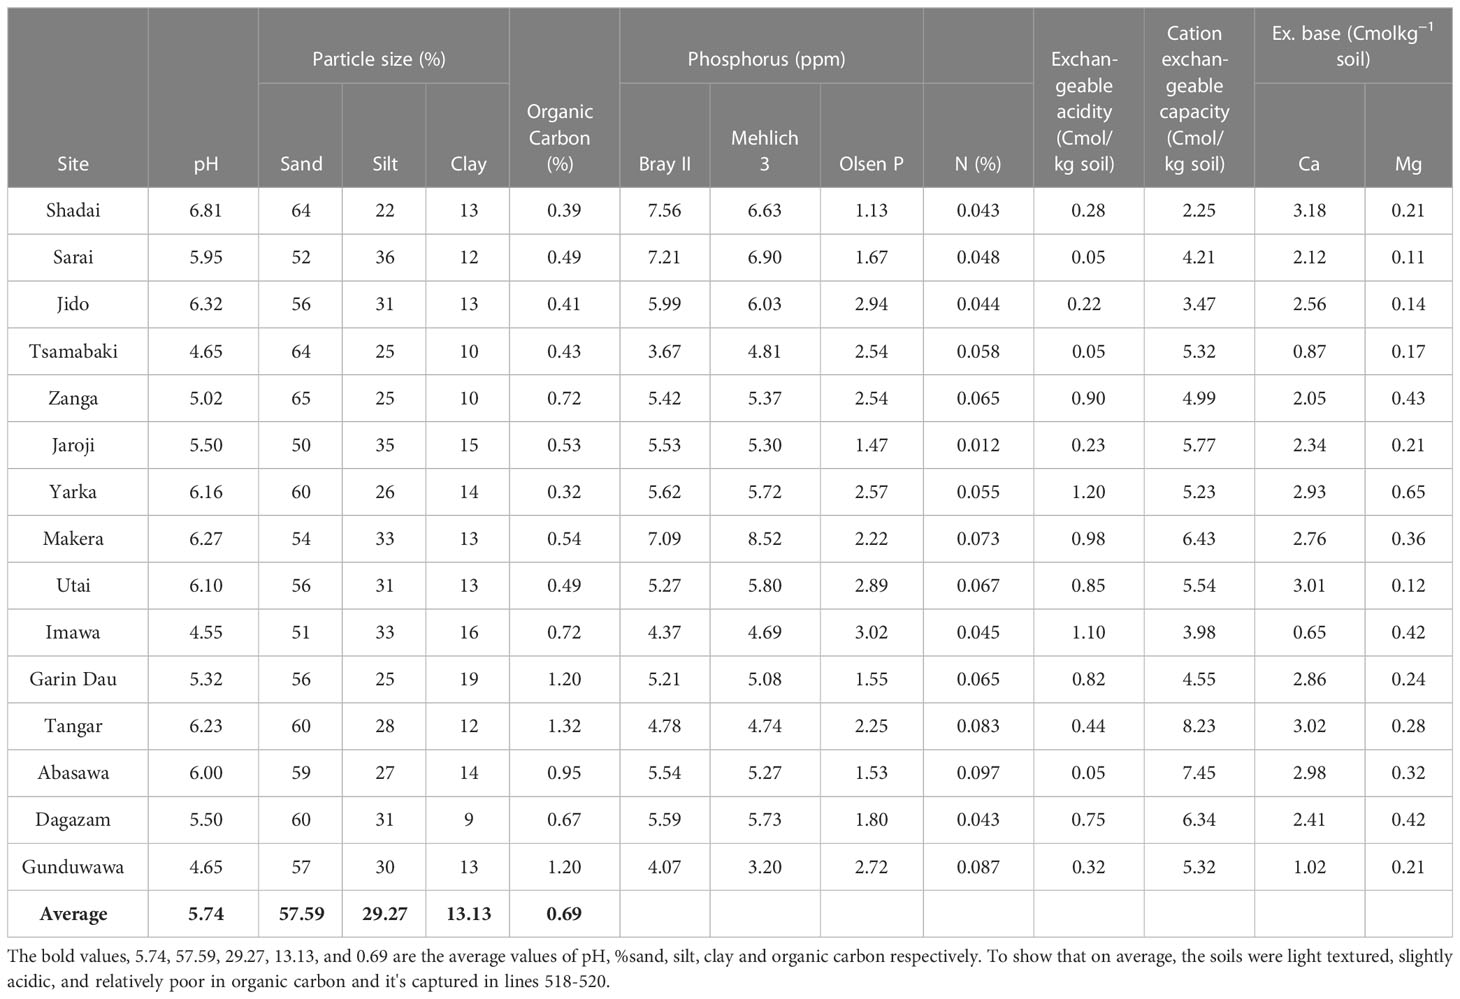
Table 2 Basic soil properties at the 15 experimental sites.
The P extractability in relation to soil properties showed that the P extracted with all three extraction methods was negatively correlated with calcium content and soil pH (Table 3). This trend seems reasonable because Ca may bind readily with available P in Ca phosphates, thereby fixing P in the soil. Zbíral (2000) discussed the strong effect of prevailing pH on acidic extraction methods. Zorn and Krause (1999) suggested that a higher Ca content may increase the pH of the extraction solution and diminish the effectiveness of the extraction methods.
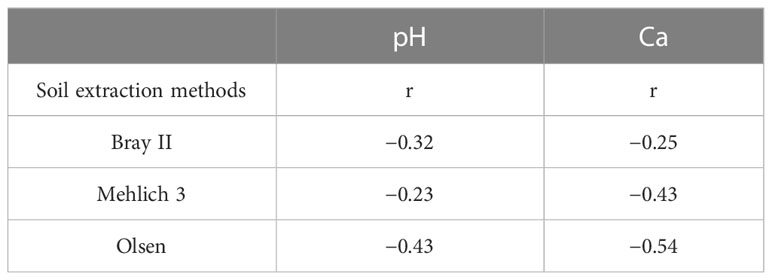
Table 3 Correlation coefficients between the three soil phosphorus extraction methods and soil pH and Ca content (n = 60), P<0.05.
The observed trend generally appears to reflect the soil pH and its impact on the availability of P. Soils with a pH less than 5, as in soils from Tsamabaki, Imawa, and Gunduwawa, have relatively less available P from all the extraction methods compared to other soils with a pH greater than 5.5. The low extracted P may be due to the fixation of P by the oxides of aluminum (Al) and Fe. Zang et al. (2001) reported that the phosphorus fixation process reaches its highest peak in the acidic region of pH 4–5.5, where P precipitates with iron and aluminum.
Bray II and Mehlich III extraction methods revealed that Shadai, Sarai, and Makera soils, all from the Dawakin Kudu local government area, had considerably more P than soils from other locations. These locations had a pH between 5.5 and 6.81, which is considered the ideal pH for phosphorus availability.
The P extracted using the three extraction techniques (60 soil samples) was processed and is presented in Table 4. It includes the mean, median, and standard deviation as well as the minimum and maximum values.
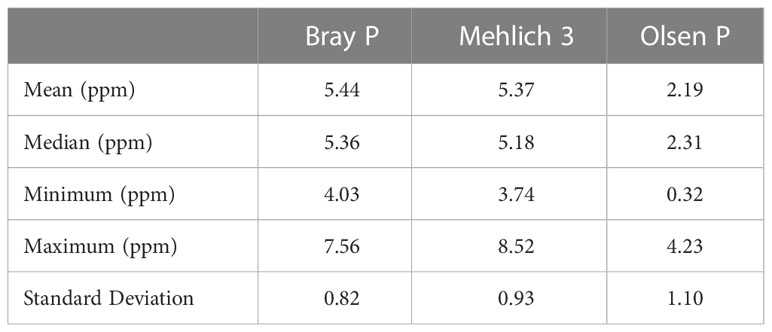
Table 4 A Comparison of the amount of phosphorus extracted by the three extraction methods (ppm); n = 60.
On average, the efficiency of the methods increased in the following order: Olsen< Mehlich 3< Bray II (Table 4). This sequence is consistent with the findings of Wuenscher et al. (2015). While the Olsen method yielded an average P concentration of less than 5 ppm, the Mehlich 3 and Bray II methods yielded similar average results. For Mehlich 3, the maximum and minimum measured values were 8.52 and 3.74, respectively. The Bray II method had the narrowest range, with the highest P-value of 7.56 mg kg−1 and the lowest value of 4.03 mg kg−1. Wuenscher et al. (2015) and Saggar et al. (1999) suggested that a wider range of extracted P was advantageous because of easier categorization in P status groups. This is especially important in routine soil testing, when the results provide a basis for fertilization recommendations.
The lowest extractable amount of P (0.32 ppm) from soil was found using the Olsen method, whereas the highest amount (8.52 ppm) was found using the Mehlich 3 method (Table 4). The fact that the soils were often moderately acidic may account for the lowest extraction detected with Olsen, which is consistent with the prevailing opinion that the method is better suited for calcareous soils, particularly those with >2% calcium carbonate (Frank et al., 1998). In this study, the Olsen method was not found to be a suitable method for detecting available P in acid soils and this was in contrast to the earlier report of Fixen and Grove (1990), which stated that Olsen is effective in the determination of P in acid soils. Likewise, Zhaohai et al. (2013) found that the Olsen P method may have overestimated bioavailable P in acidic soil because the high pH (i.e., 8.5) of NaHCO3 extractant may dissolve non-bioavailable P, such as Fe-P and Al-P.
The correlation analyses that showed the relationships among soil P extractants are shown in Figures 2A–C. The figures illustrate that the correlation among the P-values from the extraction methods was positive, indicating that as the value of P determined by one method increased, the value of the other method also tended to increase. Notably, the highest correlation coefficient was found between Bray II and Mehlich 3 (Figure 2A, r = 0.75), suggesting that the P fractions measured using these two methods were generally applicable to P bioavailability studies in acidic soils. This agrees with the findings of Azeez et al. (2013), who reported that the Bray II and Mehlich 3 correlation was significant, with a value of 0.72. Similarly, Wuenscher et al. (2015) reported a high correlation of 0.94 between Bray II and Mehlich 3. The lowest correlation was observed between Bray II and Olsen P (Figure 2C, r = 0.037). Furthermore, the close correlation of Bray II and Mehlich 3 is likely due to the underlying similar mechanism for P extraction (phosphate release through ligand exchange with F−) as reported by Tran and Simard (1993) that for acid soils, the fluoride in the Bray II and Mehlich 3 methods enhances P release from aluminum phosphates by decreasing Al activity in the solution through the formation of various Al–F complexes. Fluoride is also effective in suppressing the re-adsorption of solubilized P by soil colloids. Flavio et al. (2011) also reported that the amount of P extracted by Mehlich 3 correlated (0.82) with Bray II extractable P in soils with a pH less than 7.4 and with Olsen-extractable P in soils with pH 7.4 or greater. The coefficients of correlation for the regression equation varied. Figure 2A shows that Bray II is strongly related to Mehlich 3; the regression equation is Mehlich 3 = 0.8548 (Bray II P) + 0.7218; r = 0.75, P<0.001. It then implies that the equations could be used to predict either of the parameters.
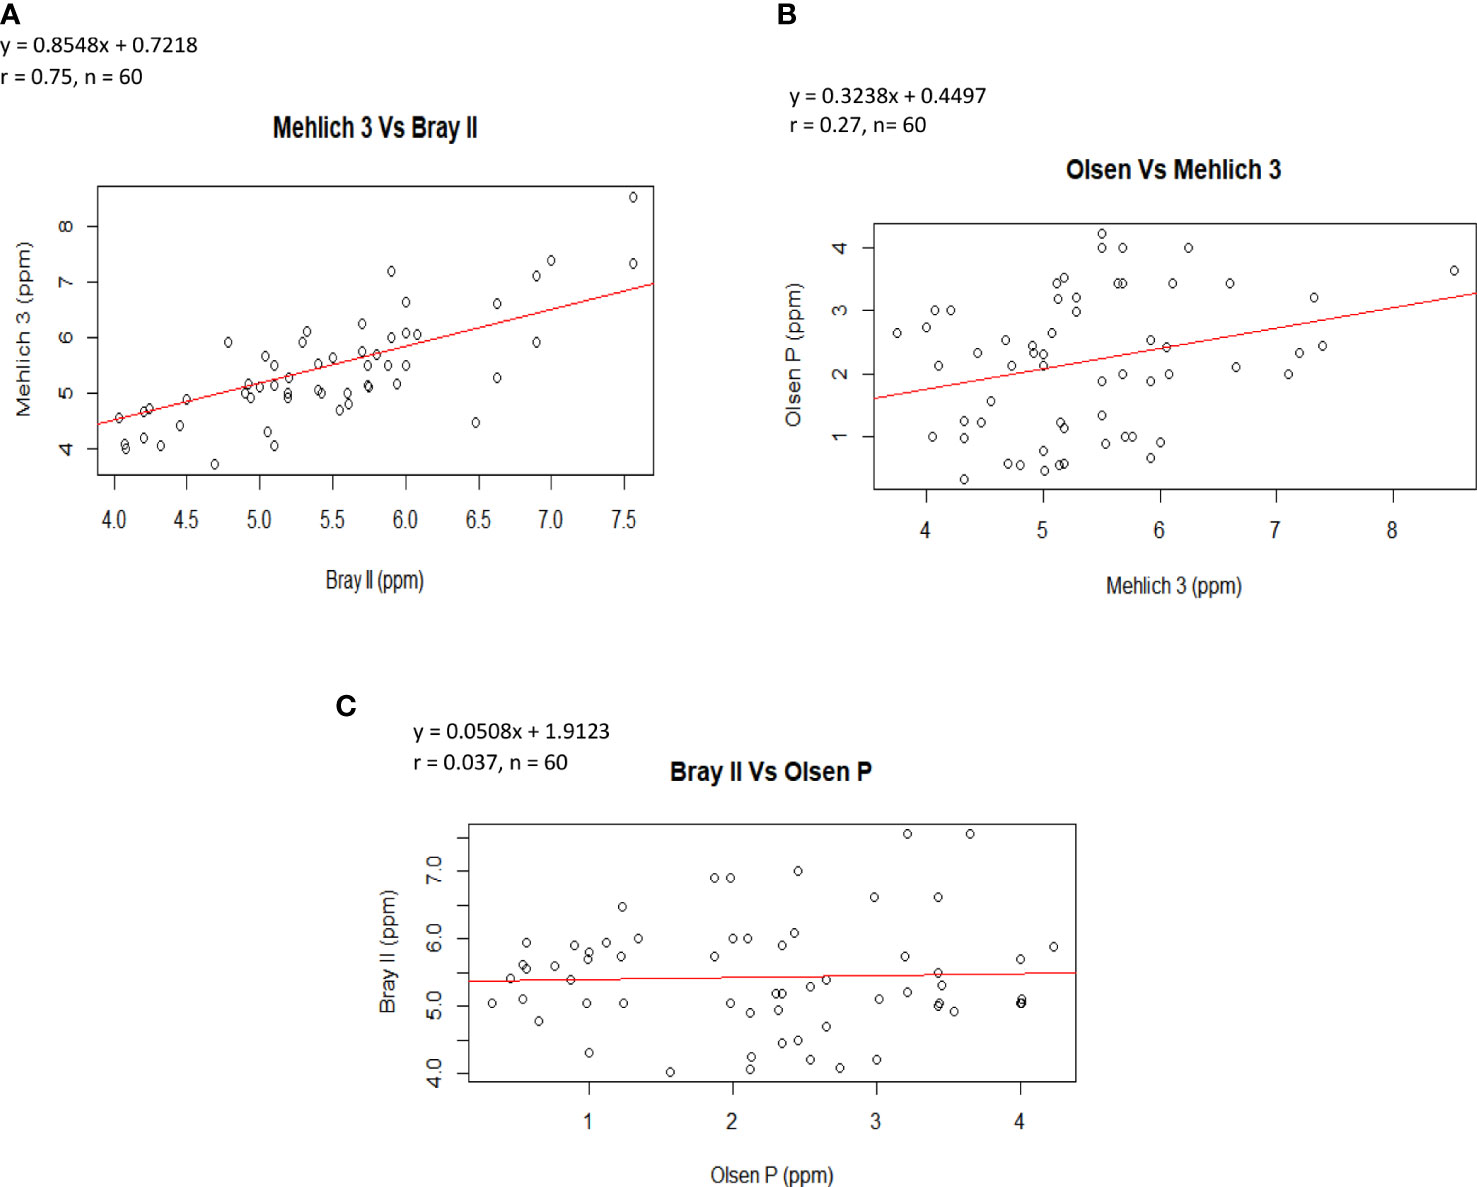
Figure 2 Correlation between amounts of P extracted by (A) the Mehlich-3 and Bray II extraction methods (B) Olsen and Mehlich 3 extraction methods and (C) Bray II and Olsen P extraction methods.
The P-critical values for each of the three extraction methods were determined using the Cate–Nelson graphical techniques (Cate & Nelson, 1965), as shown in Figures 3A–C. The scatter diagrams depicted in the figures show the relationship between the relative yield (%) of tomatoes and the P available in the soil (0–20 cm) extracted using the three extraction methods (Mehlich-3, Bray II, and Olsen methods). Accordingly, Figures 3A–C show that the critical P levels of Mehlich 3, Bray II, and Olsen-P for tomatoes were 17.00, 14.00, and 4.00 ppm, respectively. The critical levels obtained presented the concentration of P nutrients above which the tomato was adequately supplied and below which the tomato was deficient in P nutrient. Figure 3 shows that the exact relationship between the P level in soil and relative yield varied considerably with the extraction methods; the general shapes of this relationship were relatively consistent. At low levels of extractable P (below the critical level), tomato yield is limited by insufficient P. As the soil test P level increased, the yield increased to 80% of the relative yield, and the critical level was reached where the P nutrient was no longer limiting the tomato yield, and thus the yield levels out. From an agronomic perspective, the concentration of the soil test P-value extracted using an effective extraction method should correlate sufficiently with the crop response. In our study, the correlation between the relative yield of tomatoes and extractable P by all the studied extraction methods was quadratic (Figures 3A–C). The soil test value obtained for both Mehlich 3 and Bray II were highly correlated with the relative yield of tomato (r = 0.65) and 0.83, respectively, while the Olsen values show less correlation (r = 0.41). Similar results have been reported by Qiang et al. (2019), in which an 88-mgkg−1 critical level was found for Mehlich 3 and a 10-mgkg−1 critical level was found for Olsen for tomatoes with r = 0.75 and 0.52, respectively and concluded that the different results might be a result of different soil-P sorption and extraction method capacities. Comparing the critical P-values of the Mehlich 3 and Bray II extraction methods in our study (Figures 3A, B), the two methods tended to agree when evaluating available P in soil from different locations at the experimental sites. The Mehlich-3 and Bray II extraction methods indicated more available P than the Olsen extractant for all soils analyzed. This finding is consistent with earlier reports by Zhaohai et al. (2013). The critical levels for tomatoes obtained from Mehlich 3 and Bray II were fairly similar and far from the value obtained with Olsen, which was very low, implying that the Olsen P extraction method underestimated available P in the soils, and this might lead to an inappropriate P fertilizer recommendation.
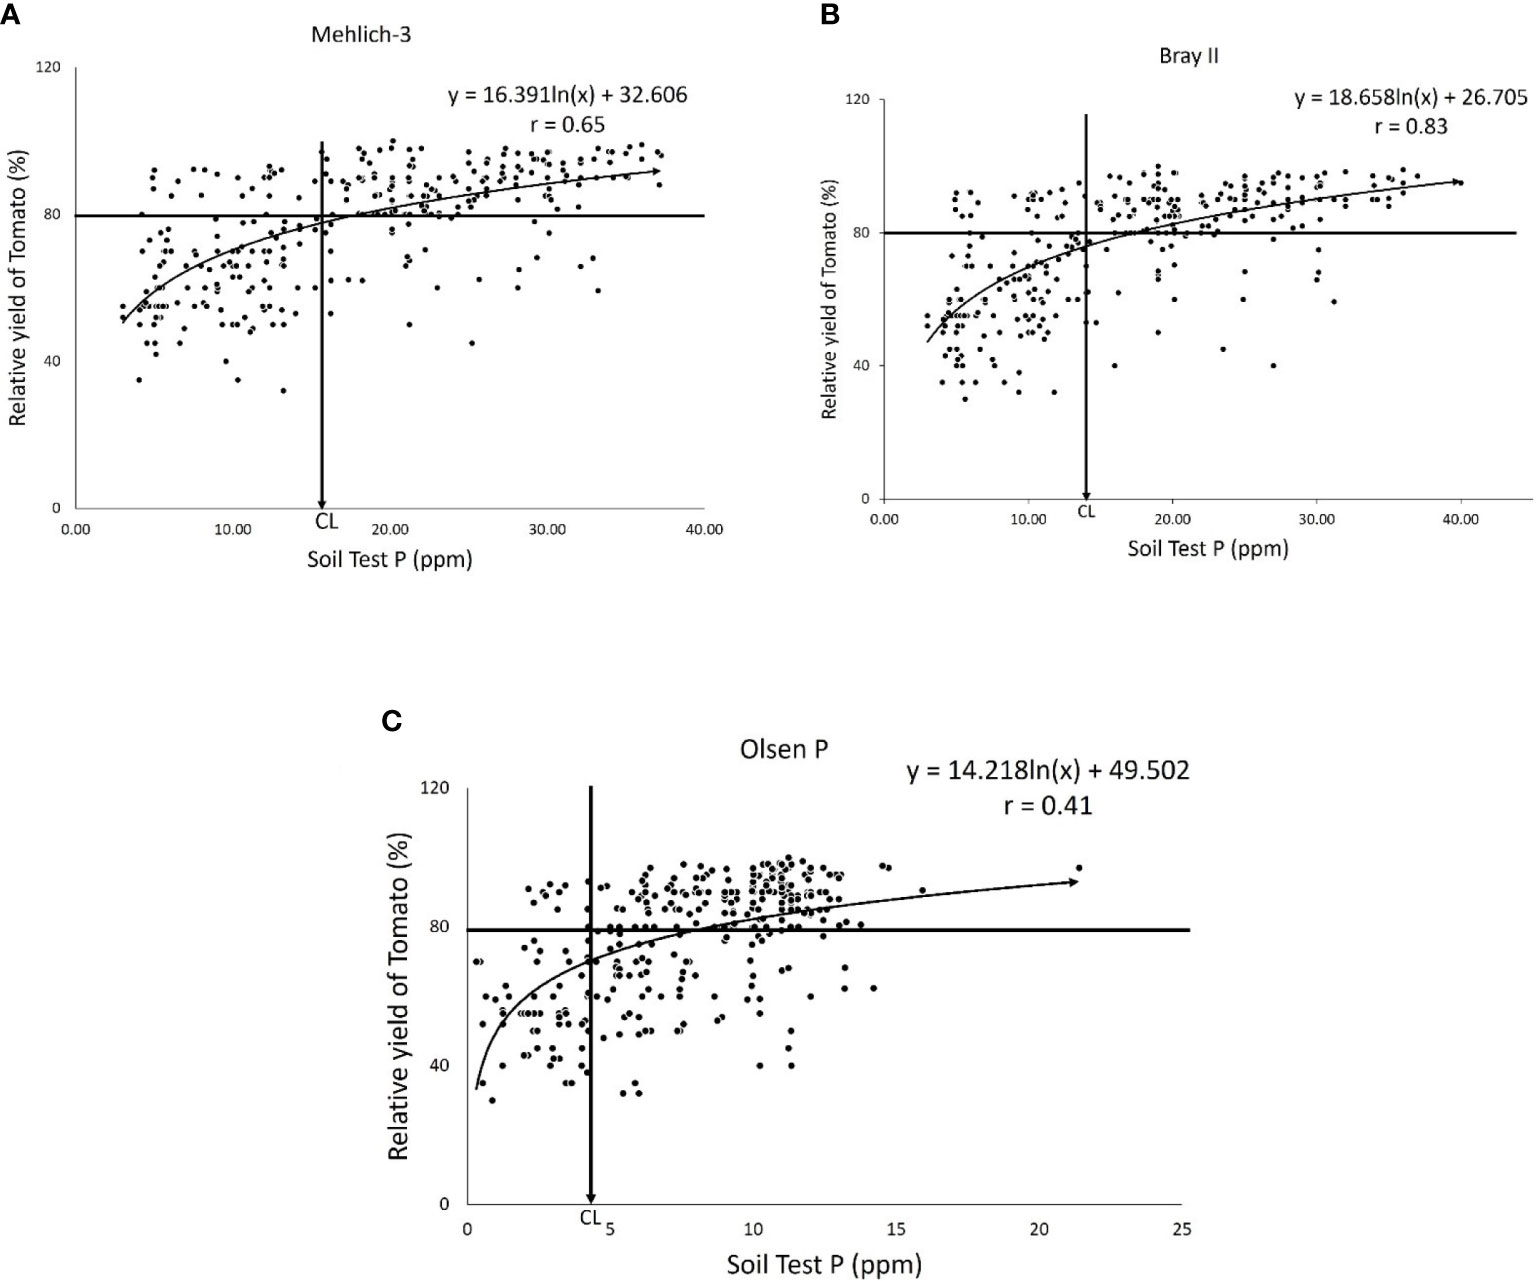
Figure 3 Scatter diagram illustrating the application of the Quadratic Diagram showing the Relationships between relative yields of Tomato and soil-test P by (A) the Mehlich-3 extraction method with critical level (CL) = 17.00ppm and the correlation coefficient of the soil test P and the relative yield of tomato = 0.65. (B) Bray II extraction method with critical level (CL) = 14ppm, r = 0.83 and (C) the Olsen P extraction method with critical level (CL) = 4.00ppm and the correlation coefficient of the soil test P and the relative yield of tomato = 0.41.
The P requirement factor is the amount of P fertilizer needed to increase the soil P by 1 ppm. The P requirement factor for each of the extraction methods, i.e., Bray II, Mahlich 3, and Olsen P, were calculated and found to be 9.02, 7.92, and 18.42, respectively, for the development of the final equation (Pr) rate of fertilizer to be applied (kg ha−1). The P requirement factor values found for both the Bray P and Mehlich 3 extraction methods were found to be close in value, indicating that the two procedures are related in terms of extraction ability. The Olsen P method underestimated soil P, resulting in a larger P requirement factor than the other two methods.
Taking into consideration the average of the initial soil test P-value (Pi), P requirement factor (Pf), and critical P level (Pc) for each of the extraction methods calculated above, the P requirement (Pr) was calculated from the equation Pr (kg ha−1) = (Pc − Pi) × Pf. The calculated P requirement (Pr (kg ha−1) using Mehlich 3, Bray II, and Olsen were 92.11, 77.21, and 33.34 kg ha−1, respectively. It was noted that the P requirement using Olsen-P was approximately 43.87 and 58.77 kg ha−1 lower than the Bray II and Mehlich 3 extraction methods, respectively. Kareem et al. (2020) recommended a P rate of 90 kg ha−1 for optimum tomato fruit production in the Sudanian savanna agroecological zone of Nigeria and in places with the same climatic and edaphic conditions with low soil test P-values. This was corroborated by Arora et al. (1994), who discovered a considerable increase in tomato height and fruit size after the application of 50–90 kg/ha phosphorus fertilizer. Thus, the calculated P rate of 33.34 kg ha–1 using Olsen-P seemed to be insufficient and did not correlate with the yield obtained. The rates of 92.11 and 77.21 kg ha–1 calculated from Mehlich-3-P and Bray II P, respectively, can be recommended as they are highly correlated with the yield obtained. However, the rate of 92.11 kg ha–1 calculated from Mehlich-3-P was still greater than the maximum input (90 kg ha–1); thus, the amount recommended by Bray II is recommended.
The response of a crop to fertilizer depends on the soil, climate, and type of crop. Therefore, nutrient calibration for various agro-ecologies is necessary to provide fertilizer recommendations. Taking these into consideration, this study evaluated different P extraction methods (Olsen, Bray II, and Mehlich 3) for sustainable and economic use of phosphorus fertilizer, to test their efficacy and effectiveness, and to develop a critical phosphorus level for fertilizer recommendation for tomatoes. The result obtained in this study showed that the magnitude of extractable P by the three extraction methods increased in the order Olsen< Mehlich 3< Bray II. Furthermore, the P extracted by the Bray II extraction method had the highest correlation with the relative yield of tomatoes compared to both Mehlich 3 and Olsen. Thus, Bray II was considered the most effective extraction method to assess P availability and recommend the optimum P rate for tomato production in the Sudanian savanna moderately acidic soils in Nigeria. Finally, using the Bray II extraction method, a soil test-based P fertilizer recommendation equation, Pr = (14.0−Pi) × 9.02, was developed.
The original contributions presented in the study are included in the article/supplementary material. Further inquiries can be directed to the corresponding author.
FK and YY devised the project and provided the main conceptual ideas. YY planned the research, performed the experiments, and wrote the manuscript in consultation with FK and DM. FK and DM supervised the work. All authors contributed to the article and approved the submitted version.
This work was funded by OCP Africa Fertilizers, Nigeria Limited. Additional funds from the African Plant Nutrition Institute (APNI) are acknowledged. The authors declare that this study received funding from OCP Africa Fertilizers, Nigeria Limited. The funder was not involved in the study design, collection, analysis, interpretation of data, the writing of this article, or the decision to submit it for publication.
DM is employed by OCP Africa Fertilizers Nigeria Limited.
The remaining authors declare that the research was conducted in the absence of any commercial or financial relationships that could be construed as a potential conflict of interest.
All claims expressed in this article are solely those of the authors and do not necessarily represent those of their affiliated organizations, or those of the publisher, the editors and the reviewers. Any product that may be evaluated in this article, or claim that may be made by its manufacturer, is not guaranteed or endorsed by the publisher.
Abah J., Bennette J. G., Blair A. R., Gosden P. W., Howard W. J., Hutcheon A. A., et al. (1979). Land resources of central Nigeria: Agricultural development possibilities (England: Land resources development center, central Nigeria project team, report number: 6B).
Abdu N. (2006). Soil-phosphorus extraction methodologies: A review. Afr. J. Agric. Res. 1 (5), 159–161.
Abebe G., Abreham T. (2019). Soil-test-based phosphorus fertilizer recommendation model for wheat (Triticum aestivum) in Jamma district of Amhara region. J. Agric. Sci. Res. 8 (1), 44–52. doi: 10.14662/ARJASR2019.225
Aliyu B. N. (2009). Overview of climatic data availability for Kano region and suggestions for coping with climate change in the region. Techno. Science Africana J. 3 (1), 1–18.
Akhtar M., Alam S. M. (2001). Effect of inCubation period on phosphate sorption from two P sources. J. Biol. Sci. 1 (3), 124–125. doi: 10.3923/jbs.2001.124.125
Arora S. K., Kumar N., Sharma B. R. (1994). Effect of nitrogen and phosphorus fertilization on growth and yield components in okra. Haryana J. Hortic. Science. 45 (2), 3–4.
Azeez J. O., Inyang U. U., Olubuse O. C. (2013). Determination of appropriate soil test extractant for available phosphorus in Southwestern Nigerian soils. Commun. Soil Sci. Plant Anal. 44, 10. doi: 10.1080/00103624.2013.768259
Bray R. H., Kurtz L. T. (1945). Determination of total, organic, and available forms of phosphorus in soils. Soil Sci. 59 (1), 39–46. doi: 10.1097/00010694-194501000-00006
Bremner J. M., Mulvaney C. S. (1982). “Nitrogen-Total,” in Methods of soil analysis. Part 2. Chemical and microbiological properties. Eds. Miller A. L., Keeney R. H. (Madison, Wisconsin: American Society of Agronomy, Soil Science Society of America), 595–624.
Cate R. B., Nelson L. A. (1965). A rapid method for correlation of soil test analysis with plant response data (Raleigh: North Carolina State University Agricultural Experiment Station).
Dias T. J., Pereira W. E., Cavalcante L. F., Raposo R., Freire J. L. (2009). Development of nutritional equality of mangaba seedlings cultivated on substrates containing coconut fiber and phosphate fertilization. Rev. Bras. Fruticultura. 31 (4), 512–523. doi: 10.1590/S0100-29452009000200028
Flavio H., Gutirrez B., Gerardo R., Daniel B. (2011). Soil phosphorus extracted by bray 1 and mehlich 3 soil tests as affected by the soil/solution ratio in mollisols. Commun. Soil Sci. Plant Analysis. 42 (5), 220–230. doi: 10.1080/00103624.2011.535072
Food and Agriculture Organization (FAO) (1984). The state of food and Agriculture. World review: the ten years since the World Food Conference Urbanization, agriculture, and food systems (Italy: Food and Agriculture Organization of the United Nations).
Frank K., Beegle D., Denning J. (1998). “): Phosphorus,” in Recommended chemical soil test procedures for the north-central region, vol. 221 . Ed. Brown J. R. (Columbia: North central regional research publication), 21–30. Missouri Agricultural Experiment Station.
Google Earth (2022) (Kano State). Available at: https://earth.google.com/web/search/kano+state.
Higo M., Sato R., Serizawa A., Takahashi Y., Gunji K., Tatewaki Y., et al. (2018). Can phosphorus application and cover cropping alter arbuscular mycorrhizal fungal communities and soybean performance after a five-year phosphorus-unfertilized crop rotational system? PeerJ. 6. doi: 10.7717/peerj.4606
Kareem A., Kareem S. A., Oladosu Y., AbdulMaliq S. Y., Eifediyi E. K., Alasinrin S. Y., et al. (2020). Growth and fruit yield of tomato (Solanum lycopersicum L.) under different levels of phosphorus fertilization. J. Appl. Sci. Environ. Manage. 24, 3. doi: 10.4314/jasem.v24i3.16
Lima N. A., Neves J. C., Martinez H., Sousa J. S., Fernandes L. V. (2020). Establishment of critical nutrient levels in soil and plant for eucalyptus. Rev. Bras. Cienc Solo. 32, 6. doi: 10.36783/18069657rbcs20190150
Mehlich A. (1984). Mehlich 3 soil test extractant: A modification of Mehlich 2 extractant. Commun. Soil Sci. Plant Anal. 15 (12), 1409–1416. doi: 10.1080/00103628409367568
National Population Commission (2006). Federal Republic of NIGERia Official Gazette Vol. 9 (Abuja, Nigeria: The Federal Government Printer), 44.
NIHORT (2023). Available at: https://nihort.gov.ng/?s=tomato (Accessed April 04, 2023).
Nisar A. T., Qin D., Kohei E., Victor R., Hirofumi S. (2019). Effect of Phosphorus fertilization on the growth, photosynthesis, nitrogen fixation, mineral accumulation, seed yield, and seed quality of a soybean low-phytate line. Plants 8 (5), 119. doi: 10.3390/plants8050119
Ogundare S. K., Babalola. T. S., Hinmikaiye. A. S., Oloniruha J. A. (2015). Growth and fruit yield of tomato as influenced by combined use of organic and inorganic fertilizer in Kabba, Nigeria. Eur. J. Agric. Forestry Res. .3 (3), 48–56.
Okojie J. (2018) Absence of HS Code for greenhouses shows tomato policy weakness. Available at: http://www.businessdayonline.com/companies/agriculture/article/absencehscodegreenhouses (Accessed 03, 2023).
Olsen S. R., Cole C. V., Watanabe F. S., Dean L. A. (1954). Estimation of available phosphorus in soils by extraction with sodium bicarbonate (Washington: USDA Circular 939, U.S. Government printing office).
Plaisier C., Dijkxhoorn Y., van Rijn F., Bonnand J., Talabi O. (2019). The vegetable and potato sector in Nigeria: an overview of the present status (Wageningen, Netherlands: Wageningen Economic Research report number: 2019-119). doi: 10.18174/504921
Qiang Z., Yuncong C. L., Rao S. M., Kelly M., Mingjian G. (2019). Comparison of extractants for calibrating phosphorus application rates in a calcareous soil. Hortiscience 54, 8. doi: 10.21273/HORTSCI13784-18
R Core Team (2019). R: A Language and Environment for Statistical Computing (Vienna, Austria: R Foundation for Statistical Computing). Available at: https://www.R-project.org/.
Ruttenberg K. C. (2003). The global phosphorus cycles. Treatise geochemistry 9, 585–591. doi: 10.1016/B0-08-043751-6/08153-6
Saggar S., Hedley M. J., White R. E., Perrott K. W., Gregg P. E., Cornforth I. S., et al. (1999). Development and evaluation of an improved soil test for phosphorus: A field comparison of Olsen, Colwell and resin soil P tests for New Zealand pasture soils. Nutr. Cycl. Agroecosystems 55, 35–50. doi: 10.1023/A:1009868032532
Sims J. T. (2000). “Soil test phosphorus: Olsen P,” in Methods of Phosphorus Analysis for Soils, Sediments, Residuals, and Waters. Ed. Pierzynski G. (Raleigh: North Carolina State University), 20–21.
Smil V. (2000). Phosphorus in the environment: natural flows and human interferences. Annu. Rev. Energy Environ. 25, 53–88. doi: 10.1146/annurev.energy.25.1.53
Tibagonzeka J., Akumu G., Kiyimba F., Atukwase A., Wambete J., Bbemba J., et al. (2018). Post-harvest handling practices and losses for legumes and starchy staples in Uganda. Agric. Sci. 9, 1. doi: 10.4236/as.2018.91011
Tonfack L. B., Bernadac A., Youmbi E., Mbouapouognigni V. P., Ngueguim M., Akoa A. (2009). Impact of organic and inorganic fertilizers on tomato vigor, yield and fruit composition under tropical andosol soil conditions. Fruits 64 (3), 167–177. doi: 10.1051/fruits/2009012
Tran T. S., Simard R. R. (1993). “Mehlich 3 extractable elements,” in Soil Sampling and Methods of Analysis. Ed. Carter M. R. (Ottawa, Ontario: Canadian Society of Soil Science), 43–49.
Usman M. (2019) Kano largest producer of tomatoes in Nigeria. Available at: https://dailyNigerian.com/kano-largest-producer-of-tomatoes.
Van der Waal J. (2015). Horticulture sector study for Nigeria’. J. Plant Nutr. Soil Sci. 32, 1. doi: 10.13140/RG.2.2.33200.76807
Wuenscher R., Unterfrauner H., Peticzka R., Zehetner R. (2015). A comparison of 14 soil phosphorus extraction methods applied to 50 agricultural soils from Central Europe. Plant Soil Environ. 61 (2), 86–96. doi: 10.17221/932/2014-PSE
Zang M., Alva A. K., Li Y. C., Calvert D. V. (2001). Aluminum and iron fractions affecting phosphorus solubility and reactions in selected sandy soils. Soil Sci. 166 (12), 940–948. doi: 10.1097/00010694-200112000-00008
Zbíral J. (2000). Determination of phosphorus in calcareous soils by Mehlich 3, Mehlich 2, CAL, and Egner extractants for determination of phosphorus in soils. Commun. Soil Sci. Plant Anal. 31, 3037–3048. doi: 10.1080/00103620009370648
Zhaohai B., Haigang. L., Xueyun Y., Baoku Z., Xiaojun S., Boren W., et al. (2013). The critical soil P levels for crop yield, soil fertility and environmental safety in different soil types. Plant Soil. 372, 27–37. doi: 10.1007/s11104-013-1696-y
Keywords: acid soil, Bray P, Mehlich 3, Olsen P, P critical values, tomato yield, Kano State, Nigeria
Citation: Yusuf YM, Madukwe DK and Kebede F (2023) Establishing phosphorus critical values for tomato (Solanum lycopersicum) fertilization with phosphate fertilizers on the Sudan savanna soils using three soil phosphorus extraction methods and field experimentation in Kano State, Nigeria. Front. Agron. 5:1181045. doi: 10.3389/fagro.2023.1181045
Received: 06 March 2023; Accepted: 18 July 2023;
Published: 07 August 2023.
Edited by:
El-Sayed Mohamed Desoky, Zagazig University, EgyptReviewed by:
Mohamed T. El-Saadony, Zagazig University, EgyptCopyright © 2023 Yusuf, Madukwe and Kebede. This is an open-access article distributed under the terms of the Creative Commons Attribution License (CC BY). The use, distribution or reproduction in other forums is permitted, provided the original author(s) and the copyright owner(s) are credited and that the original publication in this journal is cited, in accordance with accepted academic practice. No use, distribution or reproduction is permitted which does not comply with these terms.
*Correspondence: Yahaya Mohammad Yusuf, eWFoeWEueXVzdWZAdW02cC5tYQ==
Disclaimer: All claims expressed in this article are solely those of the authors and do not necessarily represent those of their affiliated organizations, or those of the publisher, the editors and the reviewers. Any product that may be evaluated in this article or claim that may be made by its manufacturer is not guaranteed or endorsed by the publisher.
Research integrity at Frontiers
Learn more about the work of our research integrity team to safeguard the quality of each article we publish.