
95% of researchers rate our articles as excellent or good
Learn more about the work of our research integrity team to safeguard the quality of each article we publish.
Find out more
ORIGINAL RESEARCH article
Front. Agron. , 07 December 2022
Sec. Climate-Smart Agronomy
Volume 4 - 2022 | https://doi.org/10.3389/fagro.2022.990397
 Syafiqah Binti Salleh1
 Mohd Yusop Rafii1,2*
 Mohd Razi Ismail1,2
 Asfaliza Ramli3
 Samuel C. Chukwu1,4
 Oladosu Yusuff1Nor’Aishah Hasan5
Introduction: Among the rice diseases, rice blast caused by the pathogen Magnaporthe oryzae is a major threat to the global rice cultivation. This experiment was aimed at investigating the genotype by environment interaction effects on the severity of blast disease and variability of the advanced blast resistant rice lines using quantitative characters.
Materials and methods: The experiment was laid out in randomized complete block design conducted at three locations. Data were collected on 21 traits which included vegetative, physiological, yield and yield components and were subjected to analysis of variance and variance component analysis. Cluster analysis was authenticated using principal component analysis for genotypes’ classification.
Results and discussion: All vegetative and yield traits showed highly significant variation among the advanced lines and the check. Seberang Prai showed the highest average yield (5.62t/ha), followed by Tanjung Karang (5.39t/ha) and UPM (4.97t/ha). All the advanced lines showed high resistance to blast disease. Evaluation across the three environments indicated that genotype G3, from MR219 based population, had the highest yield and resistance to blast infection. Genotype G21, from MR263 based population, performed best across the three environments studied and were selected for further breeding programme. The two selected lines, three and four clusters derived from MR219 and MR263 based populations, respectively, were recommended as new lines for further breeding programmes.
Among many leading cereal crops in the world, rice is considered a staple food for more than 3.5 billion of the world population particularly in the Asian continent (Chukwu et al., 2019a; Oladosu et al., 2020). Due to the continuous increase in rice demands, it was forecast that current global rice production must increase by 25% by 2025 in order to cope with the growing population rate (Maclean et al., 2002; Oladosu et al., 2019). Therefore, it is a matter of great challenge to meet the increasing rice demand with diminishing natural resources. In Malaysia, rice is regarded as a staple food, and it is important to the Malaysian culture. It is the third most significant crop after palm oil and rubber in terms of production. Farmers in Malaysia currently produce 2.6 million tons of paddy grain on a yearly basis (Siwar et al., 2014), which account for only about 70% of total consumption, while the remaining 30% shortfall is compensated for by importation from neighboring countries.
Rice production in Malaysia began a long time ago and now the country proves that it is capable of producing different types of rice that are mainly grown in 12 major granary areas in Malaysia: 10 in Peninsular Malaysia and 1 each in Sabah and Sarawak. According to Chukwu et al. (2019b), diseases are the most important limiting factors affecting rice production in Malaysia and anywhere in the world. The major diseases affecting rice include rice blast, bacterial leaf blight, and sheath blight. Among these diseases, rice blast has the most serious constraints on high productivity (Chukwu et al., 2019c). Between 1988 and 1994, a severe outbreak of blast disease was reported in the states of Perak, Penang, Selangor, and Kedah in Malaysia, which affected over 40% of the planted areas, causing an estimated yield loss of about 10%–50%. Disease management can be accomplished through chemical protection, host plant resistance, and biological control (Chukwu et al., 2022b). Chemical controls are not always effective and some are injurious to the rice plants, coupled with the fact that these chemicals are not eco-friendly. The use of biocontrol agents to control bacterial blast remains to be explored in detail. Therefore, an efficacious, cost-effective, and eco-friendly bacterial blast management strategy is crucial for sustainable rice production not only for Malaysia but also for the world at large. The most effective way of controlling blast disease is through the development of a resistant variety, which eventually minimizes yield loss (Akos et al., 2019; Akos et al., 2021).
The major step in plant breeding towards the development of improved varieties is to evaluate interactions of genotypes by environment (G×E). When genotypes or varieties are evaluated across a series of different location, their yield performance usually differs. This, however, makes it difficult for breeders to demonstrate the significance of any superior variety. This significant interaction between genotype and environment is usually present whether the varieties are developed through conventional or non-conventional methods. Statistically, the effect of large G×E interactions was reported to affect the progress of selection (Comstock and Moll, 1963). Over the years, environmental stratification has been effectively used to reduce the G×E interaction. The region for which a breeder is developing improved varieties can often be so subdivided that all environments in the subregion are somewhat similar. This stratification is usually based on macro-environmental differences such as arid soil types, rainfall distribution, and temperature gradients. However, even with this refinement of technique, the interaction of genotypes with locations in a subregion, and with environments encountered at the same location in different years, frequently remains too large. Allard and Bradshaw (1964) classified as unpredictable the environmental variation for which stratification is not effective. Since little additional progress can be expected in reducing G×E interactions by the stratification of environments, other methods need to be investigated. One such method was to select a genotype that showed less interaction with the environments in which they are cultivated. If the genotype ability to show a minimum interaction with the environment or stability performance is greatly controlled by the genetics, then there is a need to conduct a preliminary evaluation to select the stable genotype before presenting to the final stage for the breeder to select the superior genotype.
In the crop improvement programs, the ultimate goal of plant breeders is to develop high-yielding cultivars with broad adaptability (Okporie et al., 2013), although it became more challenging when dealing with G×E interactions. Minimally, two genotypes (cultivars) and two environments are needed for genotype-by-environment (G×E) evaluation. Statistically, there are different methods used in G×E analysis comprising parametric and non-parametric techniques. Study objectives and data variability evaluation play an important role in the decision of the biological statistical model combination that will be used. Thus, an efficient statistical technique is needed to discover morphological and physiological traits that are related to environmental effects. The linear regression approach has been used to evaluate the magnitude of G×E interaction. Later, this method was modified by Finlay and Wilkinson (1963) in examining the yield stability of barley genotype and by Eberhart and Russell (1966). Other methods for estimating G×E interaction include cluster analysis, pattern analysis, additive main effects and multiplicative interaction (AMMI), genotype main effects, and genotype and G×E interaction effects (GGE). A suitable statistical analysis depends on the experimental data, the number of environments involved, and the accuracy of the information. The objective of this particular experiment was to study the genotype-by-environment interaction (GEI) effects on the severity of blast disease and the genetic variation of the advanced blast-resistant rice lines using quantitative traits.
Thirteen lines of BC2F2 generation from an advance-backcross of MR219 × Pongsu Seribu-1 and 26 lines from an advance backcross of MR263 × Pongsu Seribu-1 obtained from previous studies (Miah et al., 2015; Chukwu et al., 2020a; Chukwu et al., 2020b) were evaluated, in addition to two check materials from both populations. A total of 41 lines were used for the study. Pongsu Seribu-1 (PS1), which was developed by the Malaysian Rice Research Centre, Malaysian Agricultural Research and Development Institute (MARDI) possesses broad-spectrum resistance against blast fungal isolates. MR219 and MR263 have high-yielding potentials with a suitable grain quality and good eating quality. Unfortunately, these varieties are very susceptible to blast (Hasan et al., 2016).
The field evaluation was performed repeatedly in three locations: first, at MARDI station in Tanjung Karang from October 2014 to January 2015; second, at MARDI research station in Seberang Perai from September 2015 to December 2015; and, third, at Universiti Putra Malaysia (UPM), Field 10, from September 2016 to January 2017. The climate could be described as hot humid tropic, with high humidity and adequate rainfall. The weather details of the locations are provided in Table 1.
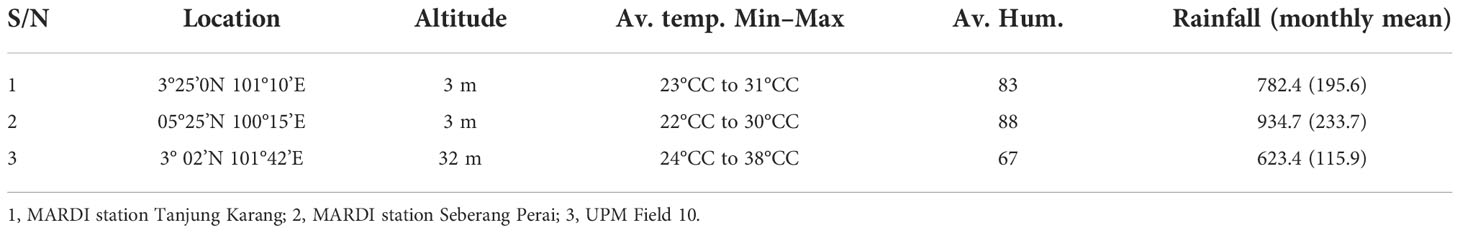
Table 1 Weather information of the research locations.
Thirty grams of each rice accession was placed into plastic Petri dishes and oven dried at 50°C for 24 h to deactivate seed dormancy. Later, the seeds were soaked with water for 24 h, and each Petri dish was covered and allowed to germinate for 3 days. To avoid drying out, water was added to each Petri dish on a daily basis. For easier establishment of each sprouted seed, a nursery of 41 compartments was made in the soil-filled tray, to which excess water was added. Three-day-old seedlings were transferred from Petri dishes to plastic trays that were later transplanted to the field after a period of 21 days in the nursery. In this experiment, a randomized complete block design (RCBD) with three replications was adopted. A planting distance of 25 cm within and between rows was applied. Other management practices, such as irrigation, weeding, fertilization, and application of pesticides and insecticides, were done following standard procedures (Azmi et al., 2008). The physicochemical properties of the soil were determined before and after planting (Table 2).
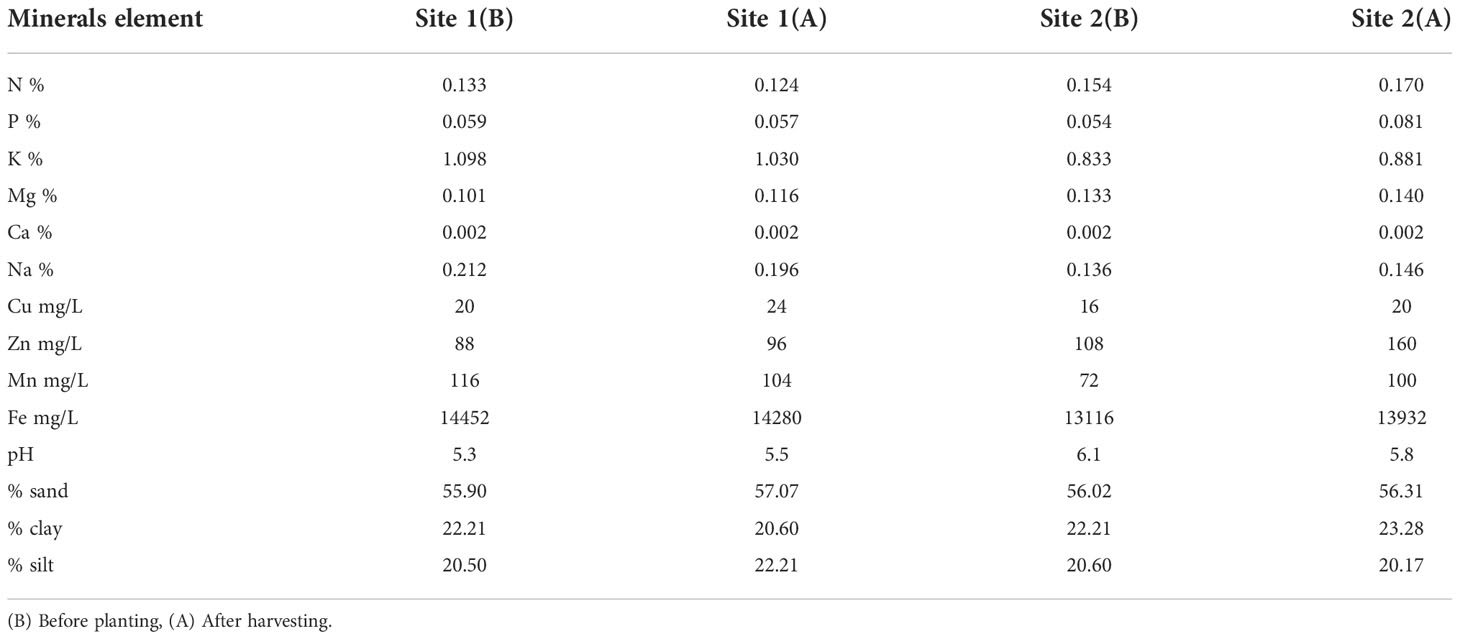
Table 2 Physicochemical properties of the soil before and after planting.
The advance lines were grown at a rice field at Mardi Station in Tanjung Karang and Seberang Perai where the infection of blast naturally occurred. All the advanced lines were grown under the glasshouse condition where the infection of blast was introduced to the plant via the spraying technique. Inoculum was prepared by introducing the spores of M. oryzae from 10-day colonies on complete media and suspended in sterilized water to 2 × 10⁴ conidia/ml dilution (Koutroubas et al., 2009; Tanweer et al., 2015a; Tanweer et al., 2015b). The inoculation was performed during the evening hours at six to seven leaf stages by spraying 3 ml of the conidial suspension on each rice plant using a fine air sprayer. Water was sprinkled on the leaves three times a day between 11 a.m. and 4 p.m. in order to facilitate blast development (Koutroubas et al., 2009). The individual plant was assessed on day 80 after inoculation (DAI) using a standard evaluation system introduced by the International Rice Research Institute, IRRI (IRRI, 2014). The symptoms of blast in rice crop are shown in Figure 1.
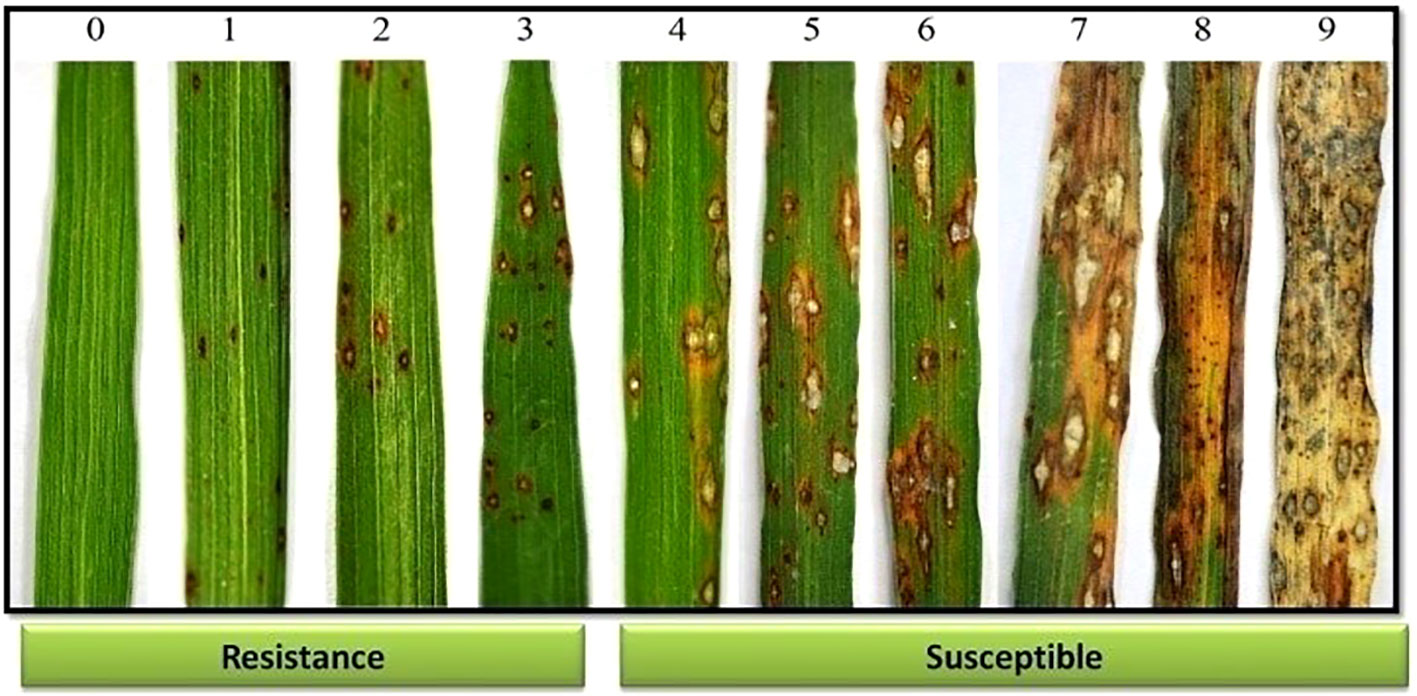
Figure 1 Symptoms of blast disease in rice.
The morphological and agronomic traits of the evaluated lines were measured based on 21 parameters adapted from Oladosu et al. (2018) and IRRI (2014). Five representative plants for each genotype in each replication were randomly selected to record observations. The parameters assessed were panicle length, filled grains per panicle, unfilled grains per panicle, total grain per panicle, grain weight per panicle, tillers per hill, panicles per hill, thousand grain weight, total grain weight per plant, percentage effective tiller, percentage filled grain, plant height, days to flowering, days to maturity, flag leaf length-to-width ratio, and yield in t/ha. The SPAD-502 instrument was used to determine the chlorophyll content of fully matured leaf from the top of the plants at day 72 and 86 after transplant. An average value per plot was derived from five plants per lines and three leaves per individual plant.
Descriptive statistics such as the mean, range, standard deviation, and coefficient of variation (CV) were calculated for each trait. Phenotypic correlation coefficient, cluster analysis (CA), and principal component analysis (PCA) were run with the aid of SAS software version 9.4. Analysis of variance (ANOVA) was calculated for all of the traits to determine variation among the genotypes, populations, and locations. The data were first analyzed individually on the basis of the three sites and two populations. Where there were no significant differences found among the genotypes, the data were pooled over sites. Mean comparisons were performed using LSD. The association and relationship of the various characteristics were worked out at the phenotypic level using Pearson correlation coefficients. The ANOVA table and expected mean squares for combined sites and population are as shown in Table 3. The GGE biplot was used to graphically analyze the multivariate stability in order to provide an interpretation of the relationship between genotype and environment. R studio is a streamlined version of the R statistical software, which was utilized in the computation of the GGE biplots. The GUI package was utilized for the creation of GGE biplots (RStudio, 2014). The GGE biplots were utilized for the purposes of visualizing the presence of GEI and ranking genotypes according to stability and mean. The created graph is based on the Mega environment (i.e., which-won-where pattern of GGE) and genotype evaluation.
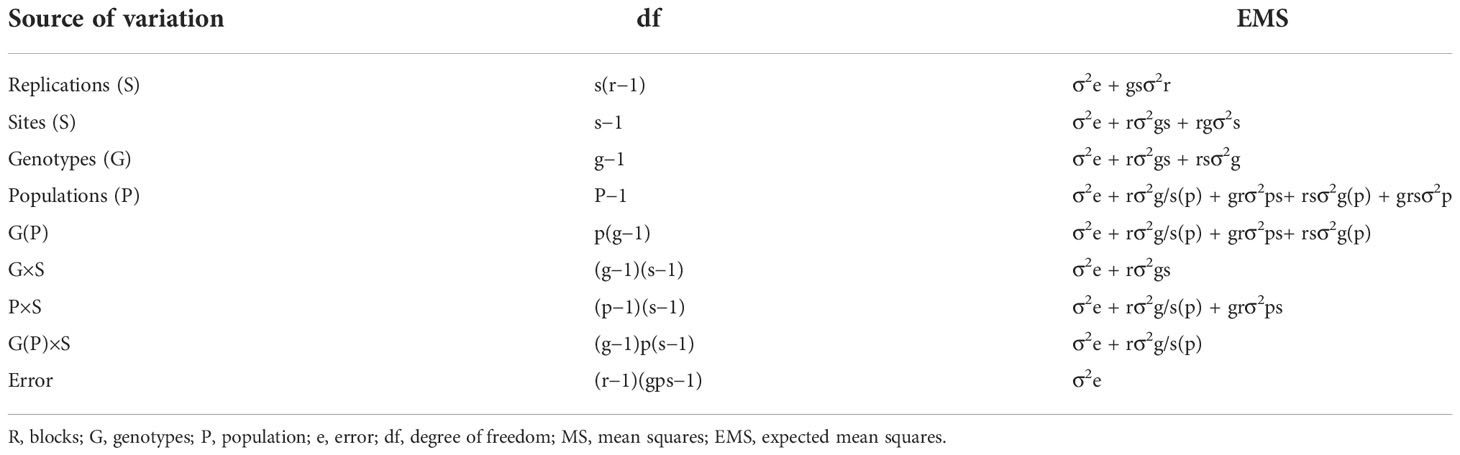
Table 3 ANOVA table for combined sites and population.
Plotting of the GGE biplot graph was constructed in such a way that the first principal component (PC1) of genotype and environment scores is plotted against the second principal component (PC2) that resulted from singular value decomposition (SVD) of environment standardization or environment center of genotype–environment data (GED). The mega-environment graph consists of an irregular polygon containing scattered genotypic and environmental markers. The polygon is constructed in such a way that it connects all genotypes that are far away from the biplot origin. Lines that originated from the center of the biplot that perpendicularly intersect the polygon divide the polygon into sectors. Hence, genotype at the vertex of the polygon is stable for all the environments in that sector. A single genotype is said to perform best if all environmental markers fall into one sector. In contrast, if the environmental markers fall into different sectors, the genotype at the vertex of each sector won in the environments in each sector, hence revealing the “which-won-where” pattern (Ebem et al., 2021).
Genetic parameters were estimated with the use of SAS software (version 9.4) to determine genetic variation among genotypes and to assess genetic and environmental effects on various traits. The phenotypic and genotypic correlations were estimated by the method of Singh (1985) and genetic advance was calculated using the method of Assefa et al. (1999). Also, heritability estimates were determined by the procedure by Falconer (1989).
Blast disease severity: The results in Table 4 show the blast disease severity for combined site and population. Sources of variation such as sites, replication within site, genotype, population, genotype within population, and population by sites showed a significant difference while there was no significant deference observed in genotype by site and genotype by site within population. The nonsignificant difference observed among the genotype by site within the population indicated the absence of environmental effect on the blast disease severity.
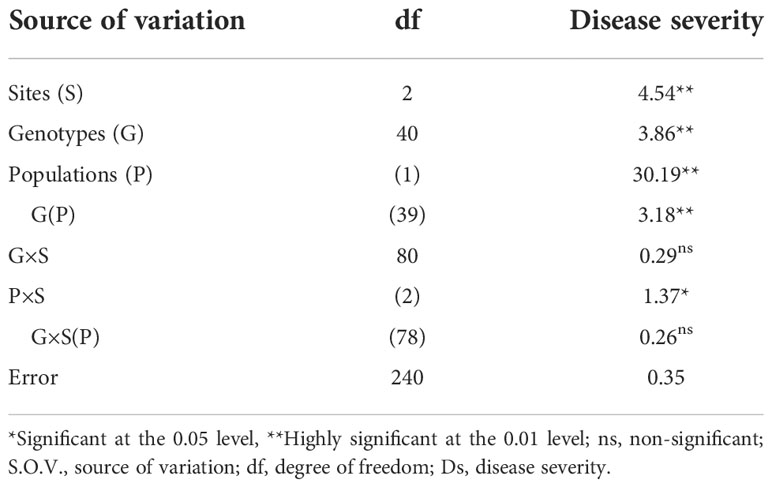
Table 4 Blast disease severity by combined site and populations.
The pooled ANOVA for vegetative and physiological traits based on sites and populations is presented in Table 5. From the result obtained, all the traits showed significant variation among the sites, genotypes, population, and genotype within population. In addition, only number of tillers and number of panicles had no significant difference among the replication within sites while the others varied significantly (p ≤ 0.01). Days to flowering and days to maturity showed no significant differences among the population by sites while a significant difference at p ≤ 0.05 was observed in the plant height. Other traits including flag leaf ratio, number of panicle, and percentage effective tillers showed highly significant differences between the genotypes by sites within the population.
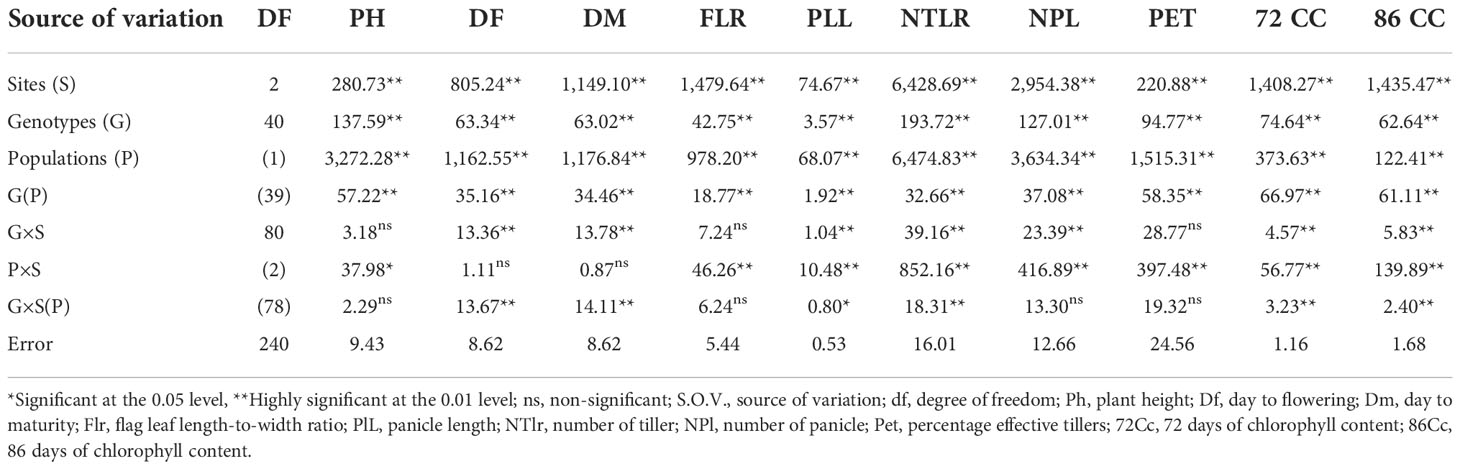
Table 5 Vegetative and physiological traits by combined site and populations.
The results obtained on 10 traits regarding yield and yield components are presented in Table 6. From the results, all the traits varied significantly among the sites, genotypes, and genotypes within the population. All the traits except for unfilled grain, total grain weight per plant, and yield per hectare showed significant differences in replication within sites. In addition, only flag leaf trait recorded a nonsignificant difference by the population while the other nine traits showed highly significant differences among the population. Grain dimension, total grain weight per plant, 1,000 grain weight, and yield (t/ha) were significantly affected by the population by sites, while only two traits, grain dimension and 1,000 grain weight, were influenced significantly by the genotype by site within population.
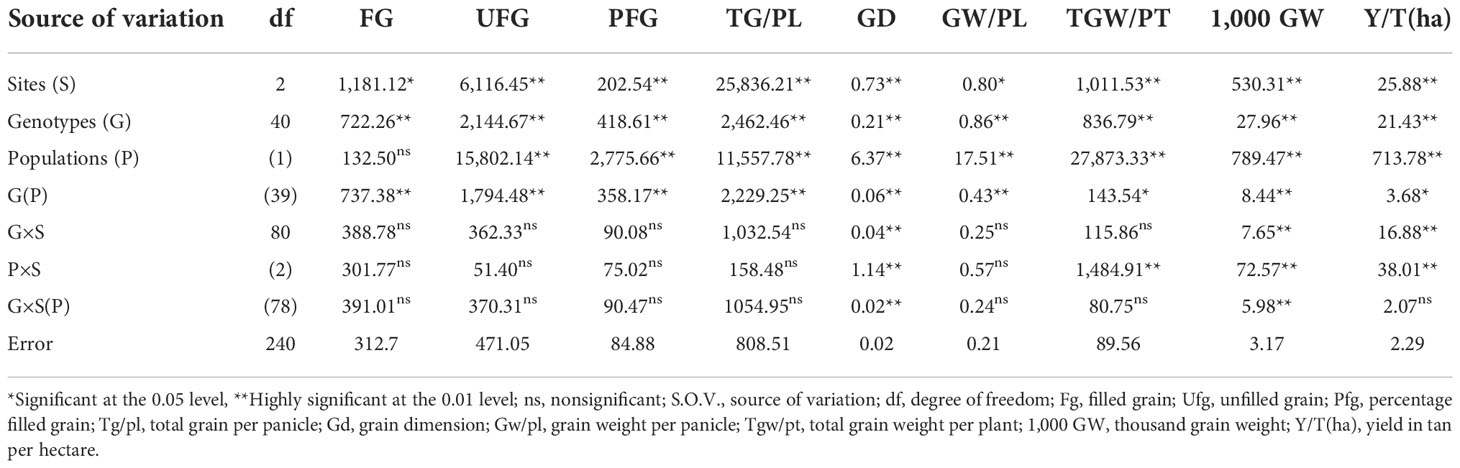
Table 6 Yield and yield components by combined site and populations.
From the result presented in Table 7, blast disease severity showed a high value of phenotypic coefficient variation and genotypic coefficient variation (45.42% and 33.43%, respectively). In addition, this trait also recorded moderate broad sense heritability (54.16%) and high value of genetic advance (50.68%).
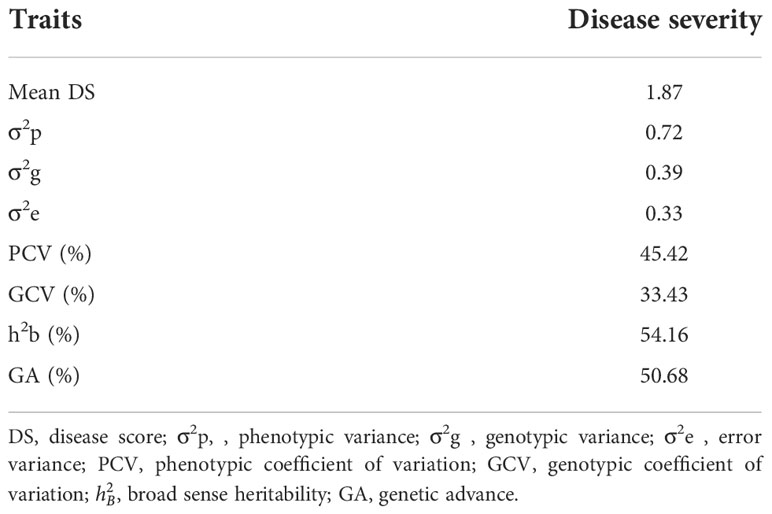
Table 7 Phenotypic and genetic coefficient of variation and heritability for blast disease severity across locations.
Correlation coefficients among the morphological traits and yield and its components for population MR219 and MR263 are shown in Table 8. The grain yield (t/ha) in both populations demonstrated a significantly positive correlation with panicle length, filled grain, total grain per panicle, grain weight per panicle, total grain weight per plant, percentage effective tillers, and percentage filled grain, except for 1,000 grain weight and flag leaf ratio, which only showed a significantly positive correlation in the MR219-based population, and for number of tillers and number of panicle, which only showed a significantly positive correlation in the MR263-based population. A few characteristics in the MR219 population, such as unfilled grain, 72 days of chlorophyll, 86 days of chlorophyll, and plant height, and in the MR263 population, such as days to flowering and days to maturity, showed a significantly negative correlation with grain yield. Equally important, disease score exhibited a significantly positive correlation only with total grain per panicle. Unlike MR219, MR263 had few characteristics such as the number of tillers, number of panicles, percentage effective tillers, grain dimension, and 86 days of chlorophyll that correlated positively with disease score. A significantly negative correlation was detected between disease score and plant height for MR219, while panicle length, 1,000 grain weight, days to flowering, days to maturity, and flag leaf ratio negatively correlated to disease score.
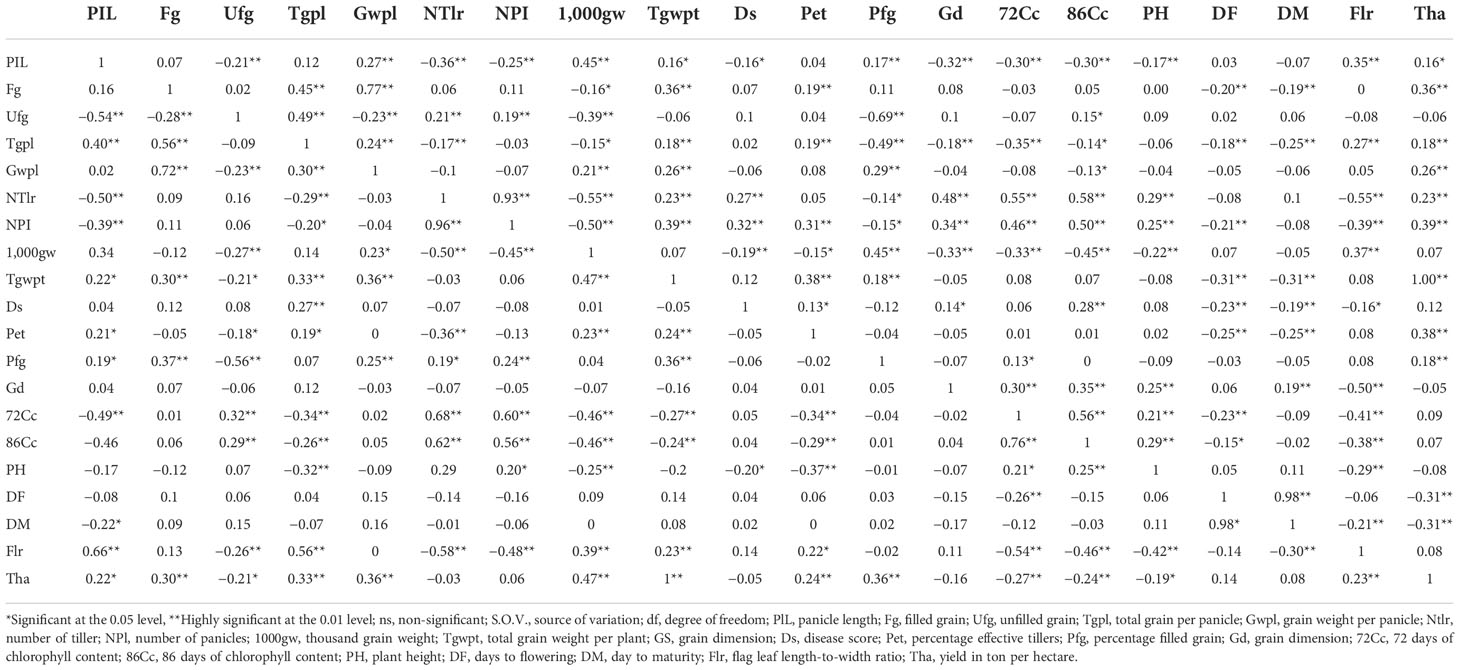
Table 8 Correlation between all traits for MR219 (below orthogonal matrix) and MR263 (above orthogonal matrix) populations.
The standardized morphological data of two populations, MR219-based (13 advanced lines) and MR263-based (26 advanced lines) populations, were subjected to cluster analysis. Three MR219 and four MR263 groups based on 21 morphological traits were derived from the analysis performed following the Euclidian distance method (Figures 2, 3). In the dendrogram, the 13 genotypes plus one check variety were grouped into three clusters based on 21 traits. Among the three clusters, cluster I had the largest number of genotypes (12). Clusters II and III had only one genotype each. The genotype in cluster III is the check variety. The MR263 population had four clusters with the largest number of genotypes (17) grouped in cluster II. In addition, cluster I had five lines, followed by cluster VI with three genotypes and only one genotype in cluster III (Figure 3). The patterns of cluster analysis were also authenticated by the principal component analysis (Figures 4, 5).
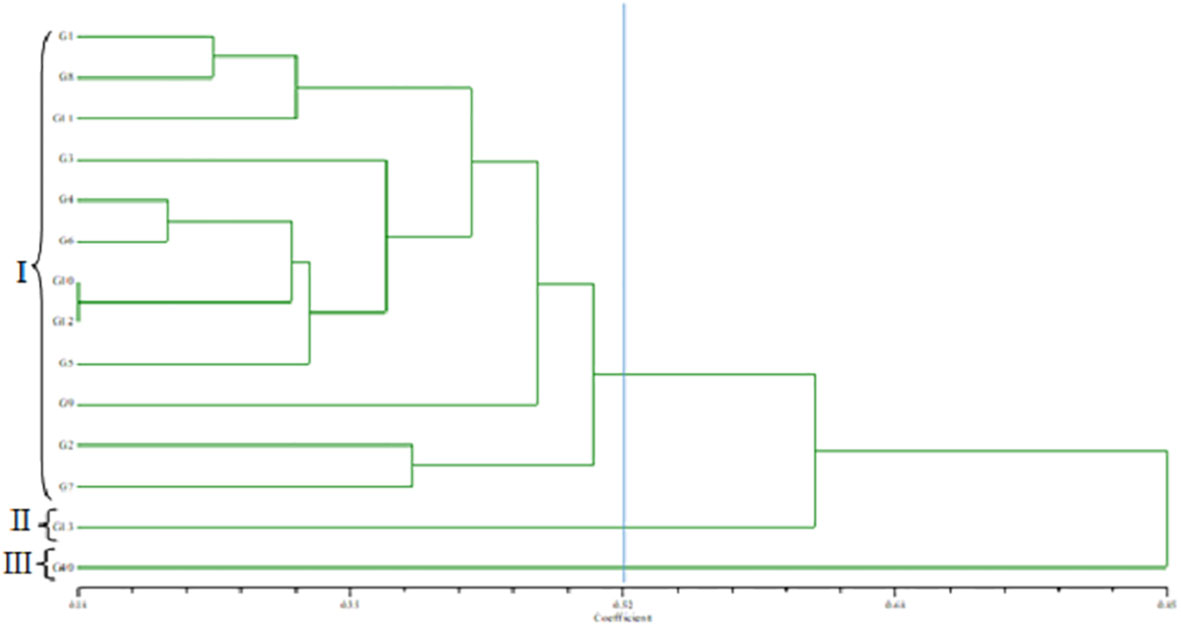
Figure 2 Dendrogram grouping the MR219-based population.
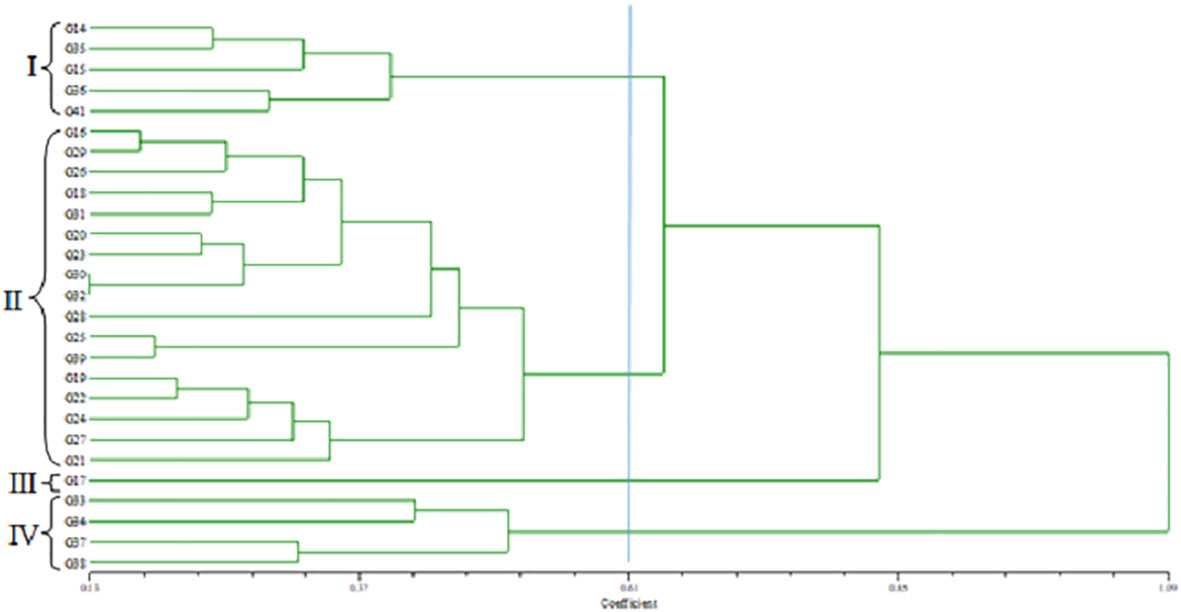
Figure 3 Dendrogram grouping the MR263-based population.
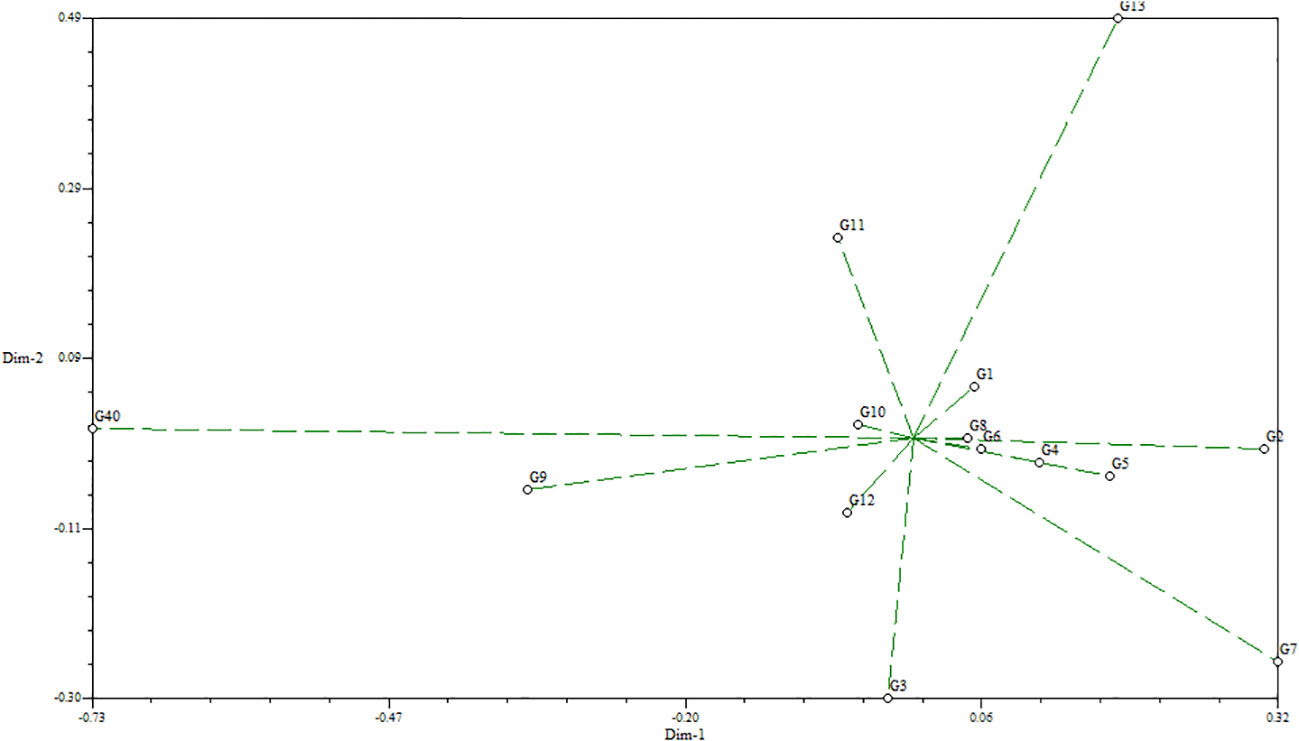
Figure 4 Principal component analysis for the MR219-based population.
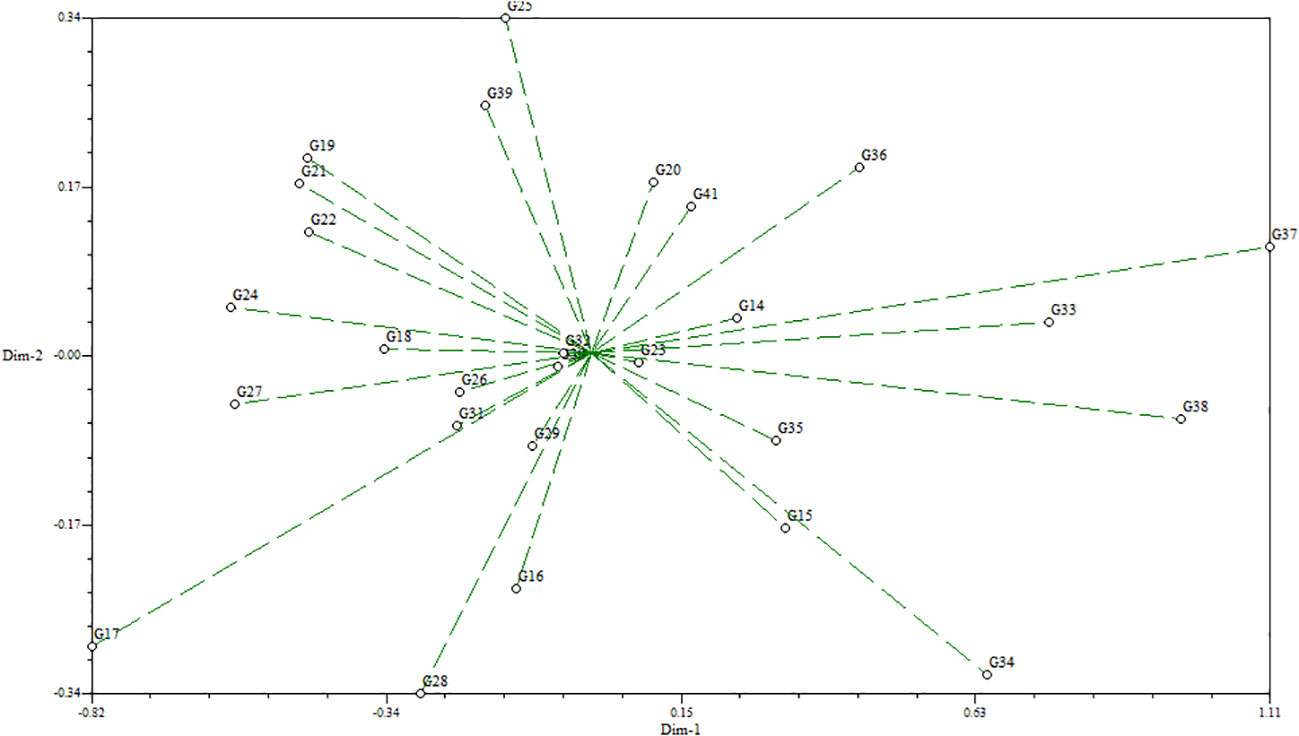
Figure 5 Principal component analysis for the MR263-based population.
The average-environment axis (AEA) view of the GGE biplot, also known as the average-environment coordination (AEC) view, is utilized for ranking genotypes in accordance with the stabilities and their average mean performance (Figure 6). The AEC ordinate (horizontal line) and the AEC abscissa (vertical line) are the two lines that make up this graph. The abscissa of the AEC is the single arrowed line that runs through the hypothetical average environment as well as through the origin of the biplot, which is defined by the average scores of PC1 and PC2 across all environments. This origin is indicated by the small circle at the very end of the arrowhead (Figure 6). On the AEA abscissa, the direction of the arrowhead points in the direction of greater mean values for yield performance. In this study, the yield per hectare that was obtained in G14 was the highest, while the yield that was recorded in G29 was the lowest. The stability of the genotypes is shown by the line that cuts through the middle of the biplot and is drawn as an ordinate of the AEC. Greater variability or instability in either direction is indicative of genotype vectors that are further from the AEC. Therefore, the performance of the genotype is less variable or more stable across the studied contexts the shorter the distance or projection is from the AEA, and vice versa. Genotypes are then ranked based on their contact from the positive side of the line. The genotype that falls on the line is said to be most stable while the genotype with the longest contact with the AEC abscissa is considered to be unstable. An ideal genotype is the one having both high mean performance and perhaps high stability in a mega-environment representing a target location. Therefore, genotype 14 is considered as the ideal genotype based on high mean and short vector (Figure 6).
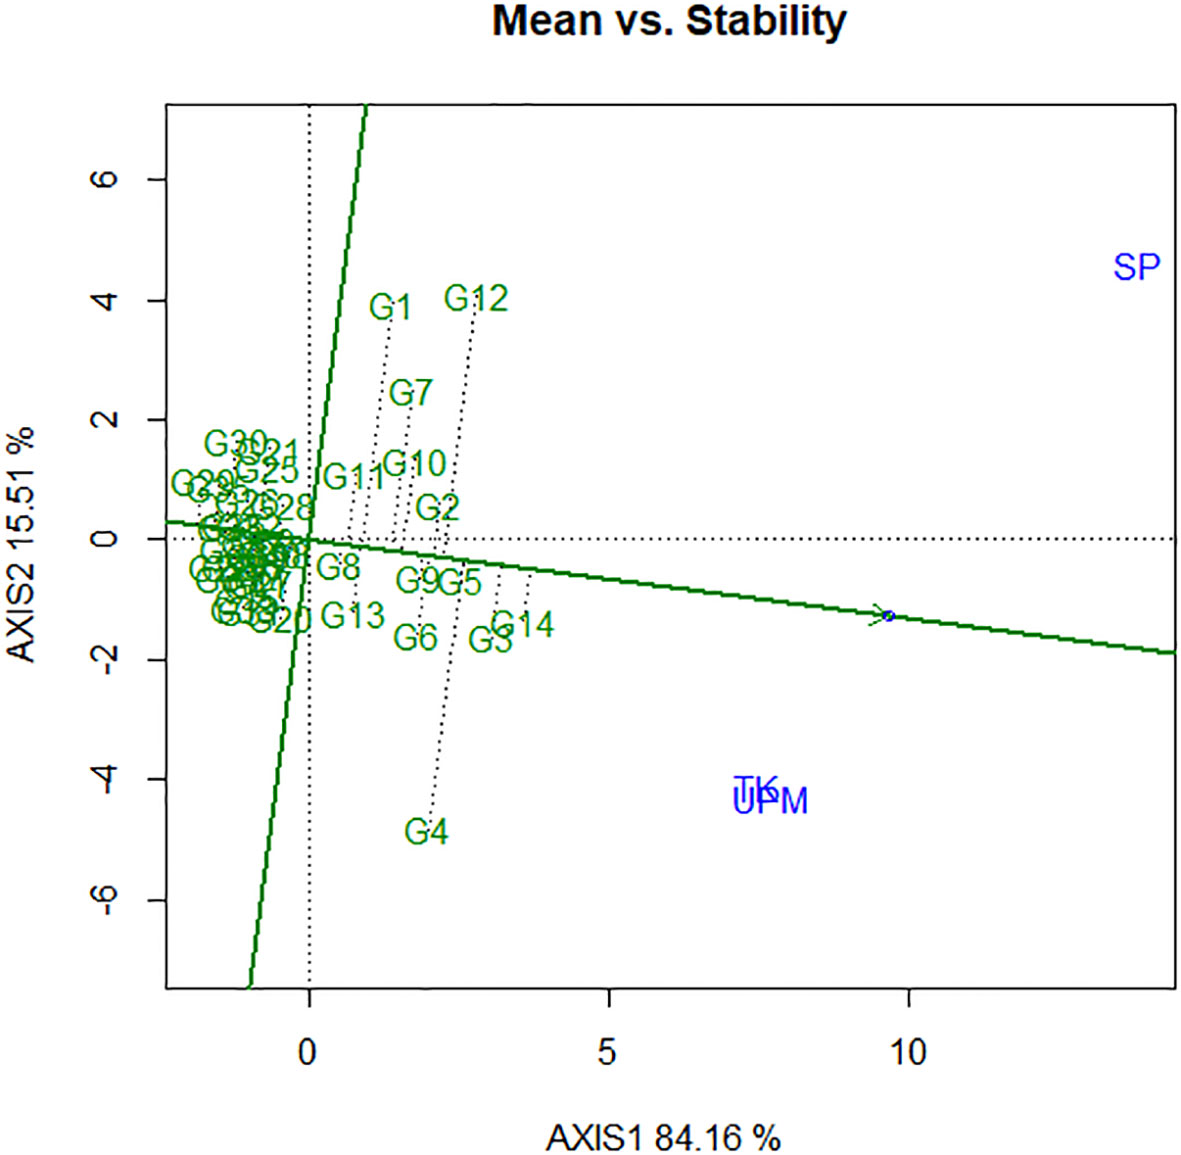
Figure 6 The mean vs. stability view showing the genotype main effects plus genotypic × environment interaction effect biplot (G + G × E) interaction effect of 41 rice genotypes in three locations for yield per hectare.
Rice cultivation in an open field is greatly exposed to blast disease, which hinders the possibility of obtaining high yield during disease infestation. Blast disease resistance plays a significant role in enhancing yield performance because the blast lesions that infected the paddy especially the leaves will reduce the photosynthesis rate of individual leaves. There would be an increase in crop yield where this process is contributing more than 90% of crop biomass (Makino, 2011). Titone et al. (2015) discovered that blast disease had a negative correlation with grain yield. This is because when the rice is severely affected by the blast, both grain yield and quality decreased significantly. In this study, all the 39 advance lines showed a score of 1–2, which indicates that all of them are resistant to blast disease. However, there is low correlation and no significant correlation between the disease resistance and yield. This is because the plant yield is also influenced by other factors such as the availability of nutrient for grain filling, water requirement, and many more. Significant differences were observed among the traits assessed in the 41 rice accessions, indicating the existence of variation in the population. In this regard, several reports have been published concerning the phenotypic variation among rice genotypes (Halim et al., 2021). Similarly, Pandey et al. (2009) reported highly significant differences among 40 rice accessions with the use of 12 quantitative characteristics. Similarly, Rao (1991) discovered 95% differences among five rice populations using 20 morphological characteristics. Conforming to Acuña and Wade (2012), the environment influenced the actual performance of genotype under varying soil types. Similarly, Krisnawati and Adie (2018) also reported that genotype was unstable in yield performance when evaluated across different locations because the high-yielding genotypes are adapted to a specific environment. Furthermore, Oladosu et al. (2017) proved that the changes in environment significantly influenced the variation in grain yield of rice.
Significant difference was observed among vegetative traits, which include plant height, days to flowering, days to maturity, flag leaf ratio, panicle length, number of tillers, number of panicle, and percentage effective tillers. It was observed that all genotypes had intermediate height. This feature was as a result of a short internode. The importance of intermediate height could be attributed to effective assimilate partitioning at the expense of vegetative growth. Thus, instead of having tall plants, increase in yield compensates for the vegetative deficiency. This trait is also advantageous in protection against lodging. Although plant height is primarily governed by the genetic makeup, going by the pedigree of the advance breeding lines used in the study, both recurring parents had moderate height. Therefore, height in this regard is highly heritable. While height trait is highly influenced by environmental factors, as indirectly noted earlier, rice yield is indirectly related to its height because of sink competition for the limited photosynthates produced by delimited sources. Thus, what will be used for yield increase will be unnecessarily used for somatic cell enlargement, resulting in luxuriant vegetative growth and enhanced height. In this experiment, all of the high-yielding varieties were found to be of intermediate height, suggesting that a moderate plant height is desirable when breeding for high-yielding varieties. Another essential factor for enhancing the yield of rice grain is flag leaves. This trait can increase about 41%–43% of the grain weight, which later leads to the yield increment (Al-Tahir, 2014). In this experiment, MR219 showed greater mean value in flag leaf ratio (21.55 cm) and higher yield (7.26 t/ha) compared to MR263 (flag leaf ratio, 18.12 cm; yield, 4.32 t/ha). Flag leaves play important roles in improving rice yield because these leaves are the source of assimilate production for the filling spikelets during the grain filling stage (Wang et al., 2006; Chukwu et al., 2022a; Ahmed et al., 2022). The larger the area of a flag leaf, the higher the yield because it intercepts the solar rays from the sun to manufacture food for the plant, and in addition, it is the last leaf to undergo senescence. Therefore, the flag leaf area was directly related to all vegetative traits such as plant height, days to flowering, days to maturity, flag leaf ratio, panicle length, number of tillers, number of panicle, and percentage effective tillers. Furthermore, the flag leaf has been found to be metabolically active to support higher grain yield. Corroborating our findings in this work, Ashrafuzzaman et al. (2009) clearly stated that yield components such as number of grains per panicle, 1000 grain weight, total grain weight per hill, and yield per hectare positively correlated to the flag leaf area.
The number of tillers plays an important role in defining the yield of the rice grain because it has a direct relationship with the number of panicles. Therefore, fewer tillers produced fewer panicles, while excessive tillers cause high tiller abortions, small panicles, poor grain filling, and reduction in grain yield. The leaf area index and plant nitrogen status are the two primary factors that affect tiller production in rice crops. When an adequate nutrient supply exists, mitotic cell division is enhanced, and the growth of tillers and plant general vegetative life increases. In this work, the tiller production was between moderate and low levels. Thus, tiller abortion was not a problem during the production period. Percentage effective tiller is one of the important traits that contribute to the high yield in rice because this trait is precisely related to number of tillers that produced the panicle per unit ground area. Dutta et al. (2013) clearly stated that high yields in rice can be obtained when the genotypes manufacture a higher number of effective tillers per plant. However, this trait is highly affected by the environment in which two primary factors that influence its production are leaf area index and plant nitrogen status. The growth of tillers and vegetative life will increase if an adequate nutrient supply exists. In this study, percentage effective tillers in the MR219 population recorded a lower value (77%–90%) compared to the MR263 population (85%–93%); however, its production for both populations was at high levels. Thus, the number of effective tillers is dependent on the number of tillers produced, and this number is directly proportional to the panicles produced per unit area and, finally, depends on the variety (Hossain et al., 2008).
The panicle number is another major factor that has a direct influence on the yield. Therefore, yield could be increased when agronomic manipulation is used to increase the number of panicles produced per unit area. The panicle length is among the yield-contributing characteristics. The yield is proportional to the number of potential spikelets to be filled during the grain filling stage. Varieties with long panicle length, high number of total grains per panicle, and high percentage filled grain will contribute to the increase in rice yields. Ranawake et al. (2013) clearly reported that panicle length and number of spikelets per panicle have a positive and strong correlation between them, which means that the longer the panicle, the more rice grain can be accommodated during the grain filling stage. Days to flowering is one of the yield attribute traits in determining the final grain yield of rice. Adaptation of rice to different agro-climatologically zones such as temperature fluctuation, light day intensity, and short day condition results in variation in days to flowering. Ranawake et al. (2014) reported that the effect of days to flowering to the rice yield is positively correlated and maximum started from 80 days up to 90 days and becomes negative when exceeding 90 days. Another explanation to this phenomenon is the fact that higher sinking productivity was exhibited by a higher score in filled grain percentage of those that start flowering earlier compared to late flowering, which reduced the dry matter accumulation in grain. Variation in days to flowering can be clearly seen in this study as the shortest days to flowering was recorded in Tanjung Karang (73 days) followed by UPM (77 days) and Seberang Perai (78 days). Seberang Perai (5.62 t/ha) recorded the highest value of yield in tons per hectare followed by the Tanjung Karang (5.39 t/ha) and UPM (4.97), and these data were supported by Ranawake et al. (2014) findings as 78 days is closer to the range of the maximum positive effects to the rice yield. Days to maturity is closely related to days to flowering. A variety that has a shorter flowering day will mature earlier than that which flowered late. Areas with minimal rainfall are encouraged to use a variety that matured earlier because they grow faster during the vegetative phase (Sabri et al., 2020; Sarif et al., 2020).
The grain filling rate among the varieties ranged from high (210) for G37 in Tanjung Karang to low (98) in G26 for UPM. An increase in the number of filled grains could be attributed to the efficient translocation of carbohydrates from the sources to the spikelets (sinks), consequently increasing the grain yield (Xu and Zhou, 2007). The varietal yield in this work was between high and low. Yield differences among different rice varieties have been reported any time a comparison is made between different varieties of rice in both field and glasshouse trials (Sabri et al., 2020). These differences are genetically based, although the environment greatly contributes to the manifestation of the inherent potential. In this work, the genotypes with higher numbers of effective tillers and higher numbers of grains per panicle also had higher yields. This result is consistent with the observation of Dutta et al. (2002). The result of the present study demonstrated that the 1,000 grain weight varied significantly among the tested varieties. Similar reports have been published by Ashrafuzzaman et al. (2009). The panicle length determines how many spikelets can be found in a panicle and, therefore, the number of filled spikelets and the final grain yield. Longer panicles result in more spikelets and filled grains if the other environmental conditions are not limiting. As found in this study, the panicle length positively correlated with the final yield. Agreement with this research finding can be found in the work of Chakraborty and Chakraborty (2010), who found a significant positive association between the panicle length and grain yield per hill.
The existence of genetic diversity is due to the inequality in the genetic structure of the individual in the population and distinct environment in which it is grown. The genetic variability found in plant germplasm and its estimates is an important factor for enlightening the gene pool and requires reliable heritability estimates in the effort to establish an effective breeding program. Tuhina-Khatun et al. (2015) stated that the appropriate selection and the magnitude of genetic improvement through the selection of the successive nature of the generation can be predicted with the knowledge of heritability. The effective selection can be accomplished with the character having high heritability, and it can be done at the beginning of the generation in order to obtain more dominant genetic factors in the plant genetic appearance. In this study, disease score had a higher value for the genotypic coefficient of variation, heritability, and genetic advance for the MR219 population, while for the MR263 population, percentage effective tillers had a higher value. Similar to the analysis by population, the characteristic that recorded a high value for genotypic coefficient variation, heritability, and genetic advance in Tanjung Karang, Seberang Perai, and UPM was also disease score. Therefore, selection for these traits is likely to assemble extra additive genes leading to further advancement of their performance. The positive association between the yield component and vegetative characteristics could be very effective to perform simultaneous selection to develop a new variety. The positive correlation between final yield and filled grain, total grain per panicle, grain weight per panicle, number of tillers, number of panicles, total grain weight per plant, percentage effective tillers, days to flowering, and days to maturity implies that better exploration of these characteristics could be used to establish desired genotypes. Chukwu et al. (2013) emphasized that the product of correlation is a tremendous value in the appraisal of the most effective procedures for selection of superior genotypes.
This study revealed the effectiveness of quantitative traits in grouping rice genotypes. Genetic divergence analysis among rice genotypes based on morphological traits can be used to classify and differentiate different genotypes in a population (Franco et al., 2001). This genetic divergence analysis also plays a vital role in selecting diverse genotypes for further improving rice varieties through breeding (Shahidullah et al., 2010; Oladosu et al., 2022). Clustering analysis based on qualitative and quantitative traits grouped 13 advance lines with the check variety in the MR219 population and 26 advance lines plus the check variety in the MR263 population into three and four different groups, respectively. Similarly, Ahmadikhah et al. (2008) clustered 58 rice varieties into four groups using 18 morphological traits, whereas Mazid et al. (2013) had his 41 rice genotypes clustered into 6 groups based on 13 morphological traits while Chukwu et al. (2015) also utilized cluster analysis in characterizing germplasms. To obtain greater heterosis, genotypes having distant clusters could be used as parents for the next hybridization program.
The significant differences observed in yield across the environment or location demonstrate the importance of conducting research on rice varieties in several environments. This also demonstrates the challenges that rice breeders encounter when choosing which types of rice should be commercially available. According to the findings of Oladosu et al. (2017), ANOVA does not provide a comprehensive explanation of the GEI. In light of this, further statistical analyses, such as multivariate and univariate, are more useful in characterizing and comprehending the GEI. According to Oladosu et al. (2017), the evaluation of stability and adaptability is the primary consideration to make when assessing genotypes across a broad spectrum of environmental conditions based on mega-environment analysis and genotype evaluation. A polygonal representation of the 41 rice accessions that were investigated for this study in three distinct environments is presented in Figure 7. In theory, the winning cultivar can be found at the vertex of the polygon, which is formed by the intersection of two sides. The perpendicular lines of the polygon create the boundary of the sector (Figure 7). In addition, Yan et al. (2000) observed that the genotype located at the sector’s vertices had the maximum yield in the environment that corresponds to that particular sector. According to the findings of Oladosu et al. (2017) and Hashim et al. (2021), genotypes that are located inside the polygon and are closer to the origin are resistant to the effects of environmental variability. Hence, if all of the environmental markers cluster together in one area, this suggests that a single genotype is optimal for all environments. However, if the environmental indicators were distributed across the sectors, this suggests that various genotypes prevailed in various environments. For the purpose of this investigation, the GGE biplot was produced based on the yield performance of 41 rice accessions across three different environments. It was revealed that genotypes G4 and G14 have the most yield and the most stable performance in TK and UPM, while genotype G12 has the highest yield per hectare in the SP environment.
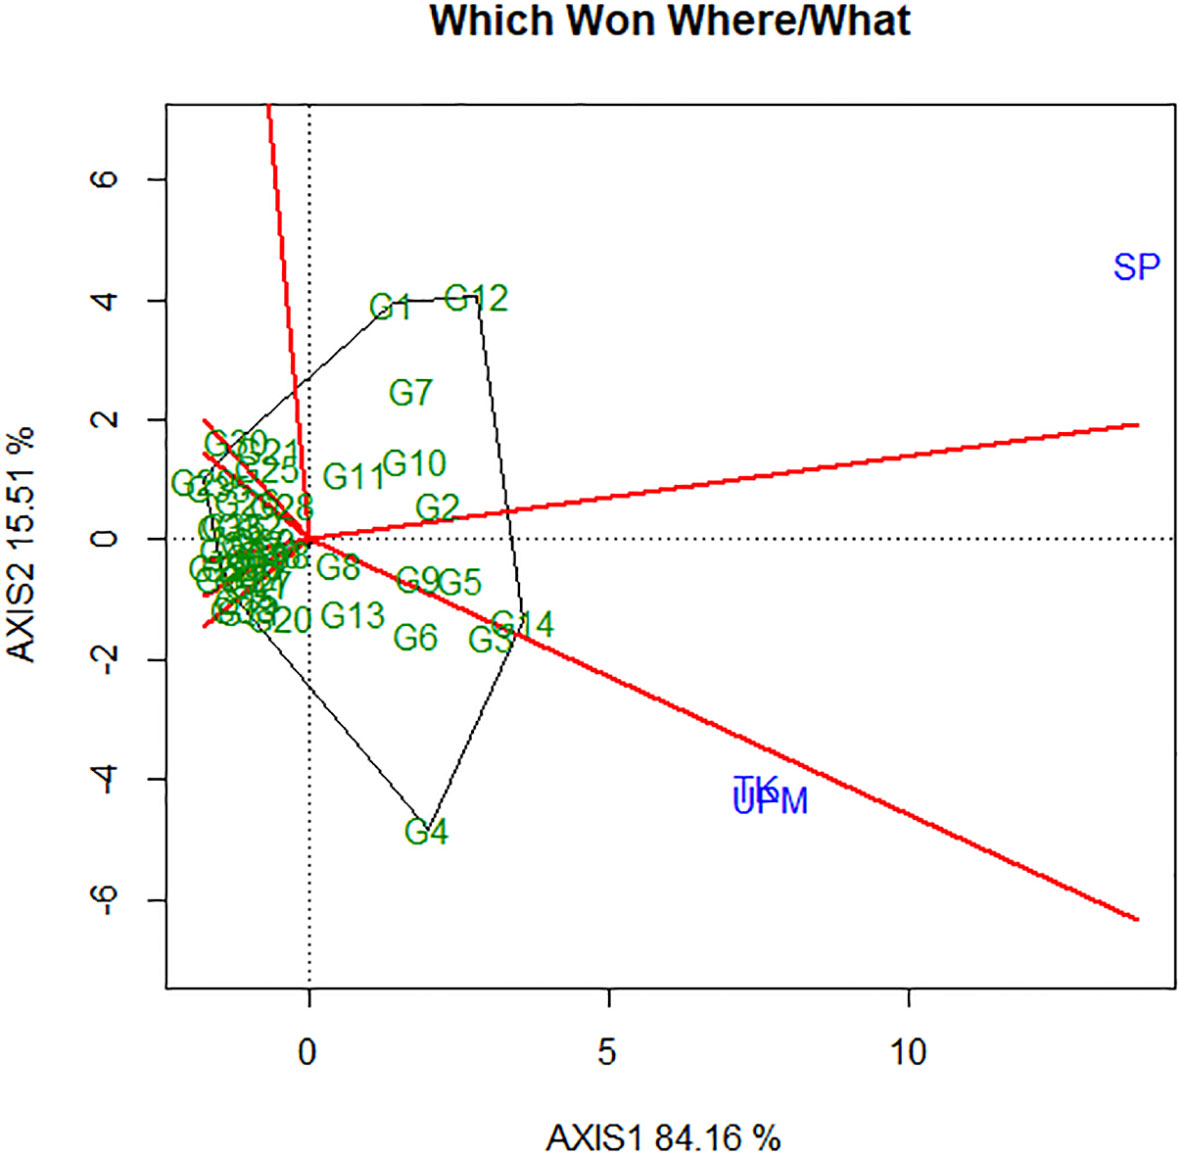
Figure 7 Polygon view of GGE biplot (which-won-where) showing the genotype main effects plus genotypic × environment interaction effect biplot (G + G × E) interaction effect of 41 rice genotypes in three locations for yield per hectare.
The variability observed in this study shows that there is ample scope for selection of superior rice genotypes. In addition, the significant and positive correlations observed in some yield and yield component traits indicated that these traits could be useful as selection criteria for simultaneous improvement towards high yield. The high values of heritability and genetic advance together with genotypic coefficient of variation for some important agronomic traits could also be utilized as selection criteria in rice improvement programs. Seberang Perai was the environment (location) that produced the highest average yield (5.62 t/ha), closely followed by Tanjung Karang (5.39 t/ha) and UPM (4.97 t/ha). Evaluation across the environments revealed that from the MR219-based population, genotype G3 had the highest yield and resistance to blast. The genotype also performed well in other agro-morphological traits studied. On the other hand, from the MR263-based population, G21 performed best across the three environments investigated. The selected genotypes also showed better performance as compared to their respective parents with higher yield and more resistance to the blast disease. Future breeding programs could be designed using the selected genotypes as well as the three plus four clusters derived from this study as new lines for further breeding programs.
The original contributions presented in the study are included in the article/supplementary material. Further inquiries can be directed to the corresponding author.
Conceptualization, SS and MYR; methodology, SS and MYR; software, SS, OY, and MYR; validation, SS, MYR, and SC; formal analysis, SS and MYR; investigation, SS and MYR; resources, SS, MYR, MI, AR, SC, OY, and N’AH; data curation, SS and MYR; writing—original draft preparation, SS and SC; writing—review and editing, SS, MYR, MI, SC, and OY; visualization, SS and MYR; supervision, MYR, MI, and AR; project administration, SS and MYR; funding acquisition, SS and MYR. All authors have read and agreed to the published version of the manuscript.
This study was supported by the Malaysia Ministry of Education for Long-Term Research Grant Scheme (LRGS).
The authors appreciate the funding for research activities on rice crop improvement for biotic resistance received from the Malaysian government through the Education Ministry.
The authors declare that the research was conducted in the absence of any commercial or financial relationships that could be construed as a potential conflict of interest.
All claims expressed in this article are solely those of the authors and do not necessarily represent those of their affiliated organizations, or those of the publisher, the editors and the reviewers. Any product that may be evaluated in this article, or claim that may be made by its manufacturer, is not guaranteed or endorsed by the publisher.
Acuña T. B., Wade L. J. (2012). Genotype× environment interactions for root depth of wheat. Field Crops Res. 137, 117–125. doi: 10.1016/j.fcr.2012.08.004
Ahmadikhah A., Nasrollanejad S., Alishah O. (2008). Quantitative studies for investigating variation and its effect on heterosis of rice. Int. J. Plant Production 2 (4), 297–308.
Ahmed M. A., Rafii M. Y., Izzati M. N. A., Khalilah A. K., Awad E. A., Kaka U., et al. (2022). Biological additives improved qualities, in vitro gas production kinetics, digestibility, and rumen fermentation characteristics of different varieties of rice straw silage. Anim. Production Science. doi: 10.1155/2013/963525. Accessed 21/11/2019.
Akos I. S., Rafii M. Y., Ismail M. R., Ramlee S. I., Shamsudin N. A. A., Ramli A., et al. (2021). Evaluation of inherited resistance genes of bacterial leaf blight, blast and drought tolerance in improved rice lines. Rice Sci. 28 (3), 279–288. doi: 10.1016/j.rsci.2020.08.001
Akos I. S., Yusop M. R., Ismail M. R., Ramlee S. I., Shamsudin N. A. A., Ramli A. B., et al. (2019). A review on gene pyramiding of agronomic, biotic and abiotic traits in rice variety development. Int. J. Appl. Biol. 3 (2), 65–96. doi: 10.20956/ijab.v3i2.7818
Allard R. W., Bradshaw A. D. (1964). Implications of genotype-environmental interactions in applied plant breeding 1. Crop Sci. 4 (5), 503–508.
Al-Tahir F. M. (2014). Flag leaf characteristics and relationship with grain yield and grain protein percentage for three cereals. J. Medicinal Plants Stud. 2 (5), 1–7.
Ashrafuzzaman M., Islam M. R., Ismail M. R., Shahidullah S. M., Hanafi M. M. (2009). Evaluation of six aromatic rice varieties for yield and yield contributing characters. Int. J. Agric. Biol. 11 (5), 616–620. doi: 09–088/AKA/2009/11–5–616–620
Assefa K., Ketema S., Tefera H., Nguyen H. T., Blum A., Ayele M., et al. (1999). Diversity among germplasm lines of the Ethiopian cereal tef [Eragrostis tef (Zucc.) trotter]. Euphytica 106 (1), 87–97. doi: 10.1023/A:1003582431039
Azmi M., Alias I., Abu Hassan D., Ayob A. H., Azmi A. R., Badrulhadza A., et al. (2008). Manual teknologi penanaman padi lestari (Serdang, Malaysia: MARDI).
Chakraborty R., Chakraborty S. (2010). Genetic variability and correlation of some morphometric traits with grain yield in bold grained rice (Oryza sativa l.) gene pool of barak valley. American-Eurasian J. Sustain. Agric. 4 (1), 26–29.
Chukwu S. C., Ekwu L. G., Onyishi G. C., Okporie E. O., Obi I. U. (2013). Correlation between agronomic and chemical characteristics of maize (Zea mays l.) genotypes after two years of mass selection. Int. J. Sci. Res. 4 (8), 1708–1712.
Chukwu S. C., Ibeji C. A., Ogbu C., Oselebe H. O., Okporie E. O., Rafii M. Y., et al. (2022b). Primordial initiation, yield and yield component traits of two genotypes of oyster mushroom (Pleurotus spp.) as affected by various rates of lime. Sci. Rep. 12, 19054. doi: 0.1038/s41598-022-16833-9
Chukwu S. C., Okporie E. O., Onyishi G. C., Obi I. U. (2015). Characterization of maize germplasm collections using cluster analysis. World J. Agric. Sci. 11 (3), 174–182. doi: 10.5829/idosi.wjas.2015.11.3.1854
Chukwu S. C., Rafii M. Y., Oladosu Y., Okporie E. O., Akos I. S., Musa I., et al. (2022a). Genotypic and phenotypic selection of newly improved putra rice and the correlations among quantitative traits. Diversity 14 (10), 812. doi: 10.3390/d14100812
Chukwu S. C., Rafii M. Y., Ramlee S. I., Ismail S. I., Hasan M. M., Oladosu Y. A., et al. (2019a). Bacterial leaf blight resistance in rice: a review of conventional breeding to molecular approach. Mol. Biol. Rep. 46 (1), 1519–1532. doi: 10.1007/s11033-019-04584-2
Chukwu S. C., Rafii M. Y., Ramlee S. I., Ismail S. I., Oladosu Y., Kolapo K., et al. (2019c). Marker-assisted introgression of multiple resistance genes confers broad spectrum resistance against bacterial leaf blight and blast diseases in putra-1 rice variety. Agronomy 10 (1), 42. doi: 10.3390/agronomy10010042
Chukwu S. C., Rafii M. Y., Ramlee S. I., Ismail S. I., Oladosu Y., Muhammad I. I., et al. (2020). Genetic analysis of microsatellites associated with resistance against bacterial leaf blight and blast diseases of rice (Oryza sativa l.). Biotechnol. Biotechnol. Equip. 34 (1), 898–904. doi: 10.1080/13102818.2020.1809520
Chukwu S. C., Rafii M. Y., Ramlee S. I., Ismail S. I., Oladosu Y., Muhammad I. I., et al. (2020). Recovery of recurrent parent genome in a marker-assisted backcrossing against rice blast and blight infections using functional markers and SSRs. Plants 9 (11), 1411. doi: 10.3390/plants9111411
Chukwu S. C., Rafii M. Y., Ramlee S. I., Ismail S. I., Oladosu Y., Okporie E., et al. (2019b). Marker-assisted selection and gene pyramiding for resistance to bacterial leaf blight disease of rice (Oryza sativa l.). Biotechnol. Biotechnol. Equip. 33 (1), 440–455. doi: 10.1080/13102818.2019.1584054
Comstock R. E., Moll R. H. (1963). “Genotype environment interactions,” in Statistical genetics and plant breeding (CIMMYT). doi: 10.1017/S0021859600062365. Accessed 12/12/2019
Dutta R. K., Baset M., Khanam S. (2002). Plant architecture and growth characteristics of fine grain and aromatic rices and their relation with grain yield. Int. Rice Commission Newslett. (FAO) Bull. la Commission Internationale du Riz (FAO) Noticiario la Comision Internacional del Arroz (FAO). Accessed 12/12/2019
Dutta P., Dutta P. N., Borua P. K. (2013). Morphological traits as selection indices in rice: A statistical view. Universal J. Agric. Res. 1 (3), 85–96. doi: 10.13189/ujar.2013.010308
Ebem E. C., Afuape S. O., Chukwu S. C., Ubi B. E. (2021). Genotype× environment interaction and stability analysis for root yield in sweet potato [Ipomoea batatas (L.) lam]. Front. Agron. 27. doi: 10.2135/cropsci1966.0011183X000600010011x
Eberhart S. T., Russell W. A. (1966). Stability parameters for comparing varieties 1. Crop Sci. 6 (1), 36–40. doi: 10.2135/cropsci1966.0011183X000600010011x
Falconer D. S. (1989). Introduction to quantitative genetics 3rd ed (Harlow: Longman Scientific & Technical).
Finlay K. W., Wilkinson G. N. (1963). The analysis of adaptation in a plant-breeding programme. Aust. J. Agric. Res. 14 (6), 742–754. doi: 10.1071/AR9630742
Franco J., Crossa J., Ribaut J. M., Bertran J., Warburton M. L., Khairallah M. (2001). A method for combining molecular markers and phenotypic attributes for classifying plant genotypes. Theor. Appl. Genet. 103 (6), 944–952. doi: 10.1007/s001220100641
Halim A. A., Rafii M. Y., Osman M. B., Oladosu Y., Chukwu S. C. (2021). Ageing effects, generation means, and path coefficient analyses on high kernel elongation in mahsuri mutan and basmati 370 rice populations. BioMed. Res. Int. 2021. doi: 10.1155/2021/8350136. Accessed 25/12/2021.
Hasan M. M., Rafii M. Y., Ismail M. R., Mahmood M., Alam M. A., Abdul Rahim H., et al. (2016). Introgression of blast resistance genes into the elite rice variety MR263 through marker-assisted backcrossing. J. Sci. Food Agric. 96 (4), 1297–1305. doi: 10.1002/jsfa.7222
Hashim N., Rafii M. Y., Oladosu Y., Ismail M. R., Ramli A., Arolu F., et al. (2021). Integrating multivariate and univariate statistical models to investigate genotype–environment interaction of advanced fragrant rice genotypes under rainfed condition. Sustainability 13 (8), 4555. doi: 10.3390/su13084555
Hossain M. B., Islam M. O., Hasanuzzaman M. (2008). Influence of different nitrogen levels on the performance of four aromatic rice varieties. Int. J. Agric. Biol. 10 (6), 693–696.
IRRI (2014). Standard evaluation system for rice.5th edition (Los Banos, Philippines: International Rice Research Institute).
Koutroubas S. D., Katsantonis D., Ntanos D. A., Lupotto E. (2009). Blast disease influence on agronomic and quality traits of rice. 33, 487–494. doi: 10.3906/tar-0812-15. Accessed 21/11/2019.
Krisnawati A., Adie M. M. (2018). Genotype by environment interaction and yield stability of soybean genotypes. Indonesian J. Agric. Sci. 19 (1), 25–32. doi: 10.21082/ijas.v19n1.2018.p25-32
Maclean J. L., et al (Ed.) (2002). Rice almanac. Los Baños: International Rice Research Institute, Bouake; Ivory Coast: West Africa Rice Development Association; Cali: International Center for Tropical Agriculture (Rome: Food and Agriculture Organization).
Makino A. (2011). Photosynthesis, grain yield, and nitrogen utilization in rice and wheat. Plant Physiol. 155 (1), 125–129. doi: 10.1104/pp.110.165076
Mazid M. S., Rafii M. Y., Hanafi M. M., Rahim H. A., Latif M. A. (2013). Genetic variation, heritability, divergence and biomass accumulation of rice genotypes resistant to bacterial blight revealed by quantitative traits and ISSR markers. Physiologia Plantarum 149 (3), 432–447. doi: 10.1111/ppl.12054
Miah G., Rafii M. Y., Ismail M. R., Puteh A. B., Rahim H. A., Latif M. A. (2015). Recurrent parent genome recovery analysis in a marker-assisted backcrossing program of rice (Oryza sativa l.). Comptes rendus biologies 338 (2), 83–94. doi: 10.1016/j.crvi.2014.11.003
Okporie E. O., Chukwu S. C., Onyishi G. C. (2013). Phenotypic recurrent selection for increase yield and chemical constituents of maize (Zea mays l.). World Appl. Sci. J. 21 (7), 994–999. doi: 10.5829/idosi.wasj.2013.21.7.2863
Oladosu Y., Rafii M. Y., Abdullah N., Magaji U., Miah G., Hussin G., et al. (2017). Genotype× environment interaction and stability analyses of yield and yield components of established and mutant rice genotypes tested in multiple locations in Malaysia. Acta Agriculturae Scandinavica Section B—Soil Plant Sci. 67 (7), 590–606. doi: 10.1080/09064710.2017.1321138
Oladosu Y., Rafii M. Y., Arolu F., Chukwu S. C., Muhammad I., Kareem I., et al. (2020). Submergence tolerance in rice: Review of mechanism, breeding and, future prospects. Sustainability 12 (4), 1632. doi: 10.3390/su12041632
Oladosu Y., Rafii M. Y., Arolu F., Chukwu S. C., Salisu M. A., Fagbohun I. K., et al. (2022). Superabsorbent polymer hydrogels for sustainable agriculture: A review. Horticulturae 8 (7), 605. doi: 10.3390/horticulturae8070605
Oladosu Y., Rafii M. Y., Magaji U., Abdullah N., Miah G., Chukwu S. C., et al. (2018). Genotypic and phenotypic relationship among yield components in rice under tropical conditions. BioMed. Res. Int., 2018. doi: 10.1155/2018/8936767. Accessed 21/11/2019.
Oladosu Y., Rafii M. Y., Samuel C., Fatai A., Magaji U., Kareem I., et al. (2019). Drought resistance in rice from conventional to molecular breeding: a review. Int. J. Mol. Sci. 20 (14), 3519. doi: 10.3390/ijms20143519
Pandey P., Anurag P. J., Tiwari D. K., Yadav S. K., Kumar B. (2009). Genetic variability, diversity and association of quantitative traits with grain yield in rice (Oryza sativa l.). J. bio-science 17, 77–82. doi: 10.3329/jbs.v17i0.7110
Ranawake A., Amarasingha U., Dahanayake N. (2013). Agronomic characters of some traditional rice (Oryza sativa l.) cultivars in Sri Lanka. J. Univ. Ruhuna 1 (1), 1143–1152. doi: 10.9734/IJPSS/2014/11421. Accessed 12/12/2019.
Ranawake A. L., Amarasinghe U. G. S., Hewage M. J., Pradeepika N. G. J. (2014). Effect of days to flowering on plant height and yield of rice (Oryza sativa l.). Int. J. Plant Soil Sci. 3 (9), 1143–1152. doi: 10.4038/jur.v1i1.6150
Rao S. P. (1991). Influence of source and sink on the production of high density grain and yield in rice. Indian J. Plant Physiol. 34, 339–348.
RStudio (2014) RStudio: Integrated development environment for r (Computer software v0.98.1074). RStudio. Available at: http://www.rstudio.org/.
Sabri R. S., Rafii M. Y., Ismail M. R., Yusuff O., Chukwu S. C., Hasan N. A. (2020). Assessment of agro-morphologic performance, genetic parameters and clustering pattern of newly developed blast resistant rice lines tested in four environments. Agronomy 10 (8), 1098. doi: 10.3390/agronomy10081098
Sarif H. M., Rafii M. Y., Ramli A., Oladosu Y., Musa H. M., Rahim H. A., et al. (2020). Genetic diversity and variability among pigmented rice germplasm using molecular marker and morphological traits. Biotechnol. Biotechnol. Equip. 34 (1), 747–762. doi: 10.1080/13102818.2020.1804451
Shahidullah S. M., Hanafi M. M., Ashrafuzzaman M., Ismail M. R., Salam M. A., Khair A. (2010). Biomass accumulation and energy conversion efficiency in aromatic rice genotypes. Comptes Rendus Biologies 333 (1), 61–67. doi: 10.1016/j.crvi.2009.10.002
Siwar C., Idris N. D. M., Yasar M., Morshed G. (2014). Issues and challenges facing rice production and food security in the granary areas in the East coast economic region (ECER), Malaysia. Res. J. Appl. Sciences Eng. Technol. 7 (4), 711–722. doi: 10.19026/rjaset.7.307
Tanweer F. A., Rafii M. Y., Sijam K., Rahim H. A., Ahmed F., Ashkani S., et al. (2015). Introgression of blast resistance genes (putative pi-b and pi-kh) into elite rice cultivar MR219 through marker-assisted selection. Front. Plant Sci. 6, 1002. doi: 10.3389/fpls.2015.01002.
Tanweer F. A., Rafii M. Y., Sijam K., Rahim H. A., Ahmed F., Latif M. A. (2015). Current advance methods for the identification of blast resistance genes in rice. Comptes Rendus Biologies 338 (5), 321–334. doi: 10.1016/j.crvi.2015.03.001
Titone P., Mongiano G., Tamborini L. (2015). Resistance to neck blast caused by pyricularia oryzae in Italian rice cultivars. Eur. J. Plant Pathol. 142 (1), 49–59. doi: 10.1007/s10658-014-0588-1
Tuhina-Khatun M., Hanafi M. M., Wong M. Y., Rafii M. Y. (2015). Reactions and diversity analysis of upland rice genotypes against blast disease of rice (Oryza sativa l.). Australas. Plant Pathol. 44 (4), 405–412. doi: 10.1007/s13313-015-0359-2
Wang J. L., Gao Y. B., Zhao N. X., Ren A. Z., Ruan W. B., Chen L., et al. (2006). Morphological and RAPD analysis of the dominant species stipakrylovii roshev. in inner Mongolia steppe. Botanical Stud. 47 (1), 23–35.
Xu Z. Z., Zhou G. S. (2007). Photosynthetic recovery of a perennial grass leymus chinensis after different periods of soil drought. Plant Production Sci. 10 (3), 277–285. doi: 10.1626/pps.10.277
Keywords: G×E, genotypic coefficient of variation (GCV), phenotypic coefficient of variation (PCV), heritability, genetic advance, Oryza sativa L., Magnaporthe oryzae
Citation: Salleh SB, Rafii MY, Ismail MR, Ramli A, Chukwu SC, Yusuff O and Hasan N’A (2022) Genotype-by-environment interaction effects on blast disease severity and genetic diversity of advanced blast-resistant rice lines based on quantitative traits. Front. Agron. 4:990397. doi: 10.3389/fagro.2022.990397
Received: 09 July 2022; Accepted: 16 November 2022;
Published: 07 December 2022.
Edited by:
Karthikeyan Adhimoolam, Jeju National University, South KoreaReviewed by:
Manickam Dhasarathan, Tamil Nadu Agricultural University, IndiaCopyright © 2022 Salleh, Rafii, Ismail, Ramli, Chukwu, Yusuff and Hasan. This is an open-access article distributed under the terms of the Creative Commons Attribution License (CC BY). The use, distribution or reproduction in other forums is permitted, provided the original author(s) and the copyright owner(s) are credited and that the original publication in this journal is cited, in accordance with accepted academic practice. No use, distribution or reproduction is permitted which does not comply with these terms.
*Correspondence: Mohd Yusop Rafii, bXJhZmlpQHVwbS5lZHUubXk=
Disclaimer: All claims expressed in this article are solely those of the authors and do not necessarily represent those of their affiliated organizations, or those of the publisher, the editors and the reviewers. Any product that may be evaluated in this article or claim that may be made by its manufacturer is not guaranteed or endorsed by the publisher.
Research integrity at Frontiers
Learn more about the work of our research integrity team to safeguard the quality of each article we publish.