
95% of researchers rate our articles as excellent or good
Learn more about the work of our research integrity team to safeguard the quality of each article we publish.
Find out more
ORIGINAL RESEARCH article
Front. Agron. , 27 October 2022
Sec. Disease Management
Volume 4 - 2022 | https://doi.org/10.3389/fagro.2022.943440
This article is part of the Research Topic New Approaches in the Detection of Plant Pathogens View all 4 articles
 Yaiza Gutierrez Vazquez1,2*
 Ian P. Adams1,2
 Sam McGreig1
 John Walshaw1
 Femke van den Berg1Roy Sanderson2Hollie Pufal1Chris Conyers1
 David Langton3Ruth Broadhead4
 Catherine Harrison1
 Neil Boonham2
Zymoseptoria tritici is the causal agent of Septoria tritici blotch, the most important disease affecting wheat crops and responsible for up to 50% loss in yield. Azoles and SDHIs are the main groups of fungicides used to control the disease. The efficacy of these fungicides has decreased in recent years due to resistance development. Fungicide resistance can be a result of mutations in the target genes, mutations in upstream regulatory elements that result in over-expression of target proteins and the overexpression of transporters that remove toxic compounds from cells. In the current study nanopore sequencing was used to analyse isolates, mock communities and field samples to determine the pathogen population composition related to azole resistance. Despite the presence of sequencing errors, the method was able to effectively differentiate the sequences of different haplotypes present in both mock and field populations for haplotypes that were relatively common in the overall population. However, haplotypes present at a frequency lower than 5% of the total population, could not be accurately distinguished from haplotypes generated through background sequencing errors. The nanopore protocols are rapid and inexpensive, enabling the routine profiling of haplotypes within pathogen populations at the start of the season or between sprays, facilitating the selection of the most appropriate fungicide to control them, yet limit further selection for azole resistance.
Septoria tritici blotch (STB) caused by Zymoseptoria tritici is the most damaging foliar disease of wheat in Northern Europe (Fones and Gurr, 2015) causing yield losses of between 10 and 50% each year (Burke and Dunne, 2008; Jørgensen et al., 2014; Fones and Gurr, 2015). The application of fungicides is the main method to control STB. However, intensive fungicide use has in many cases resulted in the selection for resistant isolates leading to less effective, or in extreme cases totally ineffective fungicides (Dooley et al., 2016; Jørgensen et al., 2017).
Resistance to methyl benzimidazole carbamate (MBC) and quinone outside inhibitors (QoI) fungicides is widespread (Griffin and Fisher, 1985; Fraaije et al., 2003) and hence only three fungicidal modes of action (MoA) remain available for STB control: multi-site inhibitors, succinate dehydrogenase inhibitors (SDHIs) and demethylation inhibitors (DMIs) also commonly known as azoles. Azoles interfere with the biosynthesis of ergosterol by interacting with the haem iron in 14α-demethylase (CYP51), which is a member of the Cytochrome P450 superfamily. Although azoles still make up the backbone of spray programmes designed to control STB in the UK, fungicide sensitivity is common and as a result are the main focus of this study.
Resistance to azoles can be the result of several different mechanisms. Mutations within the CYP51 coding region, lead to conformational changes referred to as target site resistance (TSR) (Leroux et al., 2007; Stammler et al., 2008; Cools and Fraaije, 2013). Upregulation of CYP51 due to inserts in the promoter or upregulation of membrane-bound transporters and intragenic recombination of CYP51 lead to non-target site resistance (NTSR) (Leroux and Walker, 2011; Cools and Fraaije, 2013; Kildea et al., 2019).
Better understanding of the genetic composition of the pathogen populations circulating in cropping systems could help manage pathogens and resistance build up in several ways. If the data can be produced fast enough, it could help to tailor fungicide spray programs in a responsive manner. Testing the circulating populations at the start of the season and/or between spray applications could establish how effective the previous treatment was and enable the selection of products which are effective for controlling the isolates remaining in the population. The data could contribute to the modelling of population dynamics, giving a better understanding of how different MOAs affect the population structure which could help develop more effective spray programmes. The methods could potentially also be used as a surveillance tool, deployed to detect the presence of new resistant isolates early, when their prevalence is low. Linked to appropriate management practices this could prevent the build-up of these isolates within populations prolonging the time over which the fungicide can provide sufficient disease control (van den Berg et al., 2013).
Considerable effort has been put into developing methods to identify the presence of mutations or genotypes in both isolates and populations. Methods such as Kompetitive allele specific PCR (KASP) (Vagndorf et al., 2018), quantitative PCR (qPCR) (Taher et al., 2014; Hellin et al., 2020), high resolution melting curve analysis using real-time PCR (HRM) (Curvers et al., 2015) and loop-mediated isothermal amplification (LAMP) (Fraaije, 2014) are all methods targeted at identifying specific mutations within isolates. Although these methods can provide rapid, and in some cases, in-field results through the use of portable platforms (e.g. LAMP using a Genie III device (Optisense Ltd)), they share common limitations. Generating haplotype information requires the use of multiple assays targeting different resistance mutations. To extend to profiling populations would entail first isolating pathogen and then testing multiple isolates, representative of the population. Performing multiple assays on multiple isolates in parallel carries significant time and consumable costs. Furthermore, these methods by definition are designed to previously known mutations and so cannot be used for identifying new mutations as they arise in surveillance applications.
Sequencing based methods can provide more detailed data on mutations. Sanger sequencing can provide haplotype data, but only of isolated pathogens. Multiple isolates can be sequenced simultaneously to generate population level data (Leroux et al., 2007; Estep et al., 2015; McDonald et al., 2019). High throughput sequencing (HTS) can generate sequence from many DNA fragments simultaneously and can therefore be useful for generating data from populations. The most commonly used method (Illumina) generates sequences much shorter (approximately 300nt) than the sequences of complete genes (e.g. 1632nt for CYP51). As a result, it can provide information on the frequencies of mutations present within a population, but not the haplotypes (McDonald et al., 2015; Wieczorek et al., 2015; Pieczul and Wąsowska, 2017). Given that multiple mutations can occur within gene targets and promoter regions, each potentially associated with a different resistance phenotype, the ideal method would generate longer reads, enabling the estimation of the frequencies of haplotypes within a population.
Over recent years, two new sequencing methods which allow the analysis of mixtures of long fragments have been developed (Laver et al., 2015; Rothfels et al., 2017): single-molecule real-time (SMRT) sequencing developed by Pacific Bioscience (PacBio) and nanopore sequencing developed by Oxford Nanopore Technologies (ONT). The use of ONT sequencing has the potential advantage that it can be done more rapidly and inexpensively than PacBio sequencing. However, ONT is reported to have high error rates which may prove problematic for resolving SNPs associated with TSR (Cui et al., 2020; Delahaye and Nicolas, 2021). The aim of this study was to determine whether MinION sequencing could be used to accurately resolve mutations present within the CYP51 gene of Z. tritici and to explore if the sequence data could be used to estimate the relative frequency of haplotypes within mock and field populations.
Z. tritici infected KWS Santiago wheat leaves were collected from a spray trial in Bishop Burton (Yorkshire, UK) in 2019 and from Salisbury and Ludlow (UK) during a previous project undertaken between 2015 and 2017 (Innovate UK project 102088, https://gtr.ukri.org/projects?ref=102088). Three additional samples obtained as part of the same project and originating from Shropshire and Dorset were used in a preliminary assay to test the reliability of nanopore sequencing. Spray trials developed in Bishop Burton were designed to explore the genetic changes in Z. tritici populations throughout the season. Eight different fungicides (SDHIs or azoles) were sprayed at two growth stages, GS31-32 and GS37- 39 (first node at least 1 cm above tillering node and flag leaf blade all visible, respectively), and a control plot (Table S1). Additionally, each plot was sprayed with Corbel (BASF, Ireland) to control powdery mildew and rust. Samples were collected at the beginning of the season, just before the first application (GS31-32) and after the last spray (GS71-72, grain watery ripe).
Pathogen isolations were performed following a method similar to that of Kildea (2009). Briefly, leaves were sequentially rehydrated in sterilized distilled water, sterilized in 10% NaClO, rinsed in water and dried out on sterilized Grade 1 filter paper (Whatman, GE Healthcare, Fischer Scientific, UK). Leaves were placed on water agar, exposing pycnidia upwards and incubated for 48 hours at 18-20°C whilst exposed to UV light. Single cirri were picked using a sterilized needle and transferred to Potato Dextrose Agar (PDA) with 1% streptomycin, after which the cultures were incubated for 3-5 days at 18-20°C whilst exposed to UV light. Single colonies were transferred to a new PDA plate and incubated for 3-5 days at 18-20°C in the presence of UV light. Pure cultures were obtained by scraping the isolates from the PDA plate and storing in 10% sterilised semi-skimmed milk at -20°C until required.
DNA was extracted from pure cultures using a QIAmp DNA Blood Mini Kit (Qiagen, Manchester, UK) according to the manufacturer’s protocol but replacing PBS with ATL buffer (Qiagen) in the lysis step which was incubated at 56°C for 3-12 hours instead of 10 min.
To extract DNA from leaves, leaves were first surface sterilized in 10% NaClO for 20 seconds, rinsed thoroughly in sterile water and air-dried for 15 minutes. Single leaves were cut into 1 cm pieces using a sterile scalpel and placed in a 5 ml tube (Axygen, Fisher Scientific, UK) with a 10 mm stainless steel ball bearing (Qiagen) and 3 ml of CTAB buffer (2% CTAB, 1.5 M NaCl and 1 M NaH2PO4, 1% antifoam in distilled water, Sigma Aldrich, Dorset, UK) before being homogenised using the Geno Grinder 2010 (SPEX Sample Prep, Rickmansworth, UK) at 1,000 rpm for 4 minutes. Supernatant was transferred into a 2 ml tube and centrifuged for 2 minutes at 5,000 rpm. Following centrifugation, 800 μl of the supernatant was transferred to a 2 ml tube containing 250 μl guanidinium isothiocyanate buffer (GITC) (guanidine thiocyanate 5.25 M, Tris HCl 50 mM, EDTA 20mM and 1.3% Triton X-100 in distilled water). Subsequently, 750 μl of precipitation solution (Wizard Magnetic DNA Purification System for Food, Promega, UK) was added after which the sample was vortexed for 20 seconds and then centrifuged for 10 minutes at 13,000 rpm. The supernatants (500 μl) were transferred to a 96-well plate for DNA binding along with 400 μl of 60% isopropanol, 50 μl of magnesil beads from the Wizard Magnetic DNA Purification System for Food kit. The samples were processed using a Kingfisher Flex automated, magnetic particle processor (Thermo Fisher Scientific, Loughborough, UK) transferring the magnetic beads through an aliquot of 900 μl of GITC buffer, two aliquots of 900 μl 70% ethanol before final elution of DNA into 200 μl of molecular grade water (Severn Biotech Ltd., UK). The resulting DNA was quantified using the dsDNA HS Assay Kit and the Qubit 2.0 Fluorometer (Life Technologies) and stored at -20°C until required.
DNA of three isolates (IS132, IS162 and IS172) with different haplotypes, which were previously sequenced in a single Flongle run, were combined in two isolate mixtures IS132:IS162, IS132:IS172 and IS162:IS172 of different ratios (95:5, 90:10, 85:15, 75:25, 60:40, 50:50, 40:60, 25:75, 15:85, 10:90 and 5:95) to generate 33 mock populations. Additionally, 6 more mock populations using mixtures of the three isolates IS132:IS162:IS172 were generated, 60:20:20, 80:10:10, 20:60:20, 10:80:10, 20:20:60 and 10:10:80. These mock populations were sequenced using a MinION R9.4 flow cell (Oxford Nanopore Technologies) for 48 hours and in a R10.3 flow cell (Oxford Nanopore Technologies) for 72 hours.
A total of 16 infected wheat samples from the field trial in Bishop Burton were sequenced in the same experiment as the mock communities. These samples were collected from plants treated with azoles, from which 8 leaves were collected from plants treated with Proline (Bayer, Cambridge, UK) and 8 treated with a new triazole. Leaves were dried overnight and stored at ambient room temperature (18-22°C) till needed. DNA was extracted as explained below from full leaves, sequenced on a MinION R9.4 flow cell for 48 hours and repeated using a R10.3 flow cell for 72 hours.
To confirm the size of the insertion in the promoter region of the CYP51 gene of isolate IS360, a PCR was performed using the primers Mg51-ProF 5’ GTGGCGAGGGCTTGACTAC 3’ and Mg51-SeqR 5’ CTGCGCGAGGACTTCCTGGA 3’, designed by Cools et al. (2012). The PCR contained 12.5 μl of LongAmp Taq 2X Master Mix (New England Biolabs Ltd, Hitchin, UK), 0.4 μM of each primer, 9.5 μl of SDW and 1 μl of the DNA extract. The PCR cycling conditions (C1000 thermocycler, Biorad, Watford, UK) were 94°C for 30s followed by 30 cycles of 94°C - 30s, 59°C - 30s, 65°C - 50s, followed by 65°C for 10 minutes.
DNA extracted from isolates collected in the field trials at Salisbury and Ludlow, were amplified using the primers ST51F1 5’ ATGGGTCTCCTCCAGGAAGTCCTCC 3’ designed by Fraaije (2014) and ST51R3 5’ TTGTGAAAGCAGCGTCTCCCTC 3’ designed in the current study, which amplify the full length of the CYP51 gene, including the upstream regulatory regions. The PCR contained 10 μl of 5X Phusion HF buffer (Thermo Scientific, Oxford, UK), 0.4 mM dNTPs, 0.4 μM of each primer, 1.5 μl of DMSO, 0.5 μl of Phusion Hot start Flex DNA polymerase, 31 μl of SDW and 1 μl of the DNA extract. The PCR cycling conditions were, 98°C for 30s followed by 35 cycles of 94°C - 10s, 68°C - 30s, 75°C - 60s, followed by 72°C for 10 minutes.
Amplification was confirmed using 1% agarose gel electrophoresis. PCR products were purified using a QIAquick PCR Purification Kit (Qiagen) following the manufacturer instructions followed by sequencing (Eurofins Genomics, Ebersberg, Germany) using the sequencing primers SF- 5’ GCGCAGTTCGACGCGCAATT 3’, F3- 5’ GCGGACCTCACCACTACCTCGA 3’ and SR2- 5’ CGCGCTATTCATTAGCATAACATCCACC 3’. Sequences were first checked for quality, primers were removed and contigs constructed for each isolate using Geneious Prime 2019 (version 2019.2.1) (https://www.geneious.com).
Full length CYP51 gene and upstream regulatory regions were amplified using primers containing Nanopore adapters and barcodes as follows, Cy51-MI-F1- 5’ TTTCTGTTGGTGCTGATATTGCCTTCGCTGAACACCTCGCTT 3’ and ST51-MI-R3- 5’ ACTTGCCTGTCGCTCTATCTTCTGAAAGCAGCGTCTCCCTC 3’. The PCR and cycling conditions were as described previously for LongAmp Taq 2X Master Mix. Amplification was confirmed by 0.5% agarose gel electrophoresis. PCR products were purified using AMPure XP beads (Beckman Coulter, Wycombe, UK) employing a 0.5X beads to sample ratio. Purified PCR products were tagged using the PCR Barcoding expansion 1-96 (EXP-PBC096, Oxford Nanopore) according to the manufacturer’s protocols. Barcoded PCR products were quantified using a Quant-iT Picogreen dsDNA Assay Kit (Thermo Fisher Scientific) in the Fluoroskan Ascent (Thermo Scientific). To estimate size of the amplicons in the library TapeStation D5000 high sensitivity assay (Agilent Technologies, Cheadle, UK) was used. Samples were pooled in equal amounts of DNA to a final quantity of 1-1.5 μg. The libraries were prepared using the SQK-LSK108 sequencing kit (Oxford Nanopore), following the manufacturer’s protocols and sequenced on a R9.4 MinION flow cell for 48 hours.
Similarly, libraries containing isolates, mock communities and DNA extracted from wheat leaves were prepared as described above but replacing the sequencing kit with the SQK-LSK109 following the manufacturer’s instructions and sequenced using MinION R9.4, R10.3 or Flongle flow cells.
MinION raw reads in fast5 format from the preliminary experiment (samples obtained from Salisbury and Dorset) were initially base called using Guppy v3.1.5, then re-analysed using a newer version (Guppy v3.4.5) to compare the quality score with further sequencing runs. Flongle and MinION raw reads from the Bishop Burton experiment were base called using the Guppy v3.4.5 GPU basecaller with the appropriate configuration file and demultiplexed, to determine which sequences came from which samples, using the Guppy barcoder (see Table S2 for more details on the bioinformatics pipeline used). Nanoplot (version 1.28.1) was used to check the key features and statistics of the sequencing run (De Coster et al., 2018). The most common parameter used to measure the sequence quality of the nucleotide is the Phred score, also known as Q score. The Phred score indicates the probability (p) of an incorrect base call: Q = -10log10(p). Thus, the higher the value of the Phred score, the higher the quality of the sequence. A Phred score of 10 represents a 10% base call error rate (0.1), i.e. 90% accuracy, while a Phred score of 20 relates to a 1% base call error rate.
Both the MinION and Flongle reads were filtered using Filtlong, for the highest quality 10 million bases, reducing the total number of reads analysed (https://github.com/rrwick/Filtlong). In addition, a further correction was applied to the Flongle reads using Canu (version 1.8), which corrects the reads by building a read and overlap database, selecting the most consistent overlaps and subsequently generating corrected reads for which read lengths are estimated (https://github.com/marbl/canu) (Koren et al., 2017). All filtered and corrected reads as well as Sanger sequences were mapped to the Z. tritici IPO323 reference genome (RefSeq assembly accession: GCF_000219625.1) using Minimap2 (version 2.17) (Li, 2018). CYP51 occurs on chromosome 7 of IPO323. A modified version of the IPO323 reference genome was manually created by adding the sequences of the 120 and 800 bp upstream insertions of the CYP51 gene identified in some strains of this study. This modified version was used as the mapping file for the reads obtained from full leaves. In addition to mapping all reads to the genome, reads were grouped according to whether the read represents the forward or reverse complement strand of the reference sequence. These groups will be referred to in the remainder of the paper as ‘forward’ and ‘reverse’, respectively. Alignments were visualised using the IGV software (https://software.broadinstitute.org/software/igv/) (Robinson et al., 2011; Thorvaldsdóttir et al., 2013; Robinson et al., 2017). Consensus sequences, theoretical nucleotide sequences represented by the most frequent nucleotide on each site, from the isolates were obtained with IGV and confirmed using MegaX (Kumar et al., 2018).
The isolate IS146 had a longer insertion in the promoter region when compared to the 120 bp or the 800 bp insertions. To analyse this isolate in detail, the reads were mapped to the original, unmodified IPO323 genome sequence using the LAST software (Frith et al., 2010) using the seeding scheme tuned for relatively high rates of insertion and deletion compared to substitution. Mapped reads with a probability of a miss-mapping > 10-6 were discarded. The alignments were then analysed with an in-house script (https://gitlab.fera.co.uk/jwalshaw/amplisegs) which grouped near-identical reference-sequence segments (to which reads had been mapped). In this method, reference segments were grouped such that each segment has a 5’ end ≤ 10 bp from the 5’ end of at least one other segment in the same group. Within each group, segments were then sub-grouped such that each segment’s 3’ end is ≤ 10 bp from the 3’ end of at least one other segment in the same group. Each subgroup thus represents a consensus segment of the reference segment, to which at least one (often very many) actual mapped reads segment belongs. For each consensus segment, the median 5’ and 3’ coordinates of all of the mapped IS146 reads were then determined. This results in effectively a consensus alignment of each segment of the IS146 amplified region and the corresponding segment of the reference genome.
To analyse mixed samples and populations, positions in the gene where the two isolates differed were annotated and the relative proportion of each nucleotide per position was collected using IGV. Moreover, to determine the haplotypes present in the mixture, how those nucleotides correlate at SNP positions, a script using Pysam (https://pysam.readthedocs.io/en/latest/#) (Li et al., 2009) was used to extract the nucleotides of interest and generate a sequence with the SNPs combinations.
A generalized linear model (GLM) was employed to determine which predictor variables affected the difference in the observed compared to predicted proportions of each polymorphism. A GLM, with quasibinomial errors was used using the “glm” function of the vegan package, since the response were proportion (percentage derived) variables. Predictors were the input proportions (i.e. predicted or expected percentages and observed or read percentages) of each isolate, the isolate type (IS172 and IS162), the position of the polymorphism, and method (R9.4 and R10.3).
The full-length sequence of CYP51, including the upstream region of three isolates (SEPT1276, SEPT1316 and SEPT1972) was determined using ONT and Sanger sequencing. The following SNPs were identified using both sequencing methods: i) L50S, D134G, V136A, I381V, Y461H for SEPT1276; ii) L50S, V136A, S188N, A379G, I381V, Y459del, G460del, S524T for SEPT1316 and iii) L50S, S188N, I381V, Y459del, G460del, N513K for SEPT1972.
The accuracy per SNP position was calculated using the different pipelines. Reads were mapped to the IPO323 reference genome (Figure S1) along with the CYP51 sequence (Figure S1A) and the upstream insertion (Figure S1B) obtained by Sanger sequencing. When raw reads were base-called using Guppy v3.1.5 the per SNP accuracy is between 84-94% (Figure S1C), for filtered reads with Filtlong this increases to 92-97% (Figure S1D) and for Canu corrected reads further increases to 99-100% (Figure S1E). The per position accuracy was improved when Guppy v3.4.5 was applied with the exception of the SNP present in the position 1,448,554 of the IPO323 reference genome, base called raw reads per SNP accuracy was between 82-94%, for filtered reads this increased to 92-99% and for corrected reads increases to 99-100%. Moreover, the median Phred score for the raw reads base called using Guppy v3.1.5 was 8.8, increasing to 13.0 when the reads were filtered. For Guppy v3.4.5, the median Phred score was 10.8 for raw reads and 13.0 with filtered reads.
Following sequencing of isolates (Flongle 9.4), 203,356 reads with a median Phred score of 9.2 (88% accuracy) were produced. After filtering with Filtlong the number of reads was reduced to 58,052 which increased the median Phred score to 11.1 (92.2% accuracy). Once reads were corrected with Canu, the per position consensus was between 98 and 99%. Before applying Canu, forward, reverse and consensus reads were aligned to the reference genome to detect recurrent errors, which includes errors in regions containing repeat sequences. As an example, the position 1,448,812 of the wild type (L50) is not in a sequence repeat (GACAAC), but when a SNP occurs, and the adenine (A) is substituted for a guanine (G) a repeat sequence occurs (GACGAC). As a result, in isolates IS132, IS162 and IS172 88-89% of the consensus reads (which includes forward and reverse reads) have a cytosine (C), when reads are divided by the orientation, 96-97% of the reverse reads have a C while only 83-84% of the forward reads have a C (Table 1).
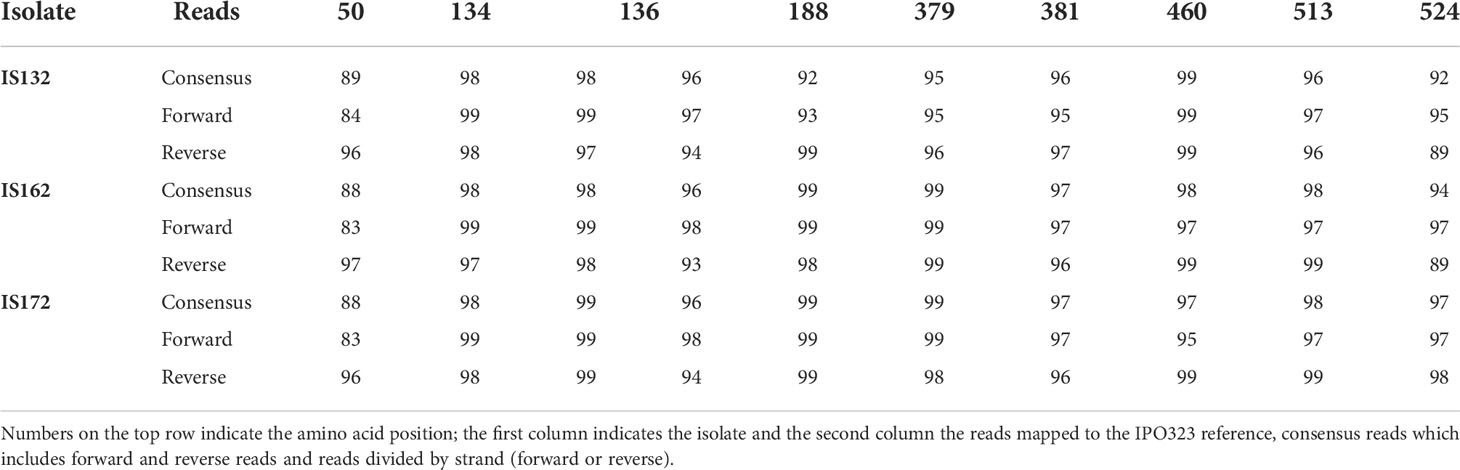
Table 1 Percentage of accuracy per SNP position of isolates IS132, IS162 and IS172.
Consensus sequences from the 22 isolates were translated and amino acid substitutions were identified by comparison to the reference sequence of IPO323 (Table 2). No wild type sequences were found, and each isolate showed at least four amino acid changes. Amongst the 22 isolates, a total of 11 polymorphic sites were identified (L50, D134, V136, S188, A379, I381, Y459, G460, Y461, N513 and S524), with the polymorphism combinations representing 12 different haplotypes altogether. Isolates with the same polymorphism combinations were considered part of the same haplotype. The most common CYP51 haplotype contained the following amino acid substitutions V136C, I381V, Y461H and S524T, which were identified in isolates IS19, IS46, IS146, IS167, IS370, IS434 and IS487. The other polymorphism combinations were present in either one or maximum of two isolates. The haplotype with the most mutations was represented by isolates IS132 and IS472 and were characterized by 10 mutations (L50S, D134G, V136C, S188N, A379B, I381V, Y459del, G460del, N513K, S524T) when compared to the reference.
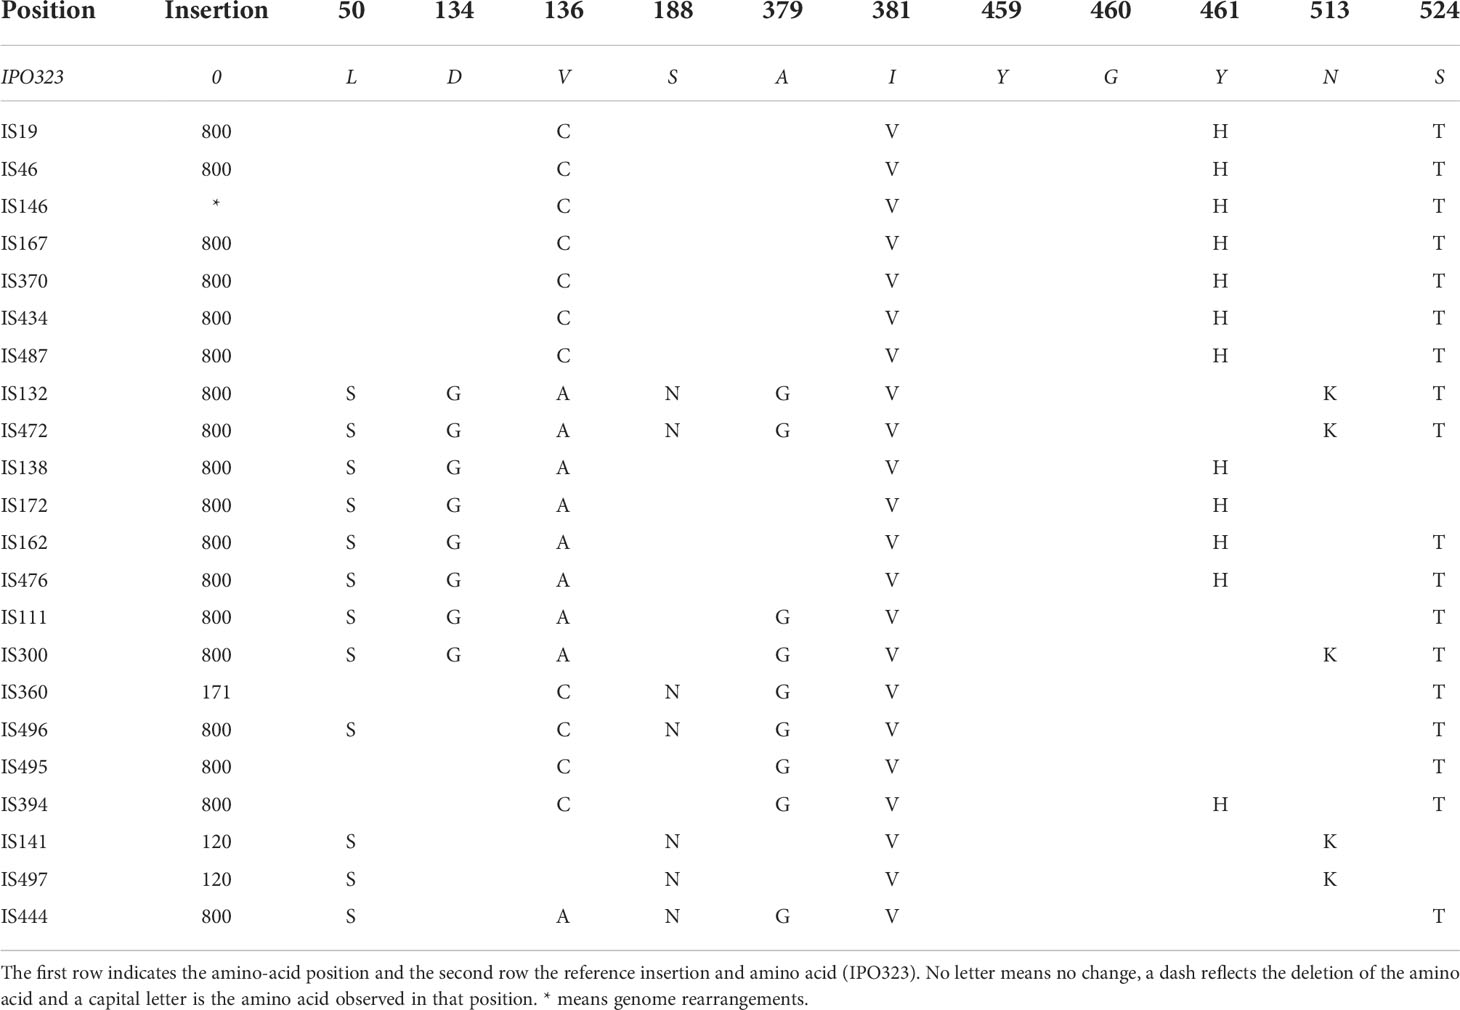
Table 2 CYP51 haplotypes identified using nanopore sequencing on a Flongle flow cell.
From the 22 samples, 18 had an 800 bp insertion in the upstream regulatory region and two samples had a 120 bp insertion. In addition to the most common insertions (120 bp and 800 bp), a 171 bp insertion was detected using ONT and confirmed by Sanger sequencing in isolate IS360.
Due to the unexpected pattern in the upstream region of the IS146 isolate when amplicon sequences were visualized in IGV the additional mapping analysis of these sequences to the reference genome was performed as described, ignoring all reference genome segments that were mapped by fewer than 100 read segments. The results indicated that this isolate exhibited genome rearrangements which resulted in the amplified sequence being almost 6 kb long (the highest median 3’ coordinate value of a consensus read segment is 5,925), with substantial segments of approximately 200 bp to 900 bp length corresponding to various segments of chromosomes 2, 10 and 13 flanked by large segments at the 5’ (2,200 bp) and 3’ (670 bp) ends corresponding to chromosome 7 as expected. A 400 bp segment prior to the 3’ chromosome 7 segment is unaccounted for by these mappings. Some of the read segments are essentially sub-segments of others, while some read segments which map to different chromosomes overlap, e.g. a 200 bp overlap between a 370 bp segment mapping to chromosome 10 and a 500 bp segment mapping to chromosome 13. Also, the segments corresponding to chromosome lie almost wholly within the 5’ segment which maps to chromosome 7. This is consistent with the chromosome sequences of the reference genome itself being the result of ancestral duplications and rearrangements.
Following sequencing (R9.4 MinION flow cell) of mock communities (Table 2), 2,827,220 reads with a median Phred score of 10.4 (90.88% accuracy) were generated. After filtering, the number of reads decreased to 142,903 and the median Phred score increased to 13.8 (95.8% accuracy). The same experiment was repeated by sequencing the same library in an R10.3 flow cell, resulting in 4,854,782,586 reads with a median Phred score of 11.1 (92.2% of accuracy). After filtering, 133,151 reads were obtained with a median Phred score of 14.7 (96.6% of accuracy).
Due to an experimental error in the preparation of the mock community formed by 90% of IS172 and 10% of IS162 the mixture was discarded. All multi-level interactions of the GLM were fitted, and the model was simplified to the minimal number of significant predictors (isolate type, position of the polymorphism and flow cell). Model assumptions were checked with comparison with quantile-quantile (QQ plots) of residuals. The method (R9.4 or R10.3) and the position of the polymorphism did not have an effect in the model. Conversely, the isolate had an effect in the model (p – value = 0.00159), with isolate IS172 being observed in a higher proportion than IS162 (Figure 1).
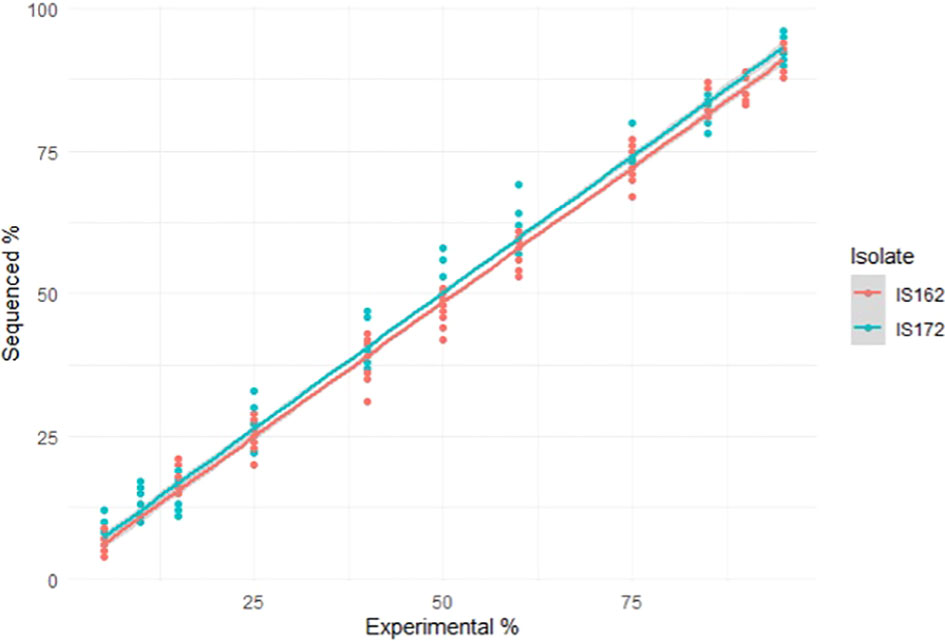
Figure 1 Scatter plot and fitted line representing the sequenced percentage of each isolate or observed percentage in the laboratory and the experimental or expected percentage.
The two isolates (IS172 and IS162) differed in six nucleotides, located in positions 1,446,998, 1,447,003, 1,447,044, 1,447,063, 1,447,093 and 1,447,118 (IPO323 reference genome nucleotide coordinates). The percentage of reads containing the observed versus expected nucleotide were visualised per position in Table 3 For R9.4 expected and observed percentages differed between 0% to 9% while for R10.3 the error rate was reduced to between 0% to 7%. Due to the better performance of the R10.3 flow cell, the dataset from this flow cell was used for further analyses.
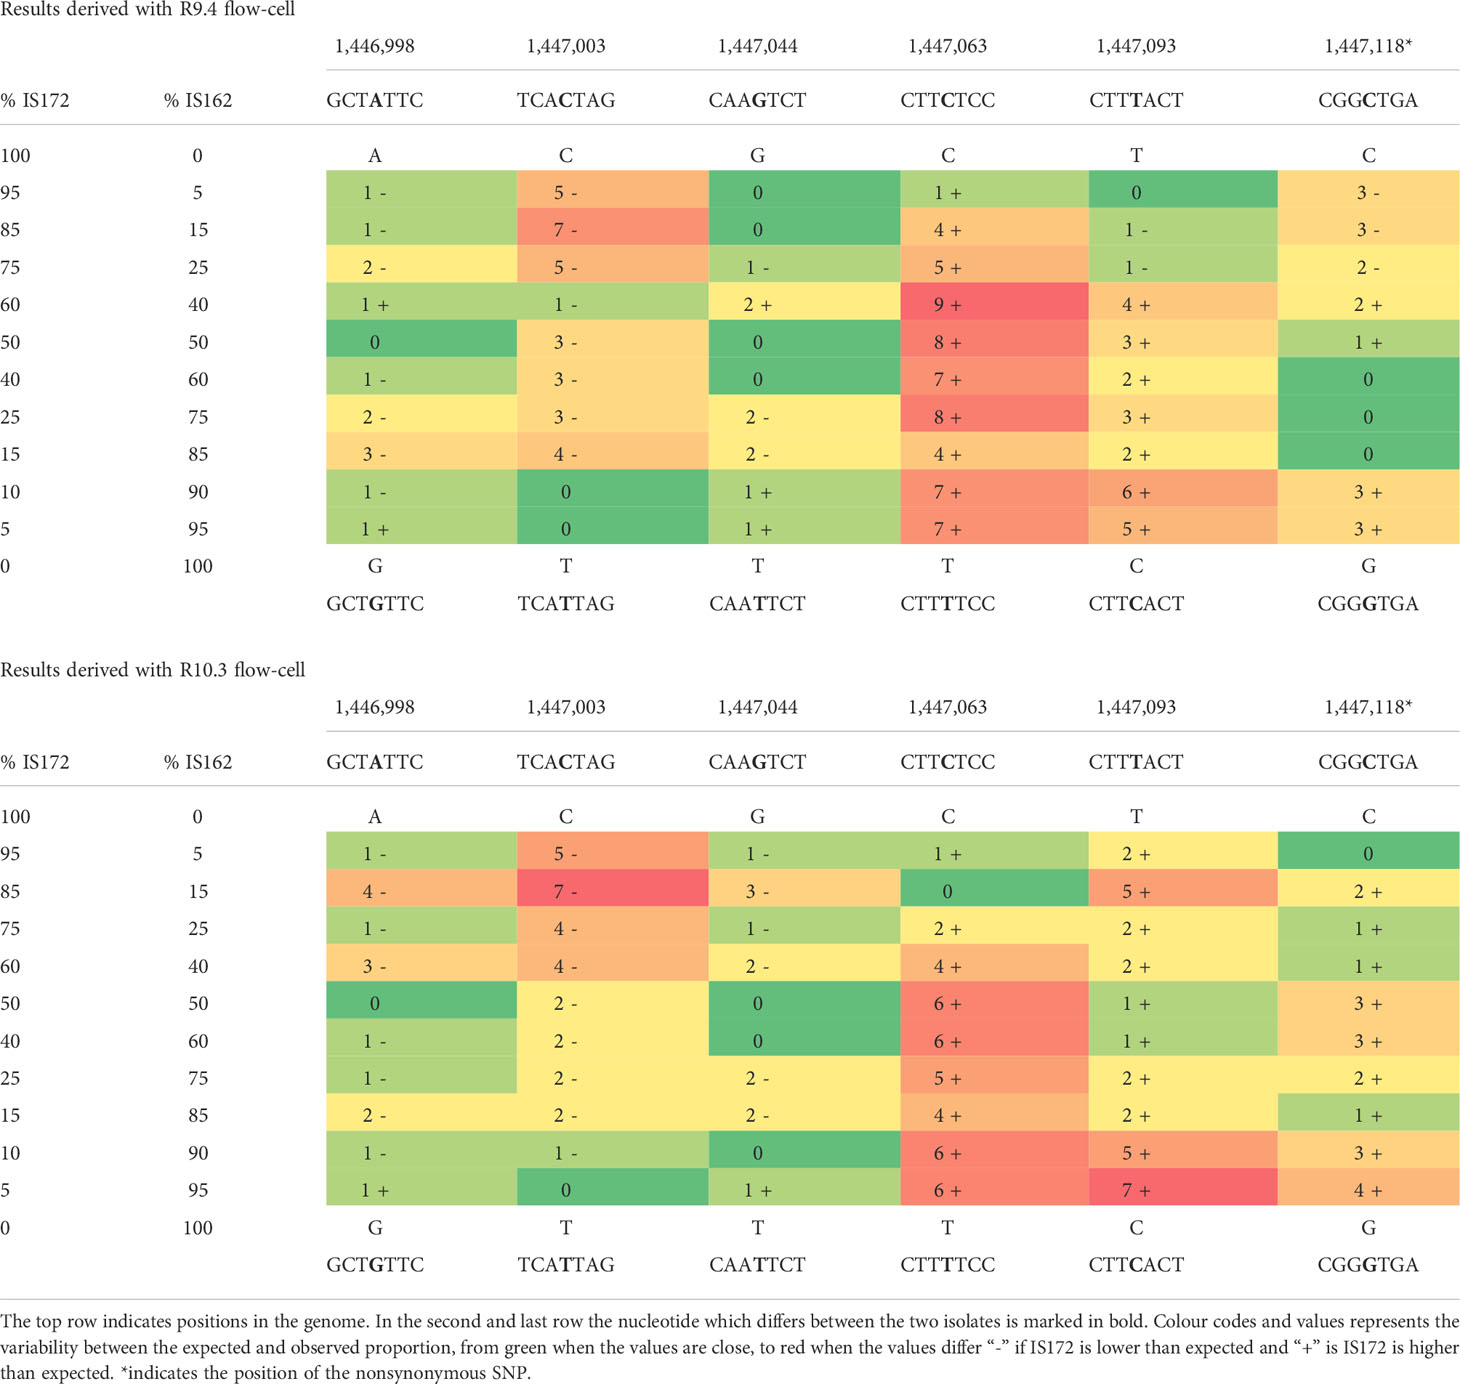
Table 3 Variability between the expected and observed percentages of each polymorphism in IS172 and IS162 mixtures.
To quantify the haplotypes present in the IS162 and IS172 mixtures, the analysis was focused on the SNPs that differed between the two isolates which were extracted and concatenated using Pysam (columns 3 and 4 in Table 3). Each mixture contained approximately 2500 reads and for each of these reads the nucleotide sequence for the six positions of interest was extracted and subsequently the observed frequency of each sequence calculated. For each mixture, a total of 13-23 sequences were obtained. When haplotypes were determined based on the six nucleotides, an error rate between 27.9% to 45.77% was observed, indicating that the reads that were not correctly assigned to either of the two isolates (Table 3). However, some of the observed mutations were silent when sequences were translated into its representative amino acid and the error rate was reduced to between 4.58 and 11.29%, resulting in a much higher recovery of the expected isolate frequencies (Table 4).
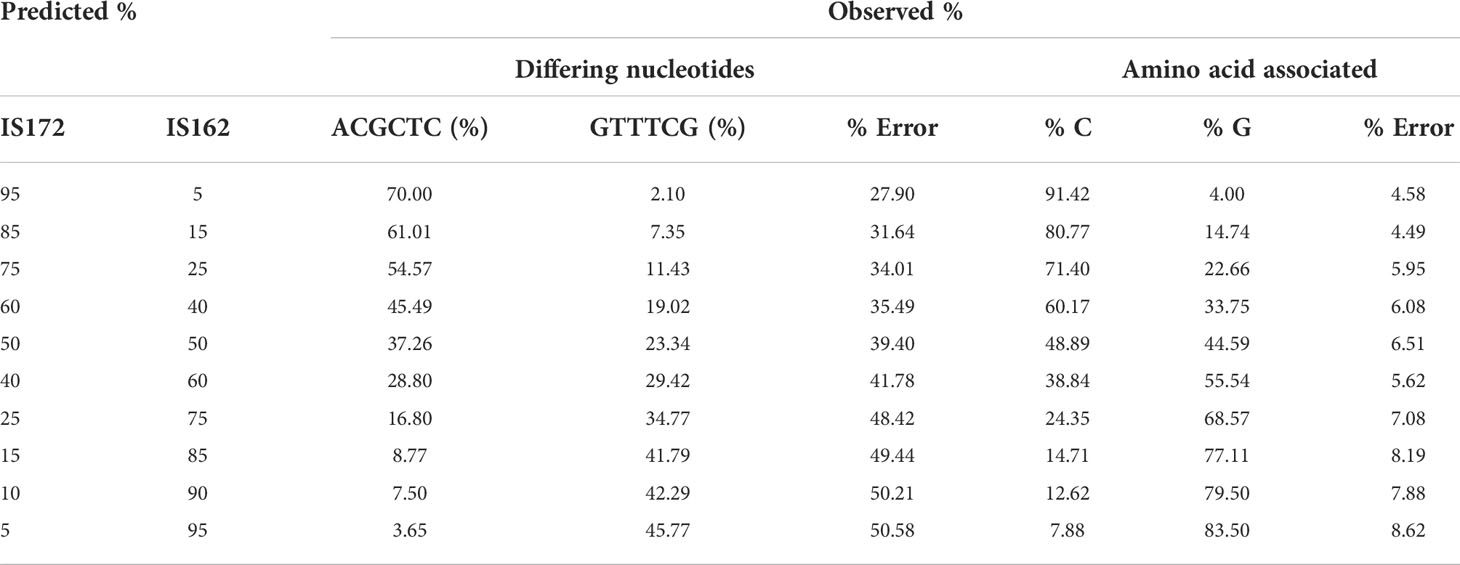
Table 4 Summary of the observed versus predicted percentages for each isolate based on the six nucleotides which differ between the two isolates (IS172/ACGCTC versus IS162/GTTTCG) and just analysing the SNP which translate into a different amino acid.
The frequency of haplotypes within the mixtures IS162:IS132, IS172:IS132 and IS132:IS162:IS172 were estimated and difference between the experimental and observed percentage varied from 0-7% (Figure 2) in the IS172:IS132 and IS162:IS132 mock communities. Moreover, in most of the 95-5% mixtures the haplotype in the lower concentration could not be determined as it was present below the 5% threshold. Similarly, the frequency of the haplotypes above 5% in IS132:IS162:IS172 mixtures were extracted (Table 5). The variability between experimental and observed percentages in mock communities where 3 isolates where mixed was between 0.7 and 6.6%.
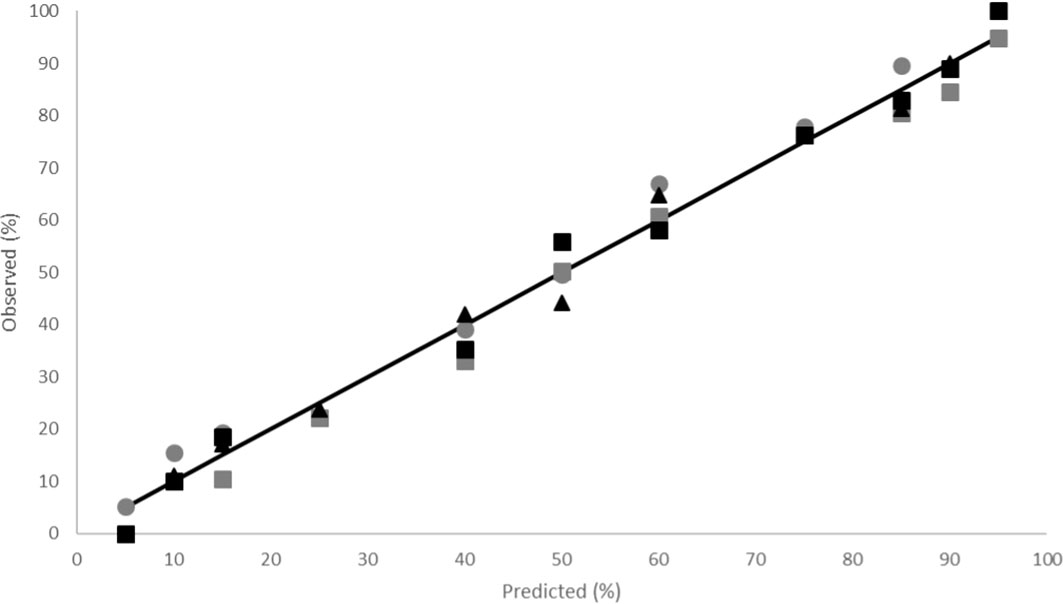
Figure 2 Summary of the observed versus predicted percentages of each haplotype extracted from the IS172:IS132 (grey symbols) and IS162:IS132 (black symbols) mock communities, with circles, squares and triangles representing isolates IS172, IS132 and IS162, respectively. The solid line represents perfect agreement between predicted and observed percentages of haplotypes.
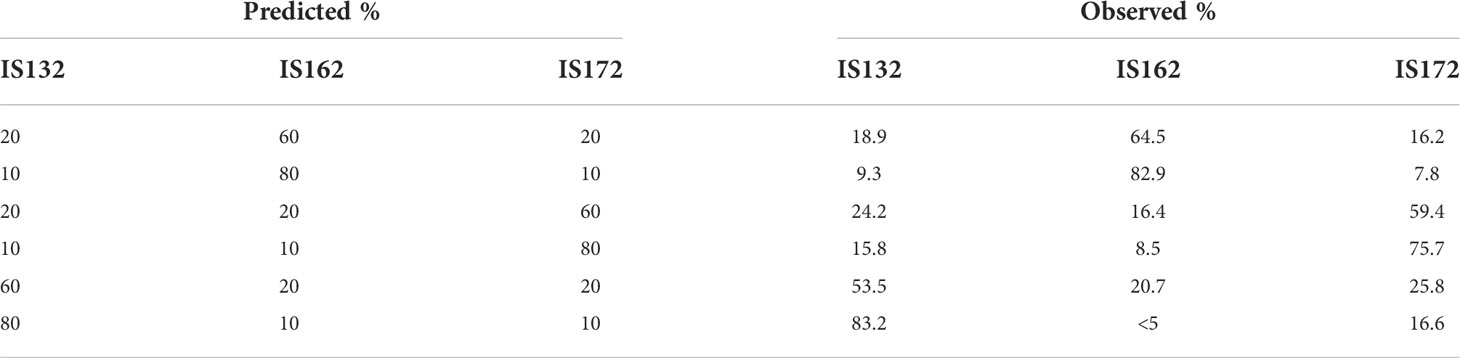
Table 5 Summary of the observed versus predicted percentages of each haplotype extracted from the IS132:IS162:IS172 mock communities.
When DNA from wheat leaves was sequenced and haplotypes present above 5% were identified each population had between 1 and 6 haplotypes (Table S3). The relative proportion of each haplotype was calculated by dividing by the sum of the haplotypes above 5%. For example, for POP1 a total of 30 haplotypes were identified, of which four haplotypes were present at > 5%. Of these four haplotypes 37.5% had the mutations L50S, V136C, S188N, Y459del, G460del, N513K and the 120 bp insertion in the upstream region, 25.1% had L50S, S188T, A379G, Y459del, G460del, S524T and the 800 bp insertion, 22.6% L50S, D134G, V136A, S524T and the 800bp insertion and 15% had S524T and 800 bp (Table S4). The four haplotypes represented 70% of the total number of sequences recovered.
Long read length, high-throughput sequencing (HTS) has the potential to resolve the presence of mutations within the target site genes that lead to resistance to agrochemicals and to provide the information at the population level, avoiding the need to isolate and sequence multiple haplotypes of the pathogen. Single-molecule real-time (SMRT) sequencing developed by Pacific Bioscience (PacBio) has been used to identify mutations within the CYP51, Sdh B, C and D subunits and cytochrome b genes, the main target proteins of azoles, SDHIs and QoIs, respectively (Samils et al. (2021). Nanopore sequencing (Oxford Nanopore) is an inexpensive platform for long-read HTS, well suited to routine diagnostic use. Radhakrishnan et al. (2019) utilised Nanopore sequencing to rapidly identify strains of Puccinia striiformis f.sp. tritici by sequencing DNA extracted from a large number of individual pustules to elucidate the strain makeup rust populations (https://nanoporetech.com/events/agrigenomics-solutions-online-event-qa).
The studies of Samils et al. (2021) and Radhakrishnan et al. (2019) were completed using DNA extracted from individual isolates of the pathogens (either isolated in-vitro or within individual pustules), making the identification of known haplotypes within the HTS data a trivial task. When directly used to identify and estimate the frequency of haplotypes within populations, the challenge may be more significant, especially when using nanopore sequencing where the reported high error rates (Delahaye and Nicolas, 2021) may make identification of SNPs difficult.
As a result, the aim of this study was to determine whether nanopore sequencing could be used to accurately resolve mutations present within the CYP51 gene of Z. tritici and to explore if the relative frequency of haplotypes within populations could be estimated.
Errors in nanopore sequencing can be both random and recurrent (Malmberg et al., 2019; Wick et al., 2019). Random errors are sporadic and do not follow a pattern, while recurrent errors are sequence context-dependent (mainly in homopolymer regions) and occur repeatedly in the same positions. In a population study, random errors at a low frequency are only likely to impact our ability to identify new and very rare haplotypes. On the other hand, recurrent errors will likely be present in higher proportions and could be interpreted as the presence of new SNPs within the population, or could mask the identification of known SNPs. In order to distinguish between recurrent errors and SNPs, the methods outlined by Medaka (https://nanoporetech.github.io/medaka/future.html) were followed, which highlighted that recurrent errors have a strand bias. This bias occurs when a particular strand is sequenced but not found when the same region is sequenced on the opposite strand. In this study, forward and reverse strands of the SNPs were aligned to the reference sequence separately and forward and reverse consensus sequences produced. Using the resultant consensus strands in the analysis then allowed SNPs associated with recurrent errors to be more accurately distinguished from SNPs of interest.
It was shown that there was good agreement between observed and expected results from mock mixtures of isolates when nonsynonymous substitutions were being compared (1-7% error rate). However, the error rate increases significantly when haplotypes with multiple nonsynonymous nucleotides were compared (23-45%). Mutations found within or adjacent to homopolymer and sequence repeat regions (both single nucleotides or repeating dinucleotides) resulted in higher error rates which were consistent with previous findings of homopolymer regions being a source of errors (Zeng et al., 2013; delaGorgendiere et al., 2018). To minimize the effect of the homopolymer regions Oxford nanopore developed new pores with a longer barrel and two electric current reading points (R10.3), compared with the shorter barrel pores in the R9.4 flow cells which have a single reading point (Tytgat et al., 2020). Our analysis has shown that the error rates are reduced using R10.3 flow cells from 4.2% to 3.4%, with the highest relative reduction in error rates observed within homopolymer regions.
The aim of the study was to identify haplotypes, rather than to identify presence of individual mutations present in a population. SNPs were extracted from each read and reads with similar SNP profiles were identified and clustered together. SNP extraction was tested in the different mock communities. From each IS172:IS162 mock community, haplotype errors, when only looking at the nucleotides which will translate into a different amino acid, represented between 4.58% and 8.62% of reads, indicating that haplotypes present at a low frequency (<5%) within populations would not be discriminated from sequencing errors. Using the MinION method developed here, eleven leaves were analysed to determine the presence and frequency of different haplotypes, with haplotypes detected at a frequency below 5% disregarded during further analysis. This analysis revealed that each leaf contained between 1 and 6 haplotypes, with a total of 16 unique haplotypes identified across all the leaves, representing the field population composition.
It was envisaged that a better understanding of the presence and frequency of haplotypes within fungal pathogen populations could potentially be used for decision making related to fungicide spray applications in two ways. Firstly, it could be used to identify the most frequent haplotypes within a population, which could be used to guide within season modifications of the spray programmes. For this to be effective the time between sample collection and generation of results should be sufficiently rapid to facilitate decision making between spray timings. The method developed here may prove suited to this application. Secondly, the method could be used to develop a surveillance programme to identify new azole resistance mutations, which can then guide the implementation of appropriate resistance management practises to limit the development of further resistance. For this to be successful, the method ought to be able to detect haplotype frequencies at very low frequencies as it has previously been shown that a fungicide’s effective life (number of consecutive growing seasons that the fungicide is able to provide effective control) is strongly affected by the initial resistance frequency (van den Berg et al., 2013). Given that the current method cannot accurately identify haplotypes present at a frequency below 5%, at this point in time the method offers limited value to this application.
In terms of delivery of routine diagnostic testing service, the platform should be accessible, inexpensive and rapid in use, enabling the results to be relevant for decision making in the field. In these terms the ONT platform is an attractive proposition. The ONT platform is scalable from 7 Tb of data on a 48 cell ProMethION through MinION flow-cells that can produce 30 Gb of data each, down to an adapter for smaller capacity flow-cells (Flongle) which can produce up to 2 Gb of data. Flongle flowcells currently cost £75 making them suitable for a small number of samples. This is a major advantage over many other HTS platforms were higher reagent costs mean that more samples are needed to per run to keep the costs practice. This scalability is coupled with low capital costs for the lower throughput devices making them an affordable proposition for many labs. From a practical perspective this allows diagnostic services to access the platform suited to the level of service they aim to provide. Data generation using the ONT platform is rapid, it is possible to generate data from samples within a single day which is sufficiently rapid to enable the between modification of spray programmes (Fraaije, 2014).
In this study it was shown that nanopore sequencing could be used to elucidate the haplotype composition of a Z. tritici field population, in relation to azole resistance using single DNA extracts from whole leaves. The method was able to accurately identify haplotypes present at a frequency of approximately 5% of the total population with results being available within 72 hours after receipt of samples. This should enable the identification of the major members of a population cycling within a crop, between sprays, facilitating more accurate selection of MOAs best suited to control the active population in real-time. This could contribute to better disease control in the short term and a reduction in the resistance selection pressure in the long term.
The datasets presented in this study can be found in online repositories. The names of the repository/repositories and accession number(s) can be found in the article/Supplementary Material.
YGV, IA, FB, DL, and NB conceived the work. YGV, IA, SM, JW, RS, HP, CC, RB, and CH completed laboratory work. YGV, IA, SM, JW, RS, FB, and NB contributed to data analysis. All authors contributed to drafting the manuscript. All authors contributed to the article and approved the submitted version.
The work was funded by the Institute for Agrifood Research Innovation (IAFRI) a joint institute owned by the Newcastle University and Fera Science Ltd. The authors declare that this study received funding from the Institute for Agrifood Research Innovations. The funder was not involved in the study design, collection, analysis, interpretation of data, the writing of this article or the decision to submit it for publication.
We acknowledge the contribution of Agrii who allowed access to their field trial programme to facilitate the study.
Authors YGV, IA, SM, JW, FB, CC, and CH were employed by Fera Science Ltd. Author DL was employed by Origin Enterprises PLC. Author RB was employed by Agrii.
The remaining authors declare that the research was conducted in the absence of any commercial or financial relationships that could be construed as a potential conflict of interest.
All claims expressed in this article are solely those of the authors and do not necessarily represent those of their affiliated organizations, or those of the publisher, the editors and the reviewers. Any product that may be evaluated in this article, or claim that may be made by its manufacturer, is not guaranteed or endorsed by the publisher.
The Supplementary Material for this article can be found online at: https://www.frontiersin.org/articles/10.3389/fagro.2022.943440/full#supplementary-material
Burke J. J., Dunne B. (2008). Field testing of six decision support systems for scheduling fungicide applications to control mycosphaerella graminicola on winter wheat crops in Ireland. J. Agric. Sci. 146 (4), 415–428. doi: 10.1017/S0021859607007642
Cools H. J., Bayon C., Atkins S., Lucas J. A., Fraaije B. A. (2012). Overexpression of the sterol 14α-demethylase gene (MgCYP51) in Mycosphaerella graminicola isolates confers a novel azole fungicide sensitivity phenotype. Pest Manag Sci. 68 (7):1034–40. doi: 10.1002/ps.3263
Cools H. J., Fraaije B. A. (2013). Update on mechanisms of azole resistance inMycosphaerella graminicola and implications for future control. Pest Manage. Sci. 69 (2), 150–155. doi: 10.1002/ps.3348
Cui J., shen N., Lu Z., et al (2020). Analysis and comprehensive comparison of PacBio and nanopore-based RNA sequencing of the Arabidopsis transcriptome. Plant Methods 16, 85. doi: 10.1186/s13007-020-00629-x
Curvers K., Pycke B., Kyndt T., Vanrompay D., Haesaert G., Gheysen G. (2015). A high-resolution melt (HRM) assay to characterize CYP51 haplotypes of the wheat pathogen mycosphaerella graminicola. Crop Prot. 71, 12–18. doi: 10.1016/j.cropro.2015.01.018
De Coster W., D'Hert S., Schultz D. T., Cruts M., Van Broeckhoven C. (2018). NanoPack: Visualizing and processing long-read sequencing data. Bioinformatics 34 (15), 2666–2669. doi: 10.1093/bioinformatics/bty149
delaGorgendiere K., Gatulis J., Brissette J., Scioletti J., Bishop B., Piermarini P., et al. (2018). P022NGS homopolymer detection error resulted A03:01 mistyped as A03:21n. Hum. Immunol. 79, 76–76. doi: 10.1016/j.humimm.2018.07.080
Delahaye C., Nicolas J. (2021). Sequencing DNA with nanopores: Troubles and biases. PloS One 16 (10). doi: 10.1371/journal.pone.0257521
Dooley H., Shaw M. W., Mehenni-Ciz J., Spink J., Kildea S. (2016). Detection of zymoseptoria tritici SDHI-insensitive field isolates carrying the SdhC-H152R and SdhD-R47W substitutions. Pest Manag. Sci. 72 (12), 2203–2207. doi: 10.1002/ps.4269
Estep L. K., Torriani S. F. F., Zala M., Anderson N. P., Flowers M. D., McDonald B. A., et al. (2015). Emergence and early evolution of fungicide resistance in north American populations of zymoseptoria tritici. Plant Pathol. 64 (4), 961–971. doi: 10.1111/ppa.12314
Fones H., Gurr S. (2015). The impact of septoria tritici blotch disease on wheat: An EU perspective. Fungal Genet. Biol. 79, 3–7. doi: 10.1016/j.fgb.2015.04.004
Fraaije B. A. (2014). Use of loop-mediated isothermal amplification assays to detect azole-insensitive CYP51-overexpressing strains of zymoseptoria tritici. Phytopathology 104 (11), 41–42.
Fraaije B. A., Lucas J. A., Clark W. S., Burnett F. J. (2003). “QoI resistance development in populations of cereal pathogens in the UK,” in Proceedings BCPC international congress - crop science and technology, vol. 10-12. (Glasgow), 689–694.
Frith M. C., Wan R., Horton P. (2010). Incorporating sequence quality data into alignment improves DNA read mapping. Nucleic Acids Res. 38 (7), e100-e100. doi: 10.1093/nar/gkq010
Griffin M. J., Fisher N. (1985). Laboratory studies of benzimidazole resistance in septoria tritici. EPPO. Bull. 15, 7. doi: 10.1111/j.1365-2338.1985.tb00262.x
Hellin P., Duvivier M., Clinckemaillie A., Bataille C., Legrève A., Heick T. M., et al. (2020). Multiplex qPCR assay for simultaneous quantification of CYP51-S524T and SdhC-H152R substitutions in European populations of zymoseptoria tritici. Plant Pathol 69(9), pp. 1666–1677. doi: 10.1111/ppa.13252
Jørgensen L. N., Hovmøller M. S., Hansen J. G., Lassen P., Clark B., Bayles R., et al. (2014). IPM strategies and their dilemmas including an introduction to www.eurowheat.org. J. Integr. Agric. 13 (2), 265–281. doi: 10.1016/S2095-3119(13)60646-2
Jørgensen L. N., van den Bosch F., Oliver R. P., Heick T. M., Paveley N. D. (2017). Targeting fungicide inputs according to need. Annu. Rev. Phytopathol. 55 (1), 181–203. doi: 10.1146/annurev-phyto-080516-035357
Kildea S. (2009). Fungicide resistance in wheat pathogen mycosphaerella graminicola. Ph.D. thesis. Queens University Belfast, Belfast, United Kingdom.
Kildea S., Marten-Heick T., Grant J., Mehenni-Ciz J., Dooley H. (2019). A combination of target-site alterations, overexpression and enhanced efflux activity contribute to reduced azole sensitivity present in the Irish zymoseptoria tritici population. Eur. J. Plant Pathol. 154 (3), 529–540. doi: 10.1007/s10658-019-01676-4
Koren S., Walenz B. P., Berlin K., Miller J. R., Bergman N. H., Phillippy A. M. (2017). Canu: Scalable and accurate long-read assembly via adaptive -mer weighting and repeat separation. Genome Res. 27 (5), 722. doi: 10.1101/gr.215087.116
Kumar S., Stecher G., Li M., Knyaz C., Tamura K. (2018). MEGA X: Molecular evolutionary genetics analysis across computing platforms. Mol. Biol. Evol. 35 (6), 1547–1549. doi: 10.1093/molbev/msy096
Laver T., Harrison J., O’neill P. A., Moore K., Farbos A., Paszkiewicz K., et al. (2015). Assessing the performance of the Oxford nanopore technologies MinION. Biomolecular. Detection. Quantification. 3 (C), 1–8. doi: 10.1016/j.bdq.2015.02.001
Leroux P., Albertini C., Gautier A., Gredt M., Walker A.-S. (2007). Mutations in theCYP51 gene correlated with changes in sensitivity to sterol 14α-demethylation inhibitors in field isolates ofMycosphaerella graminicola. Pest Manage. Sci. 63 (7), 688–698. doi: 10.1002/ps.1390
Leroux P., Walker A.-S. (2011). Multiple mechanisms account for resistance to sterol 14α-demethylation inhibitors in field isolates of mycosphaerella graminicola. Pest Manage. Sci. 67 (1), 44–59. doi: 10.1002/ps.2028
Li H. (2018). Minimap2: Pairwise alignment for nucleotide sequences. Bioinf. (Oxford. England). 34 (18), 3094. doi: 10.1093/bioinformatics/bty191
Li H., Handsaker B., Wysoker A., Fennell T., Ruan J., Homer N., et al. (2009). The sequence alignment map format and SAMtools. Bioinformatics 25 (16), 2078–2079. doi: 10.1093/bioinformatics/btp352
Malmberg M. M., Spangenberg G. C., Daetwyler H. D., Cogan N. O. I. (2019). Assessment of low-coverage nanopore long read sequencing for SNP genotyping in doubled haploid canola (Brassica napus l.). Sci. Rep. 9 (1), 8688–8612. doi: 10.1038/s41598-019-45131-0
McDonald M. C., Renkin M., Spackman M., Orchard B., Croll D., Solomon P. S., et al. (2019). Rapid parallel evolution of azole fungicide resistance in Australian populations of the wheat pathogen zymoseptoria tritici. Appl. Environ. Microbiol. 85 (4). doi: 10.1128/AEM.01908-18
McDonald M. C., Williams A. H., Milgate A., Pattemore J. A., Solomon P. S., Hane J. K. (2015). Next-generation re-sequencing as a tool for rapid bioinformatic screening of presence and absence of genes and accessory chromosomes across isolates of zymoseptoria tritici. Fungal Genet. Biol. 79, 71–75. doi: 10.1016/j.fgb.2015.04.012
Pieczul K., Wąsowska A. (2017). The application of next-generation sequencing (NGS) for monitoring of zymoseptoria tritici QoI resistance. Crop Prot. 92, 143–147. doi: 10.1016/j.cropro.2016.10.026
Radhakrishnan G. V., Cook N. M., Bueno-Sancho V., Lewis C. M., Persoons A., Mitiku A. D., et al. (2019). MARPLE, a point-of-care, strain-level disease diagnostics and surveillance tool for complex fungal pathogens. BMC Biol. 17 (1). doi: 10.1186/s12915-019-0684-y
Robinson J. T., Thorvaldsdóttir H., Wenger A. M., Zehir A., Mesirov J. P. (2017). Variant review with the integrative genomics viewer. Cancer Res. 77 (21), e31. doi: 10.1158/0008-5472.CAN-17-0337
Robinson J. T., Thorvaldsdóttir H., Winckler W., Guttman M., Lander E. S., Getz G., et al. (2011). Integrative genomics viewer. Nat. Biotechnol. 29 (1), 24–26. doi: 10.1038/nbt.1754
Rothfels C. J., Pryer K. M., Li F. W. (2017). Next-generation polyploid phylogenetics: Rapid resolution of hybrid polyploid complexes using PacBio single-molecule sequencing. New Phytol. 213 (1), 413–429. doi: 10.1111/nph.14111
Samils B., Andersson B., Edin E., Elfstrand M., Rönneburg T., Bucur D., et al. (2021). Development of a PacBio long-read sequencing assay for high throughput detection of fungicide resistance in zymoseptoria tritici. Front. Microbiol. 12, 692845. doi: 10.3389/fmicb.2021.692845
Stammler G., Carstensen M., Koch A., Semar M., Strobel D., Schlehuber S. (2008). Frequency of different CYP51-haplotypes of mycosphaerella graminicola and their impact on epoxiconazole-sensitivity and -field efficacy. Crop Prot. 27 (11), 1448–1456. doi: 10.1016/j.cropro.2008.07.007
Taher K., Graf S., Fakhfakh M. M., Salah H. B. H., Yahyaoui A., Rezgui S., et al. (2014). Sensitivity of zymoseptoria tritici isolates from Tunisia to pyraclostrobin, fluxapyroxad, epoxiconazole, metconazole, prochloraz and tebuconazole. J. Phytopathol. 162 (7-8), 442–448. doi: 10.1111/jph.12210
Thorvaldsdóttir H., Robinson J. T., Mesirov J. P. (2013). Integrative genomics viewer (IGV): High-performance genomics data visualization and exploration. Briefings Bioinf. 14 (2), 178–192. doi: 10.1093/bib/bbs017
Tytgat O., Gansemans Y., Weymaere J., Rubben K., Deforce D., Van Nieuwerburgh F. (2020). Nanopore sequencing of a forensic STR multiplex reveals loci suitable for single-contributor STR profiling. Genes 11 (4), 381. doi: 10.3390/genes11040381
Vagndorf N., Heick T. M., Justesen A. F., Andersen J. R., Jahoor A., Jørgensen L. N., et al. (2018). Population structure and frequency differences of CYP51 mutations in zymoseptoria tritici populations in the Nordic and Baltic regions. Eur. J. Plant Pathol. 152 (2), 327–341. doi: 10.1007/s10658-018-1478-8
van den Berg F., van den Bosch F., Paveley N. D. (2013). Optimal fungicide application timings for disease control are also an effective anti-resistance strategy: A case study for zymoseptoria tritici (Mycosphaerella graminicola) on wheat. Phytopathology 103 (12), 1209–1219. doi: 10.1094/PHYTO-03-13-0061-R
Wick R. R., Judd L. M., Holt K. E. (2019). Performance of neural network basecalling tools for Oxford nanopore sequencing. Genome Biol. 20 (1), 1–10. doi: 10.1186/s13059-019-1727-y
Wieczorek T., Berg G., Semaškienė R., Mehl A., Sierotzki H., Stammler G., et al. (2015). Impact of DMI and SDHI fungicides on disease control and CYP51 mutations in populations of zymoseptoria tritici from northern Europe. Eur. J. Plant Pathol. 143 (4), 861–871. doi: 10.1007/s10658-015-0737-1
Keywords: Mycosphaerella graminicola, fungicide resistance, azoles, CYP51, Septoria, populations, disease control
Citation: Gutierrez Vazquez Y, Adams IP, McGreig S, Walshaw J, van den Berg F, Sanderson R, Pufal H, Conyers C, Langton D, Broadhead R, Harrison C and Boonham N (2022) Profiling azole resistant haplotypes within Zymoseptoria tritici populations using nanopore sequencing. Front. Agron. 4:943440. doi: 10.3389/fagro.2022.943440
Received: 13 May 2022; Accepted: 05 October 2022;
Published: 27 October 2022.
Edited by:
Francesco Spinelli, University of Bologna, ItalyReviewed by:
Sadegh Balotf, University of Southern Queensland, AustraliaCopyright © 2022 Gutierrez Vazquez, Adams, McGreig, Walshaw, van den Berg, Sanderson, Pufal, Conyers, Langton, Broadhead, Harrison and Boonham. This is an open-access article distributed under the terms of the Creative Commons Attribution License (CC BY). The use, distribution or reproduction in other forums is permitted, provided the original author(s) and the copyright owner(s) are credited and that the original publication in this journal is cited, in accordance with accepted academic practice. No use, distribution or reproduction is permitted which does not comply with these terms.
*Correspondence: Yaiza Gutierrez Vazquez, eWFpemEuZ3V0aWVycmV6QHZlaW92aWEuY29t
Disclaimer: All claims expressed in this article are solely those of the authors and do not necessarily represent those of their affiliated organizations, or those of the publisher, the editors and the reviewers. Any product that may be evaluated in this article or claim that may be made by its manufacturer is not guaranteed or endorsed by the publisher.
Research integrity at Frontiers
Learn more about the work of our research integrity team to safeguard the quality of each article we publish.