 Clarence B. Codod1
 Paul M. Severns2Alton N. Sparks3
 Rajagopalbabu Srinivasan4Robert C. Kemerait Jr.1
 Bhabesh Dutta1*
- 1College of Agriculture and Environmental Sciences, Department of Plant Pathology, The University of Georgia, Tifton, GA, United States
- 2College of Agriculture and Environmental Sciences, Department of Plant Pathology, The University of Georgia, Athens, GA, United States
- 3College of Agriculture and Environmental Sciences, Department of Entomology, The University of Georgia, Tifton, GA, United States
- 4College of Agriculture and Environmental Sciences, Department of Entomology, The University of Georgia, Griffin, GA, United States
A two-year study was conducted in 2019 and 2020 to characterize the spatial distribution of whitefly-transmitted virus complex (WTVC) in experimental and commercial yellow squash (Cucurbita pepo) fields in southern Georgia, USA. Field trials planted in Tifton, Georgia, USA were comprised of 30 rows of squash (variety: Gentry) divided into 300 quadrats. Six commercial fields in Tift, Worth, and Colquitt Counties in Georgia, USA were surveyed. In each field, 10 rows of plants per field were partitioned into 70 quadrats so that their approximate location could be mapped and disease incidence tracked in space over time. Plants in each quadrat were visually assessed for TVC symptoms at seven-day intervals (experimental fields) or at fourteen-day intervals (commercial fields). The spatial distribution of WTVC in a one-dimensional space was determined through ordinary runs analysis and in two-dimensional space through spatial autocorrelation analysis and spatial analysis by distance indices (SADIE). Ordinary runs analysis down and between rows suggested that disease was more likely to be transmitted from infected plants within rows than across rows. WTVC incidence in space was positively correlated with adult whiteflies on squash leaves taken one or two weeks prior to the assessment of virus incidence coinciding with latent period of Geminiviruses. SADIE generated disease severity maps indicated a shift from sparse and randomly distributed disease early in the infection cycle to denser, more aggregated patterns later in time in both experimental and commercial fields. Contour plots of interpolated indices from SADIE analysis suggested an edge effect on the spatial distribution of WTVC in experimental fields as well as in two of the commercial fields. An understanding of the shift from random to aggregated distribution and the edge effect on WTVC incidence are considerations for refining current management strategies.
Introduction
Characterization of the spatial and temporal patterns of plant disease development is needed to fully understand the disease dynamics, develop more accurate sampling plans, better assess crop loss in relation to disease intensity, and design and analyze experiments more efficiently (Turechek and Madden, 1999; Xu and Madden, 2004). Information on the spatial and temporal patterns of pests could also be used in the prediction of risk for a given crop at a given time (Reich et al., 2013). Risk predictions allow growers to plan and implement appropriate management strategies to reduce their risk of pests and diseases and thereby reducing the impact of disease to yield.
Whitefly-transmitted viruses have emerged as a global threat to the production of a wide range of crops over the last 20 years (Navas-Castillo et al., 2011). Of the crops affected, whiteflies and whitefly-transmitted viruses are primary concerns in dicotyledonous plants, many of which are economically important. Some of the greatest losses occur in vegetable crops such as cucurbits, tomato, pepper, beans (Polston et al., 1999; Guzman et al., 2000; Adkins et al., 2009). Yield losses due to whiteflies and whitefly-transmitted viruses range from minimal to complete crop failure depending on what virus occur in the field, what crop, age of crops at the time of infection, and the incidence and severity of virus infection (Lapidot et al., 2014).
Among the whiteflies, the sweetpotato whitefly (Bemisia tabaci) is considered one of the most damaging pests of the open field and protected cropping systems throughout major crop growing regions of the world (De Barro et al., 2011). There are three main ways that sweetpotato whiteflies can cause damage. The first is caused by the direct feeding of both immature and adult stages on plants. Nymphs and adult whiteflies feed by inserting their proboscises into the leaf, penetrating the phloem and withdrawing sap (Jones, 2003). Heavy infestations of nymphs and adults could cause seedling death, stunting, or reduction in yield of older plants (Gangwar and Charu, 2018). During feeding, adult and nymphs can inject salivary fluids which causes physiological disorders, such as silvering of foliage in squash and irregular ripening of tomato fruits (Maynard and Cantliffe, 1990; McCollum et al., 2004). The second way that whiteflies causes damage is the excretion of honeydew onto the surfaces of leaves and fruit. The honeydew acts as a substrate for the growth of sooty mold fungi which interferes with photosynthesis and reduces the quality of fruit and fiber (Byrne and Bellows, 1991). The third is indirect damage by acting as vectors of economically important genera of plant viruses, including Begomovirus (Geminiviridae), Ipomovirus (Potyviridae), Crinivirus (Closteroviridae), Carlavirus (Betaflexiviridae), Torradovirus (Secoviridae), and Polerovirus (Luteoviridae) (Navas-Castillo et al., 2011; Fiallo-Olivé et al., 2020). Begomovirues and criniviruses are genera of whitefly-transmitted viruses recognized as important emerging plant virus groups worldwide (Jones, 2003; Liu et al., 2013; Tzanetakis et al., 2013).
In the southeastern US, the whitefly-transmitted cucurbit leaf crumple virus (CuLCrV) and cucurbit yellow stunting disorder virus (CYSDV) have impacted squash production during the fall growing season (Nyoike et al., 2008; Kavalappara et al., 2021). In 2017, an estimated 35% reduction in squash crop value amounting to $38 million occurred due to simultaneously dry conditions and an abundance of whitefly-transmitted viruses during the fall growing season (Little et al., 2019). The CuLCrV, CYSDV, and the recently reported cucurbit chlorotic yellows virus (CCYV) more often occur as mixed infection complex, as opposed to single infection (Kavalappara et al., 2021). Compared with symptoms caused by either CuLCrV or CYSDV in a single infection, more severe symptoms, characterized by a combination of stunting, leaf crumpling, and interveinal chlorosis, were observed among plants that were mixed infected with both CuLCrV and CYSDV in squash (Gautam et al., 2020). The mixed infection of two or more viruses transmitted by whiteflies in squash was collectively referred to as whitefly-transmitted virus complex (WTVC) in this paper.
Management of whiteflies and whitefly-transmitted viruses is challenging. The broad range of acceptable host plants (plants belonging to Cucurbitaceae, Euphorbiaceae, Fabaceae, Solanaceae, Malvaceae, Graminae, and Musaceae), high reproductive rate, short generation time, and insecticide resistance allow whiteflies to colonize and quickly dominate an invaded agroecosystem (Hidayat et al., 2018; Soumia et al., 2021). The current management strategy for whiteflies and their associated viruses in agricultural systems employs the timely use of numerous management tactics, usually with heavy reliance on insecticides, complemented by resistant plant cultivars if available (Lapidot et al., 2014). While resistance to whitefly-transmitted viruses has been developed for tomatoes (Vidavski et al., 2008) and cassava (Jennings, 1994), there are no available squash varieties with whitefly-transmitted virus resistance. Thus, optimizing the use of available pest management tactics is critical in reducing the impact of whitefly-transmitted viruses. An important first step in developing a refined disease management strategy is to identify the spatial and temporal patterns of whitefly and disease occurrence in squash fields. If there are consistent spatio-temporal patterns of whitefly and disease occurrence and spread, this information can be used to develop tactics to reduce the numbers of vectors, slow the rate of disease progression, and suppress increases in disease severity over time. We conducted a study to characterize and track the changes in the spatial and temporal distribution of whitefly abundance and WTVC in experimental as well as commercial squash fields in southern Georgia to gain a better understanding of the patterns of spread of whitefly-transmitted viruses in squash fields over time. Characterization of the spatiotemporal distribution could help to determine appropriate tactics that could be implemented to slow or suppress WTVC spread.
Materials and methods
Experimental fields
There were two types of fields in our study, one designed specifically for experimentation (this subsection) and actual squash production fields. Experimental field trials were established at the University of Georgia’s Black Shank Farm in Tifton, Georgia, USA during the 2019 and 2020 fall growing seasons. Field trials occurred in the same location in both years and consisted of 15 raised beds (0.11 ha for each experimental field). Two rows of squash (cv. Gentry) were planted (3-Sept-2019 and 3-Sept-2020) on bare soil in each bed. Each row was partitioned into ten 3.05m long quadrats resulting in a total of 300 quadrats (Figure 1), with each quadrat having an average of 9 squash plants. To create an alley between each quadrat, plants in 0.91m sections were cleared after each 3.05m long quadrat. Each quadrat in the field was assigned an X and Y coordinate value in a Cartesian X-Y plane based on the specific location of the quadrat in the field, enabling us to track changes in whitefly abundance and disease levels over time. The corresponding distance (meters) of each quadrat to the edge of the field was used on the y-axis. The x-axis contains the distance (m) of each row of plants from the left side of the sampling plot. Fertilization and management of fungal disease as well as pest insects other than whiteflies were implemented following recommendations from vegetable extension specialists for southeastern US (Arancibia et al., 2018). No insecticides known to be antagonistic to whiteflies were applied.
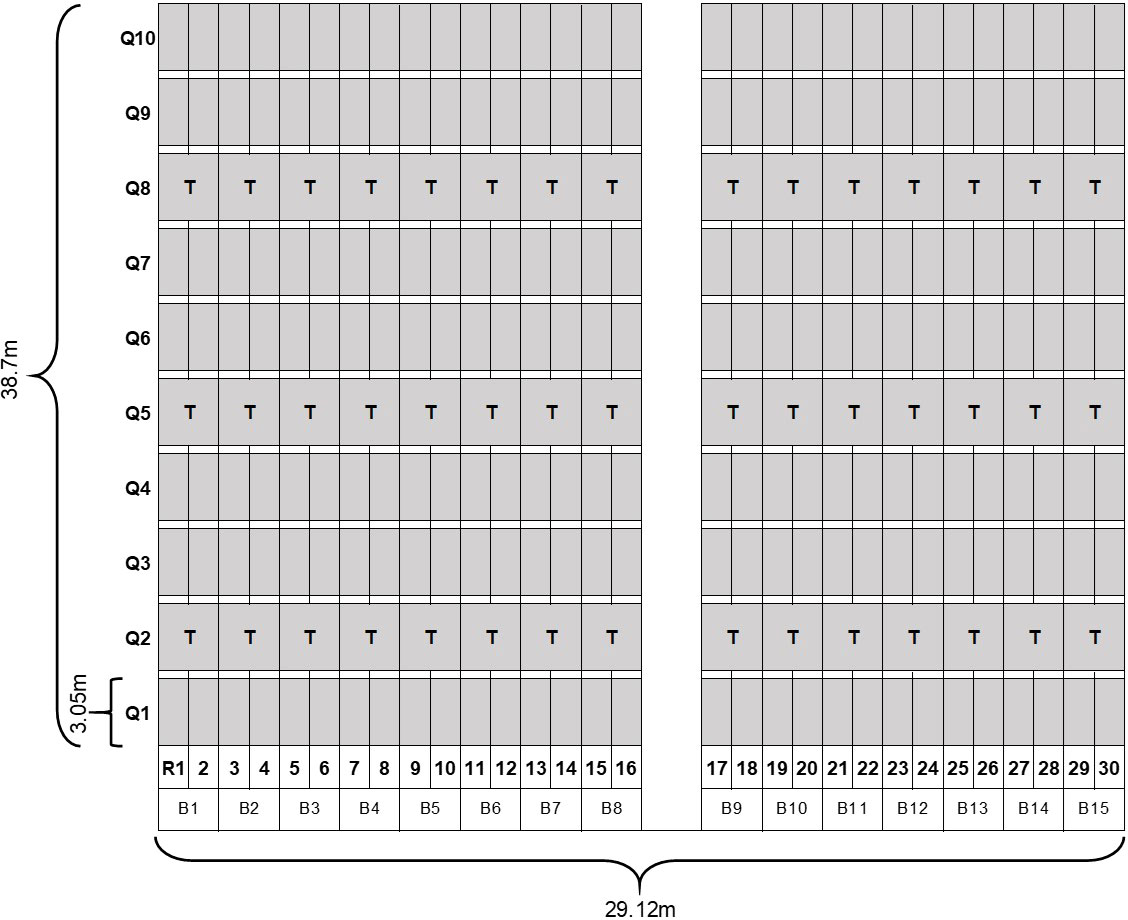
Figure 1 Experimental design in field trials conducted in UGA Black Shank Farm. Each gray cell represents a 0.91m x 3.05m quadrat; WTVC incidences were taken per quadrat. Q, quadrats; R, rows; T, indicates where traps were placed.
Plants within each quadrat were visually assessed for WTVC symptoms every seven days beginning at eight days after planting (DAP) in 2019 and at 11 DAP in 2020. Individual plants were scored as “1” if it was showing symptoms of WTVC and “0” if it was not showing WTVC symptoms. WTVC infected plants show crumpling of leaves, stunting, chlorosis, and green streaking on fruits. Yellow sticky cards were used as traps, 7.62cm wide and 12.7cm long, (BASF Corporation, Research Triangle Park, NC) and installed between two rows of squash in the 2nd, 5th, and 8th quadrat to represent dispersing whiteflies. A total of 45 traps were installed within the experimental field and each trap was fastened to a 30cm metal wire to raise the traps at approximately 20cm from the ground. The traps were installed immediately after planting and replaced at a seven-day interval and the number of whiteflies were counted on each sticky card. To account for the abundance of whiteflies on plants, we used the leaf-flip method (Turechek et al., 2014) on three arbitrarily selected leaves per two adjacent quadrats. Leaf-flip counts of whiteflies were taken from a total of 450 leaves at each seven-day interval. The number of whiteflies counted through the leaf-flip method is hereafter referred to as leaf-flip counts. During instances when a leaf had more than 100 adult whiteflies, the number of whiteflies was counted in half of the leaf and then multiplied by two to get an estimated number for the whole leaf. Rating for WTVC and whitefly counts were performed until the plants collapsed from whitefly feeding and WTVC infection. In 2019, four WTVC ratings and leaf-flip counts were taken starting at 8days after planting (DAP) to 29 DAP. Four WTVC ratings, leaf-flip counts, and trap counts were taken in 2020 starting 11 to 32 DAP.
Commercial fields
Six commercial squash fields located in Tift, Worth, and Colquitt counties in Georgia, USA were surveyed (Table 1). In each field, 10 rows of plants per field were partitioned into 1.83m x 9.14m quadrats resulting in a total of 70 quadrats with an average of 26 plants per quadrat (Figure 2). Orange marking flags with 0.76m long wire stakes (Gempler’s, Janesville, WI) were used to mark the partition of rows into quadrats. Between each row of plants, four rows of plants were skipped, generating 7.3m of space between each row of plants that were included in the study for a total study area of 0.54 ha per field. Similar to the experimental field, each quadrat in the field was assigned X and Y coordinate values based on the specific location of the quadrat in the field. Plants in each quadrat were visually assessed for WTVC symptoms at a 14-day interval. Within each row of squash, whitefly traps were installed in the 2nd, 4th, and 6th quadrats. A total of 30 traps per field were installed during the first rating date and replaced at a 14-day interval. Damaged traps were discarded. The abundance of whiteflies on plants was assessed using the leaf-flip method on four arbitrarily selected plants (one leaf/plant) in the vicinity (within a meter) of each sticky trap. Leaf-flip counts of whiteflies were taken from a total of 120 leaves at each 14-day interval. Rating for WTVC and trapping of whiteflies were performed until the crop was terminated by the growers. Two to four ratings were taken in commercial squash fields depending on the age of the crop during the first visit and when the crop was terminated.
Table 1 Production practices in experimental and commercial yellow squash fields in Georgia, USA included in this study.
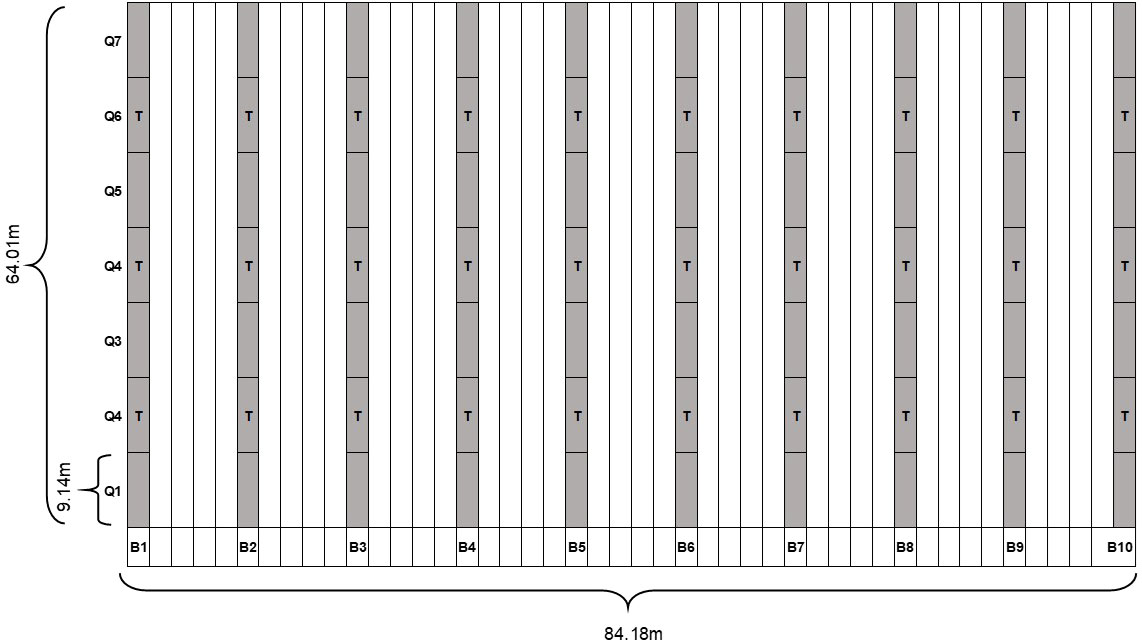
Figure 2 Study design for survey of commercial squash fields. Each gray cell represents a 1.83m x 9.14m quadrat. White columns represent 4 rows between each sampling row (gray columns); WTVC incidence was taken per quadrat. Q= quadrats; B = beds; T= indicates where traps were placed.
Preliminary data processing
The percent incidence of WTVC was calculated per quadrat for both the experimental and commercial squash fields. The proportion of WTVC symptomatic plants over the total number of plants was multiplied by 100 to get the percent incidence. The mean number of plants per quadrat was 9 and 26 plants for the experimental and commercial fields, respectively. The higher number of plants per quadrat in the commercial fields was due to larger size of quadrats to account for the larger area under study.
The number of adult whiteflies caught on traps was counted under the stereomicroscope or with the aid of a magnifying glass. The traps used in this study had vertical and horizontal gridlines forming 2cm2 cells in the trap. Adult whiteflies were counted in four cells on each side of the trap. The mean number of whiteflies per 2cm2 cell was calculated per trap and used for subsequent analyses.
Detection of CuLCrV and CYSDV mixed infection
Samples from plants showing virus infection symptoms were collected to confirm CuLCrV and CYSDV infection through genotyping. DNA and RNA were extracted, and PCR and RT-PCR were conducted using virus-specific primer sets (CuLCrV: 3FAC3 = 5′-TTTATATCATGATTTTCGAGTACA-3′ & 5RAC1 = 5′-AAAATGAAAGCCTAAGAGAGTGGA-3′ and CYSDV: CYSCPf = 5′-ATGGCGAGTTCGAGTGAGAATAA-3′ & CYSCPr= 5′-ATTACCACAGCCACCTGGTGCTA-3′) and established protocols (see Gautam et al., 2020 for a detailed description). A total of 149 samples showing WTVC symptoms from experimental (49 samples) and commercial squash fields (100 samples) were tested through PCR for presence or absence of CuLCrV. Among the samples that tested positive for CuLCrV, 56 samples were tested for mixed infection with CYSDV. Of the 56 samples tested for CYSDV, 20 samples were collected from experimental fields and 36 were from commercial fields.
Analysis
Temporal relationships between whitefly abundance and WTVC disease incidence
To understand the relationship between whitefly abundance and the incidence of WTVC, we performed a series of correlation analyses between combinations of concurrent and delayed time periods featuring within experimental field mapped quadrat whitefly counts (from leaf flips and traps) and WTVC incidence in 2019 and 2020. Two separate correlation analyses were performed for whitefly counts from traps and WTVC incidence, and for leaf-flip counts and WTVC incidence. Correlation analysis for whitefly trap counts and disease incidence was conducted using WTVC incidences in the 2nd, 5th, and 8th quadrats where traps were placed. Whiteflies trap counts represent abundance of adult whiteflies that are dispersing while leaf-flip counts represent adult whiteflies that are actively feeding and potentially inoculating WTVC on squash plants. Because the count and incidence data were non-normally distributed, we used a Spearman’s rank correlation for comparing these datasets within and between the different time periods. Correlation analysis was performed using the ‘rcorr’ function in the ‘Hmisc’ package (v4.6.0; Harrell and Harrell, 2019), in the R software (R Core Team, 2020).
WTVC disease progression within and across rows
The spatial distribution of disease can be characterized on a one-dimensional scale (such as within rows of plants) or a two-dimensional scale. For characterization of the one-dimensional spatial pattern of a population, ordinary runs analysis was used. Ordinary runs analysis provides information on the pattern of disease spread within rows of plants in a field (Madden et al., 1982). When infected plants are ordered in a cluster, there is a lower number of runs. A pathogen spreading from plant to plant would be expected to show an aggregation (clustering) of infected plants in parts of the field where initial infections occurred (Madden et al., 1982).
To determine whether WTVC disease tends progress from an infection location down rows more frequently than across rows (which the plants are separated by bare ground alleys), we used ordinary runs analysis to index the degree of aggregation along each one-dimensional arrangement (down rows versus across rows) of squash plants in the experimental fields. The analysis was conducted per field at each rating date. Two separate analyses were performed, one for indexing the degree of aggregation of WTVC infected plants within rows, and one for comparing the frequency of aggregation of WTVC infection within vs across rows. For within row assessment, the sampling unit was individual plants. WTVC-infected plants were assigned a value of “1” and non-WTVC-infected plants were assigned a “0”. The sampling unit for the second part was the quadrat. Quadrats with at least one infected plant were considered infected and assigned a value of “1”. If none of the plants within a quadrat was infected with WTVC, it was assigned a value of “0”. The sample size was reduced by performing the analysis using quadrats as sampling units, but this method allowed the comparison of the spatial distribution of WTVC-infected plants within and between rows in the experimental field. When the analysis was performed between rows, the experimental field was treated as two plots as there was an alley dividing the field. The first plot had 16 rows and the other had 14 rows. Hence, when ordinary runs analysis was performed between rows, there were 10 transects with 16 quadrats each in the first plot and 10 transects with 14 quadrats each in the other plot. When analyzed within rows, there were 30 rows with 10 quadrats each. Based on the arrangement of infected and non-infected sampling units along each one-dimensional arrangement, the number of runs was calculated. In ordinary runs analysis, a run is a succession of one or more plants with the same infection status (Madden et al., 1982; Turechek et al., 2014). The total number of runs was compared to the expected number of runs that would be expected to occur by random chance for a given level of WTVC incidence. To test the null hypothesis of a random distribution of WTVC-infected plants, the Z-statistic was calculated. The Z-statistic will have a large negative value (< -1.64, P=0.05) if there is an aggregation of WTVC-infected plants (Madden et al., 1982).
Field-level patterns of whitefly and WTVC disease aggregation
The degree of disease aggregation in space and over time can provide valuable information about the patterns of disease spread. For example, an aggregated pattern of insect-transmitted disease may arise when an infective insect, with a short feeding-inoculation period, feeds and then moves to neighboring plants. Alternatively, the secondary spread of vectors from an initially infected plant into nearby healthy plants will also result in an aggregated distribution of infected plants. Conversely, a random pattern of infected plants suggests that the pathogen is not spreading from plant to plant within the field (Madden et al., 1982). We used spatial autocorrelation to index the degree of aggregation of whiteflies (traps and leaf flips) and WTVC-infected plants at multiple time points of the squash growing season.
The degree of spatial autocorrelation was indexed with Moran’s I, a global estimate of aggregation, in the SAS software variogram procedure (proc variogram) (SAS Institute Inc, Cary, NC). Moran’s I has a value ranging from -1 to +1. A value of -1 indicates a perfect negative autocorrelation, meaning all diseased plants are completely repelled from each other. Moran’s I equal to 0 indicates perfect randomness (e.g. no spatial autocorrelation), and Moran’s I equal to +1 indexes perfect positive autocorrelation (all disease is completely clustered, without absences in space). The null hypothesis will be that the infected plants are randomly distributed in the study area (Madden et al., 2007). The alternative hypothesis is that the infected plants are more spatially clustered than would be expected by chance alone. The null hypothesis will be rejected at a 95% level of significance (p<0.05).
Spatially-explicit patterns of WTVC changes over time
To determine whether there were general patterns in WTVC disease outbreaks and subsequent spread in squash fields over time, we used SADIE (Spatial Analysis by Distance IndicEs). The spatial analysis by distance indices is a local method used to detect locations within the squash fields that may drive the overall pattern of spatio-temporal disease progression. SADIE is a method of quantifying spatial patterns of organisms (Perry, 1998; Li et al., 2012) whereby the analysis estimates how much redistribution of data is required for the original aggregated data set to attain a non-aggregated state. The degree of non-randomness is quantified by comparing the distance to regularity for the observed data set with distance to regularity for rearrangements of the observed data (Li et al., 2012). The ratio between the distance moved to achieve the regular pattern for the observed data and the arithmetic mean distance to regularity for randomized samples is called the index of aggregation (Ia). Ia values equal to 1 indicate randomly arranged counts, Ia greater than 1 indicates aggregation of counts or incidence and Ia less than 1 indicates regularity (Winder et al., 2019). Comparison of the observed minimum distance to regularity with the tails of the distribution of corresponding values from randomization simulations provides a test of the null hypothesis that the observed counts are arranged randomly, with a probability level, Pa. SADIE was implemented in R using the ‘sadie’ function in the ‘epiphy’ package (v0.3.4; Gigot, 2018). The interpolated indices, predicted values of Perry’s index within a 2-dimensional grid calculated through local regression method (Loess), were plotted to create contour plots through the ‘levelplot’ function in the ‘lattice’ package in R (v0.10-10, Sarkar, 2007). The contour plots show areas within the squash field where WTVC infected plants occurred as more abundant and densely populated disease patches (red to white areas) or gaps with more sparsely populated regions and lower disease abundance (green areas). Patches were defined as neighborhoods of consistently high counts while gaps are areas where low counts were observed (Winder et al., 2019). The range of WTVC incidence associated with the interpolated indices were calculated and imbedded in the contour plots. This was done by taking the minimum and maximum WTVC incidence within each level of interpolated index ±0.25.
Results
Occurrence of a mixed infection of CuLCrV and CYSDV among symptomatic plants
The symptoms of WTVC infection observed on squash plants were crumpling of leaves, stunting, chlorosis, and green streaking on fruits. Among samples of WTVC symptomatic plants, 96% from experimental fields and 91% from commercial fields tested positive to CuLCrV. The mixed infections of CuLCrV and CYSDV was detected on 40% and 56% of samples collected in the experimental and commercial squash fields, respectively.
Temporal relationships between abundance of dispersing whiteflies and WTVC disease incidence
In the 2019 experimental field, a positive correlation was detected between the number of adult whiteflies caught on traps at 8 DAP and the WTVC incidence taken at 22 DAP (r= .28, p= .025) and at 29 DAP (r= .41, p<.001) (Table 2; Figure 3). The number of adult whiteflies caught on traps at 22 DAP had a negative correlation with the WTVC incidence taken at 29 DAP (r= -.22, p= .041). While correlation between WTVC incidence and whitefly counts taken at the same or after the WTVC assessment times have been detected, they were generally a weaker correlation and had no biological implication on WTVC incidence; hence were not presented.
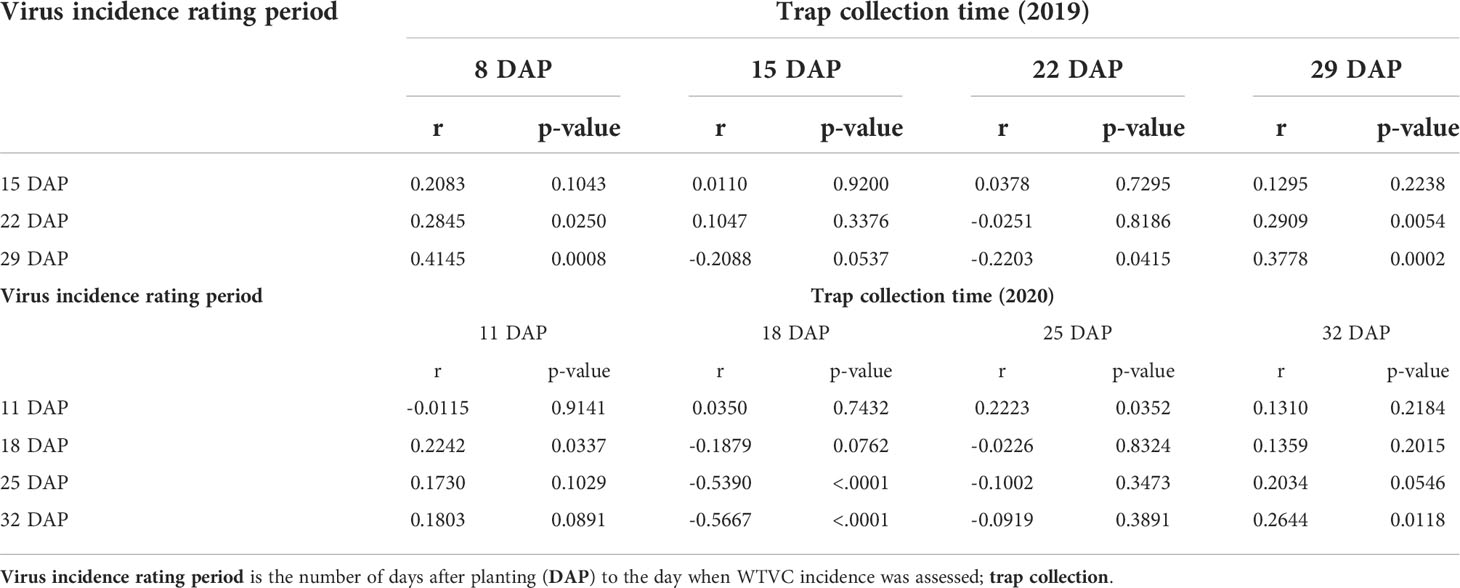
Table 2 Correlation matrix of whitefly counts from traps and WTVC incidence in experimental field trials conducted at the University of Georgia Black Shank Farm, Tifton, Georgia, USA in 2019 and 2020.
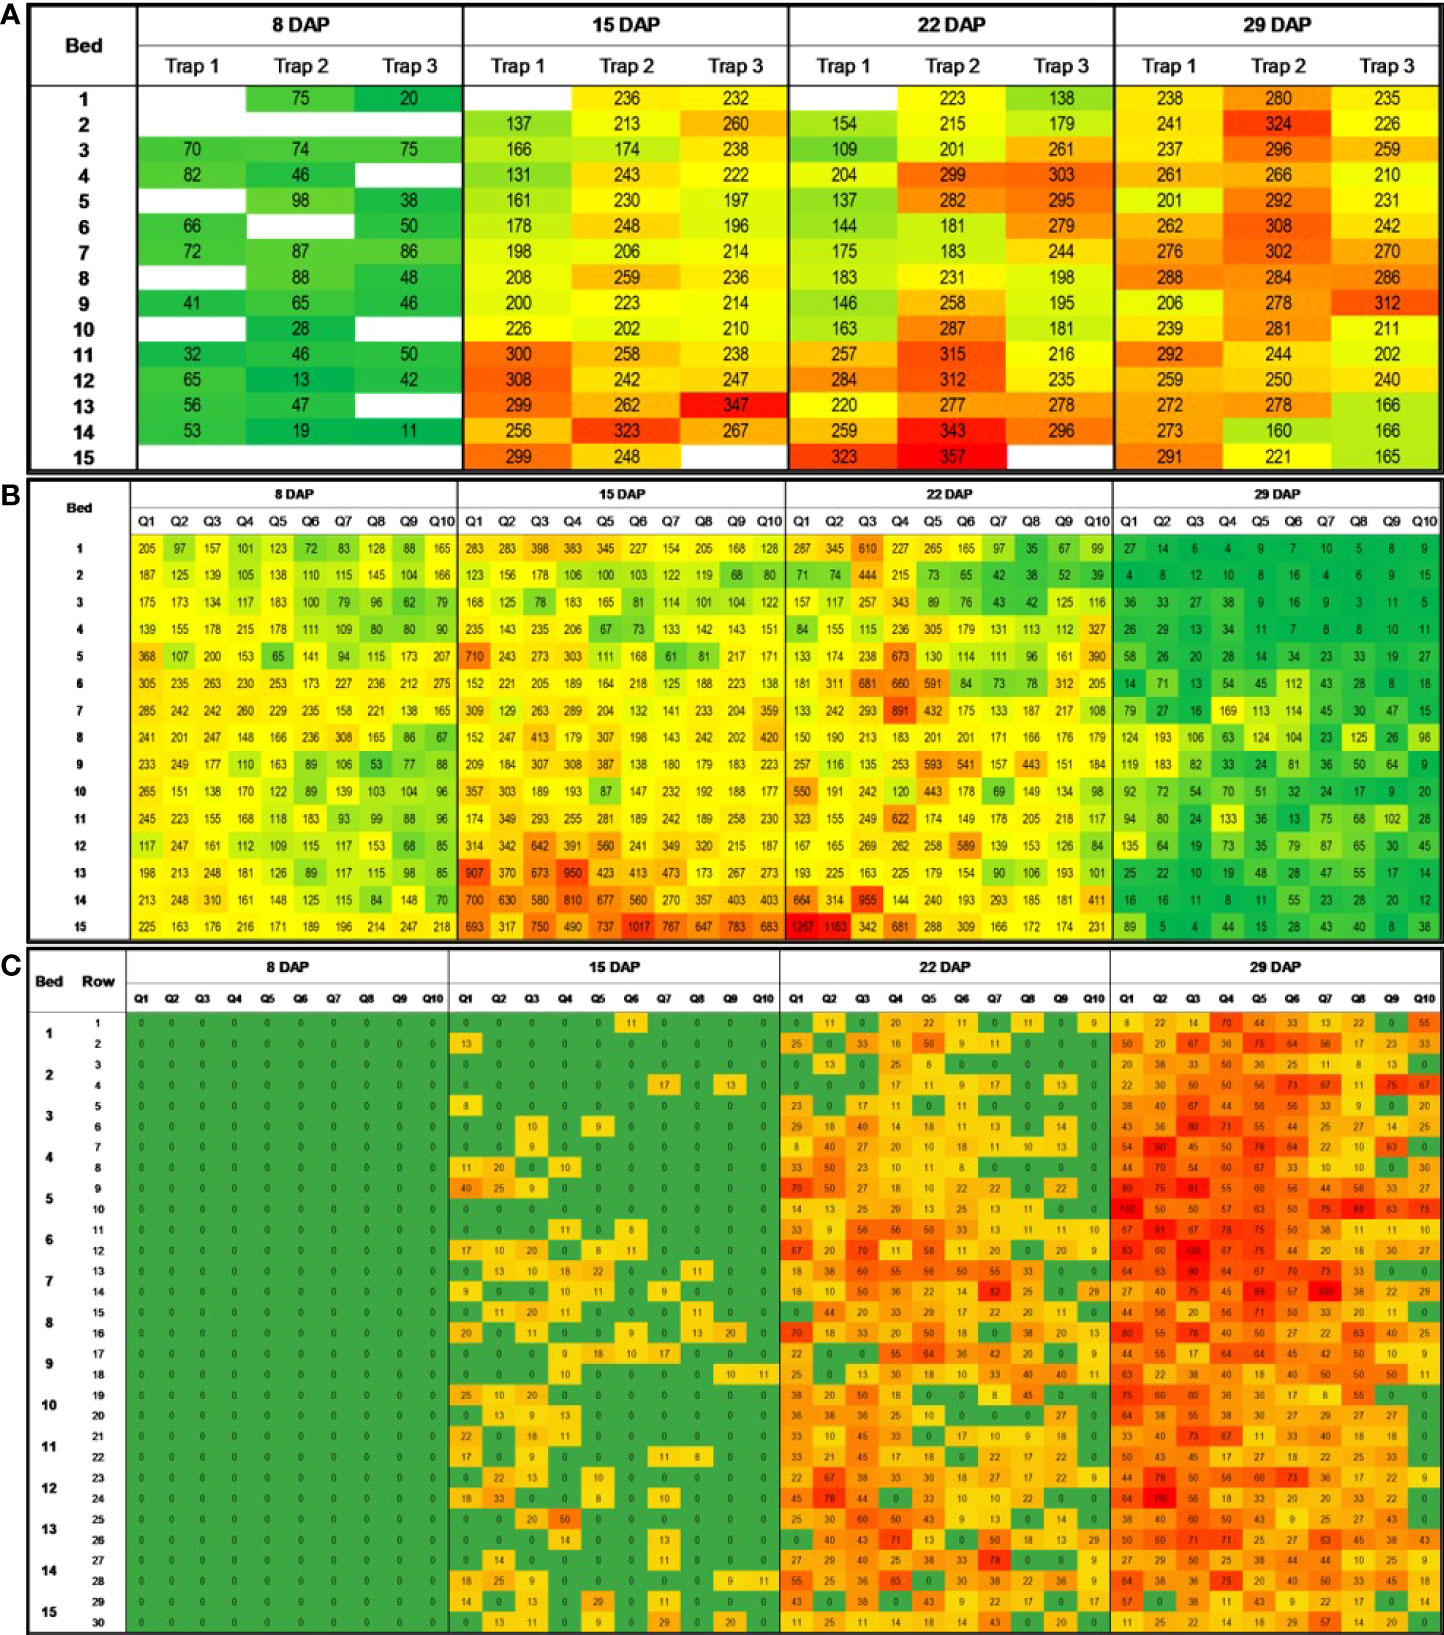
Figure 3 Heatmaps showing number of adult whitefliesa per 2cm² sticky trap (A), number of adult whiteflies in leaves (B), and WTVC incidenceb (C) over time and space in the experimental field at the UGA Black Shank Farm in 2019. a Average number of adult whiteflies in eight 2cm2 areas of a sticky trap (four in each side, front and back); b percent incidence of WTVC infected plants per 3.05m long rows of squash. Green areas had lower numbers of whiteflies and lower WTVC incidence. Red areas had higher whitefly counts and WTVC incidence.
In 2020, a positive correlation (r= .22, p= .034) was observed between initial whitefly counts on traps (11 DAP) and WTVC incidence at 18 DAP (Table 2; Figure 4). Similar to what was observed in 2019, there was a negative correlation between the number of adult whiteflies caught on traps at 18 DAP and WTVC incidence at 25 DAP (r= -.54, p<.001) and at 32 DAP (r= -.57, p<.001).
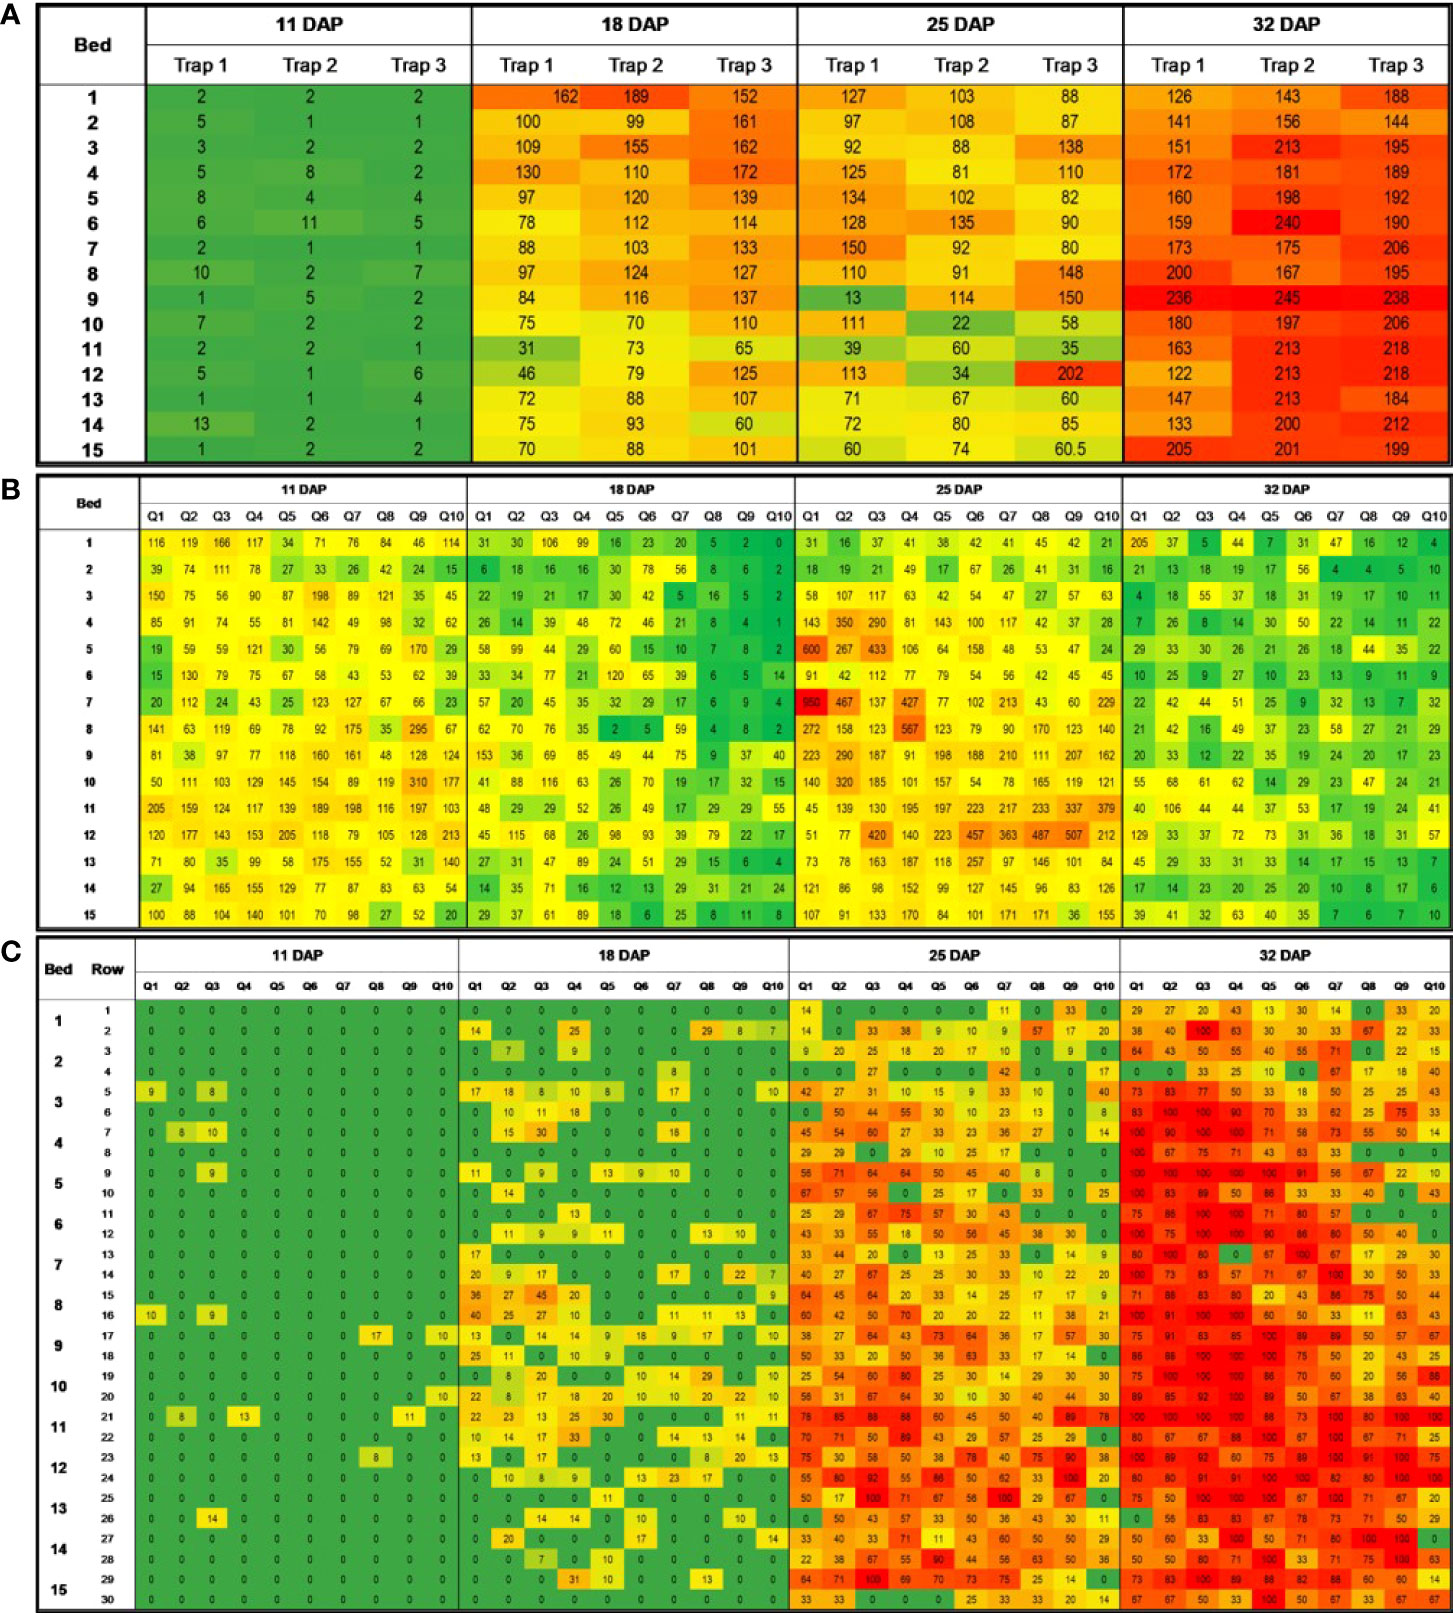
Figure 4 Heatmaps showing number of adult whitefliesa caught on sticky trap (A), number of adult whiteflies in leaves (B), and WTVC incidenceb (C) over time and space in the experimental field at the UGA Black Shank Farm in 2020. a Average number of adult whiteflies in eight 2cm2 areas of a sticky trap (four in each side, front and back); b percent incidence of WTVC infected plants per 3.05m long rows of squash. Green areas had lower numbers of whiteflies and lower WTVC incidence. Red areas had higher whitefly counts and WTVC incidence.
Temporal relationships between abundance of whiteflies feeding on plants and WTVC disease incidence
In 2019, leaf-flip counts of whiteflies taken at 8 DAP had a positive correlation with the WTVC incidence observed at 15 (r= .29, p<.001), 22 (r= .33, p<.001), and 29 DAP (r= .32, p<.001) (Table 3; Figure 3). Similarly, leaf-flip counts of whiteflies observed at 15 (r= .25, p<.001) and at 22 DAP (r= .12, p<.035) positively correlated with the WTVC incidence at 29 DAP.
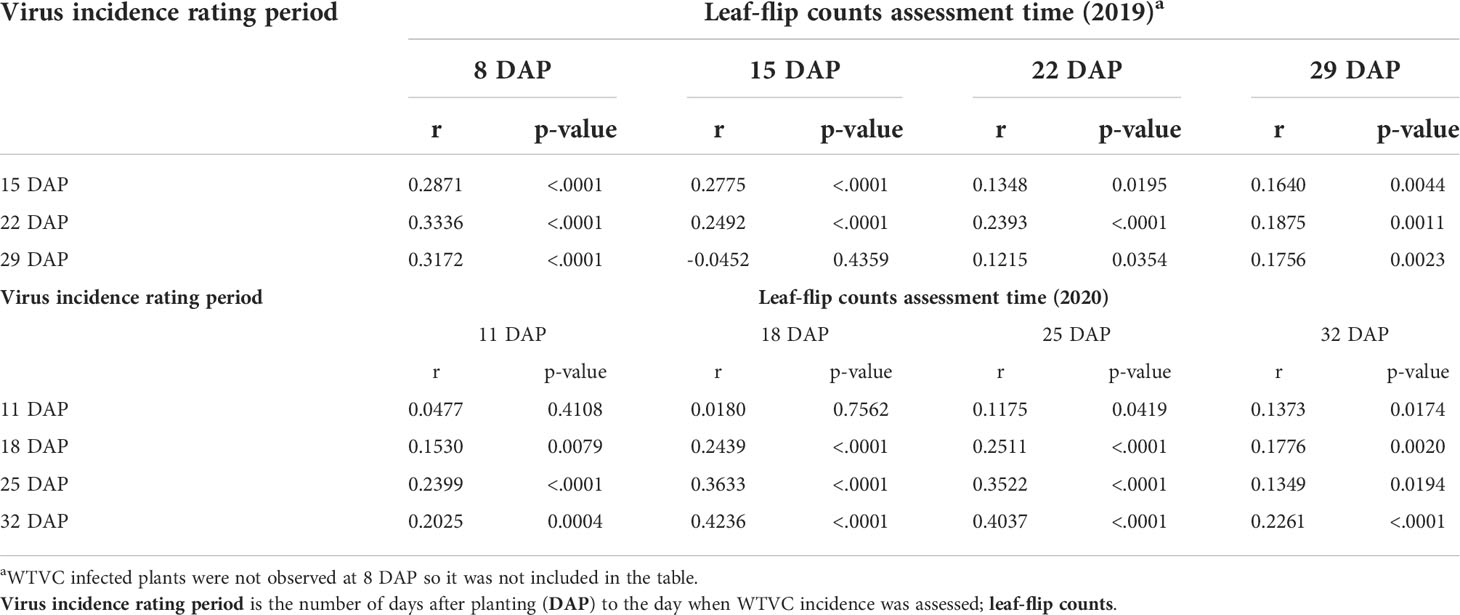
Table 3 Correlation matrix of whitefly counts from leaf-flips and WTVC incidence experimental field trials conducted at the University of Georgia Black Shank Farm, Tifton, Georgia, USA in 2019 and 2020.
The leaf-flip counts taken in the experimental field in 2020 also positively correlated with the observed WTCV incidence (Table 3; Figure 4). Leaf-flip counts of whiteflies taken at 11 DAP had a positive correlation with the WTVC incidence observed at 18 (r= .15, p<.008), 25 (r= .24, p<.001), and 32 DAP (r= .20, p<.001). Leaf-flip counts of whiteflies taken at 18 DAP positively correlated with the WTVC incidence observed at 25 (r= .36, p= .008), and 32 DAP (r= .42, p<.001). Leaf-flip counts of whiteflies taken at 25 DAP had a positive correlation with the WTVC incidence observed at 32 DAP (r= .40, p <.001).
WTVC disease progression within and across rows
When performed based on the infection status of individual plants within a row, a shift from mostly random distribution to an aggregated distribution was observed in the experimental (Figure 5A) and commercial squash fields (Figure 5B). A random distribution (Z≥ -1.64) of infected plants was detected in most rows when the WTVC incidence was between 1 to 20%. As the WTVC incidence increased (21-80%), an aggregated pattern (Z<-1.64) was observed more frequently than a random pattern especially in the commercial fields (Figure 5B). In the experimental field, the number of rows with an aggregated WTVC infected plants were doubled from 8 rows, when WTVC incidence was between 1-20%, to 17 rows when the incidence was between 21-40% (Figure 5A). The number of rows with a random distribution of WTVC infected plants has decreased to less than half (30 rows) when WTVC incidence was at 21-41% incidence than when it was between 1-20% (55 rows) (Figure 5A). Hence, the ratio of rows with aggregated over random distribution of infected plants increased as the WTVC incidence increased (Figure 5). Aggregation of WTVC infection was detected more often within rows than between rows of squash in experimental fields (Table 4). When ordinary runs analysis was performed between rows of squash, an aggregated distribution was detected only at 18 and 25 DAP in 2020. When analyzed within rows of squash, an aggregated distribution was detected at 15, 22, and 29 DAP in 2019, and at 18, 25, and 32 DAP in 2020 (Table 4). It is possible that these differences in the patterns of aggregation between and down rows is due to the bare-ground, access alleys acting as semi-permeable barriers to whitefly dispersal.
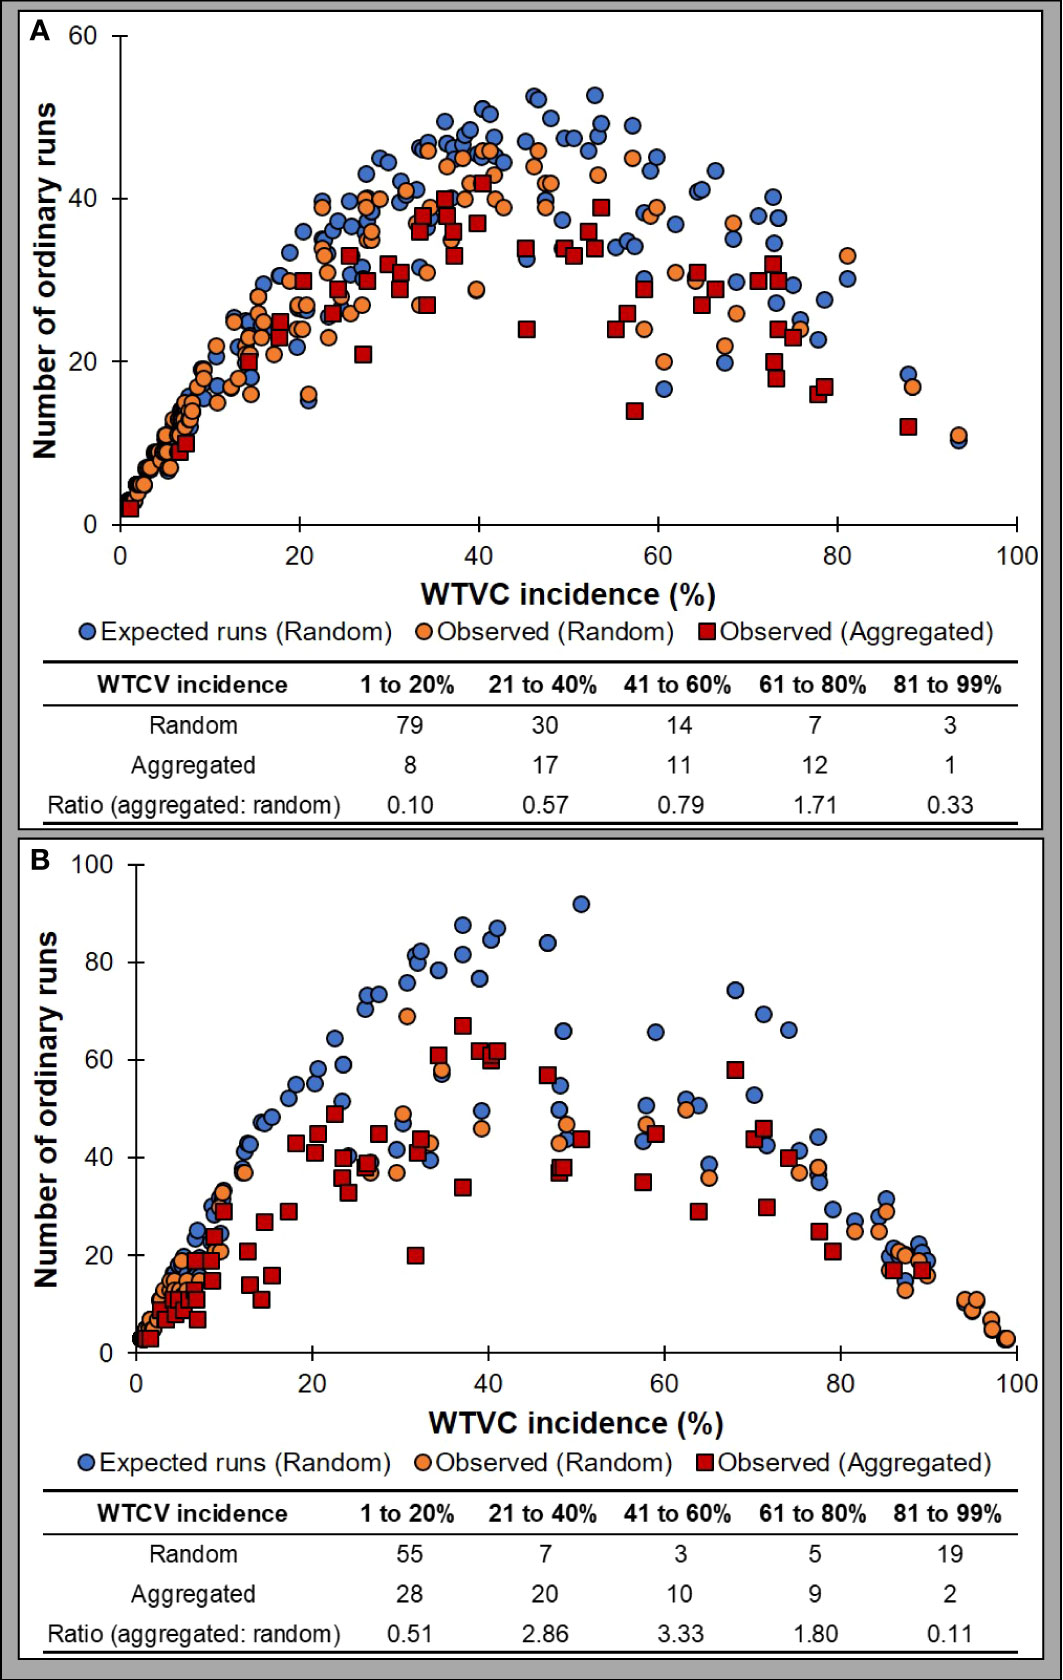
Figure 5 Analysis of one-dimensional spatial distribution of WTVC per row of plants based on ordinary runs analysis in experimental (A) and commercial (B) squash fields. The graph for the experimental field (A) comprised data collected in field trials conducted in 2019 and 2020 fall growing seasons. The plot of commercial fields (B) includes data collected from all six commercial squash fields that were surveyed in 2019 and 2020.
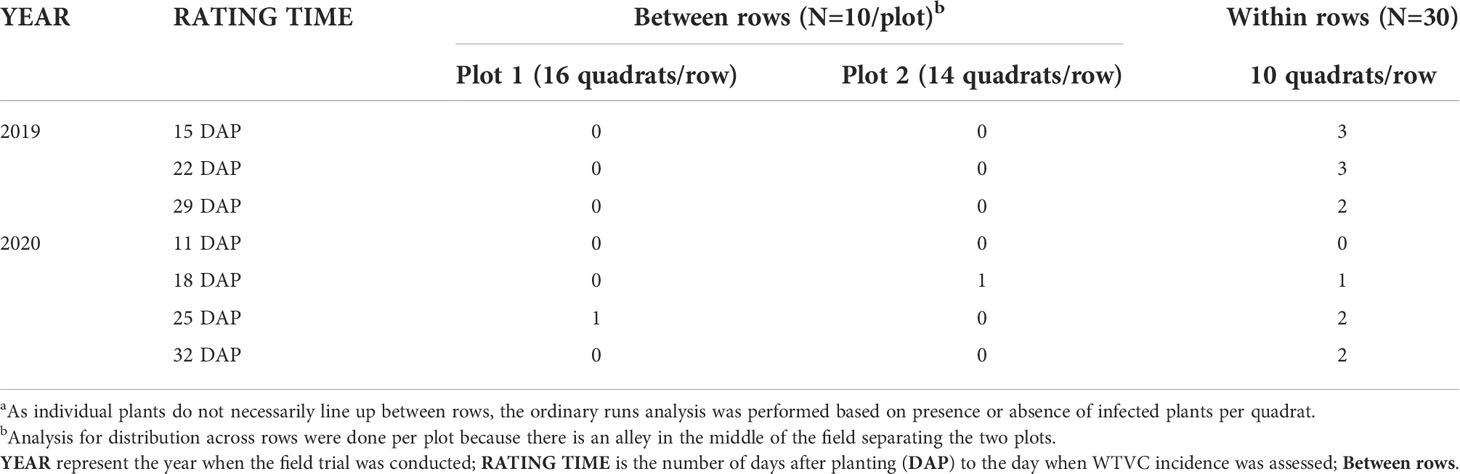
Table 4 Detection of aggregated distribution of virus incidence in experimental field through ordinary runs analysis performed between rows versus across rowsa.
Field-level patterns of whitefly and WTVC disease aggregation
The degree of disease aggregation throughout the study fields appeared to change with time, with the overall pattern of low levels of aggregation in the early stages of whitefly/disease colonization, increasing degree of aggregation as whitefly numbers and disease increased over time, and at the latest dates a decrease in the degree of aggregation as disease became abundant and whitefly abundance decreased.
Dispersing adult whiteflies (based on trap counts) had an aggregated distribution (Moran’s I> 0, P<.05) in the 2019 and 2020 experimental field (Table 5). Aggregation of dispersing whiteflies was also detected in three out of the six commercial fields. In the 2020 experimental field and in one of the commercial fields (Squash 3, Table 5), a shift from random to aggregated distribution of dispersing whiteflies were observed. The spatial distribution of dispersing whiteflies remained to be random or aggregated throughout the growing season.
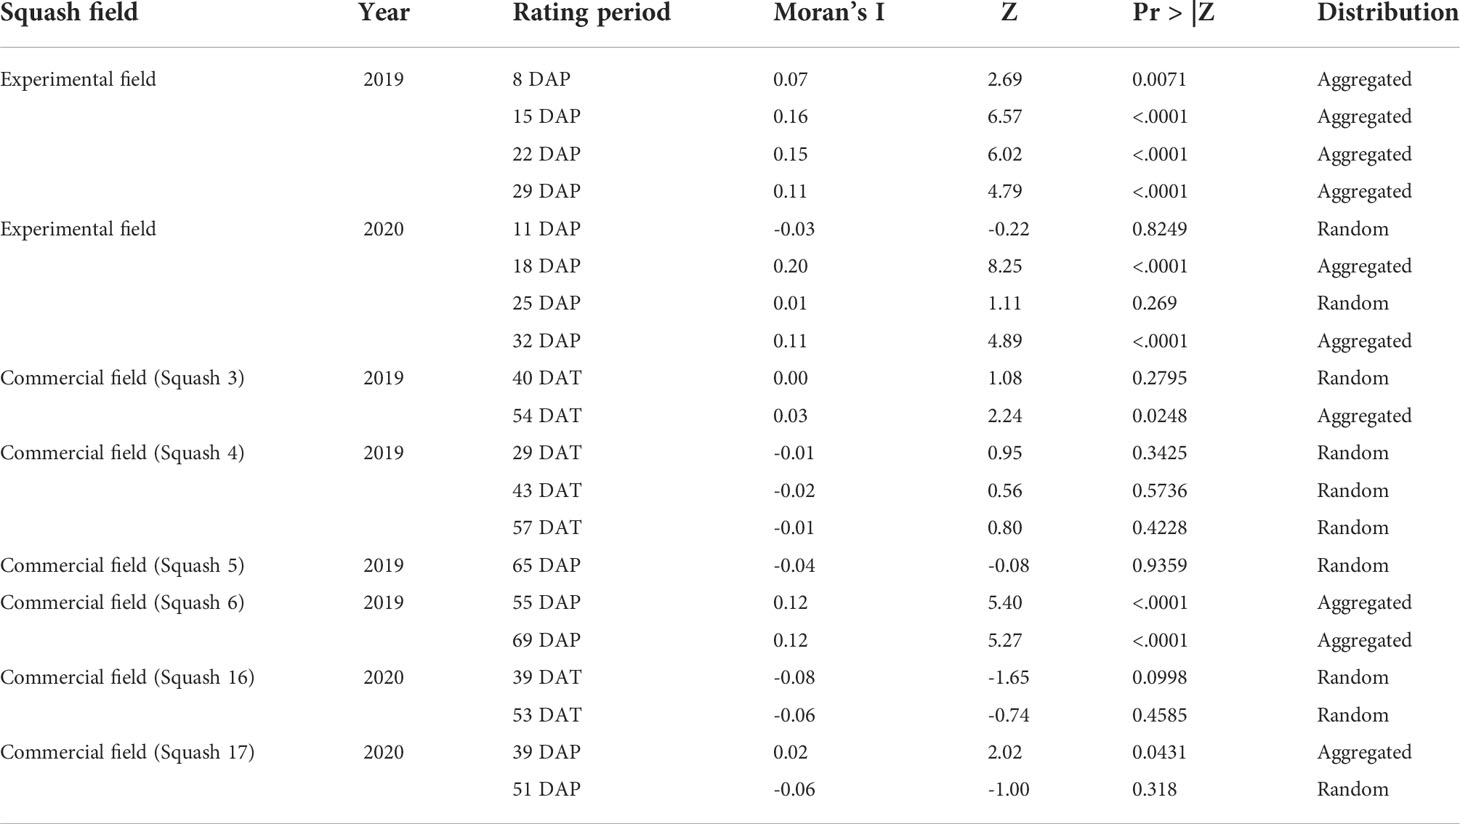
Table 5 Two-dimensional spatial distribution of adult whiteflies based on number of adults caught on traps in yellow squash fields based on spatial autocorrelation analysis per field and per rating period.
Aggregation of whiteflies populations, based on the leaf-flip counts, was detected in all assessment periods in the experimental field in 2019 and 2020 (Table 6). In commercial fields, the aggregated pattern was detected during at least one assessment period in three out of six fields. In general, the spatial distribution of whiteflies feeding on squash plants remained to be random or aggregated throughout the study period.
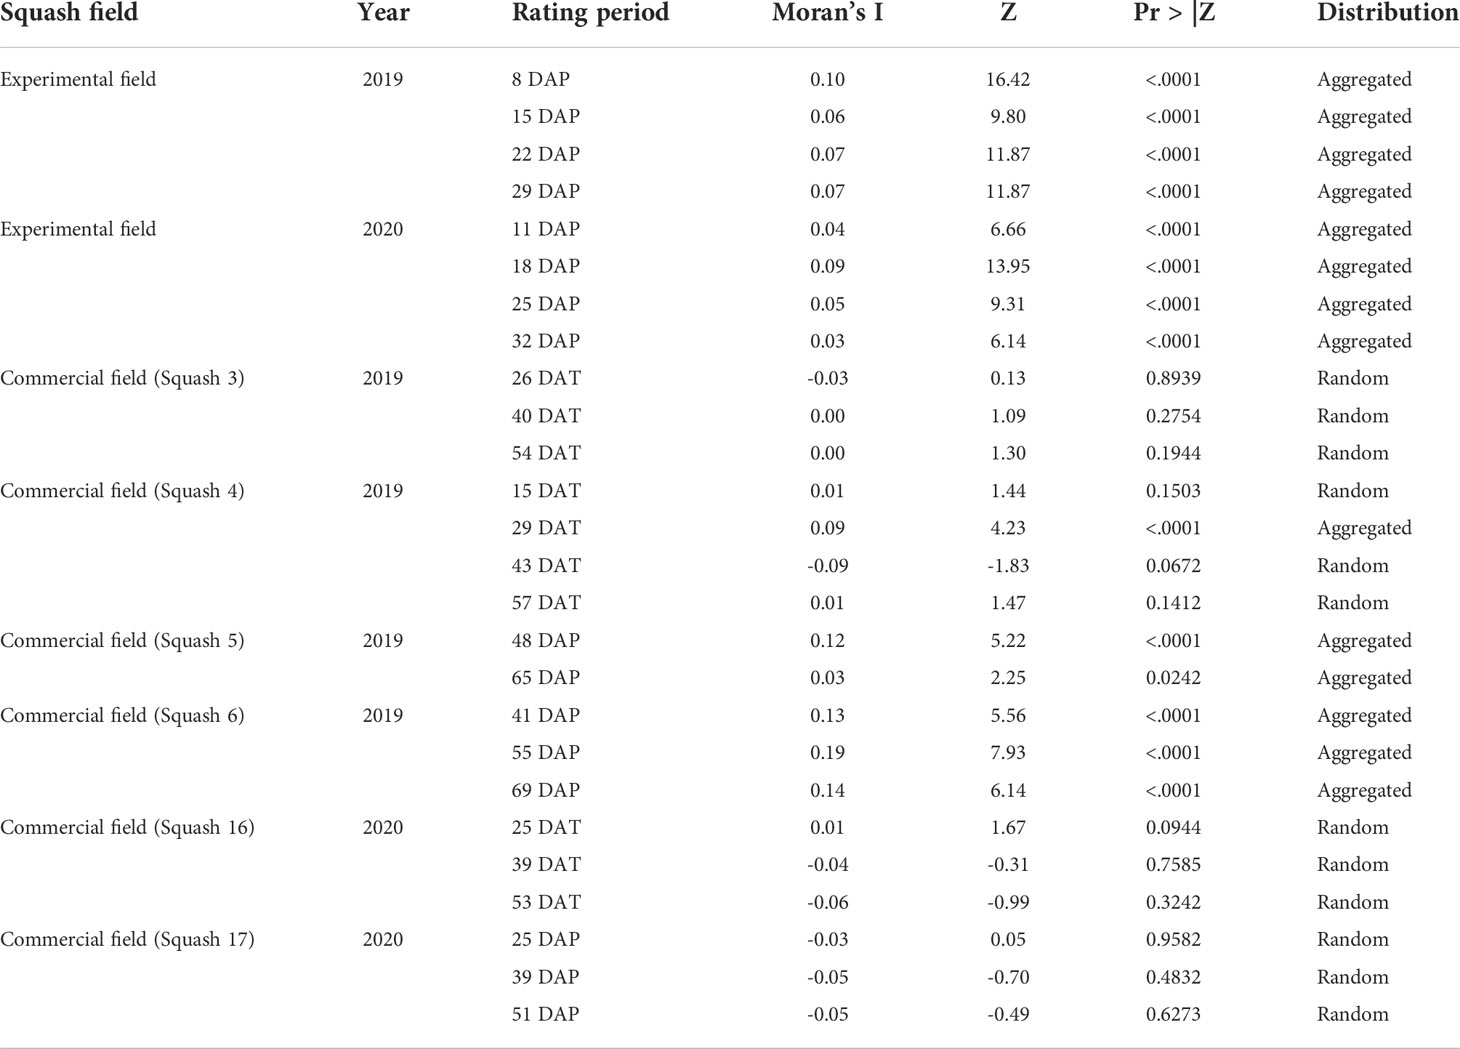
Table 6 Two-dimensional spatial distribution of adult whiteflies based on leaf-flip counts in yellow squash fields based on spatial autocorrelation analysis per field and per rating period.
The spatial distribution of WTVC infected plants at field-level followed a shift from a random towards an aggregated distribution as WTVC increased over time in the experimental and commercial fields as indicated by increasing Moran’s I values (Table 7). In the 2019 experimental field, plants showing symptoms of WTVC were observed 15 days after planting (DAP) and were found to have an aggregated distribution (Moran’s I=0.04 and P<.001). The spatial distribution of WTVC on the succeeding ratings in the 2019 experimental field was also aggregated. Whitefly feeding damage and WTVC infection resulted in severe stunting, silverleaf symptom, yellowing, wilting, and death of plants after 30 DAP in 2019.
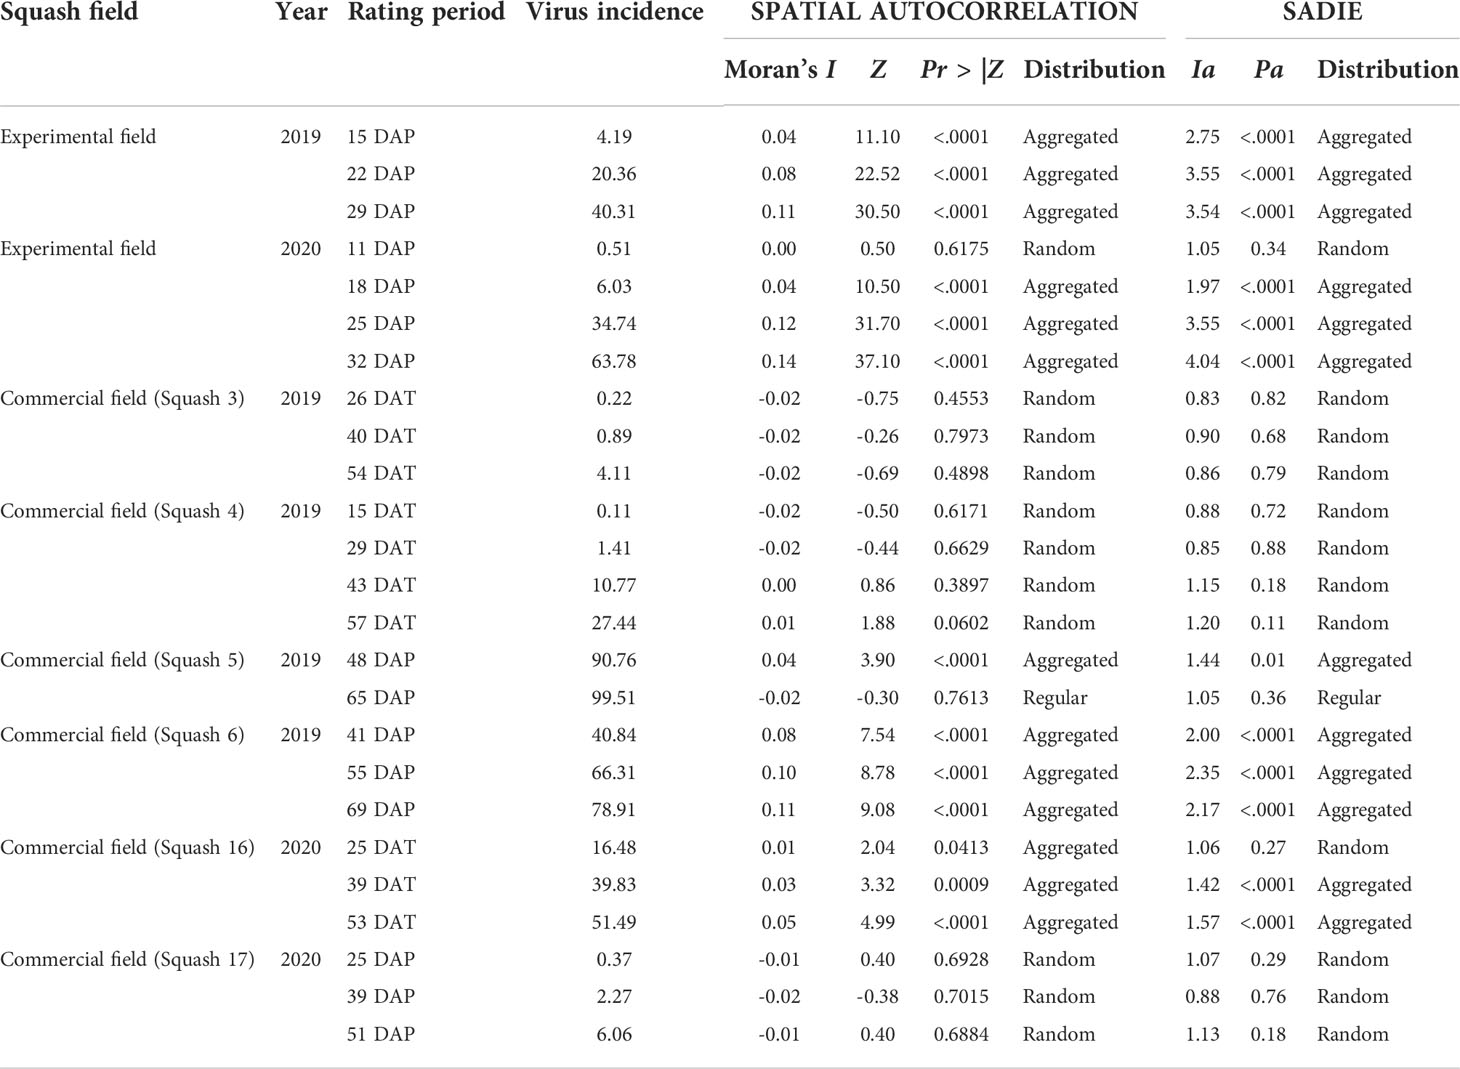
Table 7 Two-dimensional spatial distribution of WTVC in yellow squash fields based on spatial autocorrelation analysis and SADIE analysis based on WTVC incidence per field and per rating period.
In the 2020 experimental field, plants showing symptoms of WTVC were first observed at 11 DAP in the experimental field (Table 7). A random distribution (Moran’s I=0.00 and P=.617) of WTVC was detected at 11 DAP. Succeeding ratings taken at 18, 25, and 32 DAP had aggregated distributions.
In commercial fields, one of the six fields (Squash 16) showed a shift from random distribution, during the first rating, to an aggregated distribution on the succeeding ratings (Table 7). Two fields showed an aggregated WTVC distribution based upon first rating and remained to have an aggregated distribution (Squash 6) or shifted to a regular distribution (Squash 5) as WTVC incidence reached close to 100%. Three out of six fields had random distribution of WTVC in all rating periods. In these fields, the WTVC incidence ranged from zero to 27% and did not aggregate. Out of 25 assessment periods, there was a 95% agreement between the spatial autocorrelation analysis and SADIE on the distribution of WTVC in squash fields.
Spatially-explicit patterns of changes in WTVC distribution over time
Results from the SADIE analysis showed the occurrence of one or more patches of WTVC infected plants in the squash fields (Figures 6, 7). Although new patches were formed, the patches merged forming a bigger patch of infected plants as the percent WTVC incidence increased over time. This resulted to a shift from a random towards an aggregated distribution as WTVC increased over time in the experimental and commercial fields as indicated by increasing Ia values (Table 7). In general, the WTVC incidence was higher among quadrats within patches and was lower in the gaps where infection occurred at a random or regular pattern (Figures 6, 7).
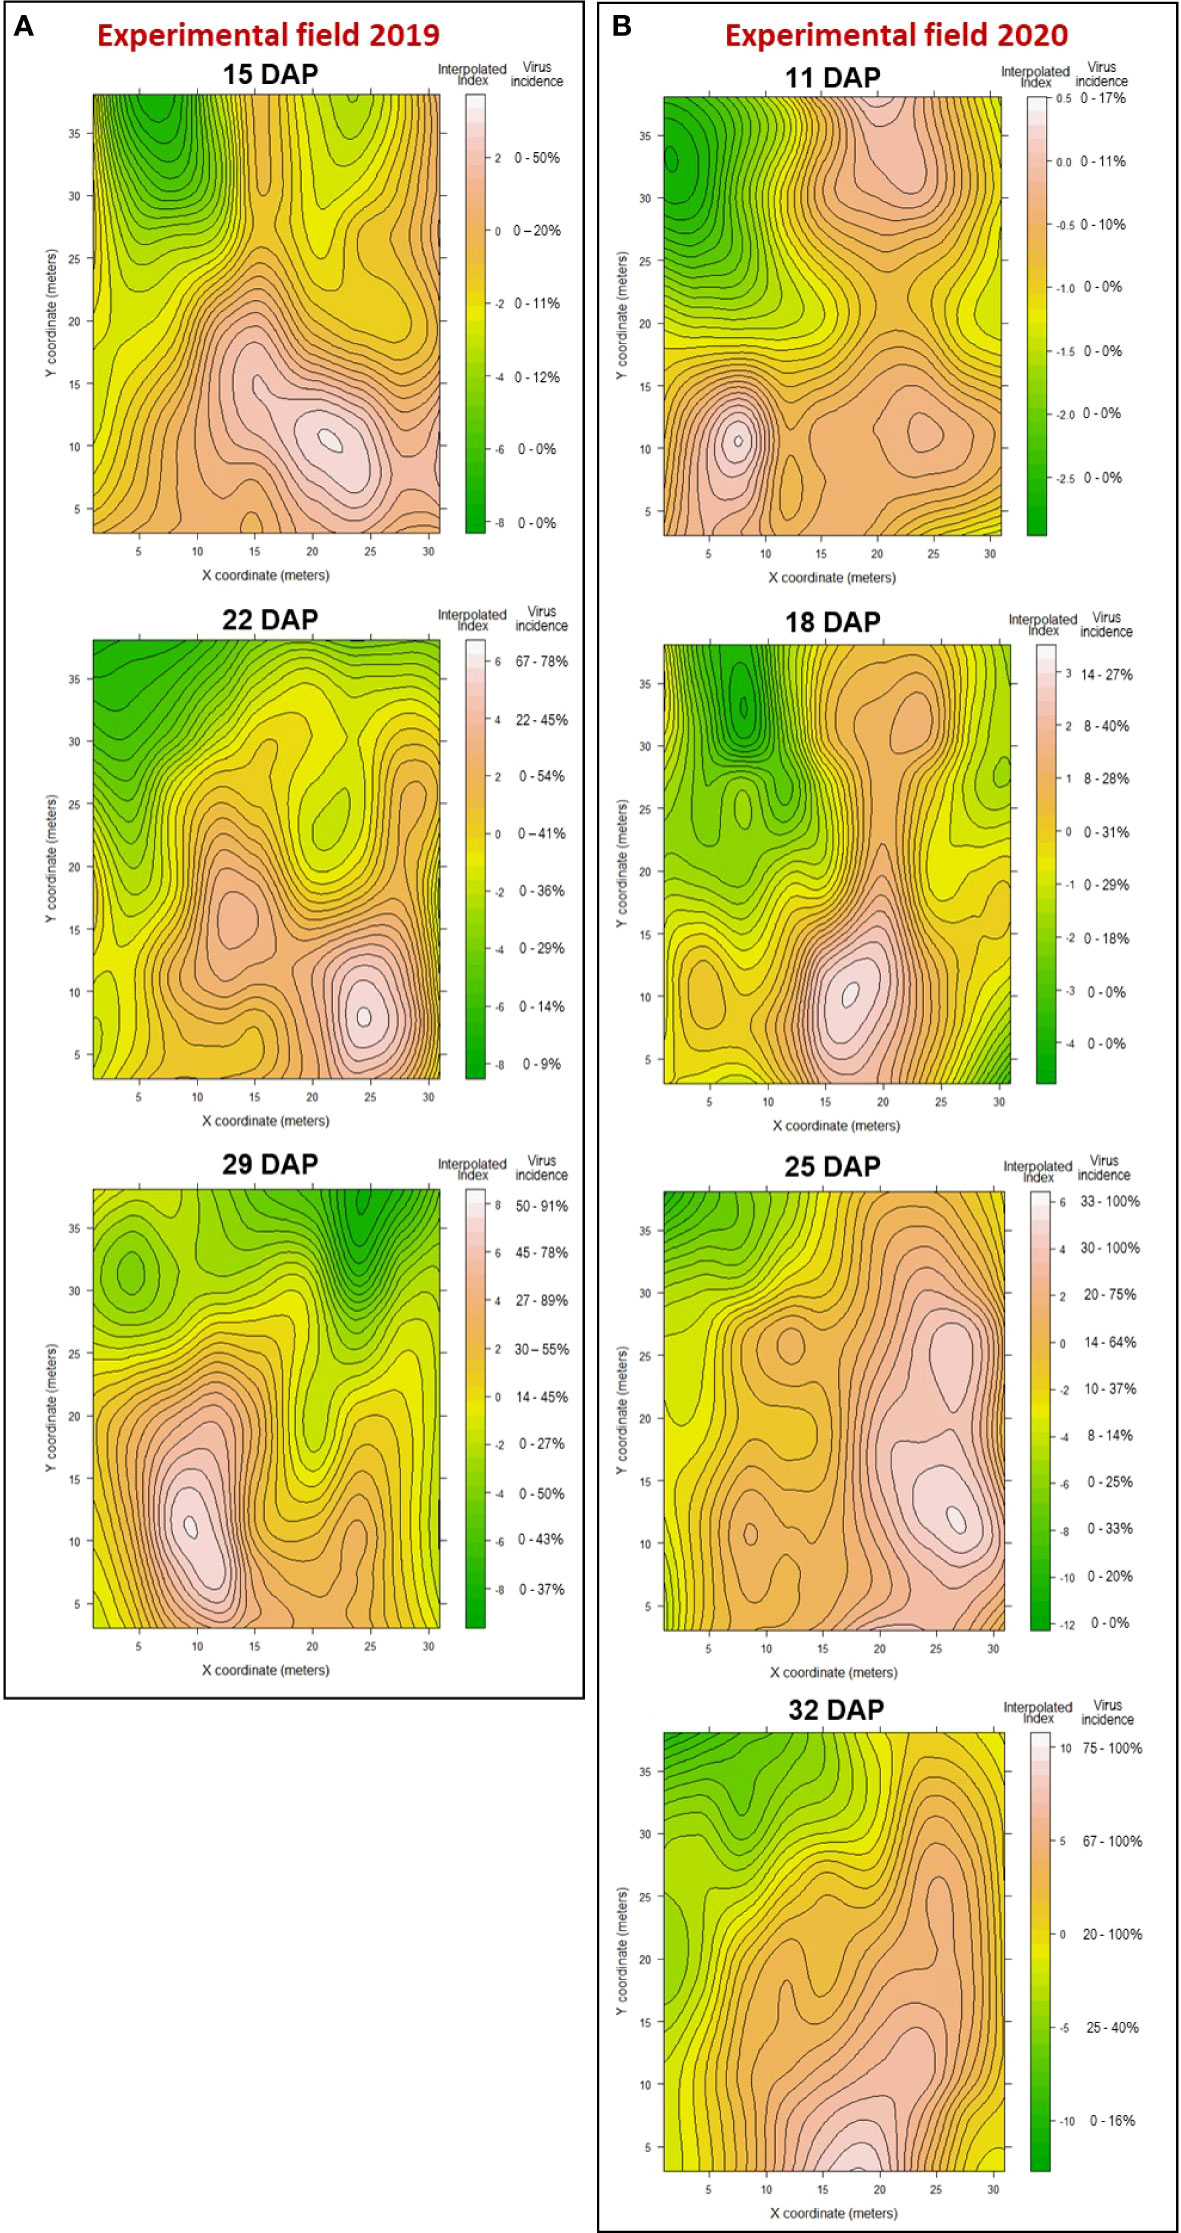
Figure 6 Contour maps of showing areas within the experimental field, in 2019 (A) and 2020 (B), where WTVC infected plants occurred as patches (red to white areas) or gaps (green areas) based on the interpolated index from the SADIE analysis.
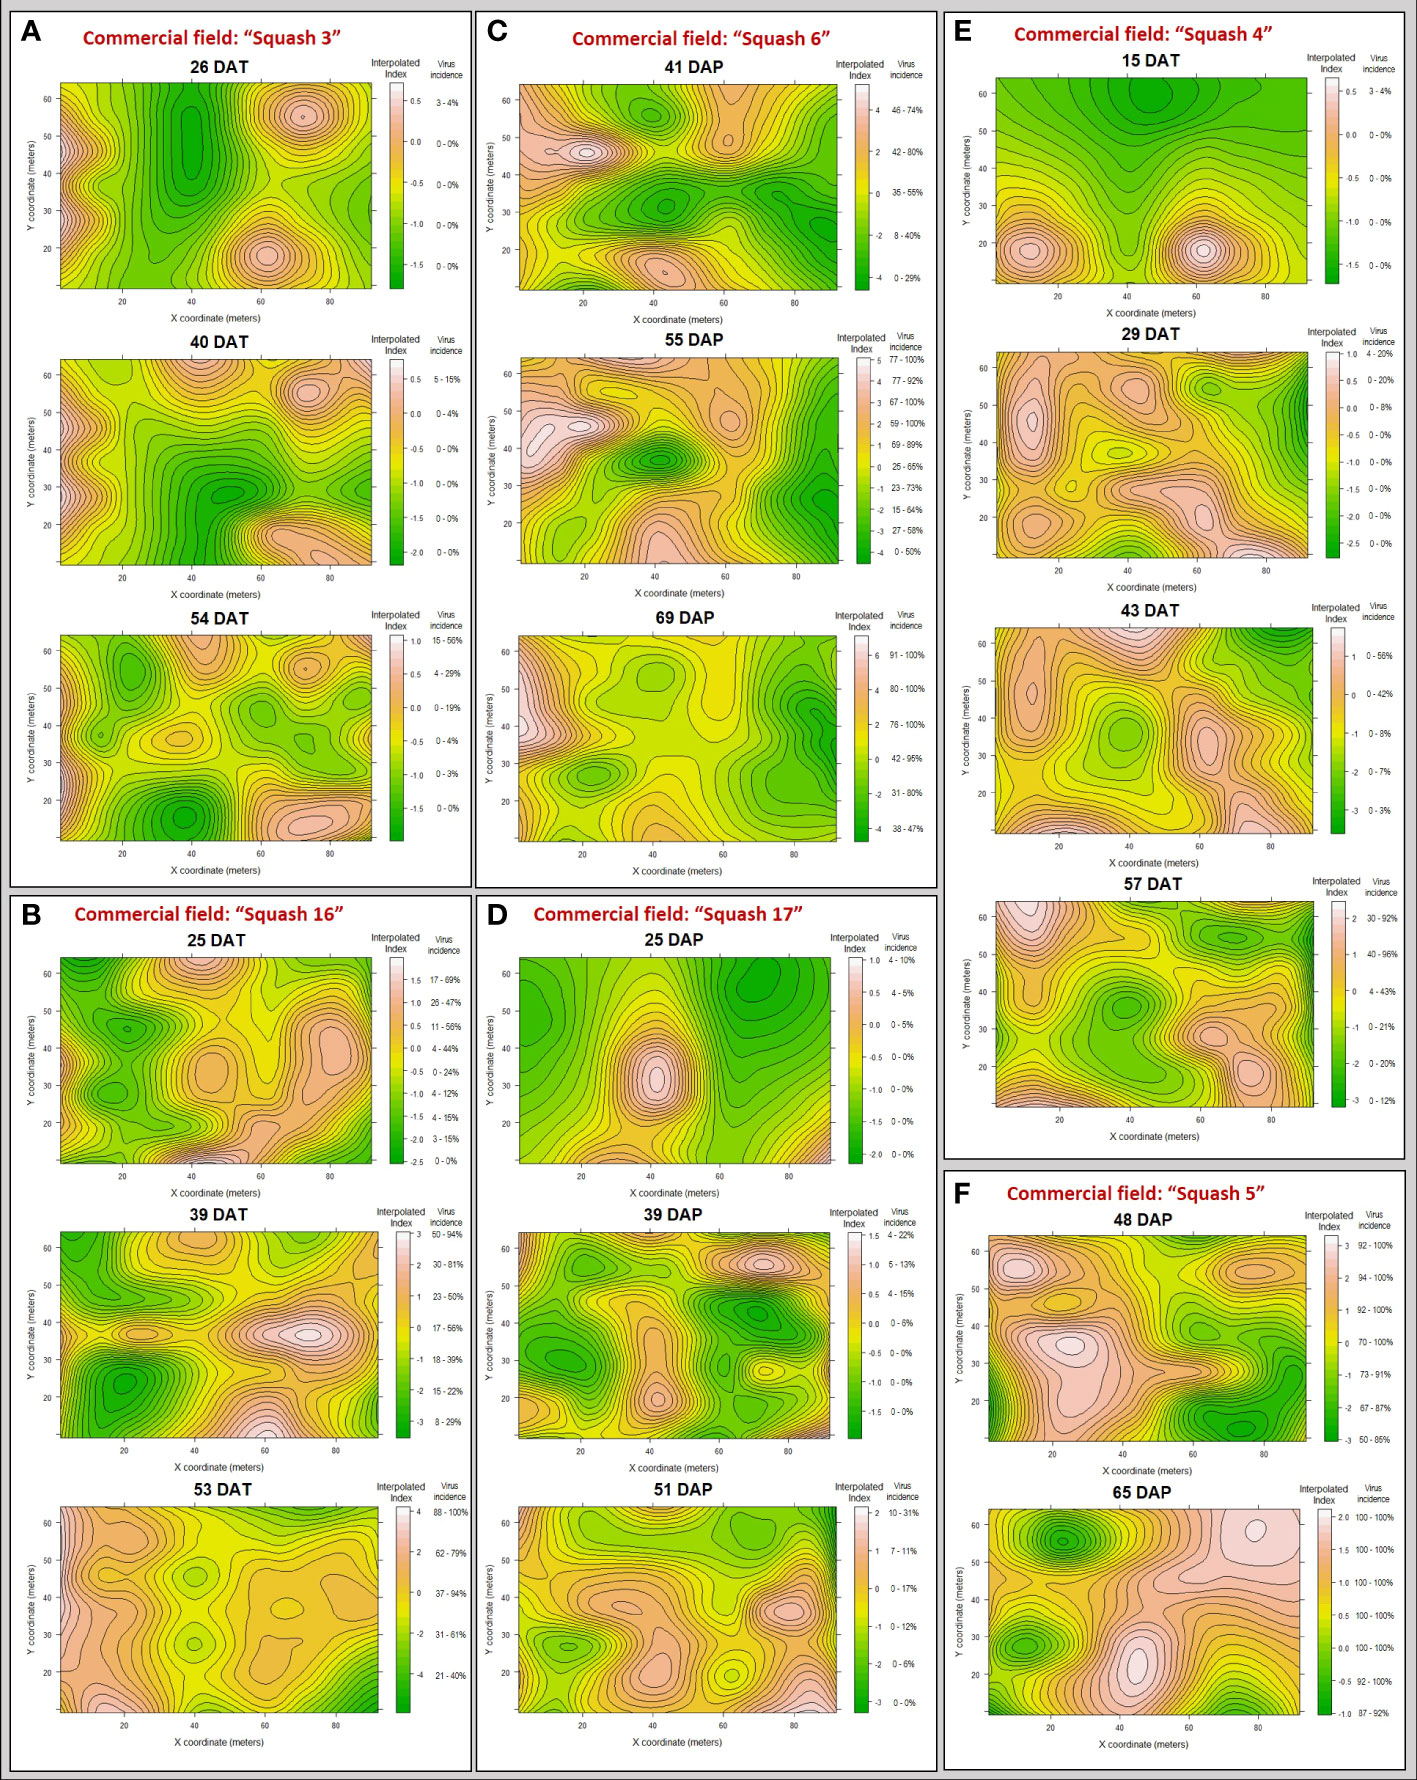
Figure 7 Maps of clustering indices with interpolated landscape and contours showing areas within commercial squash fields surveyed, in 2019 (A, C, E, F) and 2020 (B, D), where WTVC infected plants occurred as patches (red to white areas) or gaps (green areas) based on the interpolated index from the SADIE analysis.
In the 2019 experimental field, a patch (Ia= 2.75 and Pa<.0001) of WTVC infected plants was observed on the southeastern edge of the field at 15 DAP (Figure 6A; Table 7). At the incidence of WTVC increased over time, the clustering of infected plants formed two patches towards the western side of the field at 22 and 29 DAP. The initial occurrence of a patch of WTVC infected plants in the southeastern edge of the field and then spreading and forming a patch towards the western edge demonstrate an edge effect on the spread of WTVC by the whiteflies.
In the 2020 experimental field, a random (Ia= 1.05 and Pa=.34) occurrence of plants infected with WTVC was initially observed at 11 DAP in the field edges (south and northeast) similar to the edge associated colonization area observed in 2019 (Figure 6B). By 18 DAP, the initial randomly distributed WTVC infected plants became two patches (Ia= 1.97 and Pa<.0001). As WTVC incidence progressed, the two merged to form a continuous, larger area of abundant and aggregated disease by 25 (Ia= 3.55 and Pa<.0001) and 32 DAP (Ia= 4.04 and Pa<.0001).
The pattern of spread of WTVC infected plants from patches that were observed during initial assessments was also seen in five out of six commercial fields. In general, smaller patches of WTVC infected plants was observed during the initial assessment in “Squash 6”, “Squash 16”, “Squash 4”, “Squash 5”, and “Squash 17” (Figures 7B–E). As WTVC increased over time, the patches combined forming bigger patches of infected plants. Patches of WTVC infected plants initially occurring along the edge (along X-axis) of the field, as observed in experimental fields, were also observed in commercial fields such as in “Squash 4” and “Squash 17” (Figures 7D, E). Only the side along the X-axis is considered as an edge in commercial fields because the other sides were also planted with squash. The pattern WTVC spread in “Squash 3” (Figure 7A) deviated from patterns observed in experimental fields. In “Squash 3”, the patches observed during initial assessment did not converge, instead new smaller patches developed around the field.
Discussion
Whitefly transmit viruses in a persistent or semi-persistent manner. Depending on the virus and mode of transmission, whiteflies can acquire and transmit viruses within hours, remain viruliferous up to the duration of their life span, and can therefore feed and transmit the virus on multiple plants (Webb et al., 2007; Fiallo-Olivé et al., 2020). When choosing a host to settle on, whiteflies prefer younger leaves where they can feed and oviposit (Liu and Stansly, 1995). It only takes two to three weeks for whiteflies to complete their life cycle during optimal conditions, such as warmer temperatures and dry conditions during summer and fall in southern Georgia. Within only 1 day after turning adult, female whiteflies can oviposit and new generation will emerge in about three weeks (Powell and Bellows, 1992; Mansaray and Sundufu, 2009).
In the field setting, plants are exposed to whitefly feeding upon emergence or right after transplanting. During this time, viruliferous whiteflies can feed and transmit viruses in squash plants. While the proportion of viruliferous whiteflies among the whitefly populations entering the field is unknown, as disease incidence increase and the whitefly population grows, the proportion of viruliferous whiteflies is also expected to increase. Similar to earlier reports (Kuo et al., 2007; Turechek et al., 2010; Kavalappara et al., 2021), mixed infections of CuLCrV and CYSDV was common among symptomatic squash plants. Because mixed infections of whitefly-transmitted viruses are quite common, WTVC was used in this study as a collective term to refer to plants showing symptoms of virus infection. After inoculation, symptoms of WTVC show within 10 to 15 days post- inoculation (Akad et al., 2008; Gil-Salas et al., 2012). Assuming the conditions are optimal for whitefly development and the adult whiteflies oviposit while feeding and transmitting WTVC in squash plants, a new generation of whiteflies could develop on the WTVC infected plants. As the WTVC infected plant senesces, the new generation of whiteflies are likely to disperse and transmit the virus on non-infected plants and thereby causing secondary infections. This cycle of secondary infection may repeat several times until the squash growing period is over if whiteflies are left unmanaged and when environmental conditions are favorable. Considering the length of time from whitefly-mediated virus transmission to symptom development and potential occurrence of secondary infections arising from new whitefly generations dispersing from WTVC infected plants, a lag between the whitefly occurrence and WTVC symptom expression is expected.
Consistent with the expected relationship between whitefly abundance and the time-lagged WTVC incidence, a positive correlation between initial whitefly counts and time-lagged WTVC incidence ratings. Similar to the relationship between whitefly abundance and virus incidence observed in this study, a positive correlation between the number of whiteflies in the host plants and the virus incidence has been reported for other whitefly-transmitted viruses, such as cassava mosaic virus and tomato yellow leaf curl virus (Colvin et al., 2004; Anco et al., 2020). The positive correlation between whitefly counts and the time-lagged WTVC incidence suggests that the abundance of adult whiteflies or factors affecting whitefly populations during the early stages of crop development (i.e. seedling and vegetative stages) could be a good predictor of WTVC risk. In the tobacco-thrips-TSWV pathosystem for example, weather parameters that affect the population of thrips (Frankliniella fusca), including average winter temperatures and cumulative amount of rainfall in March, were found to be the most important predictors of TSWV in tobacco grown in North Carolina (Morsello et al., 2010; Chappell et al., 2013). The positive correlation between whitefly counts and the time-lagged WTVC incidence also adds more weight on the importance of effectively managing whiteflies early in the cropping season. In principle, because there is a positive relationship, application of pest management tactics that reduce whitefly populations, such as insecticide application or use of UV-reflective mulches, or insect-proof row covers, would also result in reduction of WTVC incidence.
The positive correlation between whitefly abundance and WTVC incidence may indicate that such vector-virus interactions could result in an aggregated distribution of vector as was observed in squash fields that had higher levels of WTVC incidences (Table 7). It has been established that non-viruliferous whiteflies are attracted to virus infected plants (Legarrea et al., 2015, Chesnais et al., 1999), this could potentially facilitate further virus acquisition and transmission to nearby healthy plants, which could eventually result in aggregated distribution. According to Thomas et al. (2001), insects can be highly aggregated even in a habitat where uniform conditions occur such as in a farm practicing a monoculture. Some of the factors that may cause insects to aggregate into patches include habitat disruption, microclimate, prey or predator occurrence, attraction to olfactory cues, a greater probability of mating, or competition with other species (Turchin, 1989; Thomas et al., 2001, Vinatier et al., 2011). Although an aggregated distribution of whiteflies does not always occur (Tables 5, 6), as was observed in some of the commercial squash field surveyed in this study, occurrence of such should be considered when monitoring for whiteflies. The abundance of whiteflies in a field could be underestimated if the scouting were conducted in areas where lower numbers of whiteflies occur, when some areas in the field may have a higher number of whiteflies. Thus, scouting in multiple parts of the field is key in making an estimate of the whitefly abundance in each field. Moreover, whitefly counts taken by the leaf-flip method had a more consistent correlation with WTVC incidence ratings than counts taken on traps in this study. Studies comparing different sampling methods for whiteflies also showed that sticky traps were less efficient, inconsistent, and less precise in estimating of whitefly populations than the leaf flip method (Naranjo et al., 1995; Palumbo et al., 1995). Hence, whitely numbers taken through leaf-flip method may be a more reliable method to base management decisions than sticky card traps.
Studies on characterization of the temporal patterns and spatial distribution of whitefly-transmitted viruses at field level in watermelons and at a regional level tomatoes have been conducted in southwestern Florida, United States (Turechek et al., 2014; Anco et al., 2020). In a watermelon field, an aggregation of squash vein yellowing virus infected plants was detected (Turechek et al., 2014). A strong linear relationship between whitefly densities and TYLCV incidences in neighboring tomato fields extending up to 2.5 km for TYLCV and 5km for whiteflies (Anco et al., 2020). However, there is still a lack of information on the changes on the spatial distribution of whitefly-transmitted virus infected plants over the growing period. While some similarities in the spatial distribution of whitefly-transmitted viruses in squash may be expected due to the same vector and virus, differences in host crops, cropping systems, and weather (specially with freezing events during the winter) may influence the spatiotemporal patterns in Georgia.
The short-distance dispersal and host preference of whiteflies may explain the observed shift from a random to an aggregated distribution across different spatial scales, including at field level (two-dimensional scale) and within rows (one-dimensional scale) (Table 7; Figures 3–5). Based on the random distribution of WTVC infected plants, it appears that primary infection would typically cause up to 20% WTVC incidence in squash fields (Figure 5). As new generation of whiteflies emerges from initially infected plants, they are likely to feed and acquire the virus from the infected plant as they do not move long distances. By the time the nymphs reach an adult stage, they disperse within short distances into neighboring plants to feed and inoculate the viral pathogens (Sütterlin, 2000) thereby leading to the secondary spread of WTVC. The infection arising from secondary spread of WTVC are observed when the virus incidences reaches over 20% as indicated by the occurrence of an aggregated distribution of WTVC infected plants. This phenomenon could have contributed to the observed shift into an aggregated distribution as the WTVC incidence increased over time. It has been previously reported that viruliferous whiteflies prefer non-infected plants while non-viruliferous whiteflies tend to feed on TYLCV infected plants (Legarrea et al., 2015). In another study, the mechanism behind the diminishing preference of viruliferous whiteflies to TYLCV infected plants was investigated. It was found that TYLCV caused neurodegeneration in the brain of viruliferous whiteflies leading to impairment of their senses of sight and smell (Wang et al., 2020). As a result, viruliferous whiteflies could not distinguish between infected and non-infected plants. With the diminishing preference to TYLCV infected plants, viruliferous whiteflies have greater chances of settling on non-infected plants and therefore are more efficient in spreading the virus. These vector-virus-host interactions would cause the occurrence of an aggregated distribution of WTVC infected plants, as was observed in this study. Therefore, the findings in this study conform to expectations considering the feeding behaviors and dispersal of the vector whiteflies.
The more frequent aggregation of infected plants within rows than between rows of squash suggests that the whiteflies are more likely to move to the nearest plant along a continuous canopy (within rows) than across a bare ground (between rows) (Table 4). This tendency of whiteflies to move along a path with least resistance within rows of plants leads to an aggregation of WTVC infected plants within rows of plants as the virus infection spreads over time. Insects moving along a path of least resistance (within rows) rather than between rows has also been reported on stink bugs in peanuts and soybeans as well as on leaf hoppers in corn (Panizzi et al., 1980; Power, 1992; Tillman et al., 2009). Similar to what was observed in this study, occurrence of aggregation of virus infected plants within but not between rows has also been observed in other virus-plant pathosystems, such as potato virus S in potatoes (Lambert et al., 2007) and plum pox virus (PPV) in Prunus spp. (Gottwald et al., 2013; Dal Zotto et al., 2020). Therefore, in addition to the feeding preference of viruliferous and non-viruliferous whiteflies, another factor that contributes to the observed aggregation of WTVC infection is the tendency of whiteflies to move within rows of plants towards the nearest suitable plant.
The aggregation of WTVC infection occurring in both experimental and commercial fields (Table 7) suggests that the spatial patterns observed in fields where whiteflies were not managed (experimental) could also occur in commercial fields where management tactics against whiteflies were applied. The higher WTVC incidence and aggregation of infected plants in some commercial fields could also indicate an inadequate management of whiteflies, as was reported in other papers (Hilje et al., 2001; Gilbertson et al., 2011; Ally et al., 2019). One example of a management tactic used for managing insect-transmitted viruses that have an aggregated distribution is the removal of all PPV hosts (Prunus spp.) within 500m of PPV-infected trees, which contributed to the overall eradication of PPV in Pennsylvania, USA (Gottwald et al., 2013). The same tactic may also be used of managing WTVC in squash, where symptomatic plants including plants around it (specially plants within the same rows) will be removed to reduce sources of inoculum and slow the spread of WTVC in squash fields. However, to be effective in reducing losses to WTVC, removal of infected plants should be done as soon as infection is detected to limit the whiteflies from acquiring and spreading the virus. Some of squash production practices could also lead to lower levels of WTVC infection. For example, the “Squash 17” field was planted towards the end of September in 2020 (Table 1), by this time the whitefly populations were already declining due to colder temperature (Candian et al., 2021). With declining whitefly populations, the chances of dispersal and subsequent spread of WTVC is also reduced, which is the reason lower levels of WTVC infection were observed in this field (Table 7).
The edge effect on the colonization and spread of insect vectors and the viruses they transmit also influence the spatiotemporal patterns of insect-transmitted viruses. In onion fields, higher incidences of the thrips-transmitted iris yellow spot virus were observed in field edges and lower incidences near field centers (Gent et al., 2004). Fargette et al. (1985) also reported higher number of whiteflies and a higher incidence of cassava mosaic virus on the edges of cassava fields. Similar to the aforementioned studies, we found an edge effect on the distribution of WTVC in squash fields (Figures 6, 7). Patches of WTVC infected plants were detected near field edges during initial ratings, which combined to form bigger patches of WTVC infection in squash fields over time. Patches of WTVC infected plants occurring in field edges were seen to influence the overall spread of infection and spatial distribution of infected plants over time, especially when whiteflies were unmanaged as was observed in experimental fields. The edge effect on the distribution of WTVC could be associated with the dispersal behavior of whiteflies. While we do not have data to show this, we can speculate that whiteflies will potentially settle on the first host plant they find, which would be the field edges, after a dispersal event from another location. The edge-biased distribution is widespread among insect species in agricultural fields (Nguyen and Nansen, 2018). In a winter wheat field, Winder et al. (1999) found a higher abundance of grain aphids (Sitobion avenae Fabricius) along field edges. In another study, higher counts of cabbage aphids (Brevicoryne brassicae L.) were found within 20 to 30m from field edges than further inwards into canola fields (Severtson et al., 2015). In winter wheat fields, Amara species, Bembidion lampros Herbst, as well as Carabidae and Lycosidae insects were predominantly found within 60 m of the field edge (Holland et al., 1999). Tillman et al. (2014) also found an edge effect on the colonization of stink bugs in corn and cotton fields that are next to woodlands. The occurrence of an edge effect on the distribution of whiteflies and WTVC should be accounted for when scouting, monitoring, and planning pest management strategies. When scouting WTVC infection in squash fields, a stratified sampling approach with a greater focus along field edges than field interiors can reduce scouting efforts in finding WTVC infected plants. Targeted scouting along field edges for whiteflies using the leaf-flip method could also facilitate earlier detection and application of management interventions against whiteflies.
An understanding of the shift from random to aggregated distribution and the edge effect on WTVC incidence are considerations for refining current management strategies. An example of a tactic that could be explored include planting zucchini squash (tolerant to whiteflies and CuLCrV) in the borders of the field which could help slow down the spread of disease and reduce yield losses from WTVC. Scouting and rouging virus-infected plants early in the growing season could also help reduce sources of inoculum for the secondary spread later in the season. Recently, detection of virus-infected plants through canines has been reported for the detection of watermelon plants infected with squash vein yellowing virus (Adkins et al., 2021). Canines can be trained to sniff out specific volatile organic compounds that are unique for disease infected plants, as shown for plum pox virus, little cherry disease, citrus canker, and citrus greening (Angle et al., 2016; Dininny, 2019; Gottwald et al., 2019; Fuchs, 2020). The use of canines can further help in the scouting, early detection, and rouging potential sources of inoculum early in the season. In principle, by reducing the number of randomly infected plants in the field early in the season, we can reduce the occurrence of aggregated WTVC infected plants arising from secondary spread later in the growing season. These examples of management tactics, when proven to work, are potential means of managing WTVC and whiteflies that growers can add in their pest management programs to reduce losses from WTVC infection.
Conclusions
The spatial distribution of WTVC infected plants shifted from a random pattern to an aggregated pattern as the disease incidence increased over time. The occurrence of explosive populations of whiteflies and their movement within rows of plants after virus-acquisition from infected plants contributed to the aggregation of symptomatic plants in squash fields. The abundance of whitefly populations positively correlated with WTVC incidence in squash fields. Hence, effective WTVC management should rely on reducing whitefly populations in squash fields. Our data indicate that WTVC infection generally initiates along the edges of the squash fields, which later get spread by viruliferous whiteflies more often within rows than between rows of squash plants. The edge effect on the distribution as well as the within row spread of infection need to be accounted for during scouting, monitoring, and planning pest management strategies. These findings can potentially be a basis for developing future studies on designing scouting and sampling patterns for early detection of WTVC infection, identifying and determining appropriate timing for applying each pest management tactic to reduce the impact of WTVC infection that often arise from primary and secondary spread by viruliferous whiteflies.
Data availability statement
The original contributions presented in the study are included in the article/supplementary material. Further inquiries can be directed to the corresponding author.
Author contributions
Conceptualization, BD, RS, RK, and CC. Methodology, BD, RS, RK, and CC. Formal analysis, CC and PS. Investigation, CC, BD, and RK. Resources, RK, BD, AS, and RS. Data curation, CC, BD, and RS. Writing original draft preparation, CC and PS. Writing, review and editing, CC, PS, BD, RK, RS, AS. Visualization, CC and PS. Supervision, RS, PS, BD, RK, RS, and AS. Project administration, BD, RK, and RS. Funding acquisition, RS, BD, and RK. All authors have read and agreed to the published version of the manuscript.
Funding
This work was supported by grants from the USDA-Specialty Crops Research Initiative (USDA NIFA SCRI grant 2018-03391). This study was partly funded by the USDA UGA Cooperative Agreement (58-6080-9-006 “Managing whiteflies and whitefly-transmitted viruses in vegetable crops in the southeastern U.S.”)
Acknowledgments
The authors would like to thank Justin Hand, Bryce Sutherland, Scott Carlson, William Gay, Jeremy Kichler, and Ty Torrance for their assistance in coordinating with the growers which allowed us to conduct this study in commercial fields. We also acknowledge Caleb Clements, Edna Shannon, Michael Foster, Michael Donahoo, Michael Duval, and Ryan Garrett for their assistance in setting up and maintenance of field trials, sampling, rating, and counting whiteflies in the squash fields.
Conflict of interest
The authors declare that the research was conducted in the absence of any commercial or financial relationships that could be construed as a potential conflict of interest.
Publisher’s note
All claims expressed in this article are solely those of the authors and do not necessarily represent those of their affiliated organizations, or those of the publisher, the editors and the reviewers. Any product that may be evaluated in this article, or claim that may be made by its manufacturer, is not guaranteed or endorsed by the publisher.
References
Adkins S., Polston J. E., Turechek. W. W. (2009). Cucurbit leaf crumple virus identified in common bean in Florida. Plant Dis. 93, 320. doi: 10.1094/PDIS-93-3-0320B
Adkins S., Turecheck W., Gavin P., Smith H., Gottwald T., Schneider W. (2021). “Canine detection of whitefly-transmitted vegetable viruses,” in ESA 2021 (United States: Denver, CO).
Akad F., Webb S., Nyoike T. W., Liburd O. E., Turechek W., Adkins S. (2008). Detection of cucurbit leaf crumple virus in Florida cucurbits. Plant Dis. 92, 648. doi: 10.1094/PDIS-92-4-0648C
Ally H. M., Hamss H. E., Simiand C., Maruthi M. N., Colvin J., Omongo C. A., et al. (2019). What has changed in the outbreaking populations of the severe crop pest whitefly species in cassava in two decades? Sci. Rep. 9, 14796. doi: 10.1038/s41598-019-50259-0
Anco D. J., Rouse L., Lucas L., Parks F., Mellinger H. C., Adkins S., et al. (2020). Spatial and temporal physiognomies of whitefly and tomato yellow leaf curl virus epidemics in southwestern Florida tomato fields. Phytopathology 110, 130–145. doi: 10.1094/PHYTO-05-19-0183-FI
Angle T. C., Passler T., Waggoner P. L., Fischer T. D., Rogers B., Galik P. K., et al. (2016). Real-time detection of a virus using detection dogs. Front. Vet. Sci. 2, 79. doi: 10.3389/fvets.2015.00079
Arancibia R. A., Kuhar T. P., Reiter M. S., Rideout S. L. (2018). Southeastern US vegetable crop handbook. Willoughby, OH, USA: Meister Media Worldwide: 50–53,
Byrne D. N., Bellows T. S. Jr. (1991). Whitefly biology. Annu. Rev. Entomol. 36 (1), 431–457. doi: 10.1146/annurev.en.36.010191.002243
Candian J. S., Coolong T., Dutta B., Srinivasan R., Sparks A., Barman A., et al. (2021). Yellow squash and zucchini cultivar selection for resistance to cucurbit leaf crumple virus in the southeastern united states. HortTechnology 31 (4), 504–513. doi: 10.21273/HORTTECH04877-21
Chappell T. M., Beaudoin A. L., Kennedy G. G. (2013). Interacting virus abundance and transmission intensity underlie tomato spotted wilt virus incidence: an example weather-based model for cultivated tobacco. PloS One 8 (8), e73321. doi: 10.1371/journal.pone.0073321
Chesnais Q., Sun P., Mauck K.E. (1999). Advanced infections by cucurbit yellow stunting disorder virus encourage whitefly vector colonization while discouraging non-vector aphid competitors. Journal of Pest Science 95 (1), 234–237. doi: 10.1371/journal.pone.0073321
Colvin J., Omongo C. A., Maruthi M. N., Otim-Nape G. W., Thresh J. M. (2004). Dual begomovirus infections and high bemisia tabaci populations: two factors driving the spread of a cassava mosaic disease pandemic. Plant Pathol. 53 (5), 577–584. doi: 10.1111/j.0032-0862.2004.01062.x
Dal Zotto A., Porcel L. B., Marini D. B., Picca C. N., Córdoba M., Teich I., et al (2020). Spatio - temporal spread of Plum pox virus infecting European plum (Prunus domestica L. cv. D'agen) orchard in Mendoza, Argentina. Revista de la Facultad de Ciencias Agrarias. Universidad Nacional de Cuyo 52 (1), 261–275.
De Barro P. J., Liu S., Boykin L. M., Dinsdale. A. B. (2011). Bemisia tabaci: A statement of species status. Annu. Rev. Entomol. 56, 1. doi: 10.1146/annurev-ento-112408-085504
Dininny S. (2019). “Canines trained to sniff out diseases,” in Good fruit grower 34–37. Available at: https://www.goodfruit.com/sniffing-out-diseases/.
Fargette D., Fauquet C., Thouvenel J. C. (1985). Field studies on the spread of African cassava mosaic. Ann. Appl. Biol. 106 (2), 285–294. doi: 10.1111/j.1744-7348.1985.tb03118.x
Fiallo-Olivé E., Pan L. L., Liu S. S., Navas-Castillo J. (2020). Transmission of begomoviruses and other whitefly-borne viruses: Dependence on the vector species. Phytopathology 110 (1), 10–17. doi: 10.1094/PHYTO-07-19-0273-FI
Fuchs M. (2020). Grapevine viruses: A multitude of diverse species with simple but overall poorly adopted management solutions in the vineyard. J. Plant Pathol. 102 (3), 643–653. doi: 10.1007/s42161-020-00579-2
Gangwar R. K., Charu G. (2018). Lifecycle, distribution, nature of damage and economic importance of whitefly, bemisia tabaci (Gennadius) acta sci. Agric 2, 36–39.
Gautam S., Gadhave K. R., Buck J. W., Dutta B., Coolong T., Adkins S., et al. (2020). Virus-virus interactions in a plant host and in a hemipteran vector: Implications for vector fitness and virus epidemics. Virus Res. 286, 198069. doi: 10.1016/j.virusres.2020.198069
Gent D. H., Schwartz H. F., Khosla R. (2004). Distribution and incidence of iris yellow spot virus in Colorado and its relation to onion plant population and yield. Plant Dis. 88 (5), 446–452. doi: 10.1094/PDIS.2004.88.5.446
Gigot C. (2018) Analyzing plant disease epidemics with the r package epiphy. Available at: https://cran.r-project.org/web/packages/epiphy/vignettes/epiphy.html.
Gilbertson R. L., Rojas M., Natwick E. (2011). Development of integrated pest management (IPM) strategies for whitefly (Bemisia tabaci)-transmissible geminiviruses. In The whitefly, Bemisia tabaci (Homoptera: Aleyrodidae) interaction with geminivirus-infected host plants(pp. 323-356). Springer, Dordrecht.
Gil-Salas F. M., Peters J., Boonham N., Cuadrado I. M., Janssen D. (2012). Co-Infection with cucumber vein yellowing virus and cucurbit yellow stunting disorder virus leading to synergism in cucumber. Plant Pathol. 61 (3), 468–478. doi: 10.1111/j.1365-3059.2011.02545.x
Gottwald T., Poole G., McCollum T., Hall D., Hartung J., Bai J., et al. (2019). Canine olfactory detection of a vectored phytobacterial pathogen, liberibacter asiaticus, and integration with disease control. Proc. Natl. Acad. Sci. U.S.A 117 (7), 3492–3501. doi: 10.1073/pnas.1914296117
Gottwald T. R., Wierenga E., Luoa W., Parnell S. (2013). Epidemiology of plum pox 'D' strain in Canada and the USA. Can. J. Plant Pathol. 35, 442–447. doi: 10.1080/07060661.2013.844733
Guzman P., Sudarshana M. R., Seo Y.-S., Rojas M. R., Natwick E., Turini T., et al. (2000). A new bipartite geminivirus (begomovirus) causing leaf curl and crumpling in cucurbits in the imperial valley of California. Plant Dis. 84, 488. doi: 10.1094/PDIS.2000.84.4.488C
Hidayat P., Bintoro D., Nurulalia L., Basri M. (2018). Species, host range, and identification key of whiteflies of bogor and surrounding area (Lampung University, Indonesia).
Hilje L., Costa H. S., Stansly P. A. (2001). Cultural practices for managing bemisia tabaci and associated viral diseases. Crop Prot. 20 (9), 801–812. doi: 10.1016/S0261-2194(01)00112-0
Holland J. M., Perry J. N., Winder L. (1999). The within-field spatial and temporal distribution of arthropods in winter wheat. Bull. Entomol Res. 89 (6), 499–513. doi: 10.1017/S0007485399000656
Jennings D. L. (1994). Breeding for resistance to African cassava mosaic virus in East Africa. Trop. Sci. 34, 110–122.
Jones D. R. (2003). Plant viruses transmitted by whiteflies. Eur. J. Plant Pathol. 109, 195–219. doi: 10.1023/A:1022846630513
Kavalappara S. R., Milner H., Sparks A., McGregor C., Wintermantel W. M., Bag S. (2021). First report of cucurbit chlorotic yellows virus in association with other whitefly-transmitted viruses in yellow squash (Cucurbita pepo) in Georgia, U.S.A. Plant Dis. 105 (6), 1862. doi: 10.1094/PDIS-11-20-2429-PDN
Kuo Y.-W., Rojas M. R., Gilbertson R. L., Wintermantel W. M. (2007). First report of cucurbit yellow stunting disorder virus in California and Arizona, in association with cucurbit leaf crumple virus and squash leaf curl virus. Plant Dis. 91, 330. doi: 10.1094/PDIS-91-3-0330B
Lambert S. J., Hay F. S., Pethybridge S. J., Wilson C. R. (2007). Spatiotemporal spread of potato virus s and potato virus X in seed potato in Tasmania, Australia. Plant Health Prog. 8 (1), 70. doi: 10.1094/PHP-2007-0726-07-RS
Lapidot M., Legg J. P., Wintermantel W. M., Polston. J. E. (2014). “Chapter three - management of whitefly-transmitted viruses in open-field production systems,” in Adv. virus res. Eds. Gad L., Nikolaos K. (Academic Press, USA), 147–206.
Legarrea S., Barman A., Marchant W., Diffie S., Srinivasan R. (2015). Temporal effects of a begomovirus infection and host plant resistance on the preference and development of an insect vector, bemisia tabaci, and implications for epidemics. PloS One 10 (11), e0142114. doi: 10.1371/journal.pone.0142114
Li B. H., Madden L. V., Xu. X. M. (2012). Spatial analysis by distance indices: an alternative local clustering index for studying spatial patterns. Methods Ecol. Evol. 3, 368–377. doi: 10.1111/j.2041-210X.2011.00165.x
Little E., Brannen P., Brock J., Dutta B., Jagdale G., Jogi A., et al. (2019). 2017 Georgia plant disease loss estimates (UGA Cooperative Extension Annual Publication, USA), 102–110. Available at: https://extension.uga.edu/publications/detail.html?number=AP102-10.
Liu B., Preisser E. L., Chu D., Pan H., Xie W., Wang S., et al. (2013). Multiple forms of vector manipulation by a plant-infecting virus: Bemisia tabaci and tomato yellow leaf curl virus. J. Virol. 87, 4929–4937. doi: 10.1128/JVI.03571-12
Liu T. X., Stansly P. A. (1995). Oviposition by bemisia argentifolii (Homoptera: Aleyrodidae) on tomato: effects of leaf factors and insecticide residues. J. Econ. Entomol. 88 (4), 992–997. doi: 10.1093/jee/88.4.992
Madden L. V., Hughes G., Van Den Bosch F. (2007). The study of plant disease epidemics. Am. Phytopathol. Soc. Pp, 68–83.
Madden L. V., Louie R., Abt J. J., Knoke. J. K. (1982). Evaluation of tests for randomness of infected plants. Phytopathology 72, 195–198. doi: 10.1094/Phyto-72-195
Mansaray A., Sundufu A. J. (2009). Oviposition, development and survivorship of the sweetpotato whitefly bemisia tabaci on soybean, glycine max, and the garden bean, phaseolus vulgaris. J. Insect Sci. (Online) 9, 1. doi: 10.1673/031.009.0101
Maynard D. N., Cantliffe D. J. (1990). “Squash silverleaf and tomato ripening: new vegetable disorders in Florida,” in Vegetable crops fact sheet VC-37 (University of Florida: IFAS).
McCollum T., Stoffella P., Powell C., Cantliffe D., Hanif-Khan S. (2004). Effects of silverleaf whitefly feeding on tomato fruit ripening. Postharvest Biol. Technol. 31, 183–190. doi: 10.1016/j.postharvbio.2003.09.001
Morsello S. C., Beaudoin A. L. P., Groves R. L., Nault B. A., Kennedy G. G. (2010). The influence of temperature and precipitation on spring dispersal of frankliniella fusca changes as the season progresses. Entomol. Exp. Appl., 134–260.doi: 10.1111/j.1570-7458.2009.00959.x
Naranjo S. E., Flint H. M., Henneberry T. J. (1995). Comparative analysis of selected sampling methods for adult bemisia tabaci (Homoptera: Aleyrodidae) in cotton. J. Econ. Entomol. 88 (6), 1666–1678. doi: 10.1093/jee/88.6.1666
Navas-Castillo J., Fiallo-Olivé E., Sánchez-Campos S. (2011). Emerging virus diseases transmitted by whiteflies. Annu. Rev. Phytopathol. 49, 219–248. doi: 10.1146/annurev-phyto-072910-095235
Nguyen H. D. D., Nansen C. (2018). Edge-biased distributions of insects. A Rev. Agron. Sustain. Dev. 38, 11. doi: 10.1007/s13593-018-0488-4
Nyoike T. W., Liburd O. E., Webb S. E. (2008). Suppression of whiteflies, bemisia tabaci (Hemiptera: Aleyrodidae) and incidence of cucurbit leaf crumple virus, a whitefly-transmitted virus of zucchini squash new to Florida, with mulches and imidacloprid. Florida Entomol. 91 (3), 460–465. doi: 10.1653/0015-4040(2008)91[460:SOWBTH]2.0.CO;2
Palumbo J. C., Tonhasca A. Jr., Byrne D. N. (1995). Evaluation of three sampling methods for estimating adult sweet potato whitefly (Homoptera: Aleyrodidae) abundance on cantaloupes. J. Econ. Entomol. 88 (5), 1393–1400. doi: 10.1093/jee/88.5.1393
Panizzi A. R., Galileo M. H. M., Gastal H. A. O., Toledo J. F. F., Wild C. H. (1980). Dispersal of nezara viridula and piezodorus guildinii nymphs in soybeans. Environ. Entomol. 9, 293–297. doi: 10.1093/ee/9.3.293
Perry J. N. (1998). Measures of spatial pattern for counts. Ecology 79, 1008–1017. doi: 10.1890/0012-9658(1998)079[1008:MOSPFC]2.0.CO;2
Polston J. E., Anderson P. L. (1997). The emergence of whitefly transmitted geminiviruses in tomato in the Western hemisphere. Plant Dis. 81, 1358–1369. doi: 10.1094/PDIS.1997.81.12.1358
Polston J. E., McGovern R. J., Brown L. G. (1999). Introduction of tomato yellow leaf curl virus in Florida and implications for the spread of this and other geminiviruses of tomato. Plant Dis. 83 (11), 984–988.
Powell D. A., Bellows T. S. Jr. (1992). Adult longevity, fertility, and population growth rates for bemisia tabaci (Genn.) (Hom., aleyrodidae) on two host plant species. J. Appl. Entomol. 113 (1-5), 68–78. doi: 10.1111/j.1439-0418.1992.tb00637.x
Power A. G. (1992). Host plant dispersion, leafhopper movement and disease transmission. Ecol. Entomol. 17 (1), 63–68. doi: 10.1111/j.1365-2311.1992.tb01040.x
R Core Team (2020). “R: A language and environment for statistical computing,” in R foundation for statistical computing(Vienna, Austria). Available at: https://www.R-project.org/.
Reich R., Lundquist J., Bravo V. (2013). Characterizing spatial distributions of insect pests across alaskan forested landscape: A case study using aspen leaf miner (Phyllocnistis populiella chambers). J. Sustain. For. 32 (6), 527–548. doi: 10.1080/10549811.2013.779198
Sarkar D. (2007). latticeExtra: Extra graphical utilities based on lattice. r package version 0.3-1.
Severtson D., Flower K., Nansen C. (2015). Nonrandom distribution of cabbage aphids (Hemiptera: Aphididae) in dryland canola (Brassicales: Brassicaceae). Environ. Entomol. 44 (3), 767–779. doi: 10.1093/ee/nvv021
Soumia P. S., Guru Pirasanna Pandi G., Krishna R., Ansari W. A., Ansari W. A., Jaiswal D. K., et al. (2021). “Whitefly-transmitted plant viruses and their management,” in Emerging trends in plant pathology. Eds. Singh K. P., Jahagirdar S., Sarma B. K. (Singapore: Springer). doi: 10.1007/978-981-15-6275-4_8
Sütterlin S. (2000). Biological control of whitefly on gerbera: success or failure?: tritrophic interactions between gerbera jamesonii, trialeurodes vaporariorum and encarsia formosa. Wagen. Univ. Res 52–54.
Thomas C. F. G., Parkinson L., Griffiths G. J. K., Garcia A. F., Marshall E. J. P. (2001). Aggregation and temporal stability of carabid beetle distributions in field and hedgerow habitats. J. Appl. Ecol. 38, 100–116. doi: 10.1046/j.1365-2664.2001.00574.x
Tillman P., Cottrell T., Mizell R., Kramer E. (2014). Effect of field edges on dispersal and distribution of colonizing stink bugs across farmscapes of the southeast USA. Bull. Entomol Res. 104 (1), 56–64. doi: 10.1017/S0007485313000497
Tillman P. G., Northfield T. D., Mizell R. F., Riddle T. C. (2009). Spatiotemporal patterns and dispersal of stink bugs (Heteroptera: Pentatomidae) in peanut-cotton farmscapes. Environ. Entomol. 38 (4), 1038–1052. doi: 10.1603/022.038.0411
Turchin P. (1989). Population consequences of aggregative movement. J. Anim. Ecol. 58, 75–100. doi: 10.2307/4987
Turechek W. W., Madden L. V. (1999). Spatial pattern analysis of strawberry leaf blight in perennial production systems. Phytopathology 89 (5), 421–433. doi: 10.1094/PHYTO-01-10-0018
Turechek W. W., Kousik C. S., Adkins S. (2010). Distribution of four viruses in single and mixed infections within infected watermelon plants in Florida. Phytopathology 100, 1194–1203. doi: 10.1094/PHYTO-01-10-0018
Turechek W. W., Roberts P. D., Stansly P. A., Webster C. G., Kousik C. S., Adkins S. (2014). Spatial and temporal analysis of squash vein yellowing virus infections in watermelon. Plant Dis. 98, 1671–1680. doi: 10.1094/PDIS-10-13-1094-RE
Tzanetakis I. E., Martin R. R., Wintermantel W. M. (2013). Epidemiology of criniviruses: an emerging problem in world agriculture. Front. Microbiol. 4. doi: 10.3389/fmicb.2013.00119
Vidavski F., Czosnek H., Gazit S., Levy D., Lapidot M. (2008). Pyramiding of genes conferring resistance to tomato yellow leaf curl virus from different wild tomato species. Plant Breed. 127 (6), 625–631. doi: 10.1111/j.1439-0523.2008.01556.x
Vinatier F., Tixier P., Duyck P. F., Lescourret F. (2011). Factors and mechanisms explaining spatial heterogeneity: a review of methods for insect populations. Methods Ecol. Evol. 2 (1), 11–22. doi: 10.1111/j.2041-210X.2010.00059.x
Wang S., Guo H., Ge F., Sun Y. (2020). Apoptotic neurodegeneration in whitefly promotes the spread of TYLCV. Elife 9, e56168.
Webb S. E., Liburd O. E., Nyoike T. W., Akad F., Polston. J. E. (2007). Whitefly-transmitted cucurbit leaf crumple virus in Florida.UF IFAS extension. ENY- 477. doi: 10.32473/edis-in716-2007
Winder L., Alexander C., Griffiths G., Holland J., Woolley C., Perry J. (2019). Twenty years and counting with SADIE: Spatial analysis by distance indices software and review of its adoption and use. Rethinking Ecol. 4, 1–16. doi: 10.3897/rethinkingecology.4.30890
Winder L., Perry J. N., Holland J. M. (1999). The spatial and temporal distribution of the grain aphid sitobion avenae in winter wheat. Entomol. Exp. Appl. 93 (3), 275–288. doi: 10.1046/j.1570-7458.1999.00588.x
Keywords: Bemesia, whitefly-transmitted virus, Begomovirus disease complex, squash, disease distribution, insect transmitted viruses
Citation: Codod CB, Severns PM, Sparks AN, Srinivasan R, Kemerait RC Jr. and Dutta B (2022) Characterization of the spatial distribution of the whitefly-transmitted virus complex in yellow squash fields in Southern Georgia, USA. Front. Agron. 4:930388. doi: 10.3389/fagro.2022.930388
Received: 27 April 2022; Accepted: 08 August 2022;
Published: 30 August 2022.
Edited by:
Jonathan Spencer West, Rothamsted Research, United KingdomReviewed by:
Xiangming Xu, National Institute of Agricultural Botany (NIAB), United KingdomVinay Kumar, Central University of Punjab, India
Copyright © 2022 Codod, Severns, Sparks, Srinivasan, Kemerait and Dutta. This is an open-access article distributed under the terms of the Creative Commons Attribution License (CC BY). The use, distribution or reproduction in other forums is permitted, provided the original author(s) and the copyright owner(s) are credited and that the original publication in this journal is cited, in accordance with accepted academic practice. No use, distribution or reproduction is permitted which does not comply with these terms.
*Correspondence: Bhabesh Dutta, YmhhYmVzaEB1Z2EuZWR1