 Jared Stoochnoff
 Melissa Johnston
 Jennifer Hoogenboom
 Thomas Graham
 Mike Dixon
95% of researchers rate our articles as excellent or good
Learn more about the work of our research integrity team to safeguard the quality of each article we publish.
Find out more
ORIGINAL RESEARCH article
Front. Agron. , 28 July 2022
Sec. Climate-Smart Agronomy
Volume 4 - 2022 | https://doi.org/10.3389/fagro.2022.905286
Now that multi-tiered plant factories with artificial lighting (PFALs) have demonstrated sufficient proof of concept for leafy green and microgreen production; the next challenge is to determine the optimal environment conditions and horticultural management practices required to produce nutrient-dense plant-based protein (PBP) crops within these advanced controlled environment systems (CES). Sole-source lighting within PFALs is energetically and economically expensive, as such, optimizing light distribution through intracanopy lighting could be a key factor in expanding the number of crops compatible with PFAL production. An ideal PBP PFAL crop will have a compact morphology (height, area, volume), be compatible with low-light environments, be self-pollinating, and have a relatively short life cycle. The objectives of this study were to 1) evaluate a selection of green bush bean cultivars (Phaseolus spp.) within a CES to determine which currently available cultivar is most compatible with PFAL production and 2) determine if the addition of intracanopy LED lighting could further improve cultivar compatibility with PFAL systems. The bush bean cultivar “Bronco” was selected after a 40-day flowering and 60-day fruiting trial for its compact morphology and yield (count, fresh weight). Intracanopy LED lighting trials on “Bronco” demonstrated a reduced shoot height (16%), increased bean count (22%), and increased fresh bean weight (17%) relative to plants produced with overhead lighting alone. While intracanopy lighting improved green bush bean compatibility with PFAL production, the additional light applied within the canopy increased the cost of production.
Multi-tiered controlled environment plant factories with electric lighting, colloquially known as “vertical farms”, are emerging as a sustainable production strategy for some fresh vegetable crops (Benke & Tomkins, 2017). Today, most commercial vertical farms focus on leafy greens, including microgreens, the tender sprouts of typical salad crops, and baby greens, the young but physiologically mature leaves of typical salad crops, due to the short production cycles and compact morphology (height, area, volume) (Kozai & Niu, 2020). While these crops are rich in vitamins and antioxidants (Turner et al., 2020), they are not consumed in large enough quantities to contribute significantly to a typical human diet. For vertical farming to realize its full potential for improving agricultural resiliency, the crop offerings from this emerging industry need to be significantly diversified.
Select green bush bean (Phaseolus vulgaris) varieties may lend themselves to high-density plant production within the vertical farm production framework. Green beans are nutrient-dense (fiber, protein, vitamins), self-pollinating, and easily accommodated by current hydroponic production practices (Papanikolaou & Fulgoni, 2008). Although conceptually compatible with vertical farm production, there is a paucity of data regarding production in CEA systems. Preliminary work on bush beans at the Controlled Environment Systems Research Facility (CESRF, University of Guelph, Canada) has determined that the environmental conditions and horticultural management strategies required for bush bean production are similar to leafy greens during the early stages of development. There is minimal competition between plants as nutrient solutions are delivered hydroponically, the aerial environment (temperature, vapour pressure deficit, and [CO2]) can be managed efficiently with an appropriate heating, ventilation, and air conditioning (HVAC) system, and lighting provided by fluorescent tubes or light-emitting diodes (LED) can keep the majority of photosynthetic tissue active. The challenge of bush bean production within a vertical farm system emerges around the third week (D21) of their [typical] eight-week (D50-D55) maturation cycle as they begin to grow taller and create a dense planophile canopy.
Leaf overlap within a dense canopy creates a competitive environment between neighbouring plants for light interception. Even at low planting densities, leaf overlap is unavoidable in beans as the planophile architecture naturally promotes self-shading (Frantz et al., 2000). Shaded leaves receive a lower total photosynthetic photon flux density (PPFD), a modified light spectrum that contains a higher percentage of green photons (500-600 nm), and a low red:far-red ratio relative to leaves receiving unattenuated light (Folta & Maruhnich, 2007). A low red: far-red ratio will influence the phytochrome photostationary, thereby inducing shade avoidance responses that include stem, leaf, and petiole elongation, increased apical dominance and early flowering with reduced fruit set (Ruberti et al., 2012). While the shade avoidance response may benefit survival under field conditions, it is undesirable when one is looking to optimize volume use efficiency (VUE) in a vertical farm (Goto, 2012). One potential method of mitigating this morphological development in response to shading is the use of intracanopy lighting.
The compact physical form and comparatively low operating temperature of LED light fixtures allow for placement within the canopy. This intracanopy placement helps homogenize the overall light environment by delivering an unattenuated spectrum directly to lower leaves that would otherwise be shaded within the canopy (Massa et al., 2008). Intracanopy lighting can provide a light environment within the canopy that supports continued photosynthesis and thereby slows or avoids leaf senescence and shade response morphological development (Frantz et al., 2000; Pettersen et al., 2010). Specifically, intracanopy LED lighting can be used to modify the light intensity and light spectrum in terms of blue (400-500 nm), green (500-600 mm), and red (600-700 nm) while having minimal influence on canopy temperature. A recent intracanopy lighting trial on basil and parsley determined that the addition of light within the canopy reduced plant height compared to sole source high-pressure sodium lights directly overhead (Litvin et al., 2020). These results were attributed primarily to the increased blue light within the supplemental light spectrum (Litvin et al., 2020). An intracanopy lighting trial on soybean, which has a similar architecture to bush bean, demonstrated that increasing the amount of intracanopy light resulted in more compact plant architecture and increased the amount of fruit produced compared to plants grown with overhead lighting alone (Stasiak et al., 1999). Intracanopy lighting experiments conducted on greenhouse vine crops (tomato, cucumber, and pepper) have increased fruit production compared to overhead lighting alone (Pettersen et al., 2010; Gómez & Mitchell, 2016; Shang et al., 2018). The increase in fruit production was typically attributed to an increased photosynthetic performance by leaves lower in the canopy that are usually shaded and thereby less productive.
Nevertheless, the opportunity to more effectively deliver PPFD to typically shaded lower canopy leaves may disproportionately enhance productivity compared to increasing the overhead delivery of light by the same amount, especially in a dense canopy. The experiments presented were designed to 1) evaluate a selection of green bush bean cultivars and choose one which is most suitable for vertical farming, and 2) determine if the addition of intracanopy lighting can be used to improve the morphology and yield of the selected cultivar. It was hypothesized that one may have morphology more conducive to stacked production and that additional light within the canopy would reduce bush bean height and increase production.
The environment conditions of all three plant growth trials within the walk-in growth chamber were monitored and maintained through Argus Control Systems Ltd. (Argus, Surrey, BC) software. The temperature was 23 ± 0.1°C during the photoperiod (08:00 – 23:59) and 20 ± 0.1°C during the dark period (00:00 – 07:59) in the growth room. The relative humidity was 48 ± 9.5%, and vapour pressure deficit was 1.4 ± 0.3 kPa. The average ambient carbon dioxide concentration within the growth room was 440 ± 30 ppm. This slightly higher than ambient carbon dioxide concentration was due to students and staff often working in the growth room while the trial was taking place. While the slight increase in ambient CO2 may have slightly influenced plant growth rates, it was assumed any benefit was uniform across all cultivars grown or treatments performed.
Irrigation was standardized for all three trials. All plants were fertigated once a week with 500 mL of a ½ strength 100 L solution containing 23 g of Plant-Prod Hydroponic 6:11:31 (N-NO3: 0.985 mM, P: 0.356 mM, K: 1.645 mM, S: 0.985 Ca: 0, Mg: 0.303 mM, Fe: 0.012 mM, Cu: 0.144 µM, Zn: 0.704 µM, B: 0.216 µM, Mn: 2.512 µM, Mo: 0.216 µM)(Master Plant-Prod Inc., Brampton, ON, Canada) and 17 g of 15:0:0 calcium nitrate (N-NO3: 1.76 mM, N-NH4: 0.133 mM, Ca: 0.806 mM) (Plant Products, Leamington, ON, Canada). The electrical conductivity (EC) of this solution was ~1200 μs/cm, and the pH was adjusted to 5.8 – 6.0 with 0.5 M potassium hydroxide or 0.5 M nitric acid as required. The fertigation solution was increased to a full-strength mixture (EC ~2400 μs/cm) on week five, and this application concentration was continued through to the final harvest. Bamboo stakes were installed in each pot by week three (D21) to provide additional support.
The first phase of the cultivar selection, referred to as the flowering stage trial, was conducted within a walk-in growth chamber (Constant Temperature Control Limited, Aurora, Ontario) at the University of Guelph, Ontario. All plants were grown and monitored for 40 days before being destructively harvested. The chamber bench (2.5 m by 1.2 m) was able to accommodate 108 pots (17.5 cm diameter, 2.5 L) arranged in an array of 18 columns by six rows (Figure 1). The interior plants (64) were the experimental units, with the perimeter (44) plants being used to eliminate edge effects (not included in the analysis). Seeds for each of the four bush bean cultivars being tested, “Bush Blue Lake 247”, “Bronco”, “Provider”, and “Strike”, were each procured from Stokes Seeds (Thorold, ON). Each interior pot was randomly assigned one of the four cultivars (n=16) in a completely randomized design (CRD). Pots were filled with Sun Gro Horticulture’s (Agawam, USA) Professional Growing Mix #4. Two seeds were sown near each pot’s centre, approximately 5 cm apart from each other at a depth of 2.5 cm, following recommended planting instructions. Seedlings were thinned to a single plant per pot after seven days.
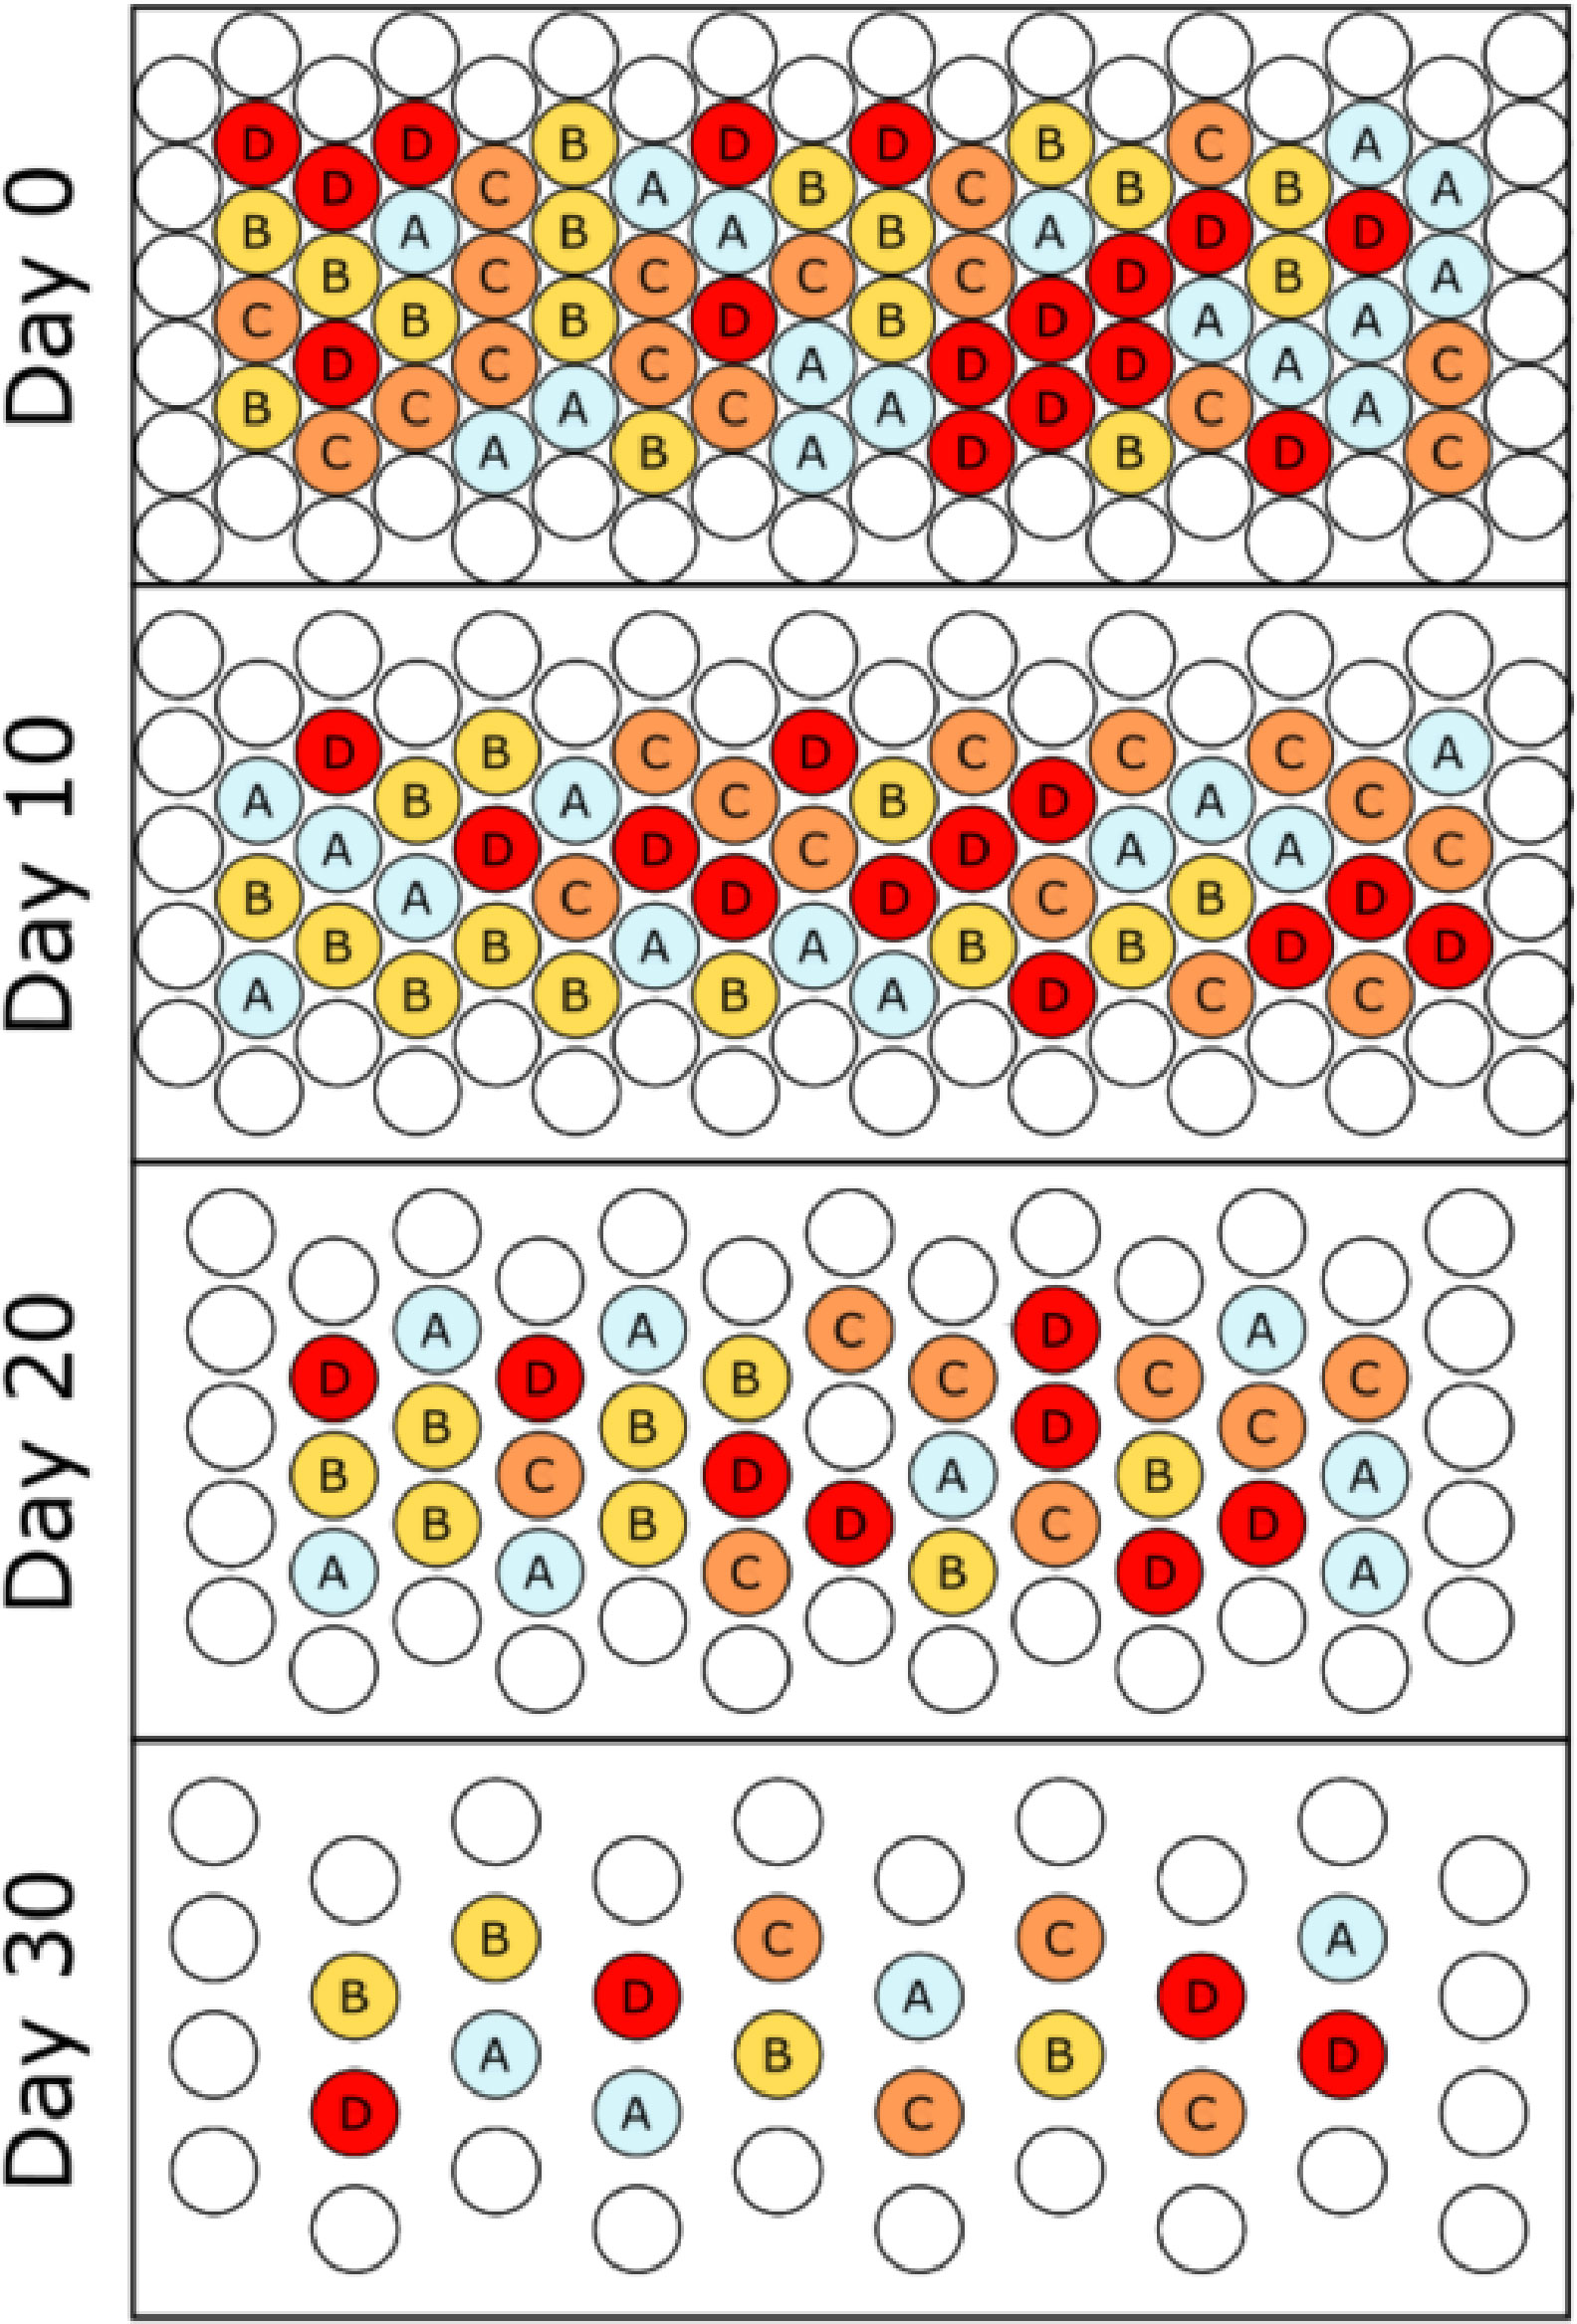
Figure 1 Overhead schematic of the cultivar selection flowering stage trial. Four individuals of each cultivar were randomly selected and destructively sampled at each ten-day interval, and the remaining plants were re-randomized/positioned on the bench. The final harvest (not pictured) was conducted on Day 40. Letters refer to green bush bean cultivars A – “Bush Blue Lake”, B - “Bronco”, C - “Provider” and D – “Strike”.
At every five-day interval, plant heights and widths were measured to compare the growth progression of each cultivar. Height was measured from the rim of the pot to the apical meristem to mitigate the influence of media contraction or displacement near the stem base from frequent irrigation. Widths were measured with a one-meter ruler (Canadian Tire Mastercraft, Guelph, Ontario) held perpendicular directly above the plant in the north-south (width1) and east-west (width2) directions. The area occupied by the plant on a horizontal plane was calculated by multiplying plant width1 by width2. Plant volume was calculated by multiplying plant area by plant height.
At every ten-day interval, four plants of each cultivar were randomly selected and destructively sampled. Plants were divided into leaf, stem, and bean (fruit) tissue. Any beans produced were further subdivided into “mature” (≥ 2.0 g) or “immature” (< 2.0 g) based on a subjective assessment of what was considered marketable fruit (Figure 2). The fresh mass of the leaf tissue, stem tissue, mature and immature beans were recorded, as were the number of mature and immature beans. Leaf area was measured with an LI-3100 Area Meter (LI-COR Biosciences, Lincoln, USA). Harvested plant tissue was placed into individually labelled paper bags (Crown Kraft Grocery Bags, Toronto, Canada) and placed in a drying room at 65-70°C for 60 days before final dry mass measurements were made. The position of the remaining pots was re-randomized after each destructive harvest to mitigate differences in light intensities across the bench and to fill holes left in the pot array. Once anthesis was reached, the number of flowers on each plant was counted daily to characterize differences between cultivars. The number of fully expanded flowers observed on that day was the flower count, so they were counted a second time if they persisted for longer than a single day.
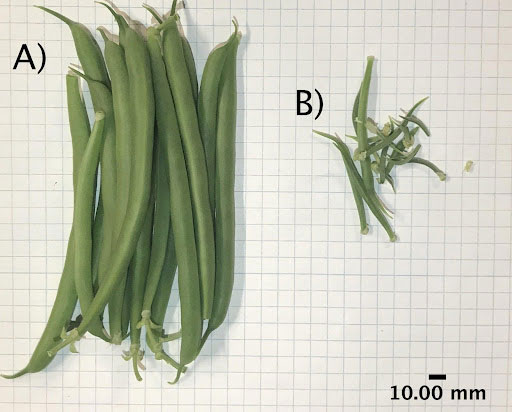
Figure 2 Green beans produced during the flowering, fruiting, and intracanopy trials were weighed individually and categorized as either (A) mature (≥ 2.0 g) or (B) immature (< 2.0 g).
The second phase of cultivar selection, now referred to as the fruiting stage trial, was conducted in the same walk-in growth chamber and shared the same planting and thinning methodology, as previously described. All plants were grown and monitored for 60 days before being destructively harvested. Results from the flowering trial prompted the removal of the “Bush Blue Lake” cultivar leaving “Bronco”, “Provider”, and “Strike” as potential PBP candidates. With one cultivar removed, this trial required 84 pots arranged in an array of 14 columns by six rows (Figure 3). The interior pots (48) of the array were considered experimental units, and the external perimeter of pots (36) was considered guard row. The purpose of the guard row perimeter was to prevent potential edge effects from influencing plant growth and development. The interior pots were randomly assigned to one of the three remaining cultivars (n=16) “Bronco”, “Provider”, and “Strike”. The same protocols detailed above were used for non-destructive measurements, harvest, and randomization. The only notable difference between the flowering and fruiting trials was the duration of growth and increase in the destructive harvest interval from every ten days to every fifteen days.
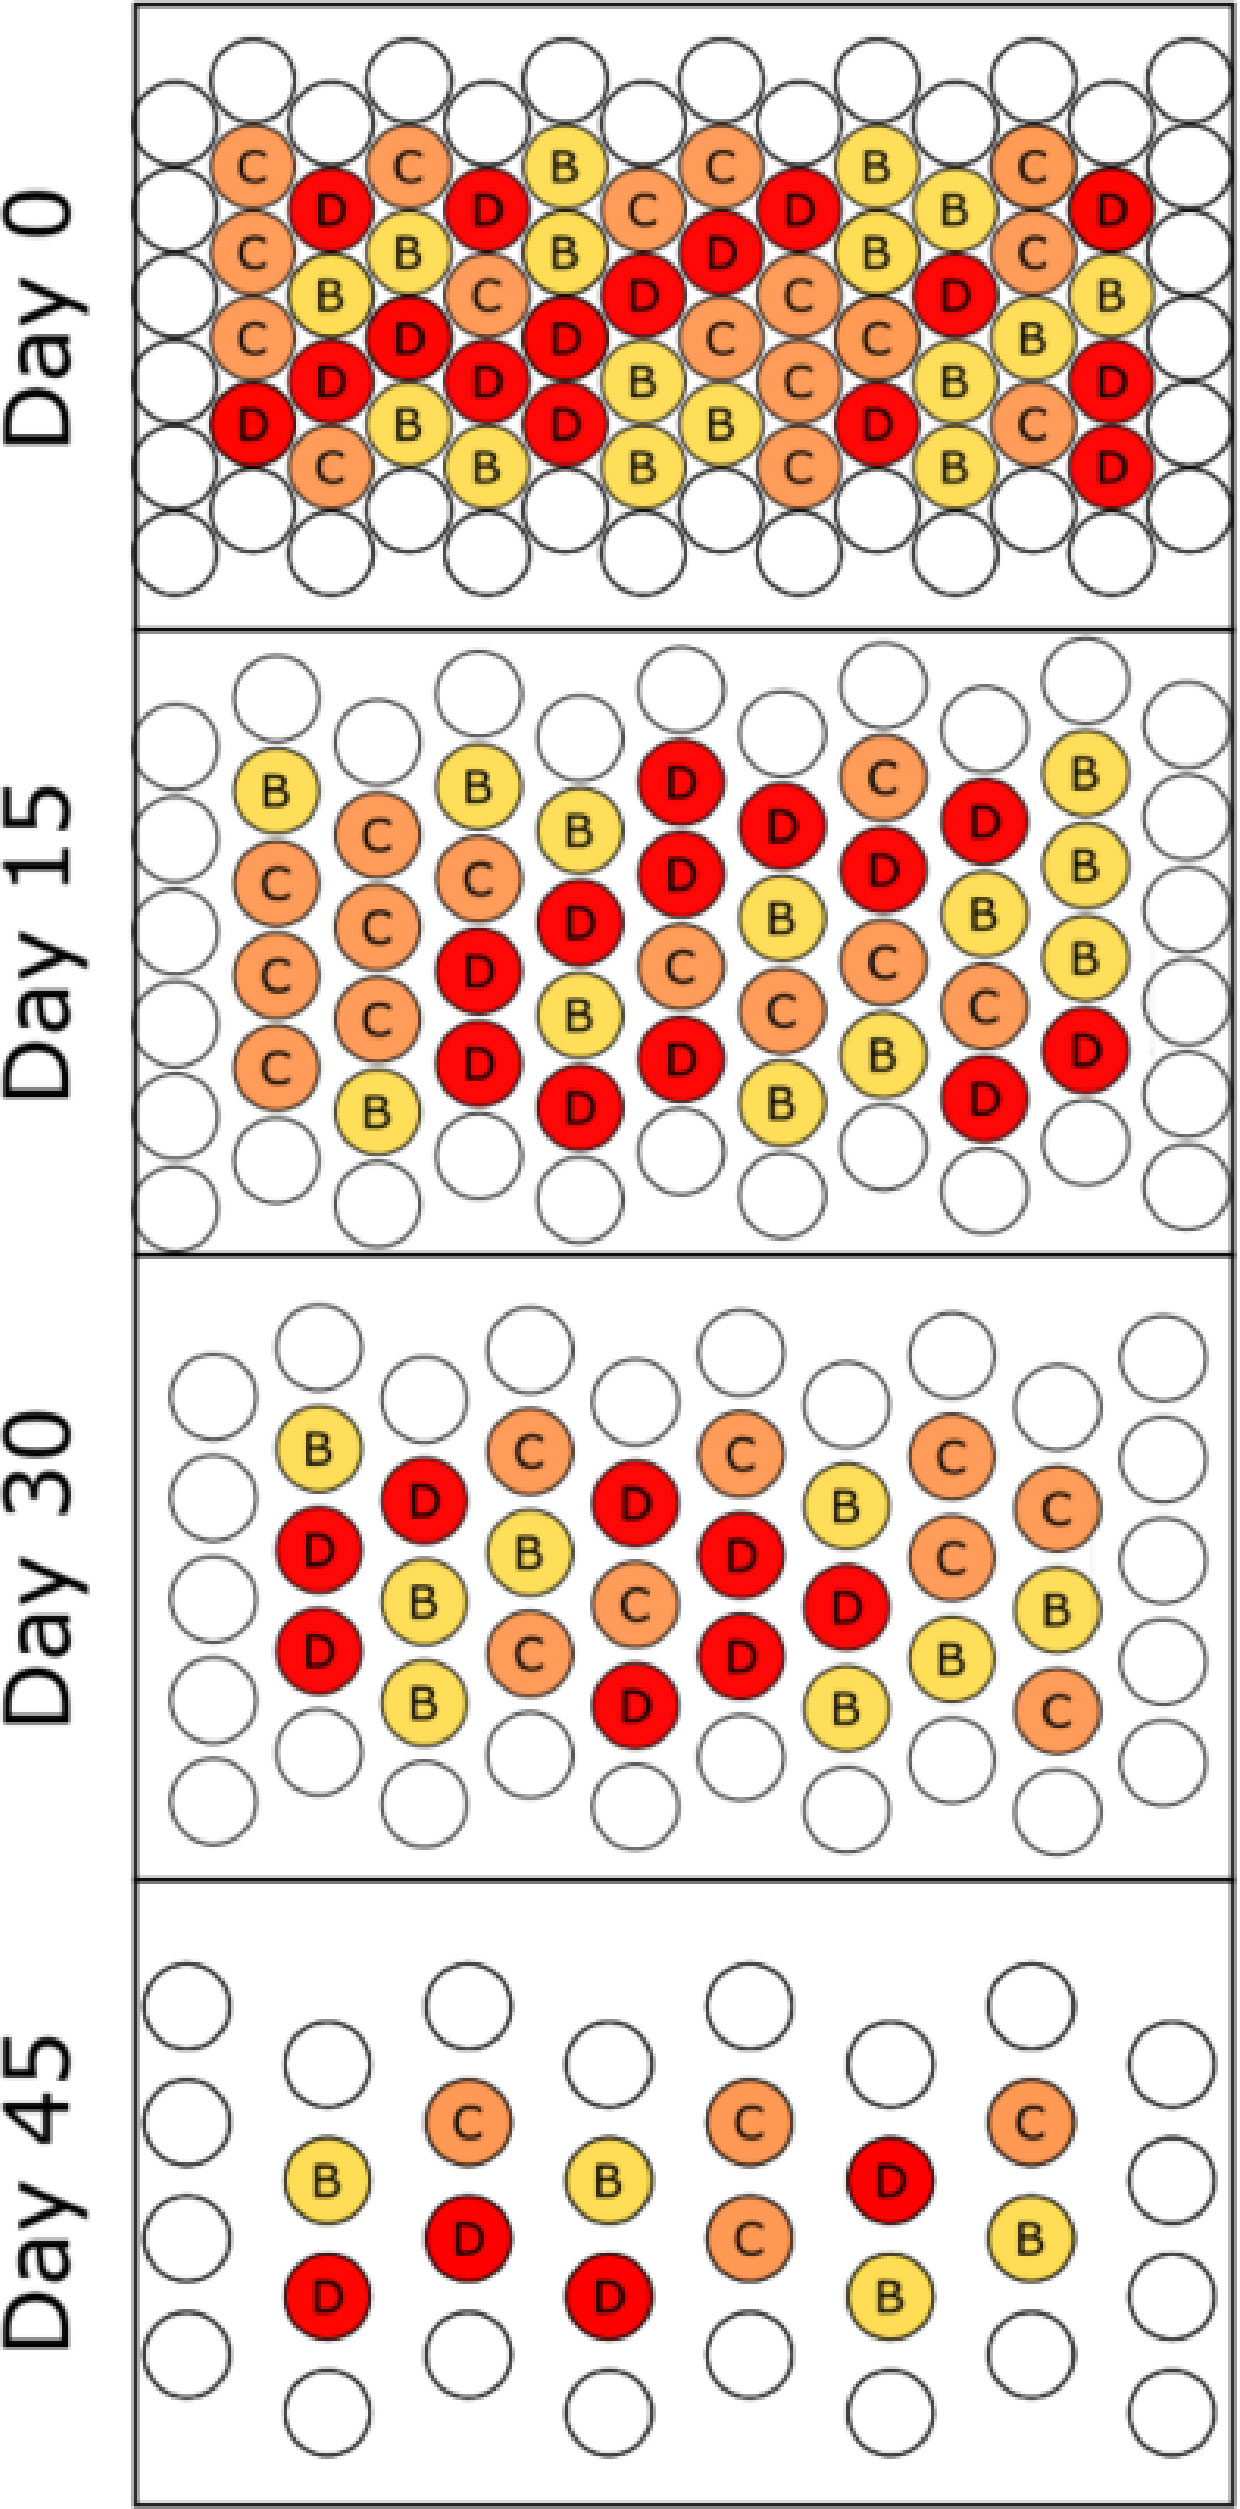
Figure 3 Overhead schematic of the cultivar selection fruiting stage trial. Four individuals of each cultivar were randomly selected and destructively sampled at each fifteen-day interval, and the remaining plants were re-randomized/positioned on the bench. The final harvest was on day 60. Letters refer to specific bush bean cultivars B - “Bronco”, C - “Provider” and D – “Strike”.
Overhead lighting for flowering and fruiting stage trials was provided by F96T12/CW/VHO (cool white, high output, 4100 K) fluorescent lamps (Sylvania, Mississauga, Canada). A Li-Cor L1-189 quantum sensor (LI-COR Biosciences, Lincoln, NE) was used to measure the photosynthetic photon flux density (PPFD) (μmoles·m-2·s-1) of light within the range of photosynthetically active radiation (PAR) (400-700 nm) at the location of each pot before planting. The fluorescent light spectrum was 18.5% blue (400-500 nm), 54.3% green (501-600 nm), and 27.2% red (601-700 nm). The average PPFD over the pot array for the flowering and fruiting trial was 346 ± 6.9 and 329 ± 6.9 μmoles·m-2·s-1 respectively. The difference in average PPFD was attributed to a single burnt-out fluorescent tube between trials and slightly modified measurement positions due to spacing differences between the flowering and fruiting trials. Regardless, this slight difference was not considered to confound our results as the two trials were not directly compared to each other.
A single bush bean cultivar, “Bronco”, was selected for this trial based on the results of the flowering and fruiting trials. Fifty pots (0.23 m diameter, 5.6 L) were arranged in an array of ten columns by five rows. Pot size was increased in this trial to maximize benchtop usage and minimize any gaps between pots. The bench was divided in half, creating two groups of 25 pots that were assigned to either treatment or control (Figure 4). The interior plants on both sides (9) were considered experimental units, and the perimeter plants were considered guard rows (16). All plants were grown and monitored for 50 days before being destructively harvested following procedures previously described. The experiment was replicated four times, and the treatment position on the bench was reversed each time to account for variation due to bench location.
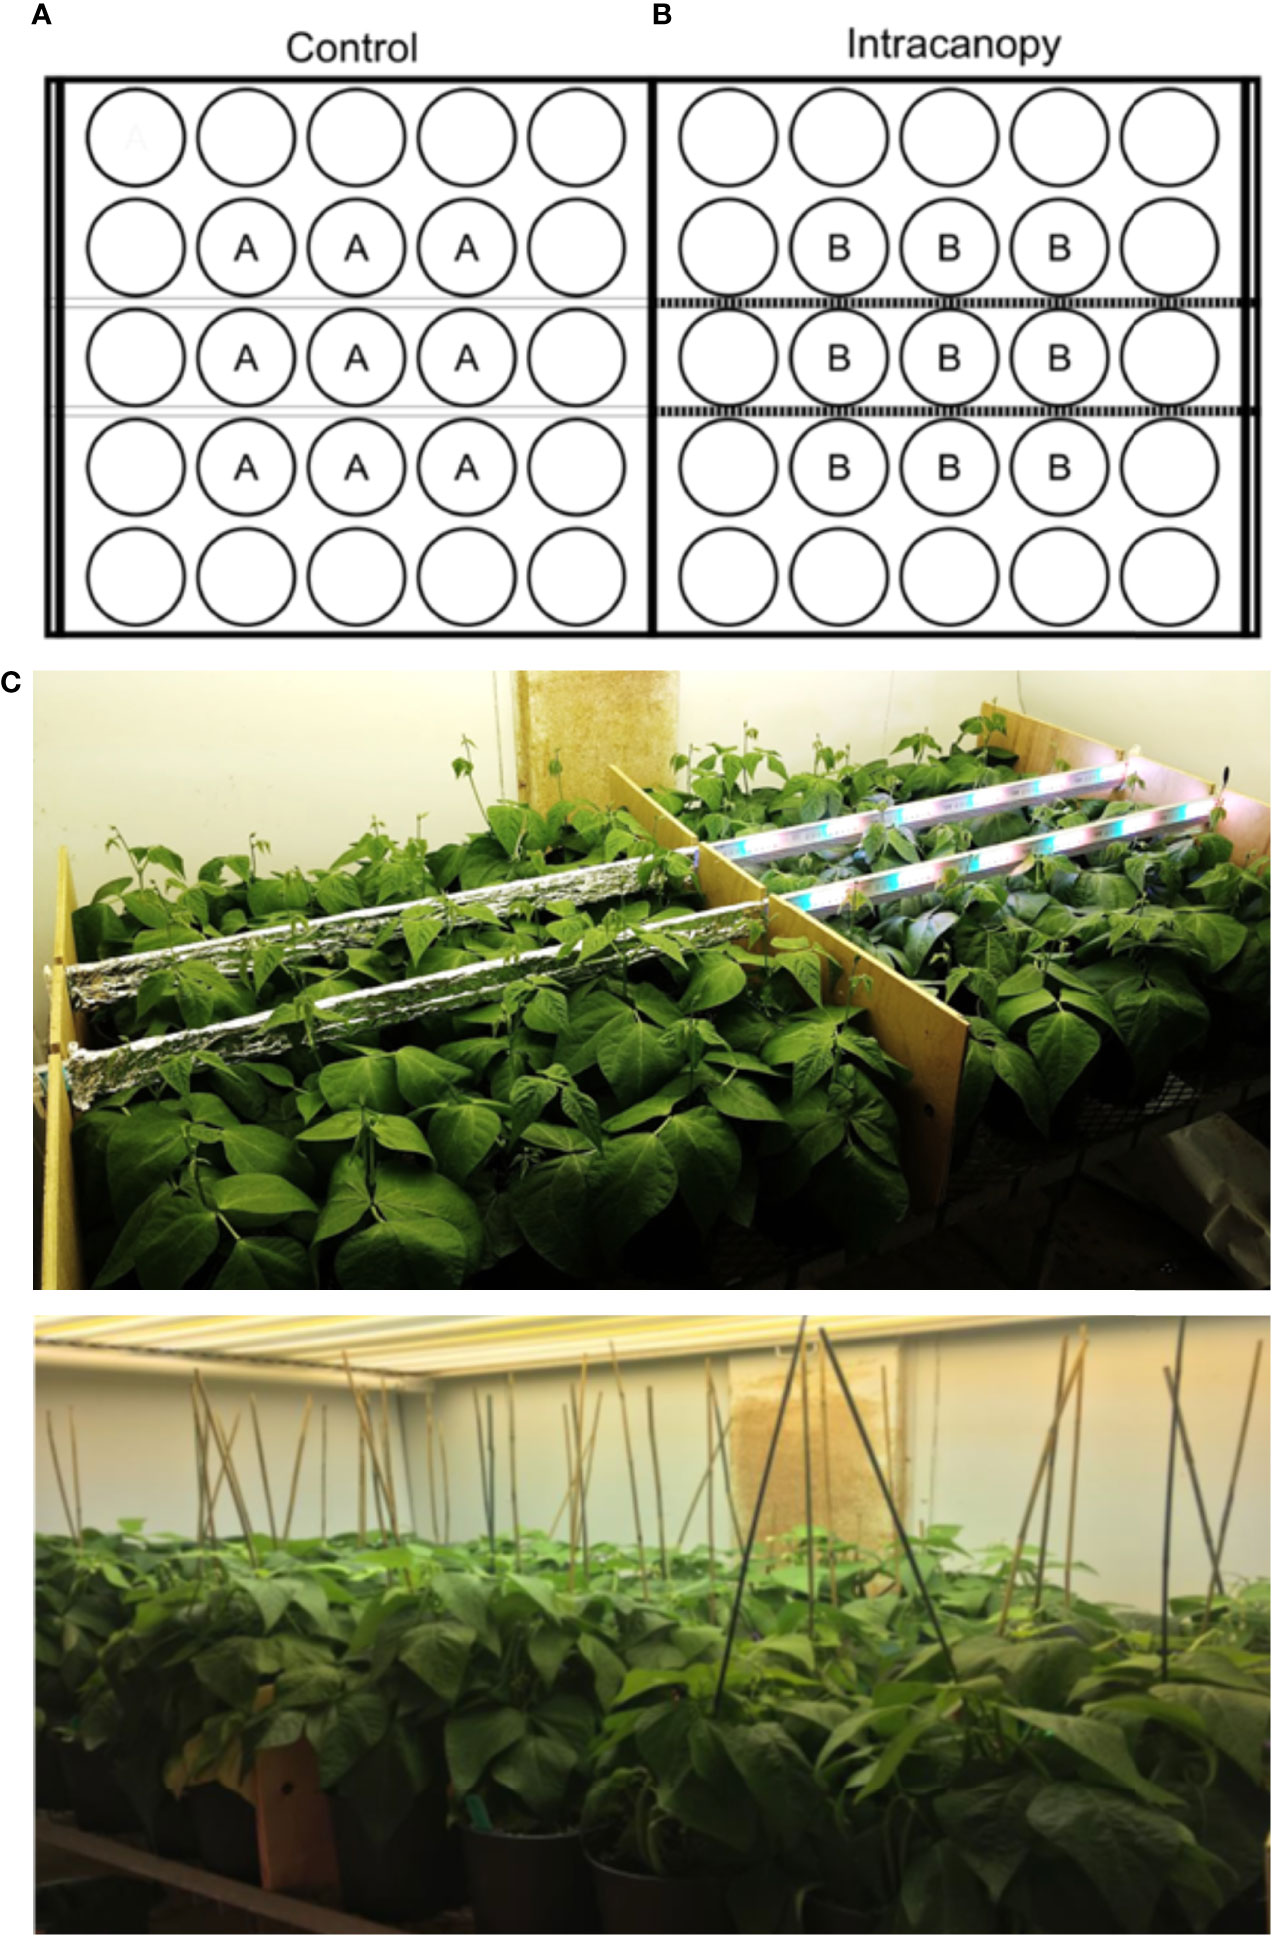
Figure 4 (A) Planting schematic of the intracanopy trial. Letters represent experimental unit positions of the (A) control and (B) intracanopy lighting treatment. Empty circles represent guard row plants. This design was replicated four times, reversing the position of the treatments on the bench after each repetition. Photos depict the intracanopy trial setup on D21 (Mid), days before the plant canopy enclosed on the LED light blades (Bottom) and (B) photo of the intracanopy trial setup on D21, days before (C) the plant canopy enclosed on the LED light blades.
The intracanopy lighting trial was conducted in the same location as the previous two cultivar trials, with the same environment setpoints, planting, and horticultural management practices. In addition to the overhead fluorescent lighting previously described for the cultivar selection trials, additional intracanopy lighting was provided by two “2X dual-sided Spectra Lamps- Spectra F” provided by Intravision Group (AS, Oslo, Norway). The intracanopy light fixtures spanned the entire length of the bench, so the control side of the arrays was wrapped with aluminium foil to prevent light contamination. A plywood strip was used to support the intracanopy light fixtures and to avoid light contamination between treatments (Figure 4). The intracanopy LED lights were programmed to match the photoperiod of overhead lighting (08:00 – 23:59) and were used for the entire growth cycle starting at day 0. Light intensity measurements were taken before planting, with the quantum sensor facing directly upwards towards the overhead source. Some of the light intensity from the intracanopy lights may have been lost tangentially during these measurements, so the amount of light provided may have been slightly underrepresented. When considering the location of all nine experimental units, the average light intensity of the control was 252.0 ± 6.2 μmoles·m-2·s-1 and intracanopy was 325.9 ± 14.5 μmol m-2 s-1 which is an average difference of ~ +74 μmoles·m-2·s-1 or 30% increase in light for the intracanopy treatment. The spectrum of both light sources was assessed with a Li-180 spectrometer (LI-COR Biosciences, Lincoln, USA) (Figure 5). The fluorescent light spectrum was 18.5% blue, 54.3% green, and 27.2% red, and the intracanopy LED light bar spectrum alone was 23.1% blue, 45.3% green, 31.6% red. The combined light spectrum, i.e., the intracanopy lighting treatment spectrum, contained 23.1% blue, 45.3% green, and 31.6% red. Each light source’s phytochrome photostationary state (PSS) was calculated following Sager et al. (1988). The PSS of the fluorescent lighting was 0.83, the LED light bar was 0.87, and the combination used for the intracanopy treatment was 0.88, respectively.
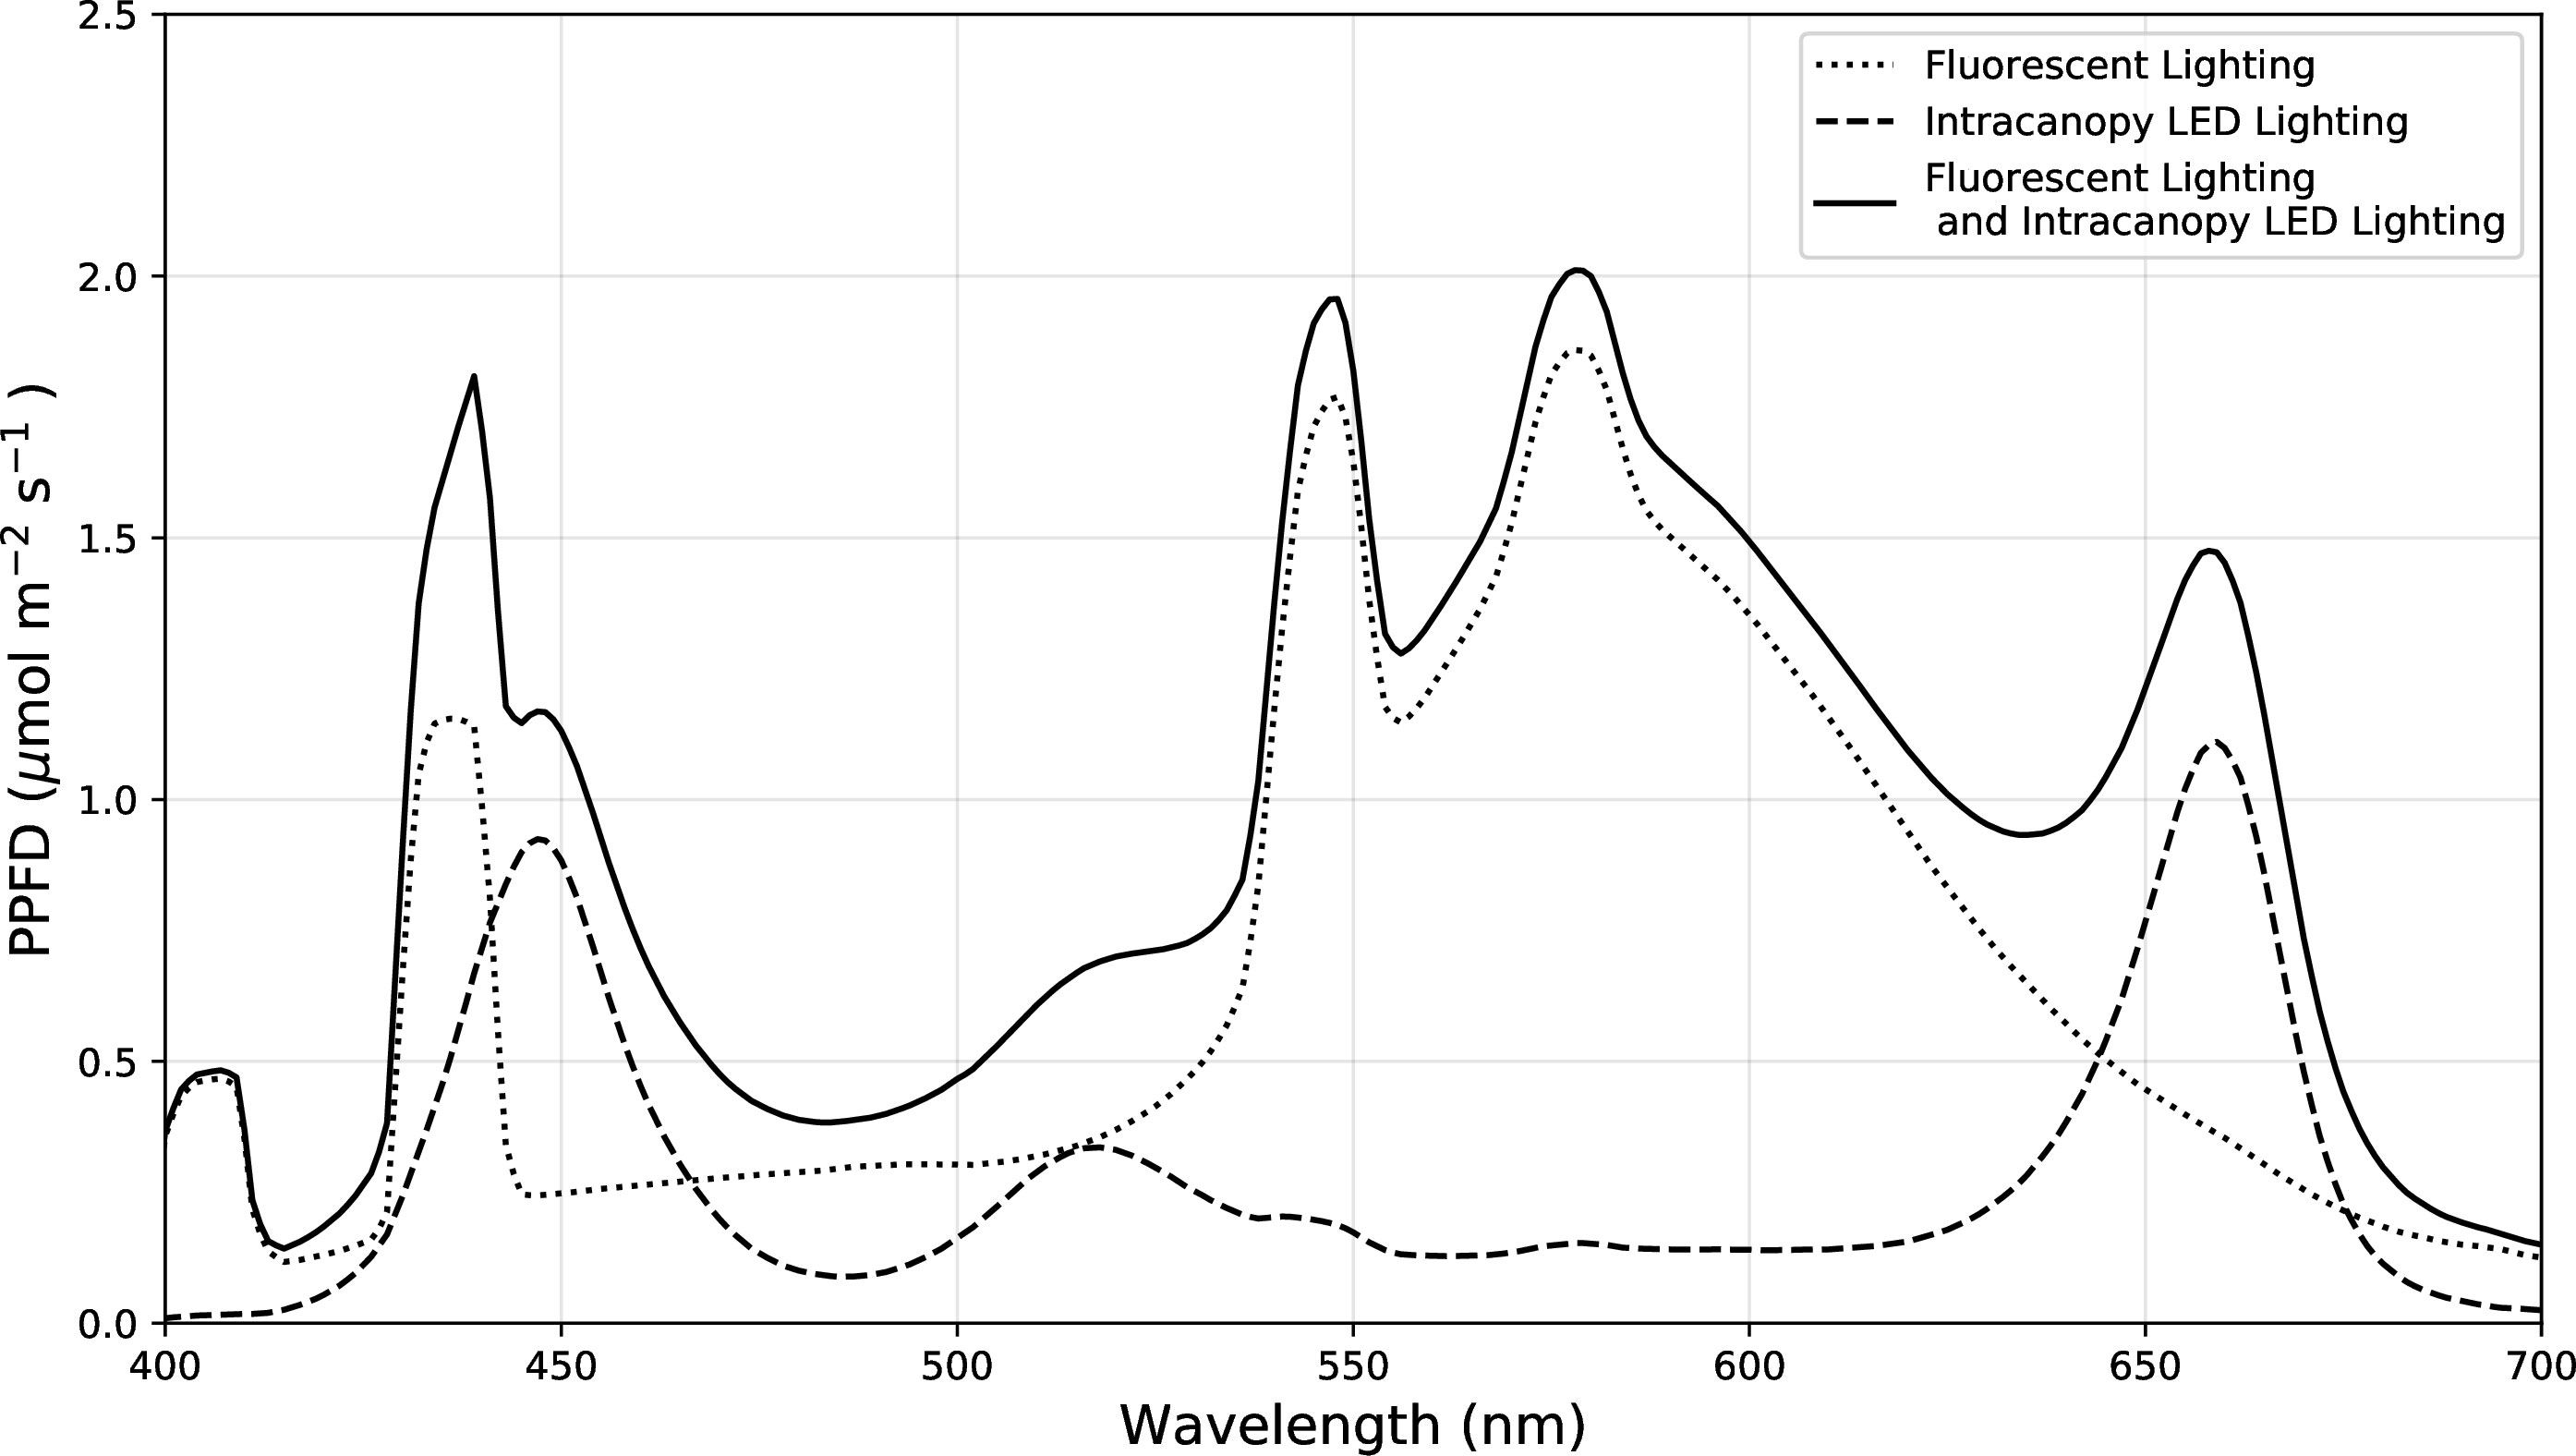
Figure 5 Comparing the spectral distribution of the overhead fluorescent lighting (control), intracanopy LED lighting alone, and the combined light sources that was used for the intracanopy treatment. Measurements were taken at pot height before planting with a Li-180 spectrometer (LI-COR Biosciences, Lincoln, USA).
A Barnant 100 JKT thermocouple thermometer (Barnant Company, Illinois, USA) was used to measure the canopy air temperature of the control and intracanopy lighting treatment.
Data from all three bush bean trials were analyzed within SAS® studio (SAS®, Version 3.8. SAS Institute Inc., Cary, NC, 2012-2018). Final harvest data from the flowering (n=4) and fruiting (n=4) cultivar selection trials were analyzed as a completely randomized design (CRD) with the model: Y = µ + cultivar + error. Data from the intracanopy trial were analyzed as a randomized complete block design (RCBD) with sampling where each experiment repetition was considered a block over time (n=4). The model for this trial was: Y = µ + light_treatment + block + light_treatment*block + error with block and light_treatment*block as random effects. Tukey’s HSD multiple comparison analysis was used for all data to determine differences in treatment least squared means. Standard errors were homogenous between treatments due to a balanced experimental design and were reported as a single value below each results table column.
When comparing bush bean morphology, plant heights were similar until day 20, when cultivars “Bush Blue Lake” and “Provider” surpassed “Bronco” and “Strike” (Figure 6). The “Bush Blue Lake” cultivar was on average between 9-11 cm taller than “Bronco” (p=0.007), “Provider” (p=0.002), and “Strike” (p=0.003) 40 days after planting (Figure 6 and Table 1). The “Bush Blue Lake” and “Strike” cultivars had the largest area of influence at the final measurement on day 40 (Figure 6 and Table 1). “Bush Blue Lake” plants occupied roughly twice as much volume compared to “Bronco” (p < 0.0001), “Provider” (p < 0.0001) and “Strike” (p < 0.0001) (Figure 6 and Table 1). When comparing dry weight, the “Bush Blue Lake” cultivar produced more leaf, stem and total shoot dry weight than the three other bush bean cultivars (Table 1). Leaf area was also highest for the “Bush Blue Lake” cultivar (Table 1).
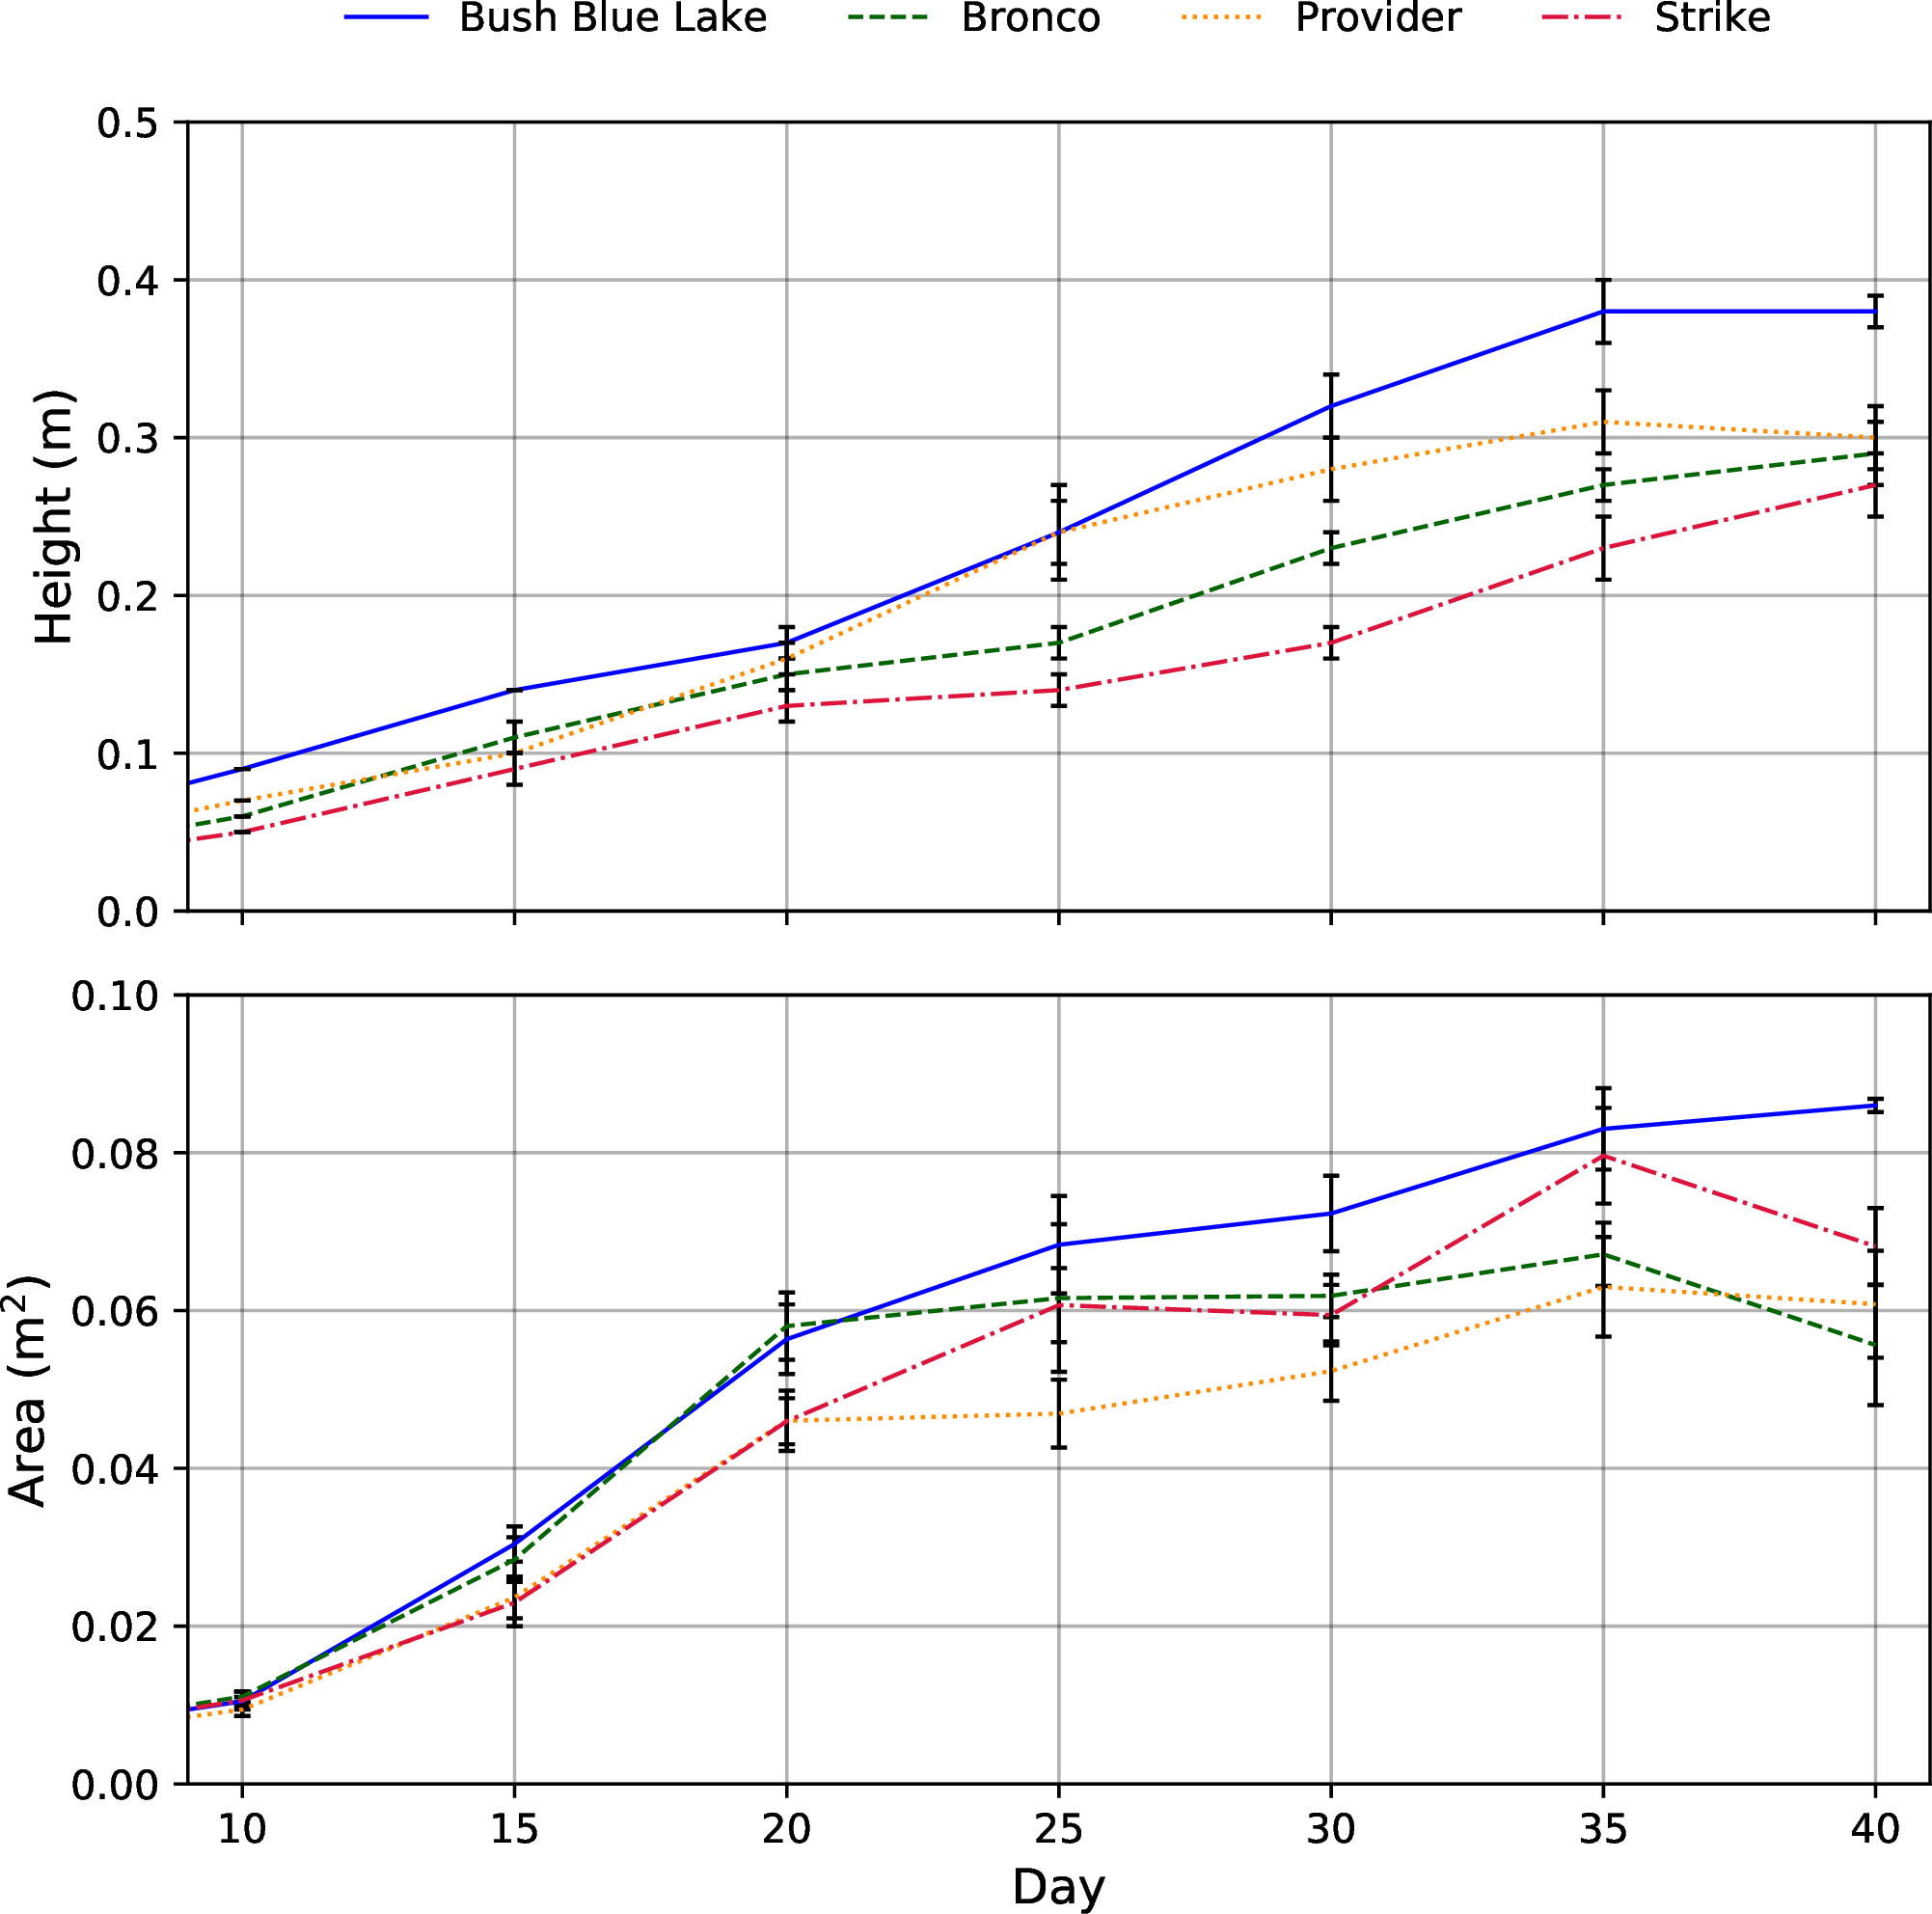
Figure 6 Plant height (m) and area (m2) growth rates of the four bush bean cultivars throughout the 40-day flowering stage cultivar selection trial. Due to destructive sampling, the number of plants used to calculate the mean varied throughout the trial with Day 0-10; n = 16, Day 15 – 20; n =12, Day 25-30; n = 8, Day 35-40; n=4. The error bars represent the standard error of the mean.
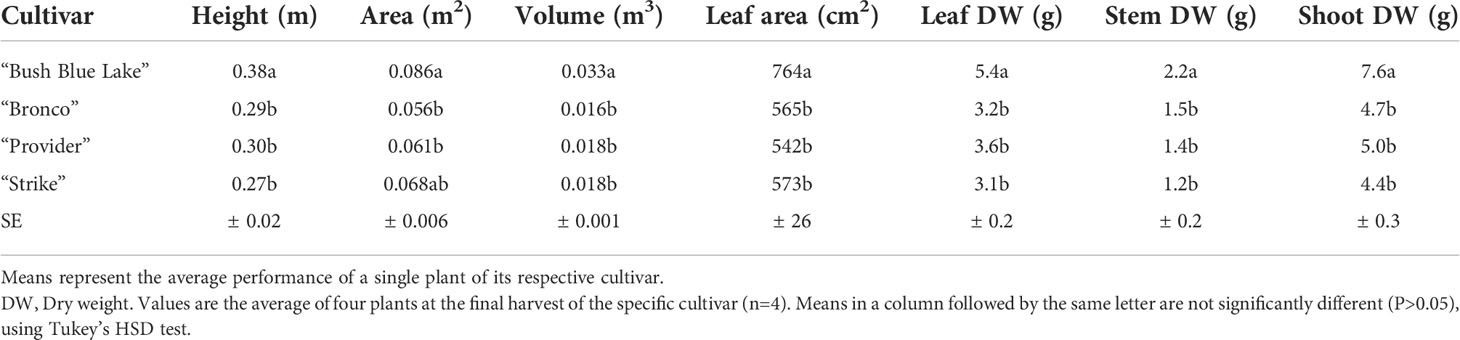
Table 1 Summary of D40 destructive harvest data for all four bush bean cultivars in the flowering stage trial (n=4).
Flower count data show that “Provider” and “Bush Blue Lake” were first to flower, followed by “Bronco” and “Strike” (Figure 7). The early flowering of “Provider” and subsequent dip in flower count represented the transition from flower production to bean production following self-pollination. At the same time, the other three cultivars were still forming flowers, the “Provider” cultivar was filling the beans it had produced early on (Figure 7).
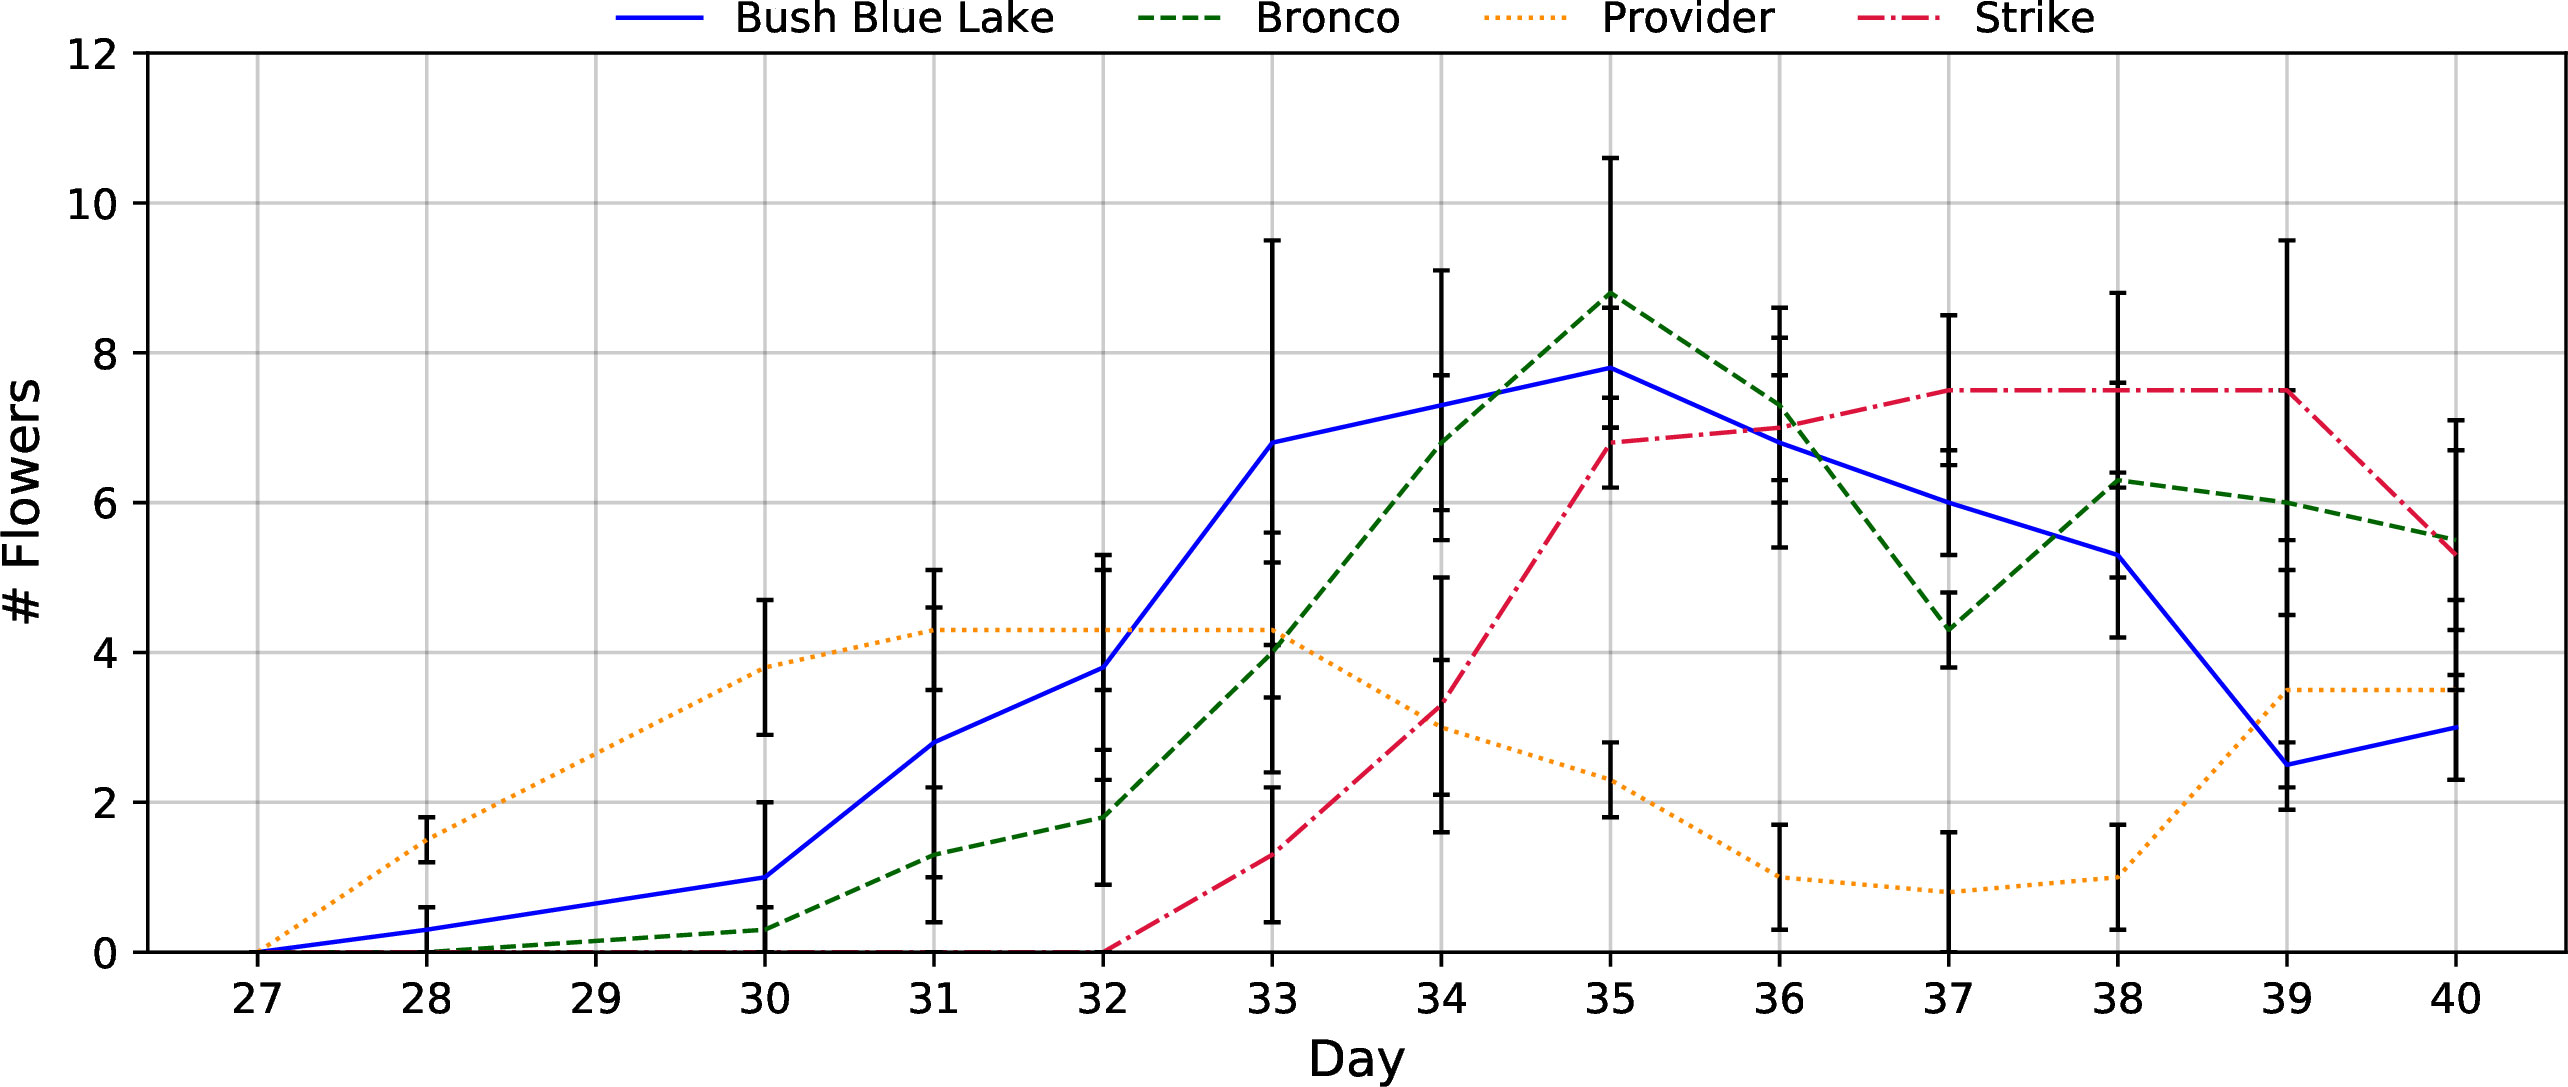
Figure 7 The flower count of each bush bean cultivar (“Bush Blue Lake”, “Bronco”, “Provider”, and “Strike”) from initial anthesis to the final harvest on day 40. Average flower counts represented the total number of fully expanded flowers observed on each day. Error bars represent the standard error of the mean.
In terms of plant morphology, the average height of the three bush bean cultivars was similar until about day 15, when the “Provider” cultivar surpassed “Bronco” and “Strike” (Figure 8). “Provider” was 10-11 cm taller than “Bronco” (p = 0.22) and “Strike” (p=0.14) after 60 days in chamber (Figure 8 and Table 2). There were no differences in the average area or volume occupied after 60 days (Figure 8 and Table 2). In terms of inedible plant biomass, there were no differences between leaf area, leaf dry weight, stem dry weight, or shoot dry weight among the three bush bean cultivars (Table 2). At the final harvest, the “Strike” cultivar produced 20-22 g less mature bean fresh weight per plant compared to “Bronco” (p=0.42) and “Provider” (p=0.46). There was no difference in the harvest index, calculated as the total bean dry weight (MatBeanDW + ImBeanDW) divided by the total shoot dry weight (Leaf DW + Stem DW) (Table 2).
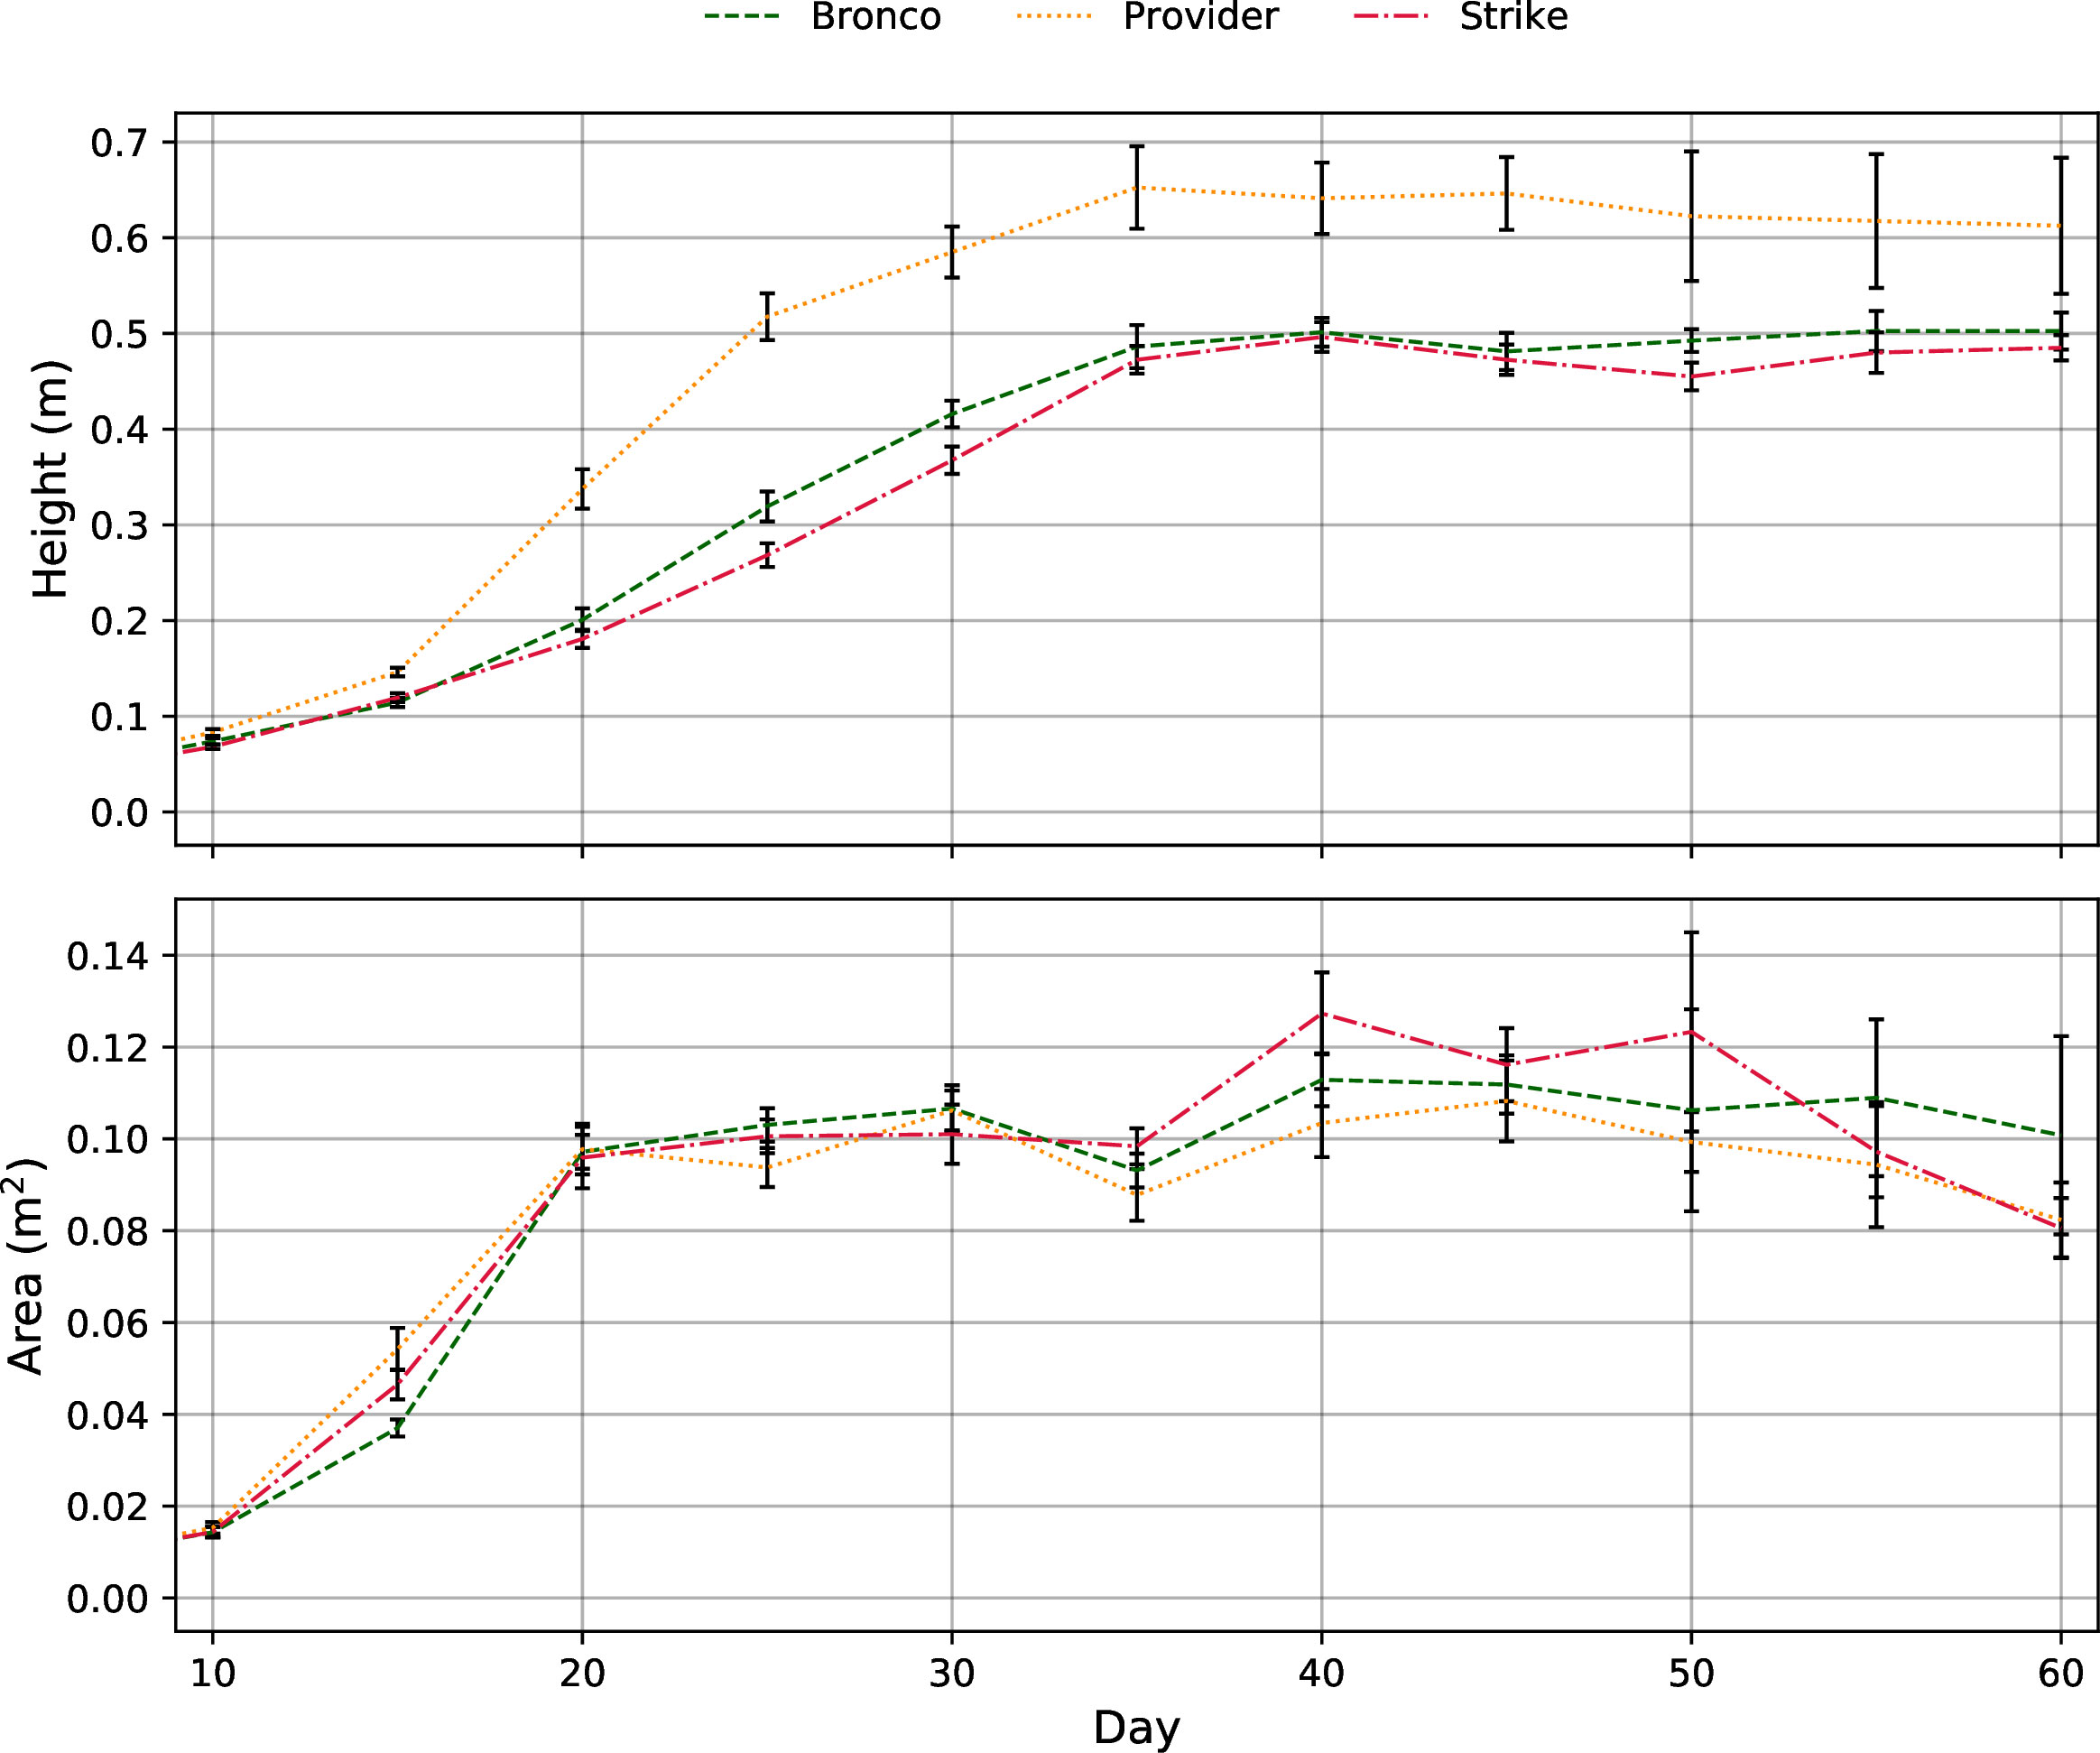
Figure 8 Plant height (m) and area (m2) growth rates of the three bush bean cultivars throughout the 60-day fruiting stage cultivar selection trial. Due to destructive sampling, the number of samples used to calculate averages varied throughout the trial with Day 10 – 15; n = 16, Day 20 – 30; n =12, Day 35 – 45; n = 8, Day 50 – 60; n=4. The error bars represent the standard error of the mean.
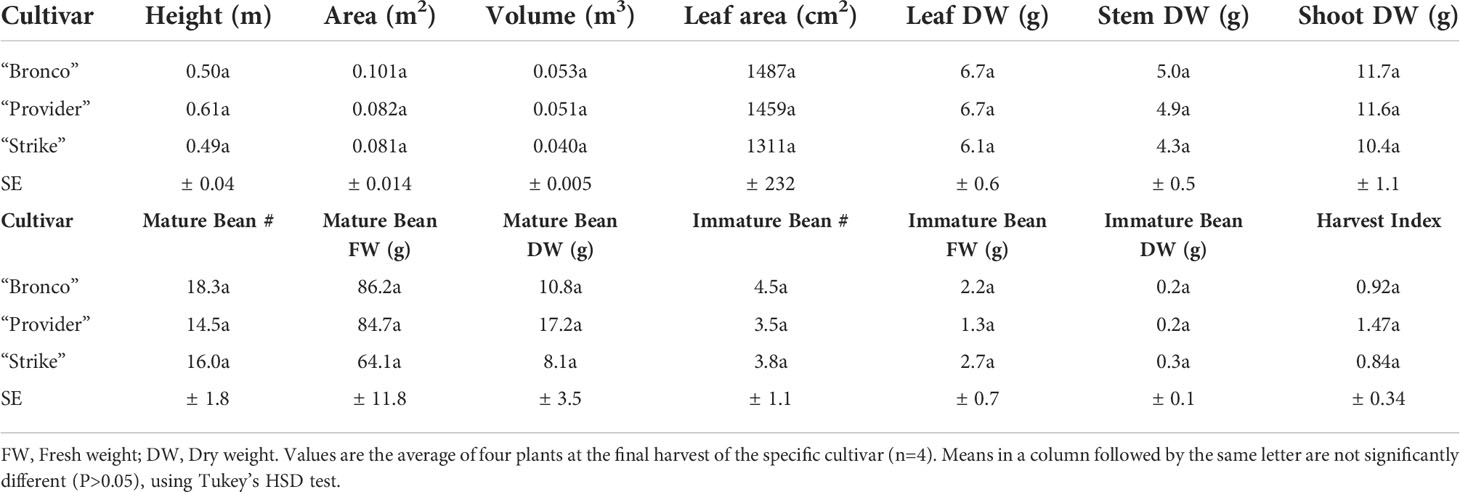
Table 2 Summary of D60 harvest data for the fruiting stage trial.
Mature flower count data showed that “Provider” was first to flower and was followed by “Bronco” and “Strike” approximately four days later (Figure 9). While “Provider” was first to reach anthesis, it had the fewest number of concurrent flowers during the anthesis stage.
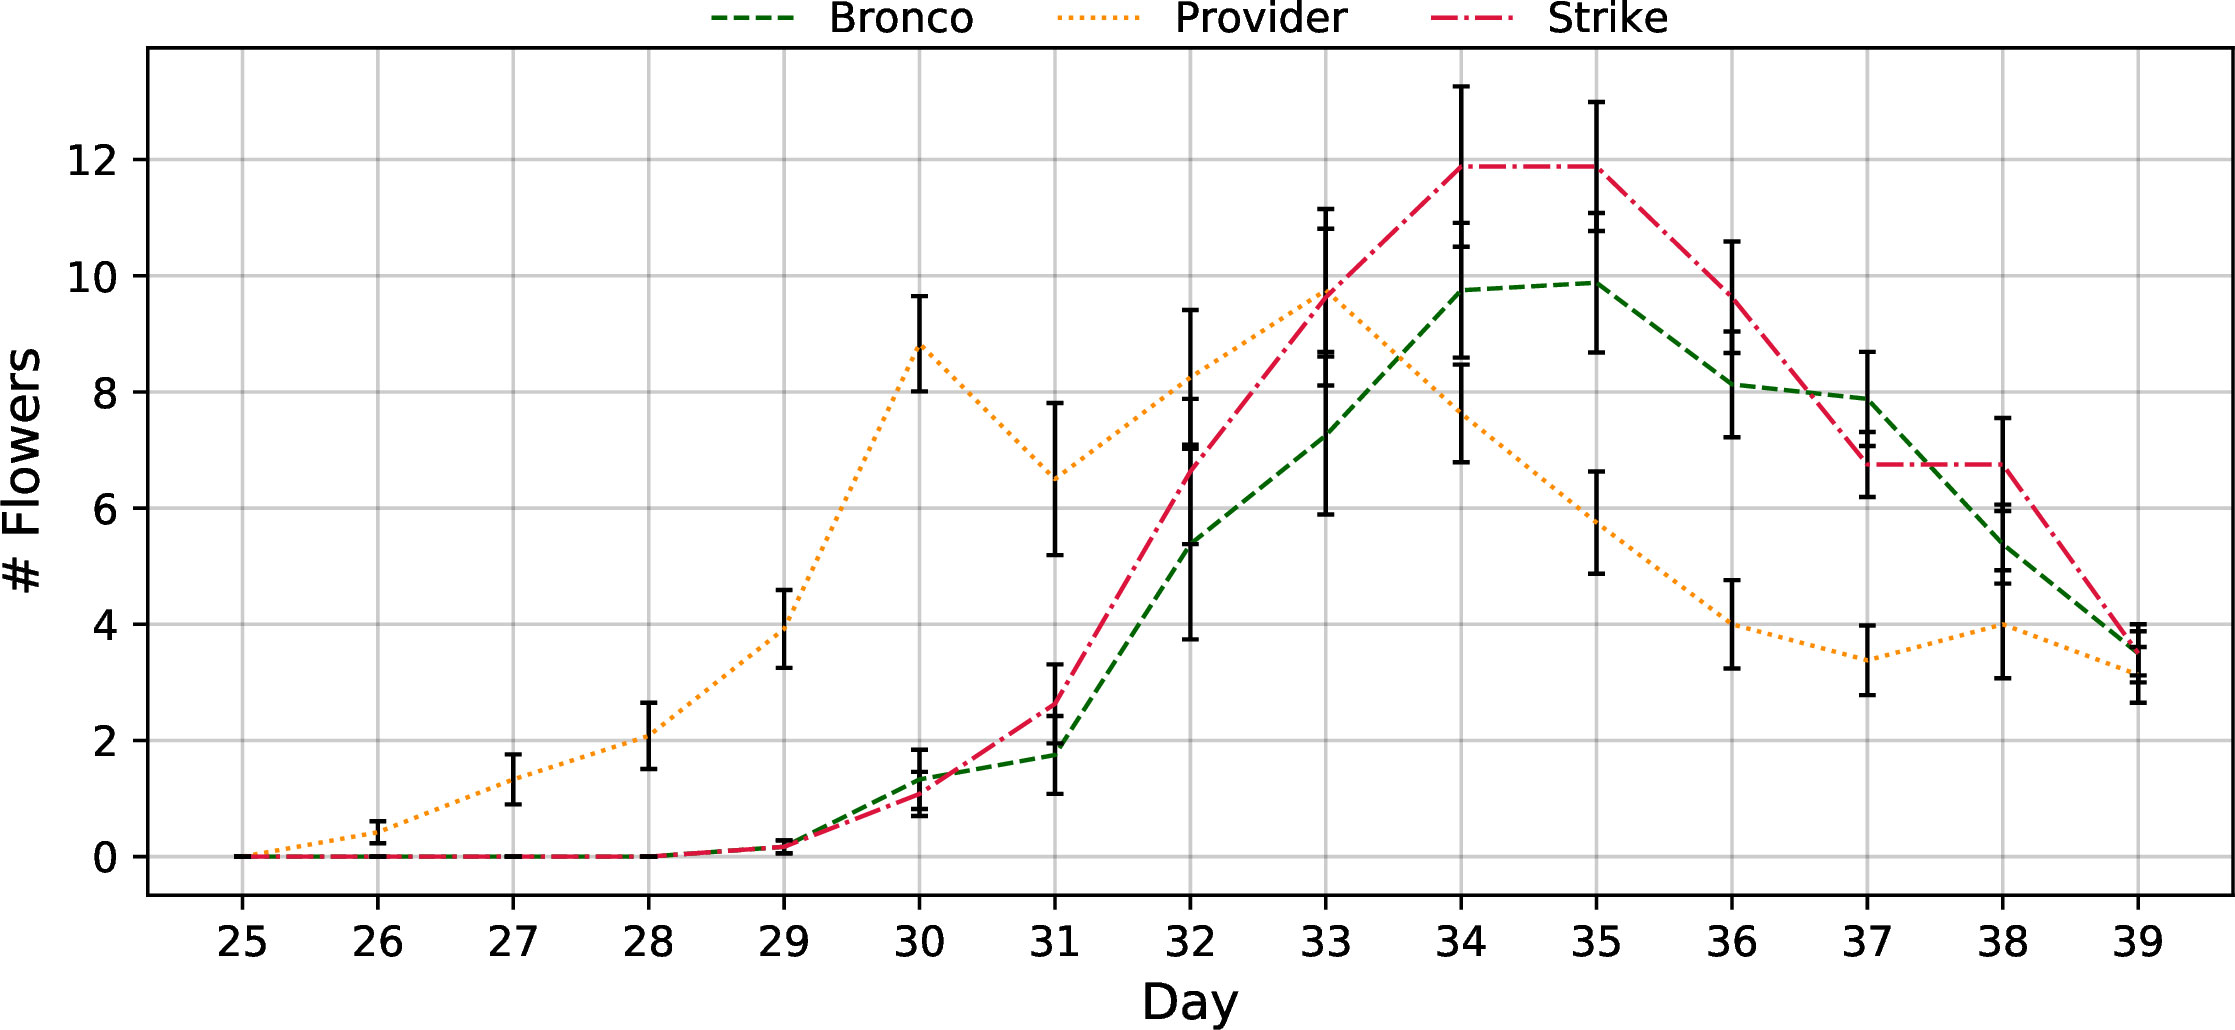
Figure 9 Flowering rate of the three bush bean cultivars (“Bronco”, “Provider”, and “Strike”) throughout the 60-day fruiting stage cultivar selection trial. Measurements began on day 25 and were concluded on day 39. The data presented is the average number of fully expanded flowers observed on each measurement day. Error bars represent the standard error of the mean.
In terms of morphology, “Bronco” bush bean grown under overhead lighting alone were taller than plants with additional intracanopy lighting ~20 days after planting (Figure 10). The difference in growth rates between treatments was most evident between 17-25 days after planting (Figure 10). After 25 days, the growth rate appeared similar, but the height difference was maintained until the final harvest 50 days after planting (Figure 10). The average height of plants grown under overhead lighting alone was 56 ± 5 cm, while that of plants with additional intracanopy lighting was 47 ± 5 cm representing a ~9 cm difference (p = 0.0047) (Table 3 and Figure 10).
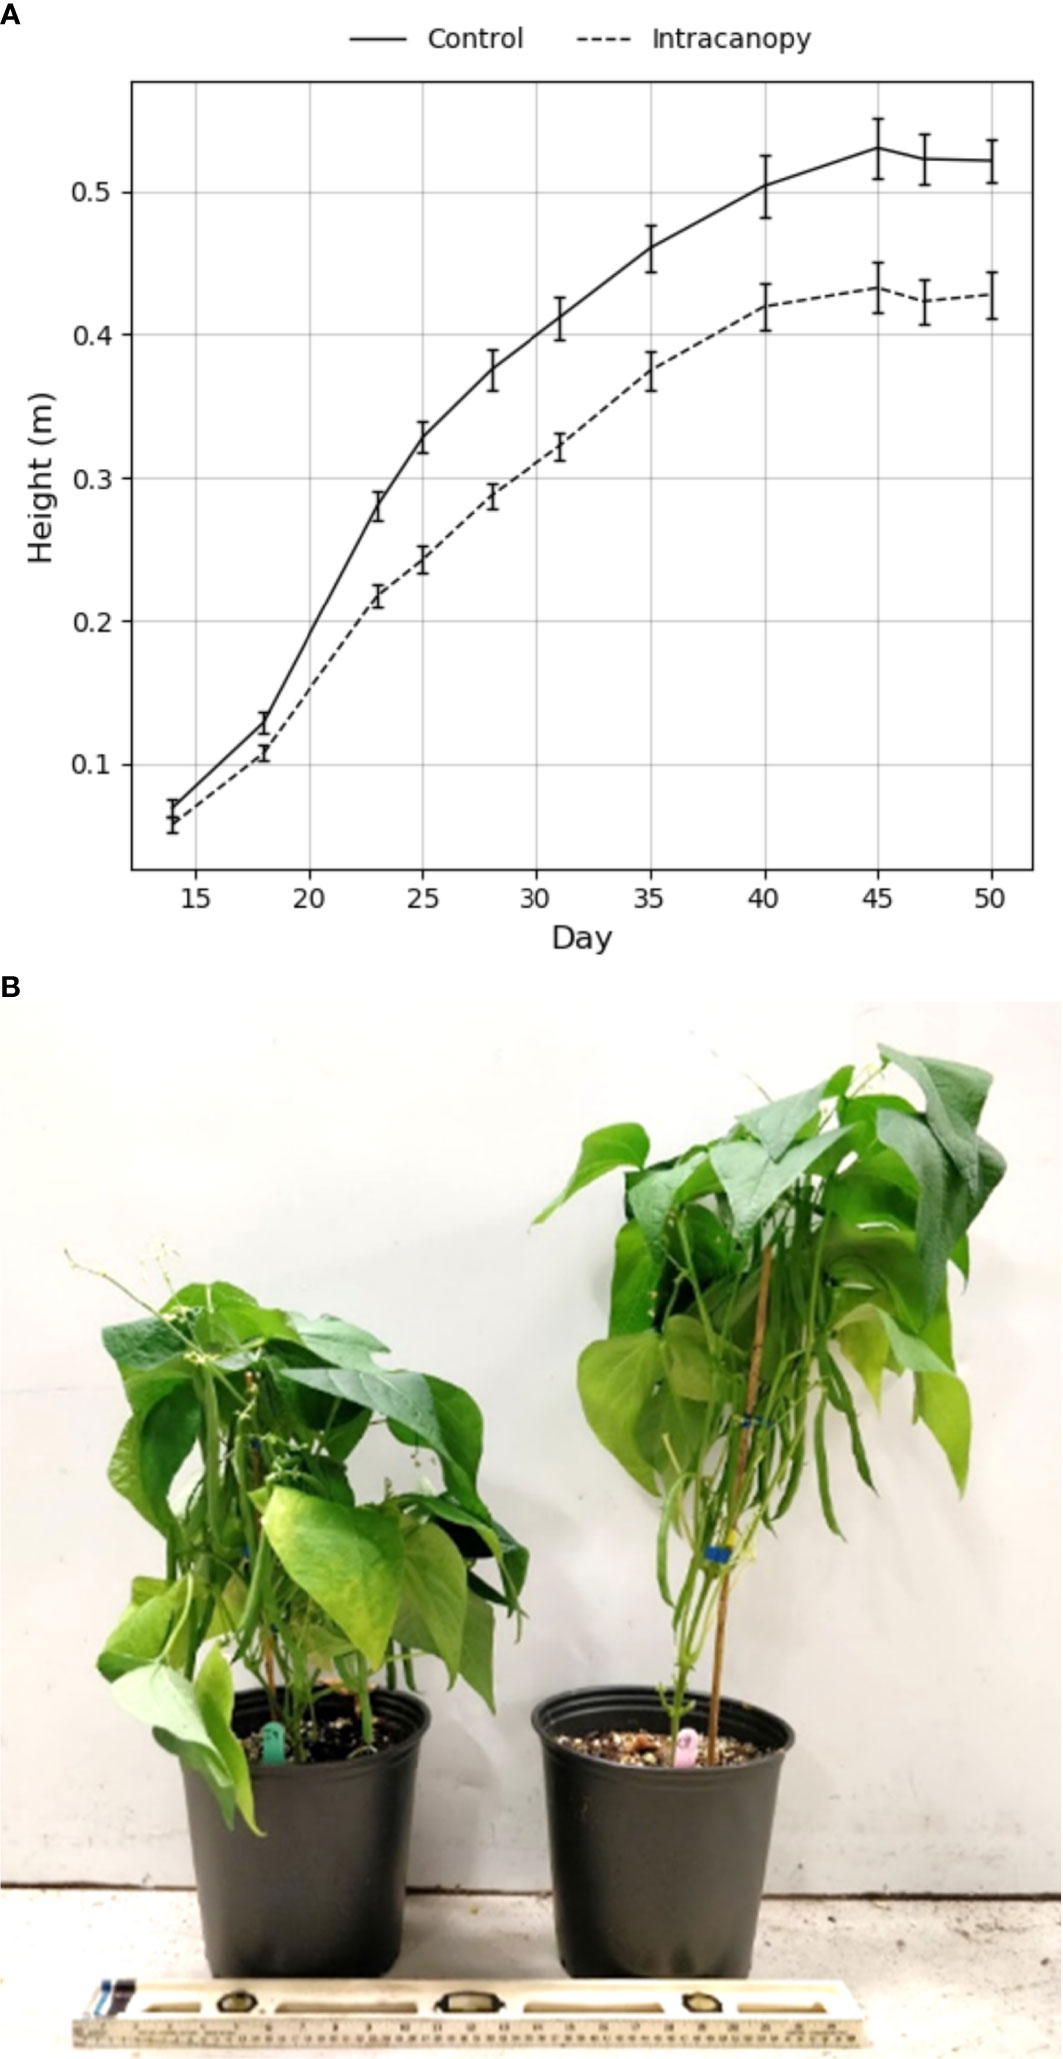
Figure 10 (A) Average heights of “Bronco” bush bean plants grown under fluorescent lighting (control) with or without intracanopy LED light bars until harvest after fifty days in the chamber. Bars represent the standard error of the mean. (B) A photo depicting the average result of the intracanopy (left) and control (right) treatment on the right after fifty days in the chamber.
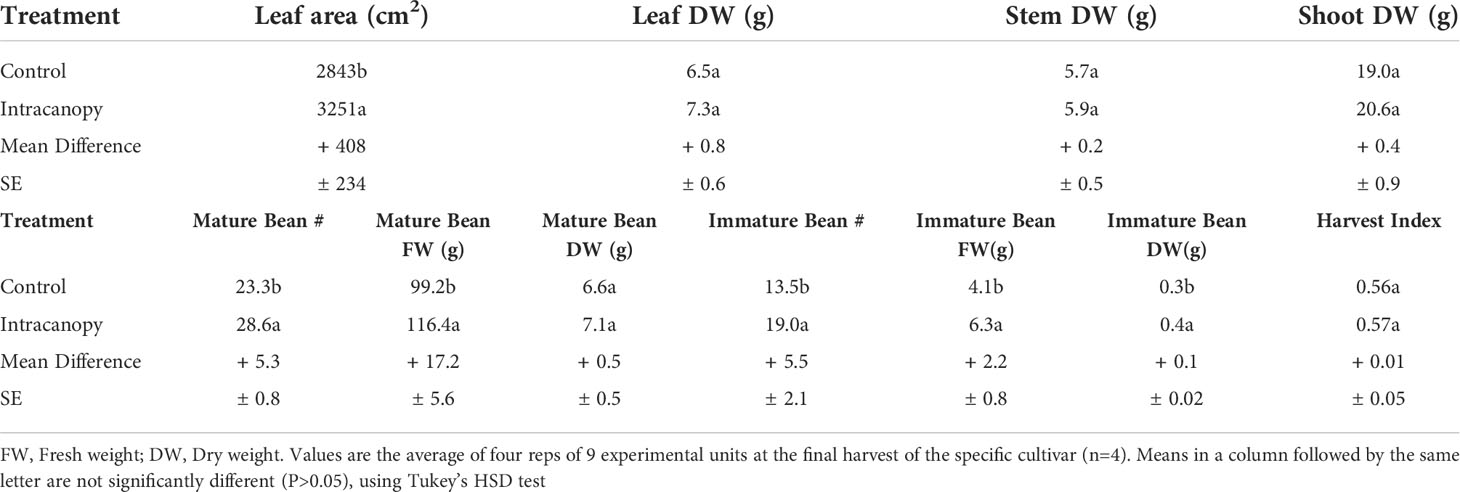
Table 3 Results of the intracanopy lighting trial.
There were no differences in leaf dry weight, stem dry weight, and therefore shoot dry weight when comparing plants grown under overhead lighting alone to plants grown with additional intracanopy lighting (Table 3). When comparing edible biomass, the average intracanopy treated plant produced ~5 more (p=0.003) mature beans than the control, which represented a 22% improvement to total bean number from the average plant (Table 3). In terms of mature bean fresh weight, there was a ~17 g difference between the intracanopy and control (p=0.023), which represented a 17% improvement in mature bean fresh weight. There were also more immature beans on the intracanopy plants at harvest (p=0.045) compared to the control suggesting that a larger difference between treatments regarding edible biomass may have been observed if left to mature another 3-5 days before harvest. Total Shoot dry weight was not different (Table 3). Finally, there was no difference in harvest index (total fruit DW/total shoot DW) between the two treatments (p= 0.34) (Table 3).
On the intracanopy side, the surface of the LED light source was measured to be 25.5°C, and the air surrounding the nearest plants was 23.4°C. On the control side, the surface of the tinfoil wrapping on the LED light fixture was measured to be 28.4°C, and the air surrounding the nearest plants was 23.6°C.
The fully expanded flower count data showed that both groups began flowering simultaneously and that intracanopy plants created more flowers during the peak of anthesis than the control plants grown under overhead lighting alone (Figure 11).
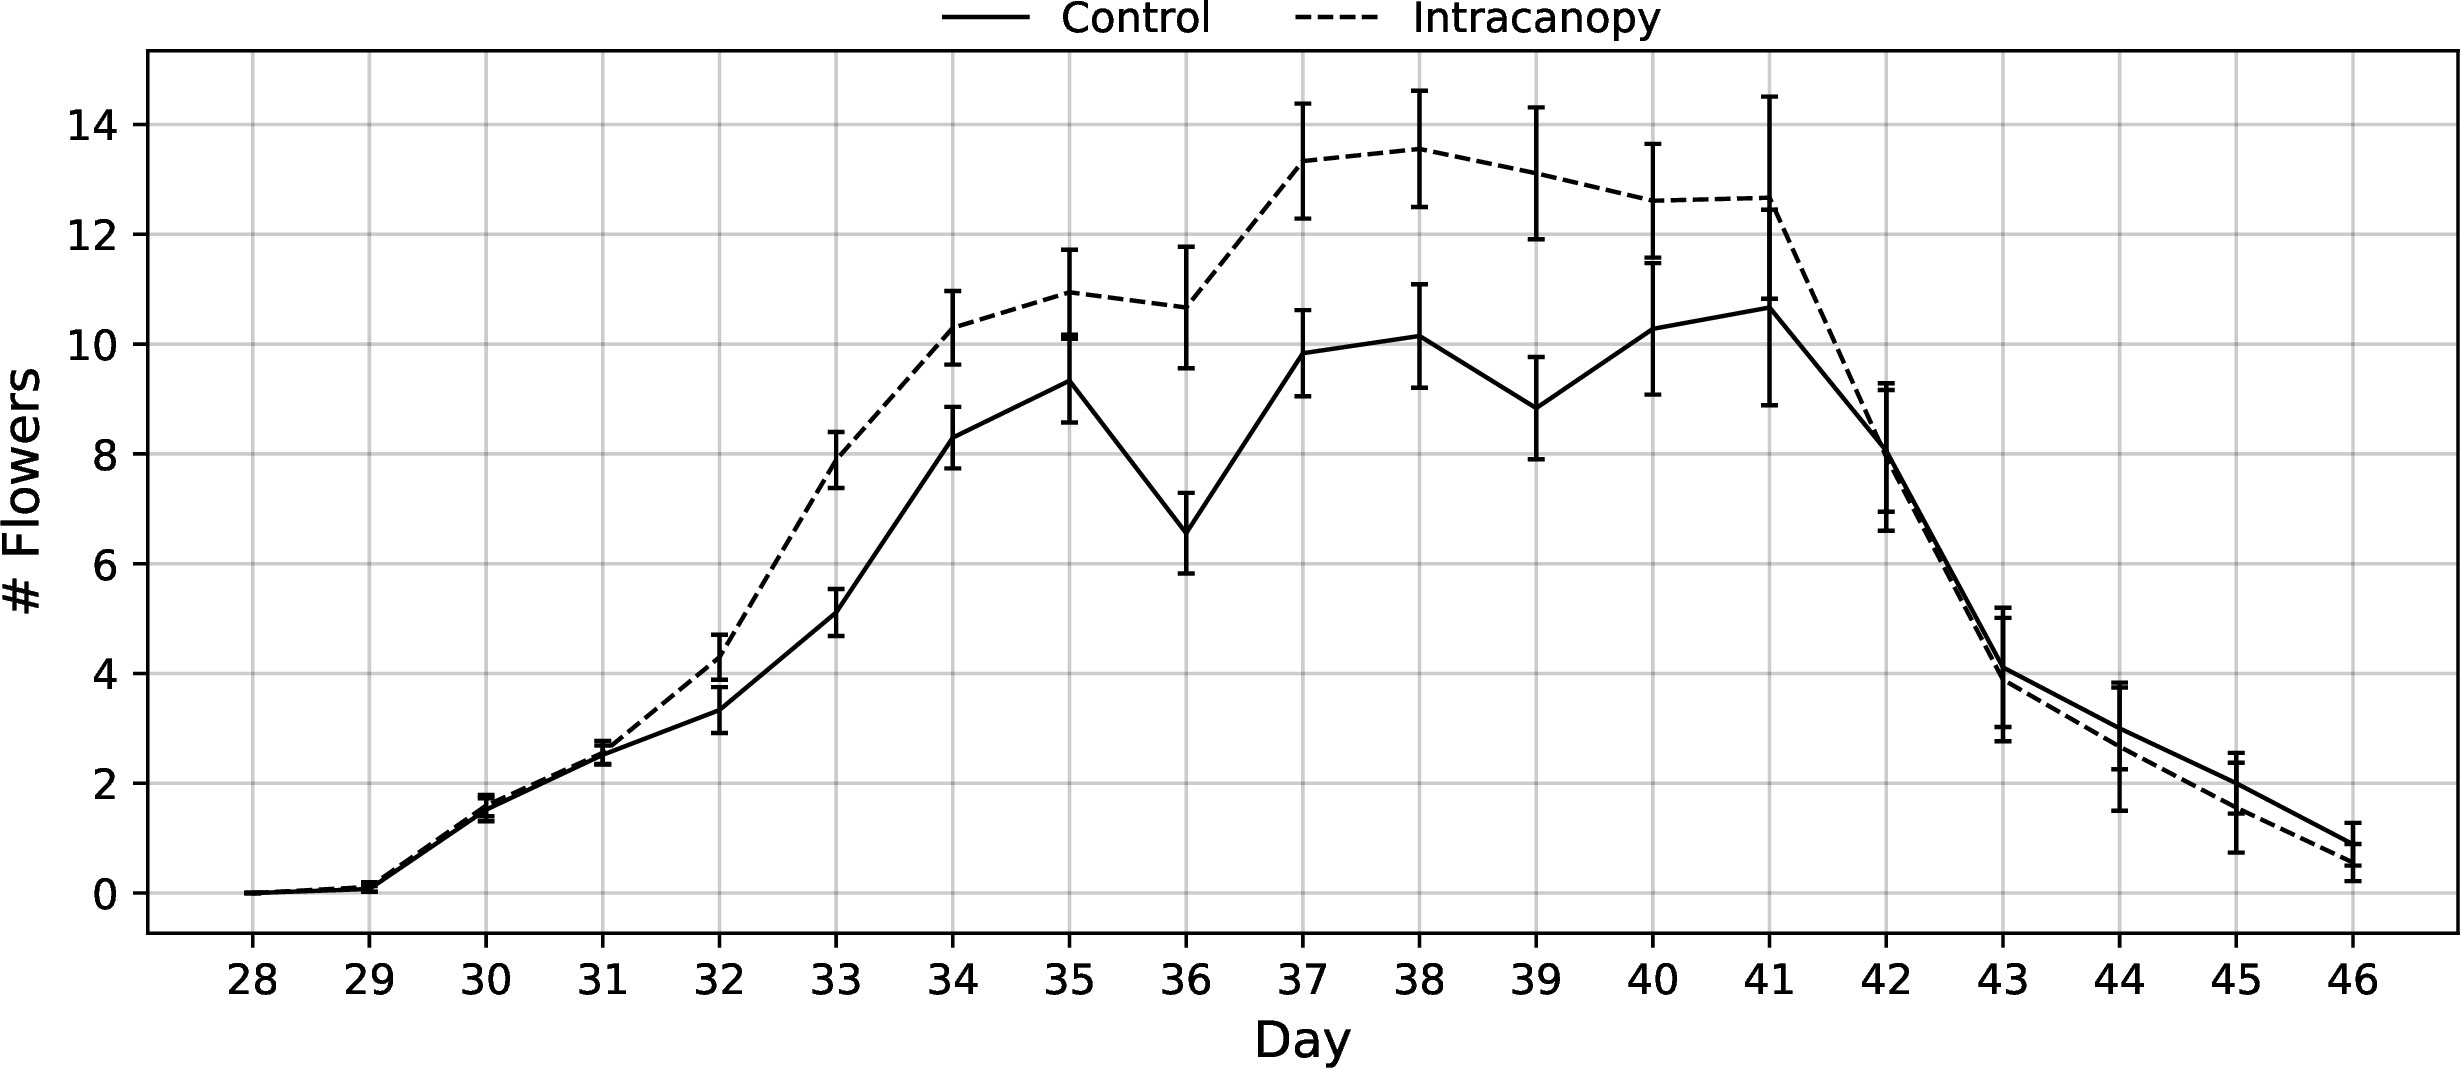
Figure 11 Flowering rate of green bush beans grown with overhead fluorescent lighting alone (Control) versus overhead fluorescent with additional intracanopy LED light bars (Intracanopy) through 28-46 days after planting. Error bars represent the standard error of the mean.
Since bush bean is a field crop, there is a paucity of research on how specific cultivars will perform in a vertical farm. An ideal bush bean cultivar will have a compact morphology (height, area, volume) as plant height influences the number of layers that can be stacked vertically and area influences the number of plants that can be produced per layer. A cultivar with a shorter life cycle would allow for additional harvests per year in a continuous production system (Kozai et al., 2015). With these criteria in mind, the 40-day flowering stage cultivar selection trial provided insight into how the four green bush bean cultivars would respond to production within a CES. “Bush Blue Lake” was the tallest of all cultivars grown and occupied the most area and volume per plant (Table 1). For these reasons, it was removed as a potential candidate for the subsequent fruiting stage trial. While this preliminary trial was designed to assess vegetative growth, it also provided insight into the possible bean production of each cultivar if they were to progress to that age. The “Provider” cultivar was of interest as it flowered earliest but had the fewest flowers concurrently during anthesis. Reduced flower count indicated that the “Provider” cultivar would likely produce fewer beans than either “Bronco” or “Strike” if grown to completion (Tuarira & Moses, 2014).
The 60-day fruiting stage trial found that the three remaining bush bean cultivars, “Bronco”, “Provider”, and “Strike” were very similar. There were no differences in height, area, volume, biomass accumulation, and yield amongst cultivars considered statistically significant at α = 0.05 (Table 2). While the lack of statistical significance is not ideal when attempting to select a single cultivar for future research trials, it did bode well for green bush bean being generally compatible with controlled environment production. Regardless a single cultivar had to be selected, so a few trends in the data were used to determine which species would move forward to the intracanopy trial. The “Provider” cultivar was the tallest and produced the least bean pods per plant of the three cultivars grown. These results removed the “Provider” cultivar from contention in the intracanopy trial. While the “Strike” cultivar was the most compact of the three cultivars but produced slightly less yield than “Bronco”. While either “Bronco” or “Strike” bush bean cultivars would have made acceptable candidates for high-density controlled environment production, the decision was ultimately made to proceed with the “Bronco” cultivar for the intracanopy trial due to its higher bean count and harvest index (Table 2).
As hypothesized, the addition of intracanopy LED lighting influenced bush bean height, biomass accumulation, and yield. “Bronco” bush bean plants produced with intracanopy LED lighting were roughly 20% shorter than plants produced with overhead fluorescent lighting alone (Figure 10). Intracanopy lighting trials are most commonly conducted on fruiting vine crops (tomato, cucumber, pepper), where plant height is often not discussed or relevant (Pettersen et al., 2010; Deram et al., 2014; Joshi et al., 2019). However, this height reduction is significant for vertical farms, as a 20% reduction in average plant height would allow for six layers of bean production with intracanopy lighting in the same amount of vertical space required for five layers of overhead lighting alone (Graham & Wheeler, 2016). The addition of intracanopy lighting increased mature bean counts by 22% and fresh bean weight by 17% per plant, which would act as a multiplier for each tier of plant production, further increasing the number of beans produced per unit volume. A similar trend in crop yield improvements has been observed with intracanopy lighting in trials conducted on soybean, tomato, and cucumbers (Stasiak et al., 1999; Pettersen et al., 2010; Deram et al., 2014). The yield increase in previous intracanopy studies is often attributed to improved light distribution and modified spectrum within the canopy, which most likely caused the increase in green bean yield observed in our research trials. While not measured directly, leaf senescence and abscission was delayed in green bush bean plants treated with intracanopy lighting (Figure 10B). This observation supports what has been previously reported in intracanopy lighting trials on cowpea (Frantz et al., 2000). This result is significant for vertical farms as reduced leaf abscision results in less plant material that needs to be regularly removed from the system. While the air temperature within the plant canopy was similar, the surface temperature of the LED bars was elevated and caused slight damage to leaf tissue resting directly on LED light bars (Figure 12). Tissue damage was slightly concerning but deemed acceptable as it only affected leaves and not saleable bean material. Increased temperature within the canopy may partially explain the additional yield and flower count (Figure 11) as it has been found to influence flower production in bean (Tuarira & Moses, 2014). Taken together, the results of these trials suggest that including intracanopy lights in future vertical farming applications would allow for more precise morphology control and be beneficial for improving the efficiency of bush bean production.
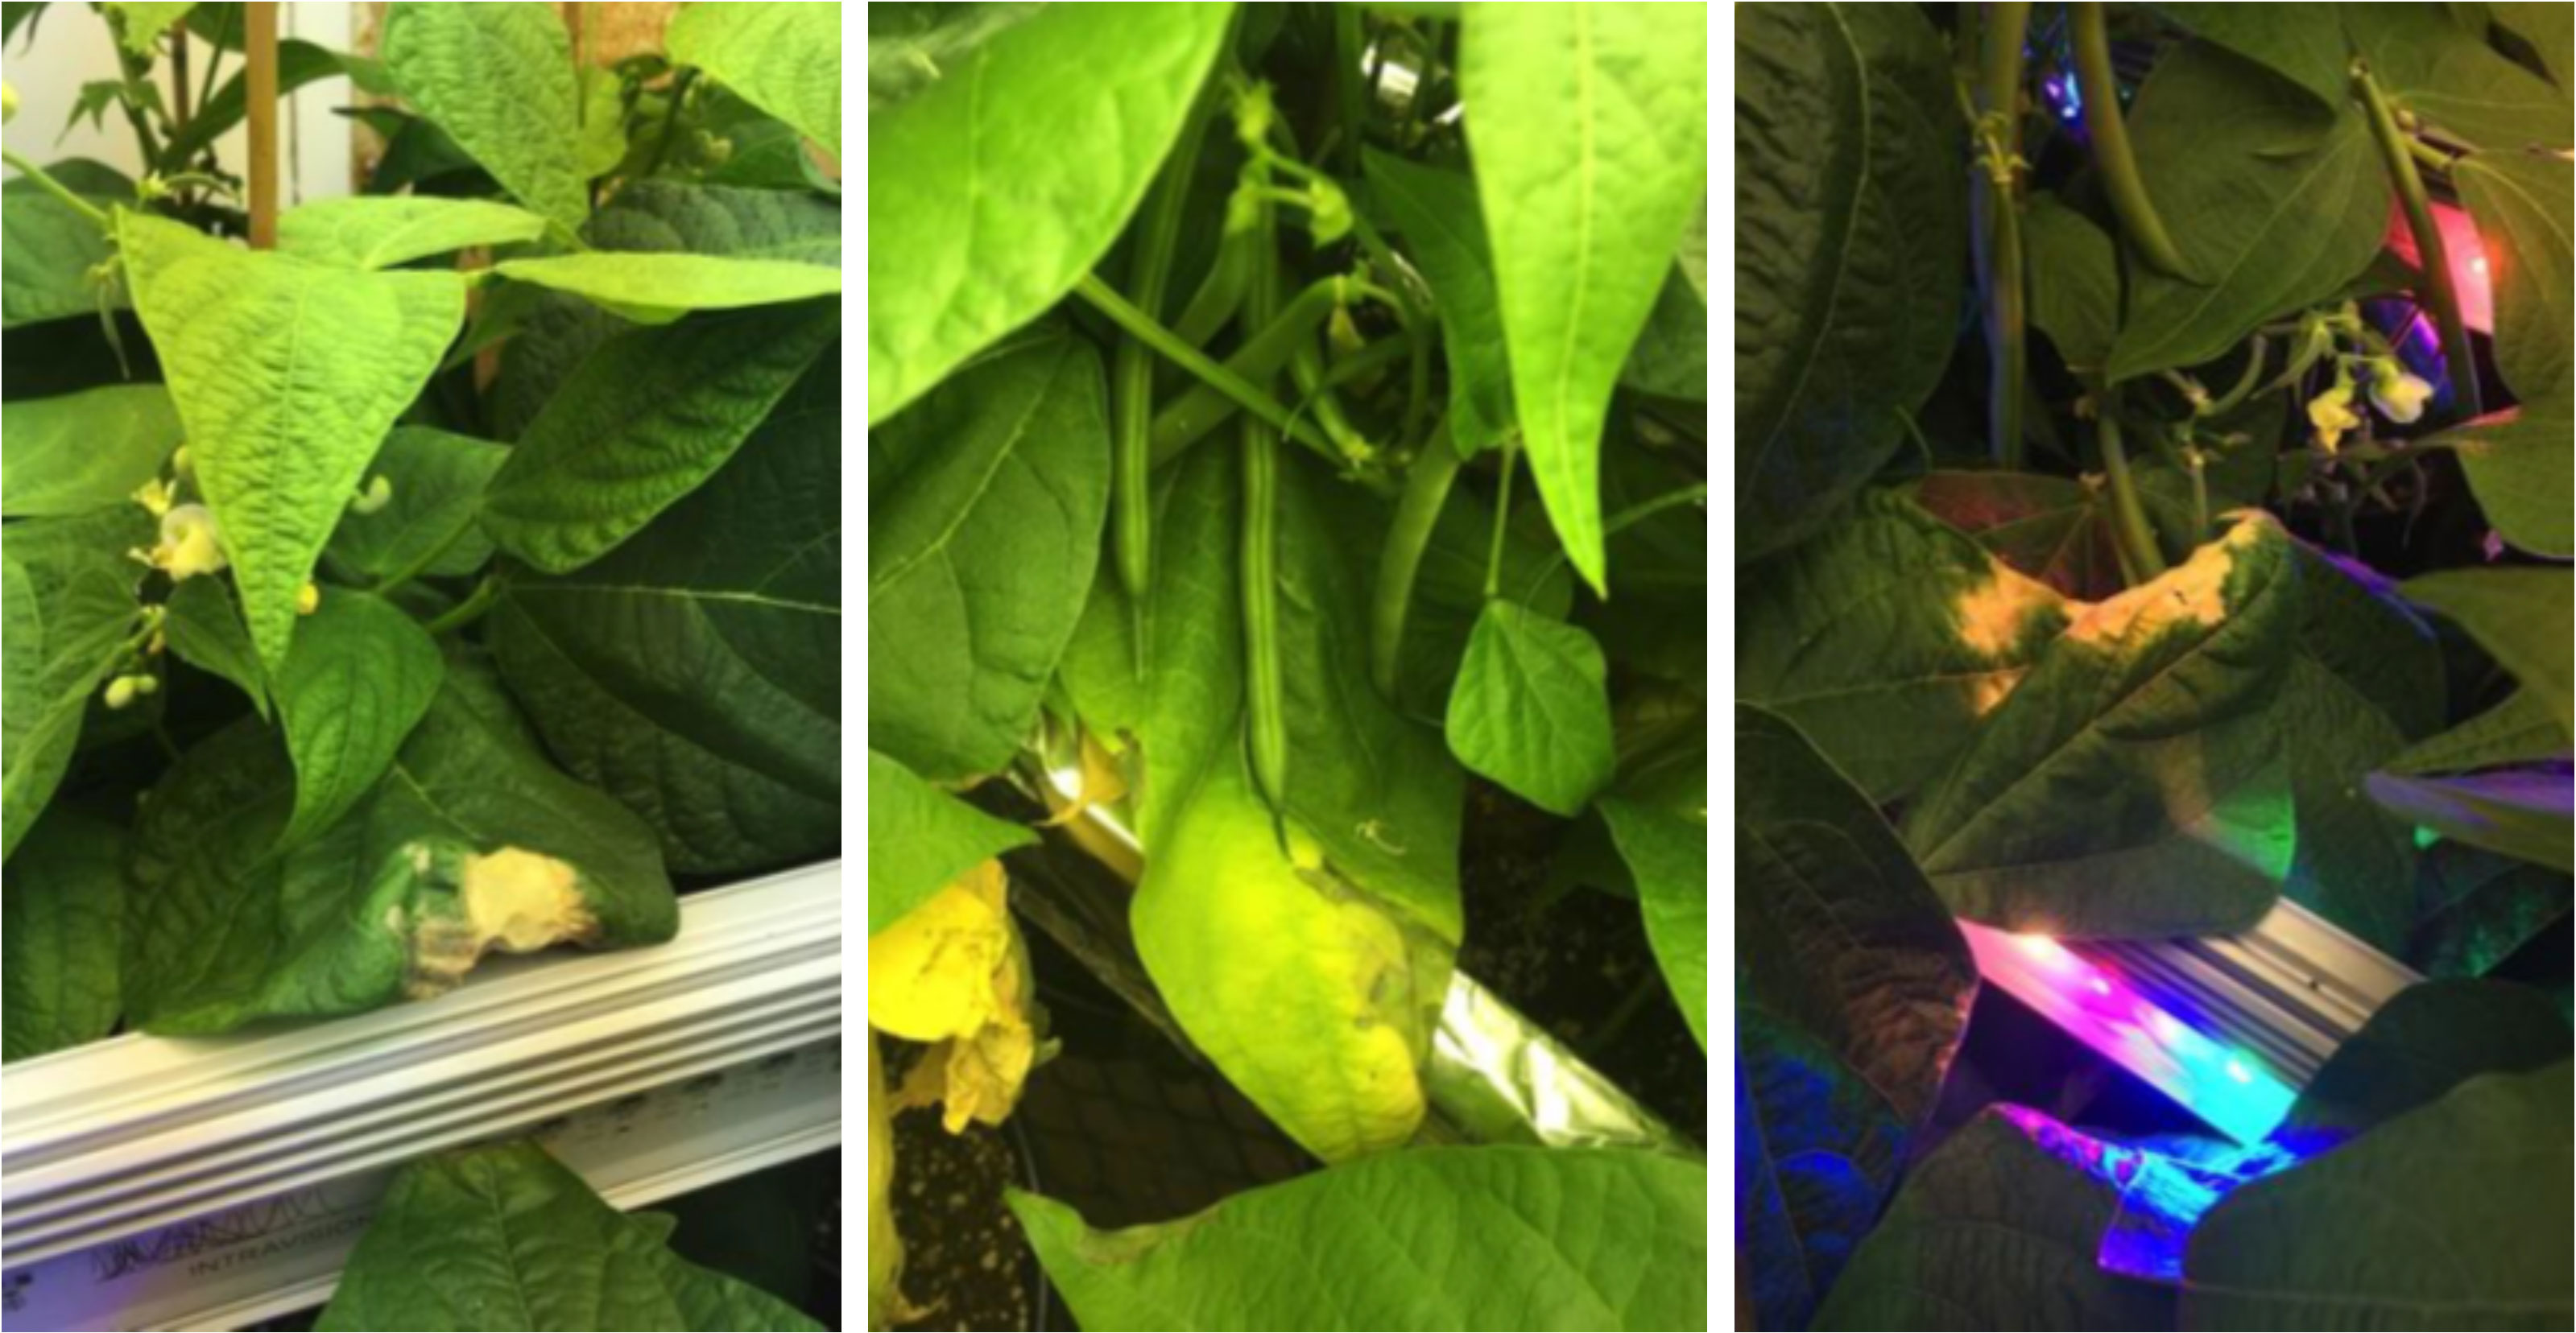
Figure 12 Leaf tissue damage from prolonged direct contact with intracanopy LED lights.
This research demonstrated that intracanopy lighting can improve crop compatibility and yield in vertical farms, but it is worth noting that it also increased the system complexity, energy requirements, and costs per kg of green bean produced. In our scenario, applying intracanopy lighting for 16-hour photoperiod for the 50-day growth cycle equated to 800 hours of additional electricity consumption per array. This equated to an additional 186 kWh of electricity for the intracanopy treatment compared to the control overhead lighting alone. An intracanopy lighting trial on mini cucumber found that intracanopy lighting strategies also increased cucumber cost per kg by 11-19%, depending on the number of arrays being used (Kumar et al., 2016). In addition to higher energy bills, the grower has to purchase the LED arrays and integrate them with their existing lighting hardware. The cost of LED arrays is predicted to decrease with time, but there are potential strategies that could be implemented in the short term to improve energy use efficiency. Our intracanopy light arrays were programmed to followed the same schedule as the overhead lighting (both started at day 0). Intracanopy lighting protocols in future trials could be programmed and only turned on once a certain minimum light intensity is observed within the canopy to reduce energy consumption (for example day 21-50). In closed controlled environment systems, intracanopy LED lighting could also be programmed to match fluctuations in electricity prices throughout the day to reduce energy costs further (Lork et al., 2020).
While this trial represented what an actual implementation of intracanopy lighting for bush beans could represent, there are a few recommendations to improve future intracanopy lighting research trials. Future trials on intracanopy lighting should attempt to match the total amount of light applied to determine if the effect is due to the amount of light vs the positioning of the light. Our intracanopy LED arrays applied roughly 30% more light than overhead light application alone, which would account for the increase in plant matter and yield produced. Another caveat to consider while interpreting these results is that the light spectrum was different between the control and intracanopy treated plants (Figure 5). The increased percentage of blue light within the canopy may have caused the stem height reduction (Massa et al., 2008; Litvin et al., 2020), but the effects of intensity, spectrum, and temperature could not be separated with this experimental design. The calculated phytochrome photostationary state of the intracanopy trial was higher than the overhead fluorescent lighting alone; however, this was measured before planting, and the actual spectrum within the canopy will differ as plants grow around and enclose the LED arrays. Ideally, the spectrum of the intracanopy light would have been the same as the overhead light source to isolate light position as the primary factor being tested.
This research demonstrated that “Bronco” bush bean is an excellent PBP crop for high-density production within a vertical farm. While intracanopy LED lighting can be used to improve bush bean compatibility with current vertical farming practices (reduced height, increased yield, delayed abscission), it increases system complexity, hardware requirements, and energy consumption. Now that the benefits of intracanopy LED lighting for bush bean production have been established, future research should investigate intracanopy lighting application strategies to improve energy use efficiency further.
The raw data supporting the conclusions of this article will be made available by the authors, without undue reservation.
JS, MJ, TG, and MD contributed to the conception and design of the study. JS, MJ, and JH ran the plant growth trials and generated raw data. MJ, JH, and JS completed the required statistical analysis and wrote the first drafts of the manuscript. JS, TG, and MD wrote the final version of the manuscript. All authors contributed to manuscript revision, read, and approved the submitted version.
The research was funded by an NSERC, Collaborative Research and Development Grant project entitled “Optimization production parameters and nutritional composition of select food crops produced under controlled environment, high density, continuous production” with funding from Intravision Group AS and Intravision Light Systems Canada. CRDP J 528051-18.
Many thanks are due to the editor and reviewers for their valuable comments on refining this paper. This research was funded by an NSERC, Collaborative Research and Development Grant project entitled “Optimization production parameters and nutritional composition of select food crops produced under controlled environment, high density, continuous production” with funding from Intravision Group AS and Intravision Light Systems Canada. CRDP J 528051-18.
The authors declare that the research was conducted in the absence of any commercial or financial relationships that could be construed as a potential conflict of interest.
All claims expressed in this article are solely those of the authors and do not necessarily represent those of their affiliated organizations, or those of the publisher, the editors and the reviewers. Any product that may be evaluated in this article, or claim that may be made by its manufacturer, is not guaranteed or endorsed by the publisher.
Benke K., Tomkins B. (2017). Future food-production systems: Vertical farming and controlled-environment agriculture. Sustainability: Sci. Pract. Policy 13 (1), 13–26. doi: 10.1080/15487733.2017.1394054
Deram P., Lefsrud M., Orsat V. (2014). Supplemental lighting orientation and red-to-blue ratio of light-emitting diodes for greenhouse tomato production. HortScience 49, 448–452. doi: 10.21273/HORTSCI.49.4.448
Folta K. M., Maruhnich S. A. (2007). Green light: A signal to slow down or stop. J. Exp. Bot. 58 (12), 3099–3111. doi: 10.1093/jxb/erm130
Frantz J. M., Joly R. J., Mitchell C. A. (2000). Intracanopy lighting influences radiation capture, productivity, and leaf senescence in cowpea canopies. J. Am. Soc. Hortic. Sci. 125 (6), 694–701. doi: 10.21273/JASHS.125.6.694
Gómez C., Mitchell C. A. (2016). Physiological and productivity responses of high-wire tomato as affected by supplemental light source and distribution within the canopy. J. Am. Soc. Hortic. Sci. 141 (2), 196–208. doi: 10.21273/JASHS.141.2.196
Goto E. (2012). Plant production in a closed plant factory with artificial lighting. Acta Hortic. 956, 37–49. doi: 10.17660/ActaHortic.2012.956.2
Graham T., Wheeler R. (2016). Root restriction: A tool for improving volume utilization efficiency in bioregenerative life-support systems. Life Sci. Space Res. 9, 62–68. doi: 10.1016/j.lssr.2016.04.001
Joshi N. C., Ratner K., Eidelman O., Bednarczyk D., Zur N., Many Y., et al. (2019). Effects of daytime intra-canopy LED illumination on photosynthesis and productivity of bell pepper grown in protected cultivation. Scientia Hortic. 250, 81–88. doi: 10.1016/j.scienta.2019.02.039
Kozai T., Niu G. (2020). “Chapter 1–introduction,” in Plant factory, 2nd ed. (Elsevier), Amsterdam, Netherlands 3–6). doi: 10.1016/B978-0-12-816691-8.00001-7
Kozai T., Niu G., Takagaki M. (2015). Plant factory: An indoor vertical farming system for efficient quality food production (Cambridge: Academic Press). Available at: https://books.google.com/books?id=z-C7DwAAQBAJ.
Kumar K. G. S., Hao X., Khosla S., Guo X., Bennett N. (2016). Comparison of HPS lighting and hybrid lighting with top HPS and intra-canopy LED lighting for high-wire mini-cucumber production. Acta Hortic. 1134, 111–118. doi: 10.17660/ActaHortic.2016.1134.15
Litvin A. G., Currey C. J., Wilson L. A. (2020). Effects of supplemental light source on basil, dill, and parsley growth, morphology, aroma, and flavor. J. Am. Soc. Hortic. Sci. 145 (1), 18–29. doi: 10.21273/JASHS04746-19
Lork C., Cubillas M., Ng B. K. K., Yuen C., Tan M. (2020). “Minimizing electricity cost through smart lighting control for indoor plant factories,” in IECON 2020 The 46th Annual Conference of the IEEE Industrial Electronics Society Institute of Electrical and Electronics Engineers (Piscataway, New Jersey, USA). 297–302. doi: 10.1109/IECON43393.2020.9255061
Massa G. D., Kim H.-H., Wheeler R. M., Mitchell C. A. (2008). Plant productivity in response to led lighting. HortScience 43 (7), 1–6. doi: 10.21273/HORTSCI.43.7.1951
Papanikolaou Y., Fulgoni V. L. (2008). Bean consumption is associated with greater nutrient intake, reduced systolic blood pressure, lower body weight, and a smaller waist circumference in adults: results from the national health and nutrition examination survey 1999-2002. J. Am. Coll. Nutr. 27 (5), 569–576. doi: 10.1080/07315724.2008.10719740
Pettersen R. I., Torre S., Gislerà H. R. (2010). Effects of intracanopy lighting on photosynthetic characteristics in cucumber. Scientia Hortic. 125 (2), 77–81. doi: 10.1016/j.scienta.2010.02.006
Ruberti I., Sessa G., Ciolfi A., Possenti M., Carabelli M., Morelli G. (2012). Plant adaptation to dynamically changing environment: The shade avoidance response. Biotechnol. Adv. 30 (5), 1047–1058. doi: 10.1016/j.biotechadv.2011.08.014
Sager J. C., Smith W. O., Edwards J. L., Cyr K. L. (1988). Photosynthetic efficiency and phytochrome photoequilibria determination using spectral data. Trans. ASABE 31, 1882–1889. doi: 10.13031/2013.30952
Shang L., Gaudreau L., Martel M., Michaud D., Pepin S., Gosselin A. (2018). Effects of CO2 enrichment, LED inter-lighting, and high plant density on growth of nicotiana benthamiana used as a host to express influenza virus hemagglutinin H1. Horticult. Environment Biotechnol. 59 (5), 637–648. doi: 10.1007/s13580-018-0085-0
Stasiak M., Côté R., Grodzinski B., Dixon M. (1999). Light piping to the inner plant canopy enhances plant growth and increases O2, CO2, H2O and ethylene gas exchange rates. SAE Tech. Papers 7:1–6. doi: 10.4271/1999-01-2103
Tuarira M., Moses M. (2014). Effects of plant density and planting arrangement in green bean seed production. J. Global Innov. Agric. Soc. Sci. 2, 152–157. doi: 10.17957/JGIASS/2.4.516
Keywords: intracanopy lighting, stem height reduction, vertical farm, controlled environment, phaseolus vulgaris
Citation: Stoochnoff J, Johnston M, Hoogenboom J, Graham T and Dixon M (2022) Intracanopy lighting strategies to improve green bush bean (Phaseolus vulgaris) compatibility with vertical farming. Front. Agron. 4:905286. doi: 10.3389/fagro.2022.905286
Received: 26 March 2022; Accepted: 06 July 2022;
Published: 28 July 2022.
Edited by:
Sowbiya Muneer, VIT University, IndiaReviewed by:
Toyoki Kozai, Japan Plant Factory Association, JapanCopyright © 2022 Stoochnoff, Johnston, Hoogenboom, Graham and Dixon. This is an open-access article distributed under the terms of the Creative Commons Attribution License (CC BY). The use, distribution or reproduction in other forums is permitted, provided the original author(s) and the copyright owner(s) are credited and that the original publication in this journal is cited, in accordance with accepted academic practice. No use, distribution or reproduction is permitted which does not comply with these terms.
*Correspondence: Jared Stoochnoff, anN0b29jaG5AdW9ndWVscGguY2E=
Disclaimer: All claims expressed in this article are solely those of the authors and do not necessarily represent those of their affiliated organizations, or those of the publisher, the editors and the reviewers. Any product that may be evaluated in this article or claim that may be made by its manufacturer is not guaranteed or endorsed by the publisher.
Research integrity at Frontiers
Learn more about the work of our research integrity team to safeguard the quality of each article we publish.