 Huong T. X. Nguyen
 Matt Liebman
94% of researchers rate our articles as excellent or good
Learn more about the work of our research integrity team to safeguard the quality of each article we publish.
Find out more
ORIGINAL RESEARCH article
Front. Agron., 03 March 2022
Sec. Weed Management
Volume 4 - 2022 | https://doi.org/10.3389/fagro.2022.811359
This article is part of the Research TopicIntegrated Weed Management for Reduced Weed Infestations in Sustainable Cropping SystemsView all 11 articles
Corn- and soybean-dominated cropping systems create and maintain a favorable environment for summer annual weeds whose emergence and growth phenology are similar to these annual summer crops. Cropping system diversification can be an effective approach for controlling noxious weeds without increasing reliance on chemical herbicides. Diversification may be especially important for managing waterhemp, a dioecious, summer annual weed that is becoming increasingly prevalent in the US Corn Belt due to its life history characteristics and herbicide resistance profile. Compared to corn and soybean, alfalfa and oat emerge and establish earlier and are thus more competitive with warm-season weeds like waterhemp. Knowledge of vegetative and reproductive characteristics in a range of crop environments can be valuable for planning weed management strategies. However, most of the relevant characteristics for a population dynamics model were available in corn and soybean monocultures. We examined the relationship between waterhemp's aboveground mass and fecundity under four crop species' presence within three crop rotation systems: a 2-year sequence of corn and soybean; a 3-year sequence of corn, soybean, and oat intercropped with red clover; and a 4-year sequence of corn, soybean, oat intercropped with alfalfa, and alfalfa. All the rotation systems were treated with conventional or reduced rates of herbicides. We established eighteen linear equations to predict waterhemp's fecundity from dried aboveground mass in each crop and associated crop management program since measuring the latter allows for quicker estimation of fecundity compared to counting seeds on each individual plant. Rotation system and crop phase within rotation system had significant effects on all the response variables but weed control regime on some. The sex ratios at maturity were slightly female-biased in oat and alfalfa. Mature waterhemp plants were larger in corn and soybean than in oat and alfalfa. Oat and alfalfa were planted earlier than corn and soybean and successfully competed for resources against waterhemp despite the absence of herbicide or interrow cultivation. Frequent hay cuts in alfalfa served as physical weed control and contributed to suppressing waterhemp and other weeds substantially.
Cropping system diversification can contribute to the effective suppression of noxious weeds such as velvetleaf (Abutilon theophrasti Medik.) (Westerman et al., 2005), giant foxtail (Setaria faberi Herrm.) (Liebman et al., 2014), giant ragweed (Ambrosia trifida L.) (Liebman and Nichols, 2020), and other species while complementing the effects of herbicides and physical weed control practices (Davis et al., 2012; Weisberger et al., 2019). Much of the effectiveness of diversified cropping systems for weed suppression can be attributed to differences among crop species in their phenologies and the management techniques applied to them. Differences in crop phenology and diverse management tactics can lead to a net loss in weed seed population density in the soil seed bank (Liebman and Gallandt, 1997; MacLaren et al., 2020) resulting from reductions in weed fecundity and increased consumption of weed seeds by granivores. The present study focuses on fecundity and other relevant individual- and population-level reproductive and vegetative characteristics of waterhemp [Amaranthus tuberculatus (Moq.) J. D. Sauer] in three rain-fed cropping systems differing in crop species richness and management practices.
Waterhemp is a dioecious, summer annual, dicotyledonous species that has been listed as one of the five most noxious weeds in row crops in the US based on the number of times this species appears in the literature (Johnson et al., 2009) and by growers' concern across 22 states in the US (Prince et al., 2012). At least 54 waterhemp populations are resistant to up to five herbicide modes of action as of 2021 (Heap, 2021). As a dioecious species, populations of waterhemp are expected to express a 1:1 male:female ratio (Grant, 1959; Costea et al., 2005; Heneghan and Johnson, 2017). However, waterhemp has three characteristics that favor female-biasedness under conditions of no stress, according to a study of 243 dioecious species excluding waterhemp (Field et al., 2013): (1) the male sex is heterogametic (Montgomery et al., 2021); (2) the species has abiotic pollination and seed dispersal; and (3) the fruits are non-fleshy (Costea et al., 2005). A stressed waterhemp population tends to be female-biased, with up to ten females per male (Pratt and Clark, 2001), which is consistent with the general pattern of sexually differentiated stress tolerance in herbaceous plants (38 species, excluding waterhemp, Juvany and Munné-Bosch, 2015). The sex ratio plasticity of waterhemp suggests that a stressed population, which is characterized by low density, may allocate available resources to produce more female offspring as an effort to increase population density, as observed in its close relative, Palmer amaranth (A. palmeri) (Korres and Norsworthy, 2017; Mesgaran et al., 2019). Knowing how sex ratios may deviate from parity under different biotic and abiotic conditions could inform how a waterhemp population might progress from one generation to the next.
Waterhemp management is agronomically challenging because of a suite of life history characteristics, including a persistent soil seedbank (Davis, 2008), an extended seedling emergence pattern (Buhler and Hartzler, 2001), high relative growth rate, high fecundity (Heneghan and Johnson, 2017), and rapid herbicide resistance development (Tranel, 2021). One year of prolific seed production can replenish a declining seedbank with more seeds than existed in the seedbank (Davis, 2008). Failing to control waterhemp can cause up to 43% yield loss in soybean [Glycine max (L. Merr.)] (Hager et al., 2002) and 74% yield loss in corn (Zea mays L.) (Steckel and Sprague, 2004). The accumulated mass and density of a weed population reflect the relative competitiveness against crops and the favorability of the environment, which, in turn, could signal the effectiveness of weed management throughout the season. From a planning perspective, population density at maturity and plant fecundity are useful for estimating the density of new seeds produced and potentially added to the soil seedbank, and for adjusting weed management regimes accordingly (Buhler et al., 1997). Waterhemp's fecundity has been studied in corn and soybean crops (Menalled et al., 2004; Nordby and Hartzler, 2004) but not in other crops' or in an extended crop rotation system. Alfalfa (Medicago sativa L.), red clover (Trifolium pratense L.), and oat (Avena sativa L.) are cool-season crops that can be grown in rotation sequences with corn and soybean, whereas waterhemp is a summer annual weed. Compared to corn and soybean, alfalfa, red clover, and oat seedlings emerge and establish earlier. Alfalfa, red clover, and oat also emerge and establish earlier than a number of summer annual weed species, including waterhemp (Horak and Loughin, 2000; Buhler et al., 2008).
In the present study, we examined the population aboveground mass, density and sex ratio, and the relationship between waterhemp's female size and fecundity when the weed grew in association with five crop species (corn, soybean, oat, red clover, and alfalfa) arranged in three rain-fed cropping systems. Assessing waterhemp characteristics in the presence of oat intercropped with red clover or alfalfa and alfalfa grown as a sole crop as well as corn and soybean could help to fill the gap of information concerning waterhemp performance in extended rotations. We hypothesized that the sex ratio of a waterhemp population deviated from parity depending on the environment's favorability, but how much and to which direction the shift would occur would depend on how much the studied population was suppressed. In addition to informing management, individual- and population-level characteristics would provide useful contextual details for sex ratio comparison. Counting seeds for waterhemp fecundity assessment is time-consuming and laborious, so it would be convenient to extrapolate fecundity from plant mass. We hypothesized that regression relationships with which to predict fecundity from plant mass could be identified but that such relationships would differ among treatments, due to differences in crop phenology, crop-weed competition, and management practices.
Empirical measurements of waterhemp biomass and fecundity were made in 2018 at Iowa State University's Marsden Farm in Boone County, Iowa, USA, (42° 01'N, 93° 47'W, 333 m above sea level). The site description and crop management practices were described by Liebman et al. (2021). The experiment was initiated in 2001 on a 9-hectare field to compare the performance of three different crop rotations. In 2008, the experiment was reorganized to allow comparison of two contrasting weed management regimes in each of the three rotation systems. Since 2001, within each of the four blocks, plots were randomly assigned to one of the crop phases within one of three rotations.
In the present study, the experiment comprised of 72 experimental units, each 9 x 84 m. The experimental units (eu) were arranged in a randomized complete block split-plot design with four replications. The experiment was two-way factorial, with crop rotations comprising main plots and weed management regimes comprising split plots. In any year, all crop phases within the same rotation were present in different plots in the same replicate block to avoid confounding effects of the year with those of the treatments (Payne, 2015). The 2-year, 3-year, and 4-year crop sequences included in the study are shown in Table 1. The conceptual diagram for the experiment is shown in Figure 1. Alfalfa in this experiment was sown with oat. Oat was harvested for grain in 2018 and for hay in 2019 and alfalfa was retained over the winter and used as a hay crop the following year. Oat in our experiment was intended for grain harvest but was harvested for hay in 2019 due to severe hail damage to the crop and subsequent weed infestation. In the conventional weed management regime, herbicide was broadcast on the whole area that was planted to corn, whereas in the low herbicide regime, herbicide was applied in 38-cm bands over corn rows, and interrow areas were cultivated. Even though corn was the only crop that received the contrasting weed management regimes, all other crops were identified with the weed management applied to the corn phase (hereafter referred to as corn weed management), to which they followed. To improve weed control efficacy, herbicides used for soybean differed between 2018 and 2019. Details concerning crop genotypes and management practices are shown in Table 2.

Table 1. Crop phases of the three rotation systems present in a replicate block in 2018 and 2019.
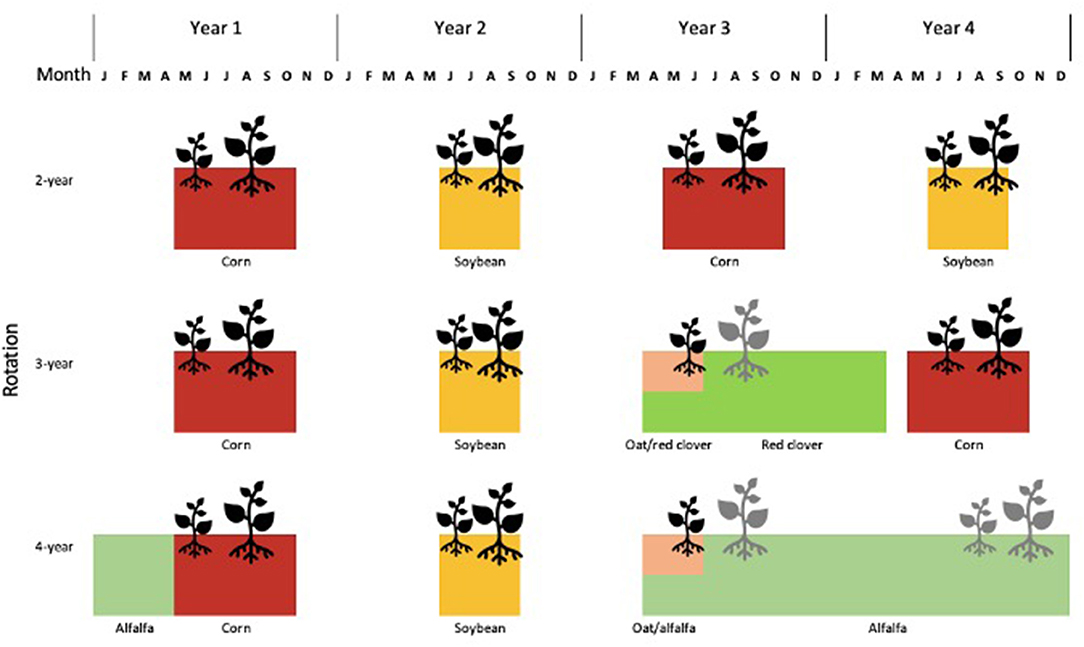
Figure 1. Conceptual diagram of the three rotation systems compared within the experiment. A cycle of four calendar years is shown. Crops are color-coded and displayed for the approximate months that they were present. Emergence and establishment of common waterhemp plants are illustrated with black symbols. Grey plants shown in oat intercropped with red clover or alfalfa's first year were physically controlled by crop harvest operations. Red clover was not harvested but kept as a living cover crop until senescence. Grey plants shown in alfalfa's second year were physically suppressed three to four times by hay harvest. Alfalfa's hay was harvested when approximately 5% of the plants flowered.
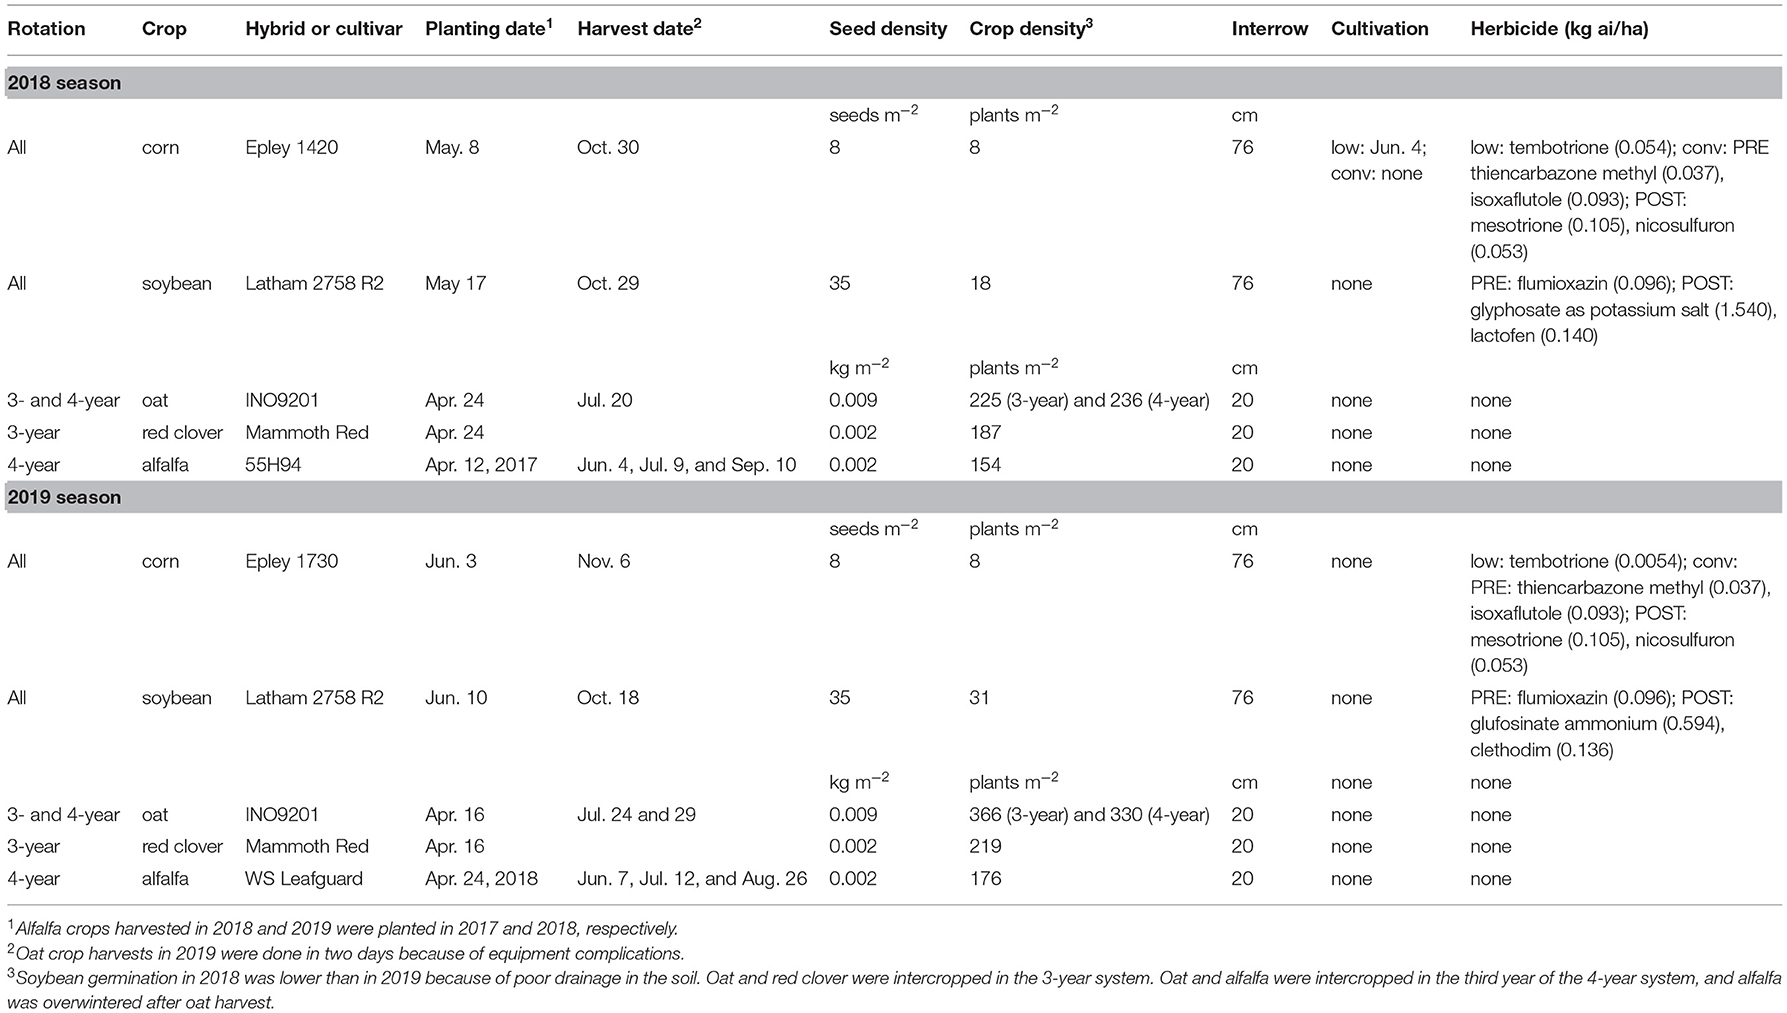
Table 2. Crop varieties, and dates and rates for management operations in 2018 and 2019.
Samples for all response variables were collected at least 3 m in from the border of each eu to avoid the possible edge effects. For each response variable, samples were collected from eight quadrats per eu to account for the patchiness of the weed populations. In 2018, the sex ratio was assessed by scouting the whole eu to obtain higher degrees of freedom. The date of sample collection and total sampled area for population- and individual-based measurements are shown in Table 3.
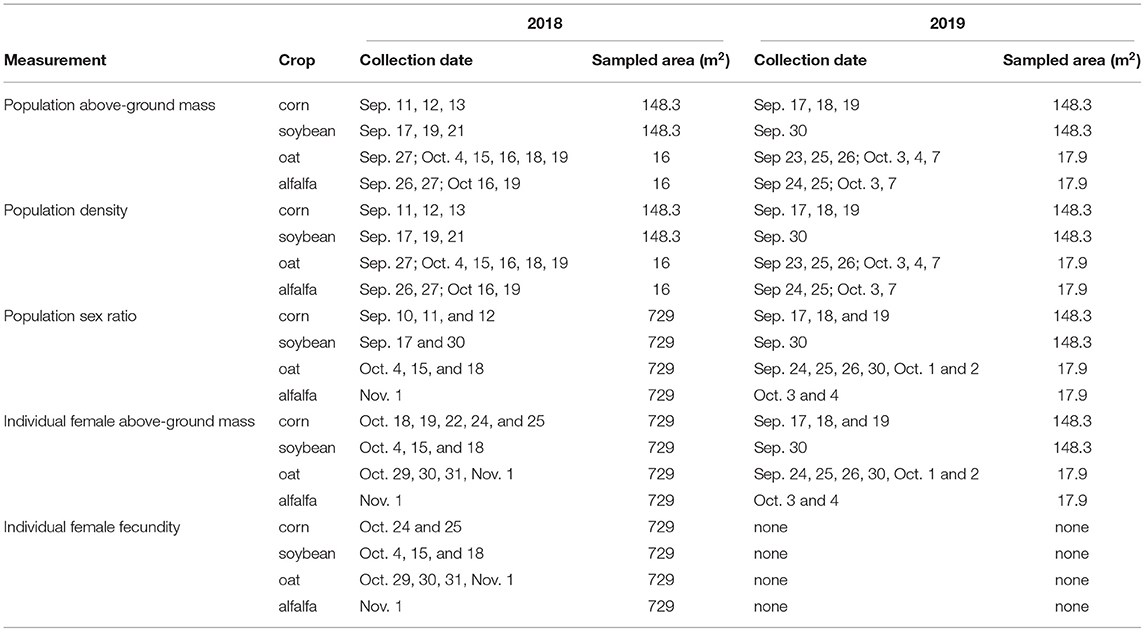
Table 3. Sampling dates and areas in 2018 and 2019.
In 2018, we scouted each eu until 100 or all the available plants (if the number of plants available was fewer than 100) were sexed to obtain greater degrees of freedom. We determined the sex of 252, 1999, 2426, and 895 waterhemp plants in alfalfa, oat, soybean, and corn, respectively. In 2019, eight quadrats per eu were marked at the beginning of the season and fixed until crop harvest for a census. Overall, 413, 1331, 0, and 553 waterhemp plants were sexed in alfalfa, oat, soybean, and corn, respectively. Zero observations in all the soybean eu's resulted from high herbicide efficacy, so the 2019 data was imputed (Appendix B).
The quadrats were randomly placed in a 4 x 2 grid at the sampling date and were non-overlapping with the 2019 census quadrats. The number of plants and the total dried biomass was tallied by eu.
The maturation of waterhemp seeds can take 20 days from pollination (Bell and Tranel, 2010). We harvested female waterhemp plants as close to crop harvest as possible to maximize the number of mature seeds on mother plants. Prior to sample collection in an eu, the whole area was visually inspected to estimate the difference in plant sizes. Specimens were then collected to best capture the range of within-eu variance. Given the time and labor constraints, we planned to collect eight intact plants from each eu, which was equivalent to 576 plants in total. Plants had to be identifiable per Uva et al. (1997). By the time the seeds reached maturity, 389 intact plants were collected and processed. No intact plants were collected from two eu's. Plant specimens were contained individually in tightly knitted fabric bags to prevent seed loss. The detailed procedure for seed cleaning and counting is provided in Appendix A.
Waterhemp survival in soybean was the greatest among all crops in the experiment in 2018 but the least in 2019 because of the use of different herbicide active ingredients. Given year-to-year differences in the sampling scheme and herbicide efficacy, the two years of data were thus analyzed separately for all the response variables in R version 4.1.2 (R Development Core Team, 2021). The data was curated with the tidyverse package version 1.3.1 (Wickham et al., 2019).
In 2018, 2% of the sex ratio data was missing due to zero observations in one eu, so complete case analysis, in which eu's of known sex ratio were retained while unknown sex ratio were removed from the data set, was used. In 2019, 22% of the sex ratio data was missing, so the data were imputed with predictive mean matching (PMM) method with the mice package version 3.14.0, (van Buuren and Groothuis-Oudshoorn, 2011) to optimally replace missing data with meaningful values without altering the observed sex ratios (Appendix B). Any model that involved the imputed data was fitted on all the produced (imputed) data sets, and the results were pooled (White et al., 2011).
Block was included in all models as a fixed factor because blocks were used to control the different field conditions across sections, and thus to reduce variance between eu's (Dixon, 2016). All the models were first fitted full, with block, corn weed management and crop identity, the interaction of corn weed management and crop identity, and covariates when applicable. Crop identities are the combination of crop species and the rotation to which they belonged. The within-eu variation was random and absorbed in the random error term in each model equation. The fitted models were linear (lm), generalized linear (glm), or generalized least square (gls) depending on the data structure and the nature of the response variable. The response and quantitative variables were appropriately transformed as needed to obtain homogeneous variances. Half of the minimum, non-zero value among all the observations was added to all the observations before ln-transformation to replace zeros. Response variables that were all non-zero were ln-transformed without adjustment. The goodness of fit of each model was assessed with diagnosis plots and mean squared error (MSE) of the variance.
The marginal means of each response variable were estimated with the emmeans function from the emmeans package version 1.7.2 (Lenth et al., 2022) to accommodate non-integer and unequal degrees of freedom among groups. Marginal means were averaged over blocks for post-ANOVA or post-ANCOVA contrasts and over factors whose effects were non-significant. Degree of freedom adjustment was done with the Satterthwaite method for the gls and Kenward-Roger method for the glm and lm models. ANCOVA (analysis of covariance) was applied to examine the effect of treatments on the relationship between female aboveground biomass and fecundity and between population sex ratio and biomass or density at maturity. ANCOVA combines regression and ANOVA (analysis of variance) to improve precision in mean estimation as compared to ANOVA estimation (Yang and Juskiw, 2011). Type III sums of squares error were calculated with the emmeans‘s joint_tests function to accommodate unbalanced data with interaction when occurred and to avoid misleading assessment of factors' effects based on their sequential order in the model.
A logistic regression model was fitted with the glm command and family = quasibinomial(link = logit) argument specification to analyze sex ratio. The quasibinomial family with follow-up F-test was used to accommodate overdispersion and logit link function transformed the sex ratio using the natural logarithm (ln) (Crawley, 2013).
where,
Sijk is the number of female plants among all the Nijk plants in block kth under crop identity ith and corn weed management jth,
is the logit transformation of Sijk,
μ is the overall mean female proportion, the intercept,
αi is the effect of the ith crop identity,
γj is the effect of the jth corn weed management,
bk is the block effect,
αiγj is the interaction effect of crop identity and corn weed management, and
ϵijk is the random error.
A linear regression model was fitted with the lm command on each of the two variables, population aboveground mass or stand density. The general model equation for these response variables is
where,
Yijk is either the ln-transformed population aboveground mass or ln-transformed stand density in block kth under crop identity ith and corn weed management jth, and other terms as defined in Equation (1).
The regression of sex ratio against population density or biomass was extended from the ANOVA of sex ratio Equation (1).
where,
δ is the effect of the covariate,
Dijk is the natural log-transformed population stand density in block kth under crop identity ith, and corn weed management jth, the covariate, and other terms as defined in Equation (1).
A compound symmetric linear regression model (with nlme package's gls command was first fitted for each of the response variables, individual aboveground mass and fecundity to accommodate negative variance that occurred when the within-eu variance was larger than the between-eu variance and correlated errors occurred within blocks (version 3.1-153, Pinhero et al., 2022). The corCompSymm argument in the gls command was specified by identifying unique combinations of block and treatment. The model in this exercise is of the same form as the model in Equation (2):
where,
Yijkl is either the ln-transformed aboveground mass or ln-transformed number of seeds of female plant lth in block kth under crop identity ith and corn weed management jth,
ϵijkl is the random error, and other terms as defined in Equation (1).
The regression of individual plant fecundity against individual plant aboveground mass was combined from the ANOVA of each (Equation 4) to establish a relationship between the two variables:
where,
Yijkl is the ln-transformed number of seeds of plant lth in block kth under crop identity ith and corn weed management
is the ln-transformed dried aboveground mass of plant lth in block kth under crop identity ith, and corn weed management jth, the covariate, and other terms as defined in Equation (1).
If the MSE of the model described in Equation (5) were smaller than that of the model described in Equation (4), the former model would be considered better for estimating the number of seeds produced by an individual waterhemp plant.
We tested the assumption that all the regression lines were parallel. Violation of this assumption required an individual regression line for each treatment. To test model robustness, samples in each treatment were pooled across four blocks and divided into four size-based subsets. Samples from each subset were then randomly placed into the testing and training sets using the 80 testing : 20 training ratio. A model was considered to perform well if the data points in the testing set blended well with the data points from the training set. A robust model could be used to predict plant fecundity with new biomass data.
Using ggResidpanel version 0.3.0 (Goode and Rey, 2019), boot version 1.3-28 (Canty and Ripley, 2021), and two customized functions for model diagnosis, no predictable pattern in the plots of residuals vs. predicted values suggests that the analysis models fit the data well (Details are provided in Nguyen and Liebman, 2022a). In all rotations, all the crop yields were comparable to those of Iowa and Boone County where the experiment is situated (Hunt et al., 2020; Nguyen and Liebman, 2022b). Tables were compiled with kableExtra version 1.3.4 (Zhu et al., 2021). Figures were made with emmeans version 1.7.2 (Lenth et al., 2022) and ggplot2 version 3.3.5 (Wickham et al., 2016).
In both years, population aboveground mass and stand density were strongly influenced by crop identity (Table 4). The rotation system in which a crop was grown also affected population aboveground mass and stand density, although not consistently between years (Table 5).

Table 4. ANOVAs of crop identity and corn weed management effects on waterhemp population aboveground mass and stand density.
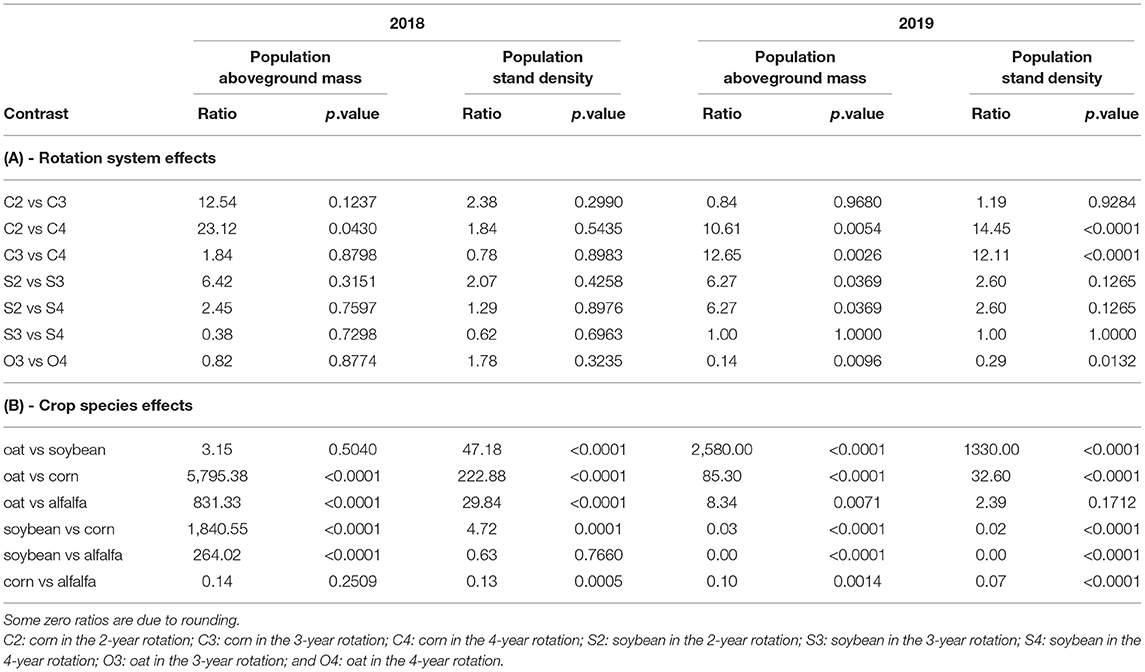
Table 5. Rotation system and crop species effects on population aboveground mass and stand density.
In 2018, population aboveground mass in the same crop species was comparable across rotations except for corn grown in the 2-year (C2) vs. 4-year rotation (C4) (p-value = 0.043). In 2019, population aboveground mass in the same crop was different across rotations, except for corn in the 2-year (C2) vs. 3-year rotation (C3) (p-value = 0.968) and soybean in the 3-year (S3) vs. 4-year rotation (S4) (p-value = 1). Averaged across rotations, population aboveground mass was comparable in 2018 for corn vs. alfalfa (p-value = 0.2509) and soybean vs. oat (p-value = 0.504), but 10- to 5795.38-fold different in the other ten pairs of comparison (p-values <0.01).
In 2018, population stand density in the same crop species was comparable across the rotations. In 2019, population stand density in the same crop species was comparable for soybean (p-values = 0.1256 and 1) and C2 vs. C3 (p-value = 0.9284), but significantly different for the other corn comparisons and for oat in the 3-year (O3) vs. 4-year rotation (O4). Averaged over rotations, population stand density was comparable in 2018 between soybean and alfalfa (p-value = 0.766), but 5- to 1330-fold different in the other eight pairs of comparison (p-values <0.001).
In 2018, population aboveground mass was the highest in soybean and oat (Figure 2A) because soybean weed management was ineffective and herbicide was intentionally not applied in oat. The legacy of an ineffective weed management program in 2018 soybean plots was observed in 2019 oat plots where population aboveground mass and stand density were the highest among all the crop identities (Figure 2B). High stand density in 2019 oat plots was also due to uneven oat establishment. The change in 2019 in weed management for soybean substantially reduced the waterhemp pressure on soybean (Figures 2B,D).
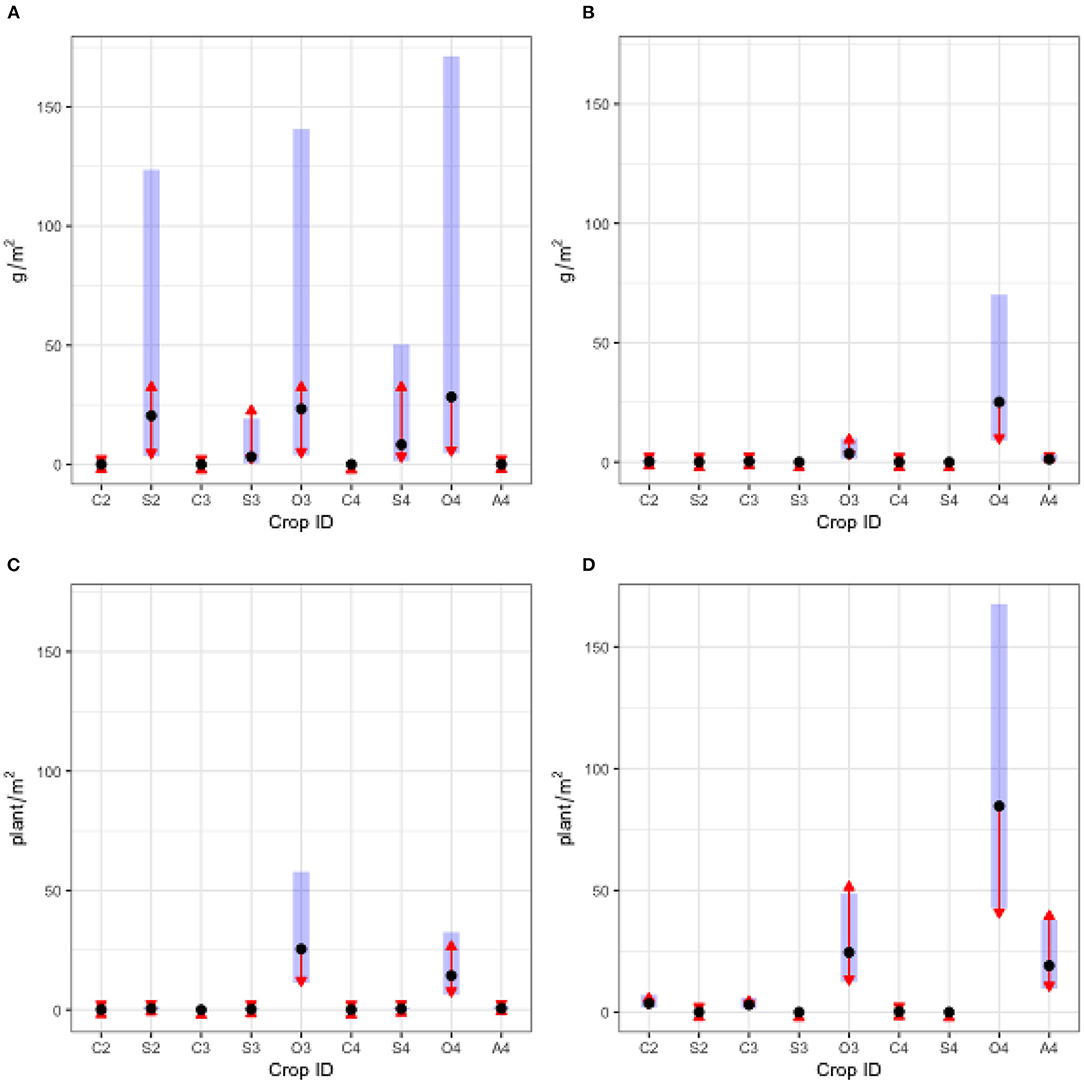
Figure 2. Waterhemp population aboveground mass and stand density averaged over corn weed managements. The abbreviations on the x-axis are crop identities, which are the combinations of the first letter in crop species names and the rotation to which the crops belonged (C2, corn in the 2-year rotation; C3, corn in the 3-year rotation; C4, corn in the 4-year rotation; S2, soybean in the 2-year rotation; S3, soybean in the 3-year rotation; S4, soybean in the 4-year rotation; O3, oat in the 3-year rotation; O4, oat in the 4-year rotation; and A4, alfalfa in the 4-year rotation). The black dots are estimated marginal means. The blue bars are 95% confidence intervals. The red arrows reflect the comparison among means. Overlapping arrows indicate non-significant differences. (A), 2018 population above ground mass; (B), 2019 population above ground mass; (C), 2018 population stand density; (D), 2019 population stand density.
Population stand density was included to improve the precision of estimates of population sex ratios (Tables 6A,C). The population sex ratio in 2018 differed significantly among treatments, at different population stand densities within each treatment (p-value = 0.0155, Figure 3 and Table 6). Therefore, sex ratios in the same treatment were evaluated at four population densities, i.e., 1, 5, 50, and 500 plants/m2, to illustrate that three-way interaction (Figure 3). Female-biasedness was more likely if a waterhemp population was grown in oat and alfalfa. None of the waterhemp populations grown in corn and soybean expressed gender biasedness. It is unclear whether the corn weed management program had a significant effect on gender biasedness given the magnitude of the variance (Figure 3).
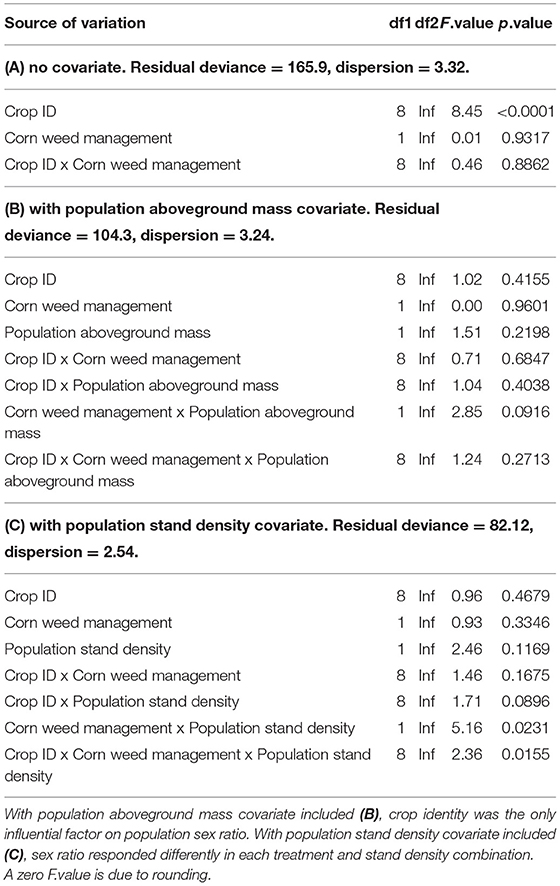
Table 6. ANOVAs of crop identity, herbicide, and covariate effects on population sex ratio using 2018 data.
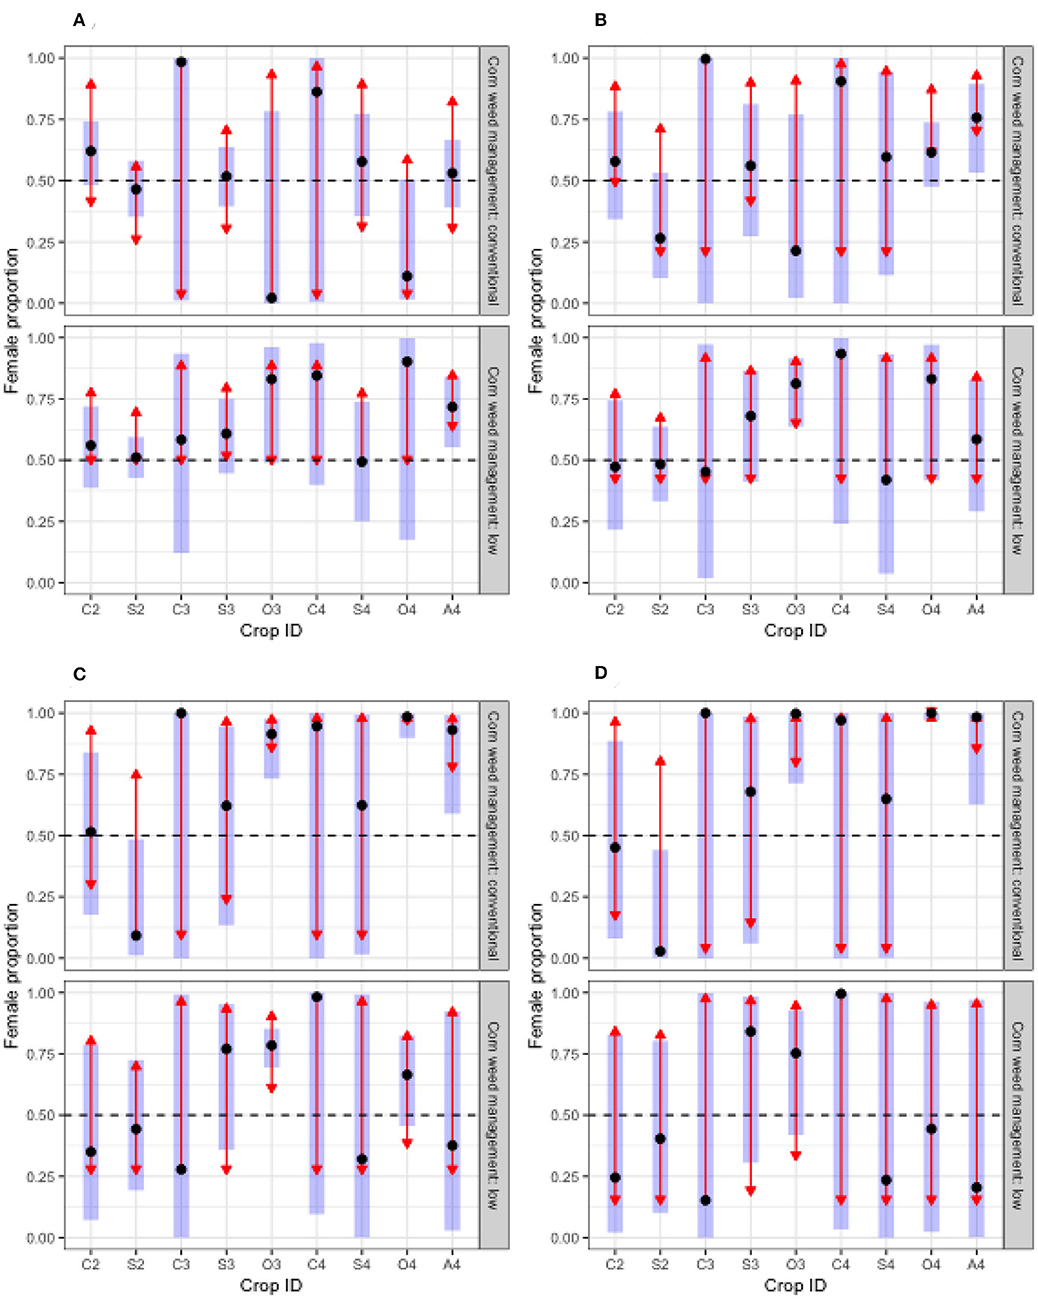
Figure 3. Waterhemp population sex ratios under 54 combinations of experimental treatments and population stand densities. The abbreviations on the x-axis are crop identities, which are the combinations of the first letter in crop species names and the rotation to which the crops belonged (C2, corn in the 2-year rotation; C3, corn in the 3-year rotation; C4, corn in the 4-year rotation; S2, soybean in the 2-year rotation; S3, soybean in the 3-year rotation; S4, soybean in the 4-year rotation; O3, oat in the 3-year rotation; O4, oat in the 4-year rotation; and A4, alfalfa in the 4-year rotation). The dashed lines mark sex ratio parity. The black dots are estimated marginal means. The blue bars are 95% confidence intervals. The red arrows reflect the comparisons among means. Overlapping arrows indicate non-significant differences. (A), 1 plants/m2; (B), 5 plants/m2; (C), 50 plants/m2; (D), 500 plants/m2.
We defined a useful imputed data set to be a set that resulted in fully estimable marginal means for sex ratio comparison across all treatments, which was achievable with non-zeros in female and male categories in at least one replication among the four blocks for the missing observations in the 2019 original sex data. Unlike the 2018 data, the sex ratio in 2019 was analyzed without the covariates because none of the covariates improved the goodness of fit for the analysis model. With m = 24, five imputed data sets were useful (Appendix B). The significance and influence of treatment factors and their interaction in the imputed data sets for waterhemp sex ratio in 2019 were consistent with those of the 2018 data (Figure 4). In 21 out of 24 sets, sex ratio in 2019 was affected by crop identity (Figures 4B,C). Female biasedness was observed in oat and alfalfa but not in corn and soybean (Figure 4A).

Figure 4. Waterhemp population sex ratios under nine crop identities averaged over two Corn weed management regimes using 2019's 24 imputed data sets (A). The abbreviations on the (A)'s sections are crop identities, which are the combinations of the first letter in crop species names and the rotation to which the crops belonged (C2, corn in the 2-year rotation; C3, corn in the 3-year rotation; C4, corn in the 4-year rotation; S2, soybean in the 2-year rotation; S3, soybean in the 3-year rotation; S4, soybean in the 4-year rotation; O3, oat in the 3-year rotation; O4, oat in the 4-year rotation; and A4, alfalfa in the 4-year rotation). The dashed lines mark sex ratio parity in (A) and level of confidence in (B), respectively. The blank spaces are nonestimable values. The triangulars and circles in (A) represent female-biased and even populations assessed at alpha = 0.05, respectively. F-ratios for sources of variation are shown in (C).
Individual female aboveground mass and fecundity were affected by rotation, crop species, and corn weed management (Table 7). Crop identity was more influential on female aboveground mass and fecundity than corn weed management regime, but the effect of crop identity differed between corn weed management regimes (Tables 8A,B). Differences in relative female size and fecundity across rotation by herbicide treatments were attributed to the relative size and fecundity differences when the waterhemp populations grew in different crops' presence.
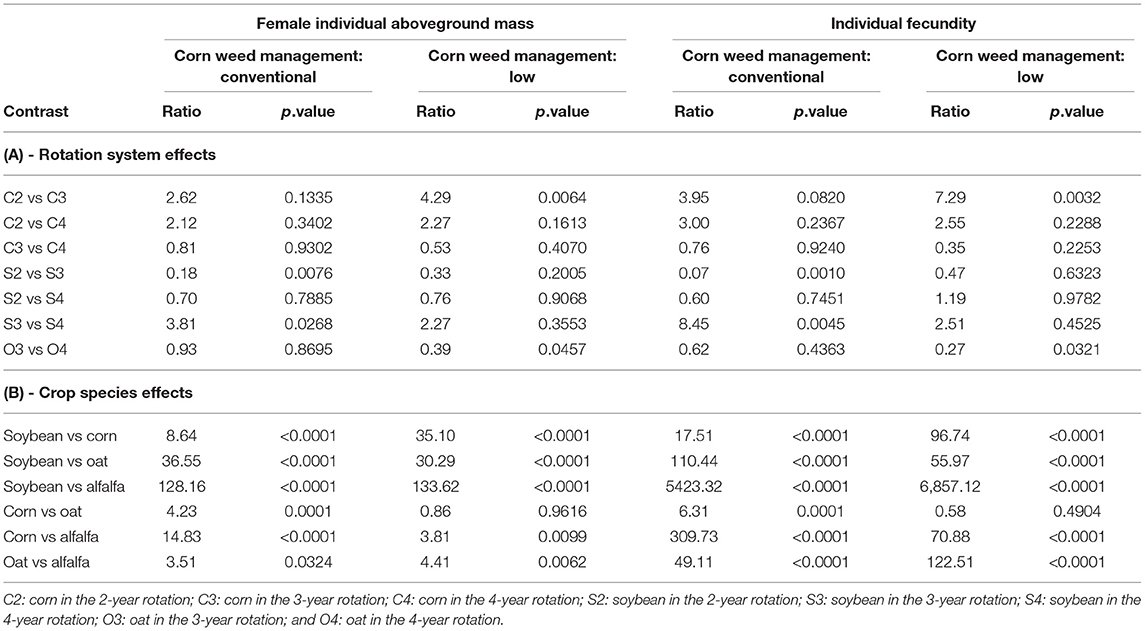
Table 7. Rotation system and crop species effects on individual female aboveground mass and fecundity.
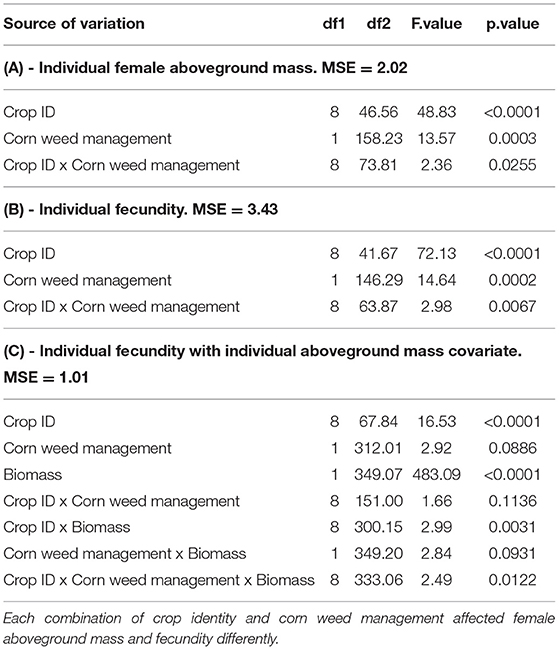
Table 8. ANOVAs for the effects of crop identity, corn weed management, and female aboveground mass on individual female aboveground mass (A), fecundity (B), and fecundity with aboveground mass covariate (C).
Individual female aboveground mass was comparable in most pairwise comparison of the same crop species in different rotations, except S2 vs. S3 (p-value = 0.0076) and S3 vs. S4 (p-value = 0.0268) that followed corn under conventional weed management and C2 vs. C3 (p-value = 0.0064) under low weed management. Averaged over rotations, individual female aboveground mass was 3.51- to 133.62-fold different across each pair of comparison (p-values <0.05), except for corn under low weed management vs. the succeeding oat (p-value = 0.9616).
Individual fecundity was comparable in most pairwise comparison of the same crop species in different rotations, except S2 vs. S3 (p-value = 0.001) and S3 vs. S4 (p-value = 0.0046) that followed corn under conventional weed management and C2 vs. C3 under low weed management (p-value = 0.0032), and O3 vs. O4 that followed corn under low weed management (p-value = 0.0321). Averaged over rotations, individual fecundity was comparable between corn under low herbicide and oat in the same system (p-value = 0.4904) but was 6.31- to 6857.12-fold different in other pairs of comparison (p-values ≤ 0.0001).
Since the treatment effects were statistically significant for both female aboveground mass and fecundity (Table 8), we proceeded with finding the slopes and intercepts for each linear regression of fecundity against biomass. Different slopes were specified by including interaction terms between the covariate and treatment factors. A regression slope for each treatment was necessary. The training and testing sets' data points were well mingled indicated that the established equations were robust (Figure 5). That the equations in Table 9 could predict waterhemp fecundity parsimoniously from dried aboveground mass using the relevant context of crop and crop management. The presented means and SEs for the estimated intercepts and slopes were established from the whole data set.
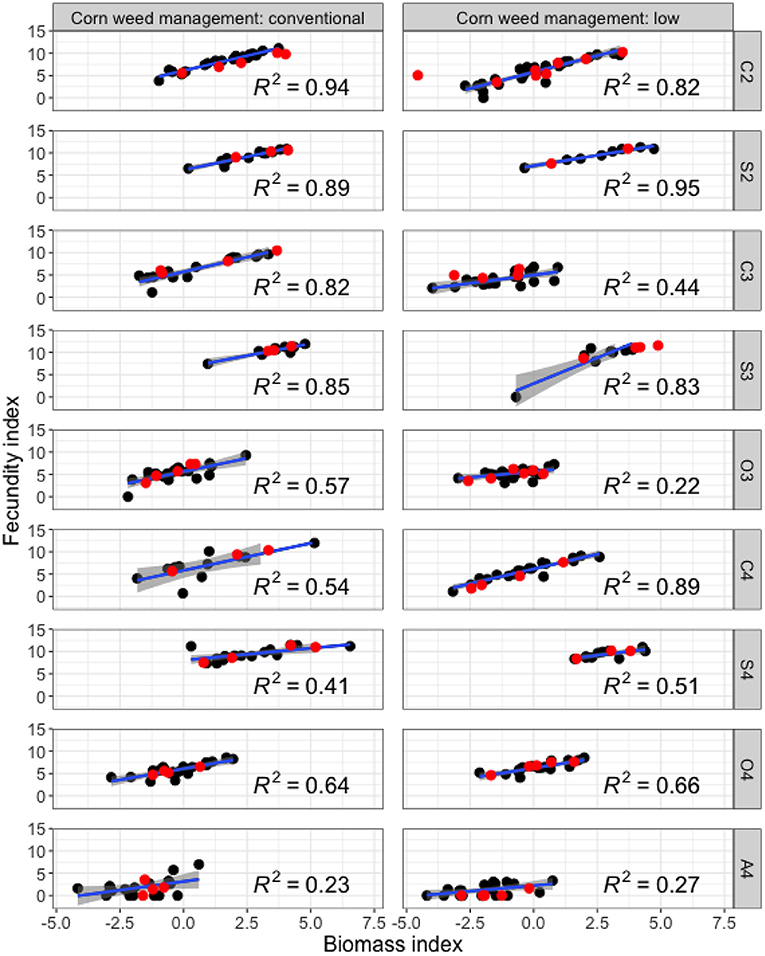
Figure 5. Estimation of fecundity using aboveground mass. The abbreviations on the right-hand-side y-axis are crop identities, which are the combinations of the first letter in crop species names and the rotation to which the crops belonged (C2, corn in the 2-year rotation; C3, corn in the 3-year rotation; C4, corn in the 4-year rotation; S2, soybean in the 2-year rotation; S3, soybean in the 3-year rotation; S4, soybean in the 4-year rotation; O3, oat in the 3-year rotation; O4, oat in the 4-year rotation; and A4, alfalfa in the 4-year rotation). The black and red dots are values from training and testing sets, respectively. Each regression line was plotted for one crop identity by herbicide treatment using the training set. R2 values were calculated from the training set only, and thus, were slightly different from those in Table 9. Biomass index = ln(gram biomass + 0.005) and Fecundity index = ln (seeds + 1).
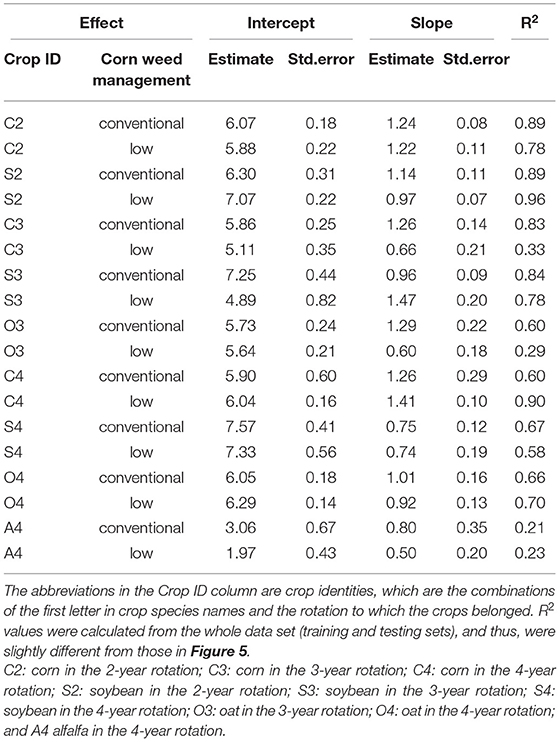
Table 9. Means and SEs for estimated linear regression of waterhemp fecundity index [ln(seeds + 1)] vs. biomass index [ln(gram + 0.005)] intercepts and slopes, accompanied by the R2 values of each equations.
Results of this study indicate that waterhemp was affected by crops and crop management in multiple ways, including a reduction in individual biomass and fecundity to the point of non-existence as occurred in 2019 soybean plots. Despite the 2018 and 2019 data being overdispersed, which resulted in high residual deviance, the significance of treatment effects was consistent. Crop identity was the most influential factor for all responses. Some covariation relationships were observed: population stand density affected sex ratio and female aboveground mass was a reliable predictor for fecundity.
Waterhemp is a small-seeded species that is more sensitive to environmental stress than larger-seeded species (Harbur and Owen, 2004). In the present study, the number of stress and mortality factors likely increased as crop diversity increased temporally and spatially (Martin and Felton, 1993). Stress and mortality factors arose from the strategic cropping system designs that employ crops of different phenology, management requirements, and relative competitiveness with weeds (Liebman and Janke, 1990; Liebman and Dyck, 1993).
The two summer annual row crops in our study, corn and soybean, differed from the cool season and perennial crops, oat, red clover, and alfalfa with regard to the strongest selection pressure against weeds: herbicides. In corn (C2, C3, and C4), weeds were controlled with broadcast herbicide (conventional), or a combination of banded herbicide (38-cm strips on top of crop rows) and interrow cultivation. In soybean (S2, S3, and S4), weeds were controlled with broadcast herbicide as in conventional corn, with different active ingredients. In contrast, in the O3, O4, and A4 treatments, no herbicide or cultivation was applied, but those three crops were strategically introduced to the 3-year and 4-year rotations for their potential allelopathic and shading effects (Liebman and Dyck, 1993; Singh et al., 2003). The spring establishment of O3 and O4 and overwintering of A4 treatments gave the crops a headstart for resource competition against waterhemp, a summer annual weed that emerged later (Hartzler et al., 2004). The timing of oat harvest in late July matched waterhemp's early reproductive stage (Horak and Loughin, 2000; Buhler et al., 2008) and the resulting mechanical damage at this stage reduced the weed's reproductive potential. Intercropping oat and alfalfa can produce stronger weed suppression than might be achieved by each species grown as a sole crop (Lanini et al., 1992), whereas the effects of intercropping oat with red clover can be more variable (Samson et al., 1990). For established alfalfa in the 4-year rotation, three to four hay cuts per crop season also served as a significant means of physical control and to reduce waterhemp reproductive potential.
High waterhemp population stand densities in oat resulted from highly productive plants in the preceding corn and soybean phases of the rotation and signaled abundant replenishment of soil seedbanks. Dyke and Barnard (1976) found that a clover and cereal intercrop substantially reduced weed emergence whereas Heggenstaller et al. (2006) found that a triticale (x Triticosecale Wittmack) and red clover intercrop increased weed seedling recruitment. Taking these findings with the present study's observation that higher waterhemp population stand densities and lower waterhemp aboveground mass were found in small grain and forage crops than in row crops, it is possible that cold-tolerant crops can be used to stimulate and induce fatal germination to deplete the soil seedbank (Davis and Liebman, 2003; Gallandt et al., 2005). Eventually, as more mortality and stress factors are imposed on emerged weeds via various control methods, such as allelopathy and mechanical damage via crop harvest, those emerged plants might be expected to contribute fewer seeds to the soil seedbank.
Waterhemp populations in three of the treatments, O3, O4, and A4, were slightly female-biased. Waterhemp populations in other treatments were even in sex ratio, which might be attributed to a more stressful conditions in small grain and forage crops than in row crops. A larger data set might help reducing the variance in sex ratio and provide a clearer understanding of the effect of corn weed management program on waterhemp sex ratio in subsequent oat and alfalfa phases. Systematic analysis is needed to identify the contribution of each stressor on waterhemp development and population dynamics. The 2019 sex ratio data were imputed without 2018 input but returned consistent conclusions on treatment effects, as compared to 2018. This consistency suggests an acceptable precision of the analysis model and the imputation algorithm. Since pmm seeks to fill in missing values with placeholders without changing the overall mean, it is reasonable to assume that the sex ratios in soybean eu's were even. The high herbicide efficacy in soybean was the strongest selection pressure on the exposed waterhemp populations.
Our analysis indicated that female aboveground mass could be used to predict fecundity parsimoniously. The strong evidence of the significant interaction effect of weed management regime and crop identity on waterhemp fecundity justified the use of separate equations for each treatment. Since different sources of stress were introduced in the small grain and forages than in row crops, we attributed female-biasedness and lower fecundity in forages than in row crops to female herbaceous plants outperforming males under abiotic and biotic stresses (Juvany and Munné-Bosch, 2015). The stand density and sex ratio data in this study does not provide sufficient information to establish a relationship between them, as was established between individual female biomass and fecundity. It would be helpful to explore the population stand density and sex ratio relationship with a bigger data set.
In the present study, using mother plant reproduction potential (aboveground mass) gives a rough estimate of the number of seeds being added to the soil seedbank. Additionally, the total number of seeds produced at the end of the season in each treatment depended on the parent plant density and population sex ratio. The possibility of post-harvest seed loss due to seed predators under different ground cover conditions adds to the complexity of seedbank dynamics. Red clover that remained after oat harvest and alfalfa living mulch may enhance granivore activities (Davis and Liebman, 2003; Gallandt et al., 2005). Heggenstaller et al. (2006) found increased predation of velvetleaf (Abutilon theophrasti Medik) and giant foxtail (Setaria faberi Herrm) seeds in more diverse cropping systems than in shorter corn-soybean rotations. Overwintering crops such as alfalfa delayed pigweed (Amaranthus quitensis H.B.K.) emergence (Huarte and Arnold, 2003) and can exude allelochemicals for weed suppression (Miller, 1996). Compared to the bare ground after corn and soybean production, the post-harvest environment in oat and alfalfa may induce more seed loss due to predation (Gallandt et al., 2005). Waterhemp was not included in the Heggenstaller et al. (2006) study, but waterhemp seeds are preferred over other species' seeds by field crickets and ground beetles (van der Laat et al., 2015) so it is likely that the small grain and forage crops in the present study enhanced waterhemp seed predation.
The key take-away messages from this present study are that: (1) waterhemp reproductive potential can be effectively suppressed without herbicide with the integration of cool season crops into the cropping system and (2) female waterhemp plants may have higher survival rate than males under the same conditions, which was reflected by higher female: male ratios.
More investigation is needed to determine how soil seedbank dynamics contribute to population dynamics in different scenarios, such as how female-biasedness could be potentially helpful to replenish a seedbank, whether sexual unevenness in a generation causes sexual unevenness in freshly produced seeds, and how those biases contribute to long-term population changes and competitiveness against crops. In the near-total control situation as occurred in the 2019 soybean plots, as the number of fresh seeds added to the soil seedbank can be considered negligible, other factors, such as sex ratio, population stand density, and plant size are of less practical concern. A more practical investigation would be to see how different levels of control efficacy translate into medium- and long-term population changes, because no herbicide is totally invulnerable to the evolution of resistance in weed populations. It would also be useful to see how populations would change once resistance occurred and how various control methods might contribute to resistance management.
The original contributions presented in the study are included in the article/Supplementary Material, further inquiries can be directed to the corresponding author/s. The data from this present study is available at doi: 10.25380/iastate.18190784.
ML conceptualized and designed the experiment. HN collected the data and wrote the original draft of the manuscript. ML and HN finalized the manuscript. Both authors contributed to the article and approved the submitted version.
HN received financial support from the Robert A. Sloan Scholarship Endowment and the H.A. Wallace Chair for Sustainable Agriculture at Iowa State University.
The authors declare that the research was conducted in the absence of any commercial or financial relationships that could be construed as a potential conflict of interest.
All claims expressed in this article are solely those of the authors and do not necessarily represent those of their affiliated organizations, or those of the publisher, the editors and the reviewers. Any product that may be evaluated in this article, or claim that may be made by its manufacturer, is not guaranteed or endorsed by the publisher.
The authors thank Matt Woods, Mike Fiscus, and the Iowa State University's Agronomy Research Farm crew for field management; Jessica Juarez-Morales, Elizabeth Oys, Ana Poznanski, Andrew Riehl, Angela Soto-Saenz, and Wyatt Westfall for field and laboratory assistance; Alan Gaul and Iowa State University's Seed Laboratory student assistants and interns for seed cleaning laboratory space, guidance, and technical assistance; Philip Dixon and Dean Adams for data analysis assistance; Russ Lenth and other Stackoverflow community members for answering HN coding questions; Lisa Schulte-Moore, Micheal Owen, and Mark Gleason for reviewing the manuscript; Overleaf staff for  assistance in compiling the manuscript; and two reviewers and the subject editor for their valuable comments.
The Supplementary Material for this article can be found online at: https://www.frontiersin.org/articles/10.3389/fagro.2022.811359/full#supplementary-material
Bell, M. S., and Tranel, P. J. (2010). Time requirement from pollination to seed maturity in waterhemp (Amaranthus tuberculatus). Weed Sci. 58, 167–173. doi: 10.1614/WS-D-09-00049.1
Buhler, D. D., and Hartzler, R. G. (2001). Emergence and persistence of seed of velvetleaf, common waterhemp, woolly cupgrass, and giant foxtail. Weed Sci. 49, 230–235. doi: 10.1614/0043-1745(2001)049[0230:EAPOSO]2.0.CO;2
Buhler, D. D., Hartzler, R. G., and Forcella, F. (1997). Implications of weed seedbank dynamics to weed management. Weed Sci. 45, 329–336.
Buhler, D. D., Hartzler, R. G., Forcella, F., and Gunsolus, J. (2008). Relative Emergence Sequence for Weeds of Corn and Soybeans. Iowa State University, University Extension. Available online at: https://www.leopold.iastate.edu/files/pubs-and-papers/2008-09-relative-emergence-sequence-weeds-corn-and-soybeans.pdf
Canty, A., and Ripley, B. (2021). Boot: bootstrap functions (originally by angelo canty for S) (Version 1.3-28). Available online at: https://CRAN.R-project.org/package=boot
Costea, M., Weaver, S. E., and Tardif, F. J. (2005). The biology of invasive alien plants in Canada. 3. Amaranthus tuberculatus (Moq.) Sauer var. rudis (Sauer) Costea & Tardif. Can. J. Plant Sci. 85, 507–522. doi: 10.4141/P04-101
Crawley, M. J. (2013). “Proportion data,” in The R Book. 2nd Edn (West Sussex: Wiley), 628–649. Available online at: https://learning.oreilly.com/library/view/the-r-book/9781118448960/OEBPS/9781118448960_epub_ch_15.htm
Davis, A. S. (2008). Weed seed pools concurrent with corn and soybean harvest in Illinois. Weed Sci. 56, 503–508. doi: 10.1614/WS-07-195.1
Davis, A. S., Hill, J. D., Chase, C. A., Johanns, A. M., and Liebman, M. (2012). Increasing cropping system diversity balances productivity, profitability and environmental health. PLoS ONE 7, e47149. doi: 10.1371/journal.pone.0047149
Davis, A. S., and Liebman, M. (2003). Cropping system effects on giant foxtail (Setaria faberi) demography: I. Green manure and tillage timing. Weed Sci. 51, 919–929. doi: 10.1614/P2002-133A
Dixon, P. (2016). “Should blocks be fixed or random?” in Conference on Applied Statistics in Agriculture (Manhattan). doi: 10.4148/2475-7772.1474
Dyke, G. V., and Barnard, A. J. (1976). Suppression of couch grass by Italian ryegrass and broad red clover undersown in barley and field beans. J. Agric. Sci. 87, 123–126.
Field, D. L., Pickup, M., and Barrett, S. C. H. (2013). Comparative analyses of sex-ratio variation in dioecious flowering plants. Evolution 67, 661–672. doi: 10.1111/evo.12001
Gallandt, E. R., Molloy, T., Lynch, R. P., and Drummond, F. A. (2005). Effect of cover-cropping systems on invertebrate seed predation. Weed Sci. 53, 69–76. doi: 10.1614/WS-04-095R
Goode, K., and Rey, K. (2019). ggResidpanel: panels and interactive versions of diagnostic plots using 'ggplot2.' R package version 0.3.0. Available online at: https://CRAN.R-project.org/package=ggResidpanel
Grant, W. F. (1959). Cytogenetic studies in Amaranthus: I. Cytological aspects of sex determination in dioecious species. Can. J. Bot. 37, 413–417.
Hager, A. G., Wax, L. M., Stoller, E. W., and Bollero, G. A. (2002). Common waterhemp (Amaranthus rudis) interference in soybean. Weed Sci. 50, 607–610. doi: 10.1614/0043-1745(2002)050[0607:CWARII]2.0.CO;2
Harbur, M. M., and Owen, M. D. K. (2004). Light and growth rate effects on crop and weed responses to nitrogen. Weed Sci. 52, 578–583. doi: 10.1614/WS-03-115R1
Hartzler, R. G., Battles, B. A., and Nordby, D. (2004). Effect of common waterhemp (Amaranthus rudis) emergence date on growth and fecundity in soybean. Weed Sci. 52, 242–245. doi: 10.1614/WS-03-004R
Heap. (2021). Herbicide Resistant Tall Waterhemp Globally (Amaranthus tuberculatus (=A. Rudis)). The International Survey of Herbicide Resistant Weeds. Available online at: http://www.weedscience.org/Summary/Species.aspx (accessed February 23, 2021).
Heggenstaller, A. H., Menalled, F. D., Liebman, M., and Westerman, P. R. (2006). Seasonal patterns in post-dispersal seed predation of Abutilon theophrasti and Setaria faberi in three cropping systems. J. Appl. Ecol. 43, 999–1010. doi: 10.1111/j.1365-2664.2006.01198.x
Heneghan, J. M., and Johnson, W. G. (2017). The growth and development of five waterhemp (Amaranthus tuberculatus) populations in a common garden. Weed Sci. 65, 247–255. doi: 10.1017/wsc.2016.20
Horak, M. J., and Loughin, T. M. (2000). Growth analysis of four Amaranthus species. Weed Sci. 48, 347–355. doi: 10.1614/0043-1745(2000)048[0347:GAOFAS]2.0.CO;2
Huarte, H. R., and Arnold, R. L. B. (2003). Understanding mechanisms of reduced annual weed emergence in alfalfa. Weed Sci. 51, 876–885. doi: 10.1614/P2002-140
Hunt, N. D., Liebman, M., Thakrar, S. K., and Hill, J. D. (2020). Fossil energy use, climate change impacts, and air quality-related human health damages of conventional and diversified cropping systems in Iowa, USA. Environ. Sci. Technol. 54, 11002–11014. doi: 10.1021/acs.est.9b06929
Johnson, W. G., Davis, V. M., Kruger, G. R., and Weller, S. C. (2009). Influence of glyphosate-resistant cropping systems on weed species shifts and glyphosate-resistant weed populations. Eur. J. Agron. 31, 62–172. doi: 10.1016/j.eja.2009.03.008
Juvany, M., and Munné-Bosch, S. (2015). Sex-related differences in stress tolerance in dioecious plants: a critical appraisal in a physiological context. J. Exp. Bot. 66, 6083–6092. doi: 10.1093/jxb/erv343
Korres, N. E., and Norsworthy, J. K. (2017). Palmer amaranth (Amaranthus palmeri) demographic and biological characteristics in wide-row soybean. Weed Sci. 65, 491–503. doi: 10.1017/wsc.2017.12
Lanini, W. T., Orloff, S. B., Vargas, R. N., and Orr, J. P. (1992). Fight weeds and increase forage: Using oats as a companion crop in establishing alfalfa. California Agricul. 46, 25–27.
Lenth, R. V. (2022). Emmeans: Estimated Marginal Means, Aka Least-Squares Means. R Package Version 1.7.2. Available online at: https://CRAN.R-project.org/package=emmeans
Liebman, M., and Dyck, E. (1993). Crop rotation and intercropping strategies for weed management. Ecol Appl. 3, 92–122.
Liebman, M., and Gallandt, E. R. (1997). “Many little hammers: ecological1 management of crop-weed interactions,” in Ecology in Agriculture, Physiological Ecology, eds L. E. Jackson (San Diego, CA: Academic Press) 291–343. doi: 10.1016/B978-012378260-1/50010-5
Liebman, M., and Janke, R. R. (1990). “Sustainable weed management practices,” in Sustainable Agriculture in Temperate Zones, eds C. A. Francis, C. B. Flora, and L. D. King (New York, NY: John Wiley & Sons), 111–143. Available online at: https://www.cabdirect.org/cabdirect/abstract/19912309080
Liebman, M., Miller, Z. J., Williams, C. L., Westerman, P. R., Dixon, P. M., Heggenstaller, A., et al. (2014). Fates of Setaria faberi and Abutilon theophrasti seeds in three crop rotation systems. Weed Res. 54, 293–306. doi: 10.1111/wre.12069
Liebman, M., Nguyen, H. T. X., Woods, M. M., Hunt, N. D., and Hill, J. D. (2021). Weed seedbank diversity and sustainability indicators for simple and more diverse cropping systems. Weed Res. 61, 164–177. doi: 10.1111/wre.12466
Liebman, M., and Nichols, V. A. (2020). Cropping system redesign for improved weed management: A modeling approach illustrated with giant ragweed (Ambrosia trifida). Agronomy 10, 262. doi: 10.1371/journal.pone.0108378
MacLaren, C., Storkey, J., Menegat, A., Metcalfe, H., and Dehnen-Schmutz, K. (2020). An ecological future for weed science to sustain crop production and the environment. a review. Agron. Sustain. Dev. 40, 24. doi: 10.1007/s13593-020-00631-6
Martin, R. J., and Felton, W. L. (1993). Effect of crop rotation, tillage practice, and herbicides on the population dynamics of wild oats in wheat. Aust. J. Exp. Agricul. 33, 159–165.
Menalled, F. D., Liebman, M., and Buhler, D. D. (2004). Impact of composted swine manure and tillage on common waterhemp (Amaranthus rudis) competition with soybean. Weed Sci. 52, 605–613. doi: 10.1614/WS-03-040R1
Mesgaran, M. B., Matzrafi, M., and Ohadi, S. (2019). Sex lability and dimorphism in dioecious Palmer amaranth (Amaranthus palmeri). Plant Biol. 254, 17. doi: 10.1007/s00425-021-03664-7
Montgomery, J. S., Giacomini, D. A., Weigel, D., and Tranel, P. J. (2021). Male-specific Y-chromosomal regions in waterhemp (Amaranthus tuberculatus) and Palmer amaranth (Amaranthus palmeri). New Phytol 229, 3522–3533. doi: 10.1111/nph.17108s
Nguyen, H. T. X., and Liebman, M. (2022a). Data for: impact of cropping system diversification on vegetative and reproductive characteristics of waterhemp (A. tuberculatus). Iowa State University, Data Share. doi: 10.25380/iastate.18190784
Nguyen, H. T. X., and Liebman, M. (2022b). Weed community composition in simple and more diverse cropping systems. Front. Agron. doi: 10.3389/fagro.2022.848548
Nordby, D. E., and Hartzler, R. G. (2004). Influence of corn on common waterhemp (Amaranthus rudis) growth and fecundity. Weed Sci. 52, 255–259. doi: 10.1614/WS-03-060R
Payne, R. W. (2015). The design and analysis of long-term rotation experiments. Agron. J. 107, 772–785. doi: 10.2134/agronj2012.0411
Pinheiro, J., Bates, D., DebRoy, S., Sarkar, D., and R Core Team (2022). _nlme: Linear and Nonlinear Mixed Effects Models_. R Package Version 3.1-155. Available online at: https://CRAN.R-project.org/package=nlme
Pratt, D. B., and Clark, L. G. (2001). Amaranthus rudis and A. tuberculatus, One species or two? J. Torrey Botan. Soc. 128, 282–296. doi: 10.2307/3088718
Prince, J. M., Shaw, D. R., Givens, W. A., Owen, M. D. K., Weller, S. C., Young, B. G., et al. (2012). Benchmark study: IV. survey of grower practices for managing glyphosate-resistant weed populations. Weed Technol. 26, 543–548. doi: 10.1614/WT-D-11-00094.1
R Development Core Team (2021). R: A Language and Environment for Statistical Computing (Version 4.1.2). Vienna: R Foundation for Statistical Computing. Available online at: https://www.R-project.org/
Samson, R., Foulds, C., and Patriquin, D. (1990). Choice and Management of Cover Crop Species and Varieties for Use in Row Crop Dominant Rotations. Final Report, University of Guelph.
Singh, H. P., Batish, D. R., and Kohli, R. (2003). Allelopathic interactions and allelochemicals: new possibilities for sustainable weed management. Crit. Rev. Plant Sci. 22, 239–311. doi: 10.1080/713610858
Steckel, L. E., and Sprague, C. L. (2004). Common waterhemp (Amaranthus rudis) interference in corn. Wees 52, 359–364. doi: 10.1614/WS-03-066R1
Tranel, P. J. (2021). Herbicide resistance in Amaranthus tuberculatus. Pest Manag. Sci. 77, 43–54. doi: 10.1002/ps.6048
Uva, R. H., Neal, J. C., and Ditomaso, J. M. (1997). Weeds of the Northeast. Ithaca, NY: Cornell University Press.
van Buuren, S., and Groothuis-Oudshoorn, K. (2011). Mice : multivariate imputation by chained equations in R. J. Stat. Soft. 45, 1–6. doi: 10.18637/jss.v045.i03
van der Laat, R., Owen, M. D. K., Liebman, M., and Leon, R. G. (2015). Postdispersal weed seed predation and invertebrate activity density in three tillage regimes. Weed Sci. 63, 828–838. doi: 10.1614/WS-D-15-00030.1
Weisberger, D., Nichols, V., and Liebman, M. (2019). Does diversifying crop rotations suppress weeds? a meta-analysis. PLoS ONE 14, e0219847. doi: 10.1371/journal.pone.0219847
Westerman, P. R., Liebman, M., Menalled, F. D., Heggenstaller, A. H., Hartzler, R. G., and Dixon, P. M. (2005). Are many little hammers effective? Velvetleaf (Abutilon theophrasti) population dynamics in two- and four-year crop rotation systems. Weed Sci. 53, 382–392. doi: 10.1614/WS-04-130R
White, I. R., Royston, P., and Wood, A. M. (2011). Multiple imputation using chained equations: issues and guidance for practice. Stat. Med. 30, 377–399. doi: 10.1002/sim.4067
Wickham, H., Averick, M., Bryan, J., Chang, W., McGowan, L. D., François, R., et al. (2019). Welcome to the tidyverse. J. Open Source Softw. 4:1686. doi: 10.21105/joss.01686
Yang, R.-C., and Juskiw, P. (2011). Analysis of covariance in agronomy and crop research. Can. J. Plant Sci. 91, 621–641. doi: 10.4141/cjps2010-032
Zhu, H., Travison, T., Tsai, T., Beasley, W., Xie, Y., Yu, G., et al. (2021). kableExtra: construct complex table with 'kable' and pipe syntax. R package version 1.3.4. Available online at: https://CRAN.R-project.org/package=kableExtra
Keywords: waterhemp (Amaranthus tuberculatus (Moq.) J. D. Sauer), cropping system diversification, fecundity, integrated weed management, reproductive potential, Midwestern—United States, agroecolgy, sex ratio
Citation: Nguyen HTX and Liebman M (2022) Impact of Cropping System Diversification on Vegetative and Reproductive Characteristics of Waterhemp (Amaranthus tuberculatus). Front. Agron. 4:811359. doi: 10.3389/fagro.2022.811359
Received: 08 November 2021; Accepted: 07 February 2022;
Published: 03 March 2022.
Edited by:
Rodrigo Werle, University of Wisconsin-Madison, United StatesReviewed by:
John Wallace, The Pennsylvania State University (PSU), United StatesCopyright © 2022 Nguyen and Liebman. This is an open-access article distributed under the terms of the Creative Commons Attribution License (CC BY). The use, distribution or reproduction in other forums is permitted, provided the original author(s) and the copyright owner(s) are credited and that the original publication in this journal is cited, in accordance with accepted academic practice. No use, distribution or reproduction is permitted which does not comply with these terms.
*Correspondence: Huong T. X. Nguyen, aHVvbmdAaWFzdGF0ZS5lZHU=
Disclaimer: All claims expressed in this article are solely those of the authors and do not necessarily represent those of their affiliated organizations, or those of the publisher, the editors and the reviewers. Any product that may be evaluated in this article or claim that may be made by its manufacturer is not guaranteed or endorsed by the publisher.
Research integrity at Frontiers
Learn more about the work of our research integrity team to safeguard the quality of each article we publish.