 Yonghui Yang1,2,3*
 Jicheng Wu1,3Yan-Lei Du4Cuimin Gao1,3Xiaoying Pan1,3Darrell W. S. Tang2Martine van der Ploeg5
- 1Institute of Plant Nutrition and Resource Environment, Henan Academy of Agricultural Sciences, Zhengzhou, China
- 2Soil Physics and Land Management Group, Wageningen University and Research, Wageningen, Netherlands
- 3Yuanyang Experimental Station of Crop Water Use, Ministry of Agriculture, Yuanyang, China
- 4State Key Laboratory of Grassland Agroecosystems, Institute of Arid Agroecology, School of Life Sciences, Lanzhou University, Lanzhou, China
- 5Hydrology and Quantitative Water Management Group, Wageningen University and Research, Wageningen, Netherlands
Water shortages and rainfall variability lead to a decrease in grain yield. Straw mulching (SM), subsoiling (S), and combined amendments (subsoiling + straw mulching, SS) are potential solutions for maintaining crop productivity and water resource sustainability. However, short- and long-term applications of these methods appear to result in different yield and water use efficiency outcomes. In this study, we, therefore, compared short- and long-term applications of SM, S, and SS, with a control. We analyzed field experimental data of wheat and maize cultivation with control (conventional tillage), SM, S, and SS treatments to assess the impact on yield and water use efficiency, resulting from short- and long-term applications of these practices. The results show that SS treatment led to higher soil water storage (SWS) compared with other treatments during the regreening, jointing, and booting stages of wheat, and the big bellmouth and filling stages of maize in the short- and long-term experiments. However, long-term SS treatment also led to higher SWS in the growth stage of wheat in 2015–2016 and in the growth stage of maize in 2015. Additionally, SS treatment was conducive to raising the net photosynthetic rate (Pn) and leaf water use efficiency (LWUE) of wheat compared with other treatments in 2015 and 2016. Conversely, Pn and LWUE of maize under S and SS treatments were higher (P < 0.05) compared with other treatments in the two studied years. Short-term treatment led to higher wheat yield compared with long term in 2014–2015 (ample rainfall) and of maize in 2016 (low rainfall). The yield of wheat under long-term S treatment in 2015 was 9625.-kg hm−2, which was the highest (P < 0.05) in 2 years, with a 17.7% increase compared with the control, followed by short-term S treatment. However, the water use efficiency (WUE) of wheat under long-term SS treatment in 2016 was the highest (P < 0.05) compared with other treatments. The yield of maize under SM and S treatments was higher than other treatments, whereas the WUE of maize under long-term SS treatment in 2016 was still the highest (P < 0.05). Our findings provide evidence that S and SS treatments improve both crop productivity and water resource sustainability, and long-term application resulted in higher productivity than short-term application.
Introduction
Henan province is one of the most vital cereal production regions in China. Winter wheat yield in Henan province accounts for a quarter of the wheat harvest, 37.5 billion kg, in China. Climate change, changing rainfall patterns, and improper tillage can greatly impact food security in the region and in China through increasing crop losses and yield variability (Hawkins et al., 2013; FAO, 2016). As an important dry farming crop production area, soil degradation, water shortage, and seasonal drought are considered to be the most critical limiting factors in crop production in the western Henan province.
Adopting proper tillage and soil moisture conservation measures can improve soil structure and soil moisture conditions, and alleviate the damage to crops caused by rainfall shortages and uneven distribution of rainfall. Straw mulching and other agricultural residues returned to fields can reduce evaporative moisture losses in the soil surface and enhance soil water storage and soil moisture conservation (Zhang et al., 2005), regulate the soil temperature, and stimulate soil biological activity (Li et al., 2018). Zhao et al. (2009) showed that the soil moisture content under straw mulching was 17.7–75.9% higher than that under the non-mulching treatment, and that the yield of wheat increased by 3.2–8% compared with that of the non-mulching treatment. Furthermore, Zaongo et al. (1997) and Eberbach et al. (2011) reported a decrease in evaporation under mulch coverage. Ramakrishna et al. (2006) also found that mulched soil profiles were associated with higher soil water contents. In addition, subsoiling can increase soil moisture retention, increase soil organic matter, disaggregate compacted layers underneath the plow layer (Wang and Shangguan, 2015), improve soil structure (Lei et al., 2008), increase infiltration (Hou et al., 2012), enhance soil microbiological activity and root growth, reduce crop damage caused by drought stress (Zhou and Zhang, 2010), and promote soil fertility, which are all beneficial to crop growth (Acharya and Sharma, 1994; Mohanty et al., 2007).
Despite the possible positive effects of proper tillage and soil water conservation measures, not all evidence points in the same direction; mainly because the duration of the measures and the locations are different between different studies. Zhang et al. (2009) found that annual subsoiling did not markedly enhance soil water content, crop yield, or WUE, which indicates that variations in the duration of applying subsoiling could lead to different effects on crops. Yang et al. (2014a) adopted different short-term tillage and soil moisture conservation measures to study the characteristics of annual total water use of wheat and maize, and found that crop yield and soil moisture were increased the most through subsoiling compared to straw mulching. Many short-term studies have found that using a kind of conservation tillage can enhance soil properties and root growth, improve soil infiltration capability (Hou et al., 2012), increase plant-available water (Mohanty et al., 2007), and boost yield in arid land areas (He et al., 2007; Qin et al., 2008). He et al. (2007) suggested that conservation tillage in northern China coupled with subsoiling could significantly improve the grain yield and the WUE of winter wheat over a long term. Ma et al. (2015) indicated that subsoiling at every 3 years improved the soil moisture content in deep soil layers before sowing more effectively than every 6 years.
However, long-term single conservation tillage may not always be able to satisfy the key needs of farmers. During most years, conventional tillage and no-conservation tillage have been found to produce higher crop yield than subsoiling. Furthermore, Schneider et al. (2017) found that subsoiling produced different results for soils of different textures based on 1,530 yield comparisons. For example, soils with more than 70% silt (labile soil structure) showed an increased risk of negative effects due to subsoiling tillage effects.
Some studies reported that short-term subsoiling can improve surface-layer soil structure and increase crop yield (Schneider et al., 2017; Kuang et al., 2020). In another short-term experiment, Yang et al. (2017) showed that the total water production efficiency of subsoiling combined with straw mulching was higher than that of either subsoiling or straw mulching only. This could be because short-term measures induce a targeted change on a yield limiting subsystem process, leading to an improved agricultural practice with immediate impact for the given cropping season (Bodner et al., 2015). Conversely, long-term measures impart gradual fundamental changes that overcome constraints innate to the soil system. Until now, there is still no definite conclusion on the relative performance of short-term and long-term measures, as most studies focus only on single-season crops and rarely consider the whole-season effects of different measures on wheat and maize.
Therefore, we investigated soil water storage, photosynthesis parameters, and the whole-season water utilization of wheat and maize rotation systems under different practices following short- and long-term measures. We hypothesized that there are different effects of straw mulching, subsoiling, and the combination of subsoiling and straw mulching on soil water content, the photosynthetic characteristics of crop, and crop yield between short- and long- term experiments in different rainfall year patterns. Therefore, we conducted short-term (2014–2016) and long-term (2006–2016) experiments in the West Henan province to investigate the effects of different tillage methods on soil moisture, photosynthetic characteristics, aboveground biomass, and yield of winter wheat and summer maize from 2014 to 2016. The aim of this study is to (1) analyze if different short- and long-term practices (straw mulching, subsoiling, and subsoiling + straw mulching) can promote the photosynthetic parameters, growth, and increase of yield in both wheat and maize; (2) explore the mechanisms by which different practices affect growth, yield, and water use of wheat and maize; (3) determine a suitable practice for the cultivation of wheat and maize in the western region of Henan province.
Materials and Methods
Experimental Site
The field experiment was conducted at the Yuzhou Experimental Station (34.16°N, 113.15°E, and 116.1 m above the sea level), which is located in the west of Henan province. The mean annual precipitation in this area was 674.9 mm, with more than 60% of the rainfall occurring during the summer. According to the international texture classification system, the soil type is defined as loamy sand. Soil organic matter in the cultivation layer was 12.3 g kg−1, total nitrogen was 0.80 g kg−1, water-soluble nitrogen was 47.82 mg kg−1, available phosphorus was 6.66 mg kg−1, and available potassium was 114.8 mg kg−1. The crop mode was wheat-maize rotation. Figure 1 shows the changes in precipitation and atmospheric temperature during the wheat- and maize-growing seasons in the years of 2014–2015 and 2015–2016.
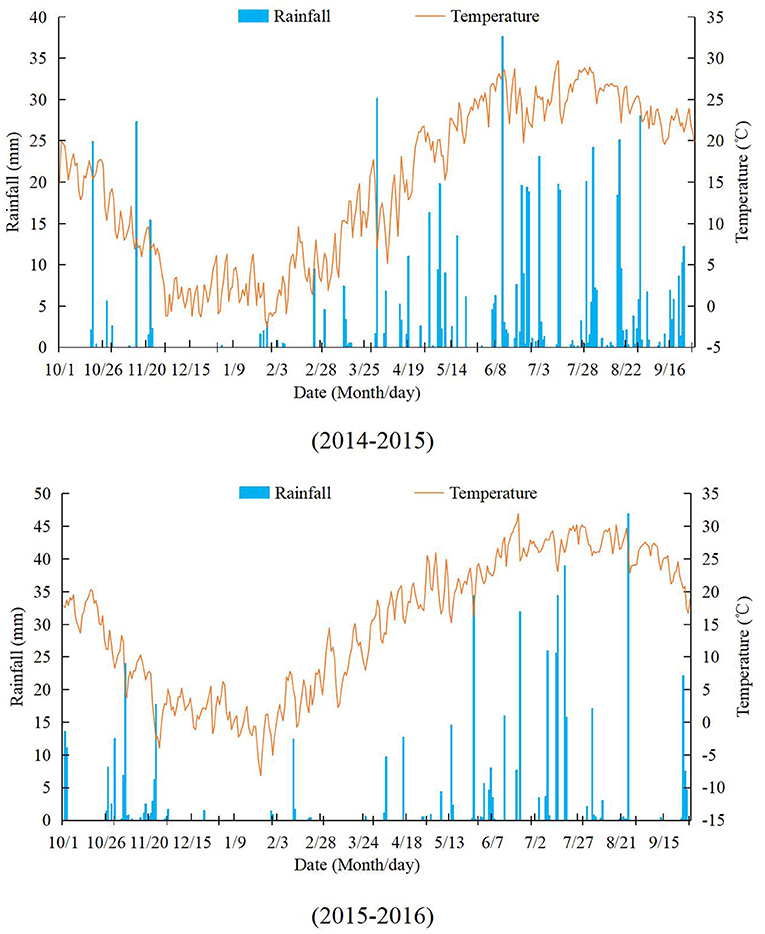
Figure 1. Distribution of rainfall and temperature from 2014 to 2016.
Experimental Design
The long-term experiment was carried out from the wheat-planting period from October 20, 2006 to September 30, 2016. The short-term experiment started in October 20, 2014, and ended on September 30, 2016. In order to compare the differences between the experimental periods, we analyzed the data from short- and long-term experiments for 2 years from October 20, 2014, to September 30, 2016. The experiment was arranged in a complete random-block design, and there were three replications. The cultivation measures were performed at the time of the wheat seeding, while no-tillage seeding was used for maize every year. Four practices in short- and long-term experiments were defined: conventional tillage (control), which uses a moldboard plow to a depth of 15 cm; straw mulching (SM) (2 weeks after the wheat sprouts out, after conventional tillage); subsoiling (S), which loosens the plow bottom layer and the soil core layer to a depth of 30 cm with a subsoiler without turning the soil layer; subsoiling + straw mulching (SS), in which straw mulching was applied after 2 weeks, at the time when the wheat sprouted out. The area of each plot was 30 m2 (5 × 6 m). The winter wheat (Triticum aestivum L.) cultivar Kaimai-18 and summer maize (Zea mays L.) cultivar Zhengdan-958 were used in two experiments. Prior to seeding, all fields received a base nitrogen fertilizer (187.5 kg hm−2 N), ordinary superphosphate (112.5 kg hm−2 P), and potassium (112.5 kg hm−2 K). Compound fertilizer was applied at a rate of 210 kg N hm−2, 120 kg P hm−2, and 90 kg K hm−2, and maize seed was sown by a no-tillage planter. Irrigation (in total, 45 mm with a sprinkler irrigation system) was employed during the regreening stage of winter wheat in 2016 to ensure the normal growth of wheat, because the rainfall of that year was low compared with the annual average rainfall. No irrigation was carried out at other times.
Assay Method
Measurement of Wheat and Maize Photosynthetic Parameters
Photosynthesis rate (Pn), transpiration rate (Tr), and stomatal conductance (gs) at the jointing, heading, and filling stages of winter wheat and that big bellmouth and filling states of maize were measured at 9:30–11:00 a.m. of sunny and windless days. The measurements were made using a Li-6,400 portable photosynthesis system (Li-Cor Company, Lincoln, NE, USA) with an open gas circuit at a light intensity of 800–1,200 mol m−2 s−1 and an internal red-blue light source unit in a leaf chamber (2 × 3 cm). The temperature was set according to ambient temperature, and the air flow rate was set at 500 μmol s−1. It took 30–45 s for each reading to become stabilized. Nine replicates were determined for each treatment. Leaf water use efficiency (LWUE) (the amount of assimilated CO2 by a plant divided per-unit mass of water) was measured with Fischer and Turner (1978) and Powles's (1984) method and expressed as
Soil Moisture Content Soil Water Storage
Soil samples of the 0–100-cm layer were collected using soil augers during the sowing stage, regreening stage, jointing stage, booting stage, heading stage, filling stage, and harvest stage of winter wheat, and the sowing stage, big bellmouth stage, filling stage, and harvest stage of maize. Their gravimetric soil water contents (SWC) were determined using the oven-drying method (Ma et al., 2015):
Soil water storage (SWS, mm) at different growth stages of winter wheat and maize was calculated using the following equation:
where SWS is soil water storage (mm), H is soil depth (mm), M is soil moisture content (g g−1), and d is soil bulk density (g cm−3) (Table 1).
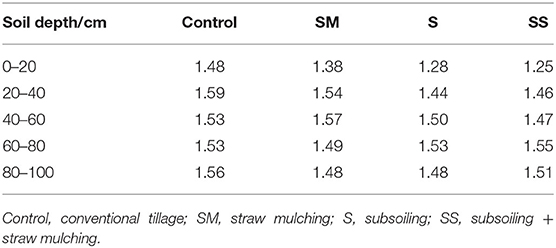
Table 1. Soil bulk density under the Control, SM, S and SS treatments.
The soil water storage of the 0- to 100-cm soil layer (SWS100) refers to the sum of soil moisture content of the 0- to 20-, 20- to 40-,..., 80- to 100-cm soil layers.
Evapotranspiration
Evapotranspiration for the winter wheat- and summer maize-growing seasons was calculated, using the water balance equation (Li et al., 2010):
where evapotranspiration (ET) is evapotranspiration (mm), P is precipitation (mm) data from weather stations near the field, I is irrigation (mm), D is soil water drainage (mm)—no drainage was observed in our study area—R is surface runoff (mm)—but there was no surface runoff in the experiment—W is groundwater recharge in the experimental site (mm), but the groundwater level was deeper than 10 m in our study, so W was ignored, and ΔM is the change in soil water storage capacity in the 0–100-cm soil profiles during the different growth stages of winter wheat and summer maize (mm). Mi is SWS100 before a previous certain stage of wheat (maize) (mm) and Mi+1 is SWS100 after a certain stage of wheat (maize) (mm).
Yield and Production Factors of Wheat and Maize
Plant height and panicle length were measured using a ruler, and spikelet number per spikelet was calculated manually. Population number of wheat was calculated within 1 m2 and converted into number per hectare.
The crop yields were determined by manually harvesting and air-drying the grains (12.5% water content) from 4 and 8 m2 areas chosen at random in each plot for winter wheat and summer maize, respectively, and converted into yield (kg) per hectare.
At the wheat harvest, the number of ears in various representative plots of 1 m2 was surveyed and converted into number of ears per unit area. At the same time, their grains were threshed, air-dried, and weighed. A total of 10 wheat plants in each plot were randomly selected, and the number of grains of all the ears was counted and converted into number of grains per ear. The 1,000-grain weight of wheat and 100-grain weight of maize were measured by electronic balance. A total of five maize plants in each plot were randomly selected, and the number of rows in each panicle was counted.
Aboveground Biomass
In each plot, plants from a 1-m-long row from the same inside row were cut randomly at the ground level at jointing, heading, filling, and harvest stages of wheat, respectively. Five maize plants in each plot were also cut randomly at the ground level at big bellmouth, filling, and harvest stages of maize, respectively. The plants were dried at 70°C using an oven until they reached a constant weight and converted into weight (kg) per hectare.
Water Use Efficiency
Water use efficiency was calculated as follows (Faramarzi et al., 2010):
where Y is the grain yield (kg m−2), and ET is the evapotranspiration over the winter wheat and summer maize-growing seasons (mm).
Statistical Analysis
All reported values were means of the three replicates of each treatment, except for the photosynthetic parameters, which were means of the nine replicates of each treatment. Differences in population number, water storage, water consumption, aboveground biomass, photosynthetic parameters, yield, water use efficiency, and yield components in different term experiments between treatments were analyzed using one-way ANOVA, with a least significant difference (LSD) (at P < 0.05) test (from Tables 2–6 and from Figure 2 to Table 6). The Pearson correlation coefficient was calculated to assess the relationships between annual total yield and yield, water consumption, and water use efficiency (WUE) of wheat and maize under different term experiments (Table 7). All statistical analyses were performed using SPSS version 19.0 (SPSS Inc., USA) (Xue, 2019).
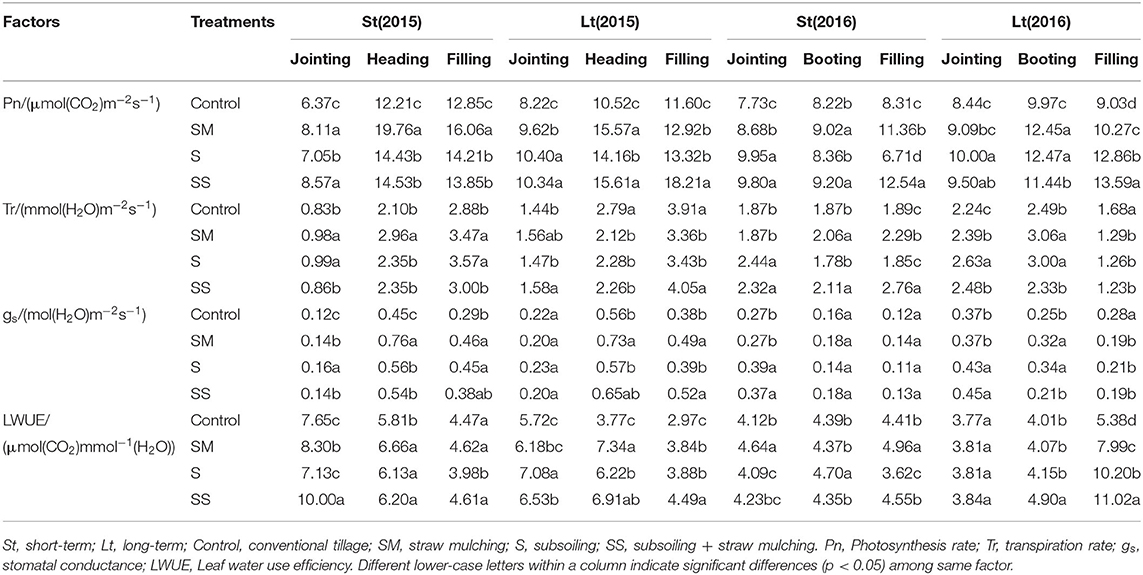
Table 2. Photosynthetic characteristics in different growth stages of wheat under the Control, SM, S and SS treatments in different years.
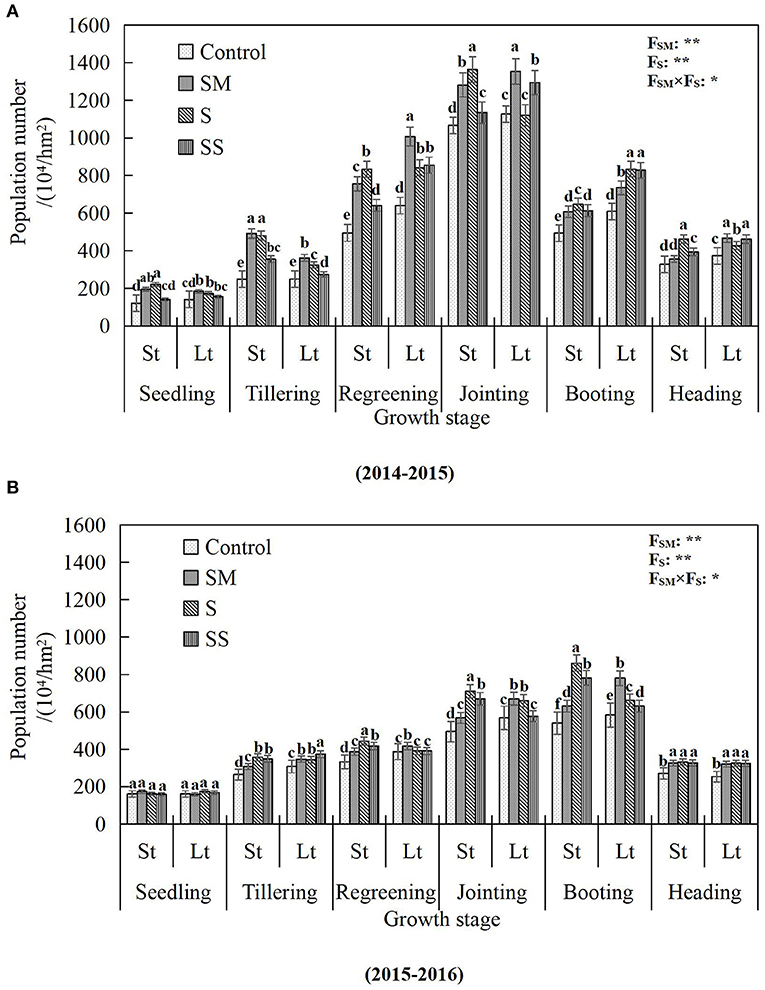
Figure 2. Population number in different growth stages of wheat under the Control, SM, S and SS treatments in different years. Error bars represent standard deviation (n = 3). Columns labeled with different letters represent significant differences at P < 0.05 among treatments of two experiments at same growth stage. (A) 2014–2015 and (B) 2015–2016. St, short-term; Lt, long-term; Control, conventional tillage; SM, straw mulching; S, subsoiling; SS, subsoiling + straw mulching. FSM, FS and FSM × FS mean F-values of straw mulching, subsoiling and their interactions in variance analysis respectively. “* and **” indicate difference at the 0.05 and 0.01 levels, respectively.
Results
Wheat Population Number of Different Measures in Different Years
As shown in Figure 2A, during the crop season, the population number of wheat initially increases (from seeding to jointing stages) and then decreases (from booting to heading stages), because of its own characteristics and soil moisture condition. Higher population numbers for SM, S, and SS treatments were achieved under short-term treatments compared with long-term treatments at the tillering stages, especially under the SM and S treatments, which increased population number by 36.0 and 48.1% compared with the same long-term treatments. However, this was reversed after the regreening stage, where the population number under long-term treatments became larger than that under short-term treatments. From the regreening to the jointing stages, SM treatment resulted in a higher population number under both short- and long-term experiments, which were increased by 52.7, 52.4, and 20.1, 20.1%, compared to their control at these two stages, respectively. The population number under S treatment was higher than that under other treatments at the booting and heading stages in the short-term experiment. However, in the long-term experiment, SM and SS treatments resulted in higher population numbers compared with other treatments at the heading stage.
From the Figure 2B, the population number in 2015–2016 is seen to be obviously lower than that in 2014–2015 (Figure 2A). The population number of wheat increased (from seeding to booting stages) initially and then decreased (heading stage). At the seedling and heading stages, there were no significant population differences under short-term and long-term experiments. However, there were significantly different population numbers between short- and long-term experiments at the jointing and booting stages, and the population numbers of S and SS treatments in short-term were 7.6, 16.2%, 30., and 23.8% larger than long-term S and SS treatments in these two stages, respectively.
Soil Water Storage (SWS) During the Stage of Wheat and Maize Under Different Measures in Different Years
SWS During the Stage of Wheat
As shown in Figure 3, as the growth stages of wheat progressed, the soil water storage (SWS) showed a downward trend. In 2014–2015 (Figure 3A), the SWS under short-term experiment was higher than that under the long-term experiment at the regreening stage. In particular, it was a large degree higher under SS treatment in the short-term experiment compared with other treatments. At the jointing stage, the SWS under long-term S and SS treatments was 12 and 6.5% higher than that under short-term S and SS treatments, respectively. At the booting, heading, and filling stages, the SWS in the long-term experiment was higher than in the short-term experiment, except under SS treatment. At harvest, the SWS of each treatment in short-term experiment was higher than that in the long-term experiment. At this stage, the SWS under SS treatment in the short-term experiment was still the highest compared with other treatments.
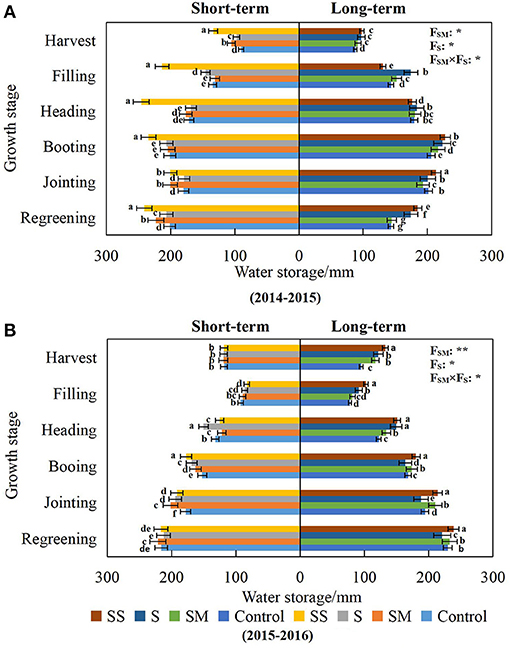
Figure 3. Water storage in different growth stages of wheat under the Control, SM, S, and SS treatments in different years. Error bars represent standard deviation (n = 3). Columns labeled with different letters represent significant differences at P < 0.05 among treatments of two experiments at same growth stage. (A) 2014–2015 and (B) 2015–2016. Control, conventional tillage; SM, straw mulching; S, subsoiling; SS, subsoiling + straw mulching. FSM, FS and FSM×FS mean F-values of straw mulching, subsoiling and their interactions in variance analysis respectively. “* and **” indicate difference at the 0.05 and 0.01 probability levels, respectively.
In 2015–2016 (Figure 3B), at the regreening, heading, and booting stages, the SWS of each treatment in the long-term experiment was higher than that in the short-term experiment, especially under the SS treatment. At the heading stage, the SWS under SM and SS in the long-term experiment was 9.9 and 20.6% higher than that in the short-term experiment, respectively, while the SWS under control and S treatment in short-term experiment was significantly higher than that in the long-term experiment. At the filling and harvest stages, the SWS under short-term control and SM treatments were higher than that in the long-term experiment. However, in each growth stage, the SWS under long-term SS treatment, ranging from 102.3 to 238.7 mm, was higher than that of other treatments.
SWS During the Stage of Maize
As for maize, in 2015 (Figure 4A), the SWS under the control was significantly (P < 0.05) lower than that under other treatments at the big bellmouth stage. The SWS in the short-term experiment was lower than in the long-term experiment. During the whole stage, long-term SM, S, and SS treatments led to higher SWS compared with the respective short-term treatments, while the SWS under SS treatment was the highest compared with other treatments at the filling stage.
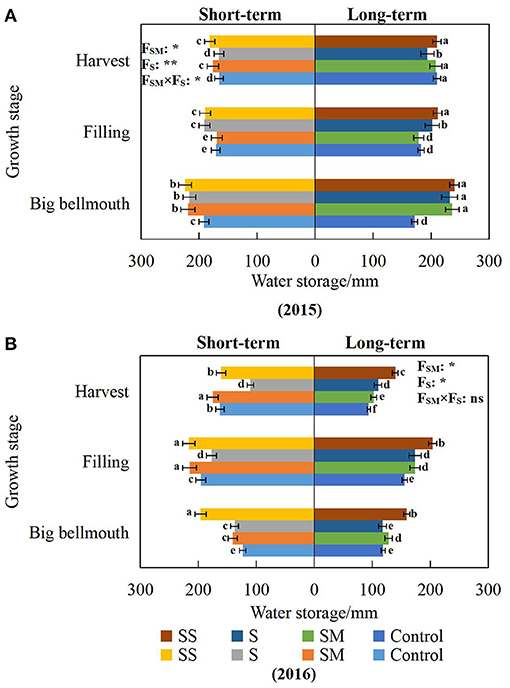
Figure 4. Water storage in different growth stages of maize under the Control, SM, S and SS treatments in different years. Error bars represent standard deviation (n = 3). Columns labeled with different letters represent significant differences at P < 0.05 among treatments of two experiments at same growth stage. (A) 2015 and (B) 2016. Control, conventional tillage; SM, straw mulching; S, subsoiling; SS, subsoiling + straw mulching. FSM, FS and FSM × FS mean F-values of straw mulching, subsoiling and their interactions in variance analysis respectively. “* and **” indicate difference at the 0.05 and 0.01 probability levels, respectively.
In 2016 (Figure 4B), at the big bellmouth stage, the SWS under SS treatment in the short-term experiment was significantly higher (P < 0.05) than that of other treatments, followed by the long-term SS treatment. At the filling stage, the SWS under SS and SM treatments in short-term experiment was significantly higher than that of other treatments, followed by the long-term SS treatment. At the harvest stage, in addition to S treatment, the SWS under other treatments in the short-term experiment were significantly higher than that of the long-term experiments, and the SWS under SM treatment was the highest. On the whole, the SWS under SS treatment of the two experiments was still higher during the various growth stages of maize.
Water Consumption of Wheat and Maize Under Different Measures in Different Years
The water consumption of crops during different growth stages reflects their demand for water. This can be seen in Figure 5A (2014–2015). The rainfall during the whole growth period cannot fulfill the entire water requirement of wheat, so it was necessary to use soil moisture to maintain the normal growth of wheat. During the whole growth period of wheat, the water consumption of different measures in the long-term experiment was higher than that of the control, but the water consumption of the short-term experiment was lower than that of the control. The SS treatment in the short-term experiment could effectively improve the soil water storage and reduce the water consumption of wheat. For the later stubble maize (Figure 6A), the water consumption during the sowing-big bellmouth stage was the highest, and the rainfall during that period was much higher than water consumption of maize. At other growth stages, it was necessary to obtain the water from the soil to meet the growth of maize because of insufficient rainfall. After the big bellmouth stage, the water consumption of the long-term experiment was higher than that of the short-term experiment. The total water consumption of maize with the SS treatment in the short-term experiment and the S and SM treatments in the long-term experiment during the whole growth period were higher than that of other treatments. The rainfall during the whole growth period of maize can meet its growth, and the excess precipitation can be stored in the soil for the growth of wheat next year.
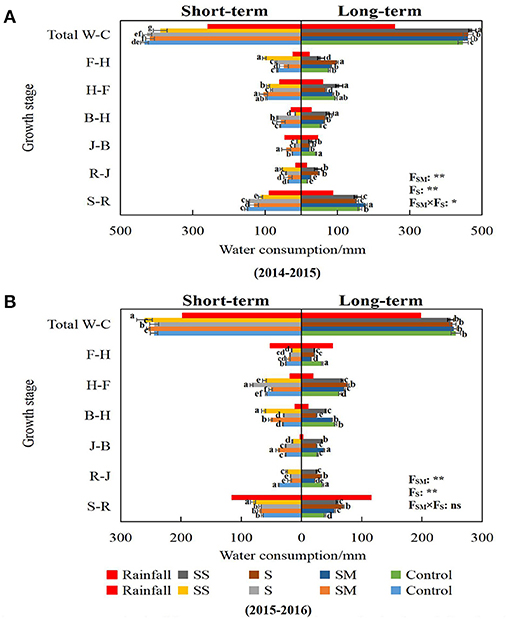
Figure 5. Water consumption in different growth stages of wheat under the Control, SM, S and SS treatments in different years. Error bars represent standard deviation (n = 3). Columns labeled with different letters represent significant differences at P < 0.05 among treatments of two experiments at same growth stage. (A) 2014–2015 and (B) 2015–2016. Control, conventional tillage; SM, straw mulching; S, subsoiling; SS, subsoiling + straw mulching. S-R, sowing-regreening; R-J, regreening-jointing; J-B, jointing-booting; B-H, booting-heading; H-F, heading-filling; F-H, Filling-harvest; W-C, total water consumption. FSM, FS and FSM × FS mean F-values of straw mulching, subsoiling and their interactions in variance analysis respectively. “*, ** and ns” indicate difference at the 0.05, 0.01 and no probability levels, respectively.
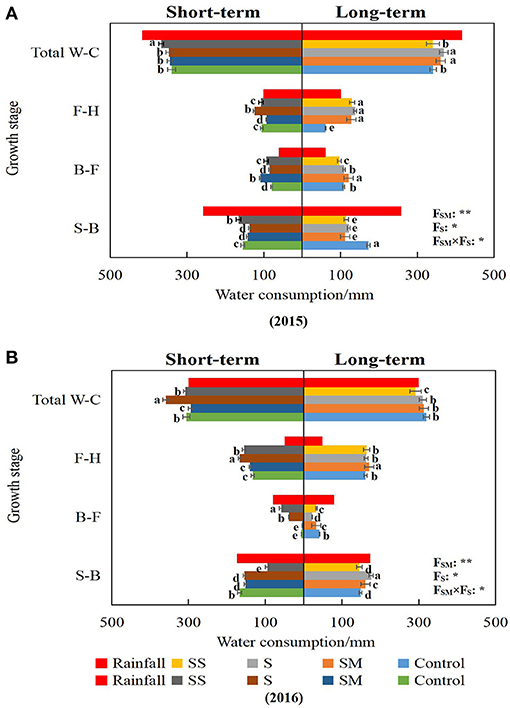
Figure 6. Water consumption in different growth stages of maize under the Control, SM, S and SS treatments in different years. Error bars represent standard deviation (n = 3). Columns labeled with different letters represent significant differences at P < 0.05 among treatments of two experiments at same growth stage. (A) 2015 and (B) 2016. Control, conventional tillage; SM, straw mulching; S, subsoiling; SS, subsoiling + straw mulching. S-B, sowing-big bellmouth; B-F, big bellmouth-filling; F-H, Filling-harvest; W-C, total water consumption. FSM, FS and FSM×FS mean F-values of straw mulching, subsoiling and their interactions in variance analysis respectively. “* and **” indicate difference at the 0.05 and 0.01 probability levels, respectively.
From 2015 to 2016 (Figure 5B), rainfall was used to meet the growth of wheat during the sowing-regreening and filling-harvest stages. At the seeding-regreening, booting-heading and whole stages of wheat, the SS treatment in the short-term experiment resulted in the highest total water consumption. However, at the regreening-jointing and whole stages of wheat, the water consumption of the S treatment in the short-term experiment was lowest compared with other treatments in the short- and long-term experiments. For the later stubble maize (Figure 6B), rainfall was used to meet the growth of wheat during the seeding-big bellmouth and big bellmouth-filling stages. At the big bellmouth-filling stage, water consumption of maize was the lowest compared with other stages. At the seeding-big bellmouth stage, the S treatment in the long-term experiment had the highest water consumption, and the water consumption of the SS treatment in the short-term experiment was the lowest. However, at the big bellmouth-filling stage, the water consumption of the SS treatment in the short-term experiment was the highest, while SM and control were lower than other treatments. At the filling-harvest stage, rainfall was far from meeting the transpiration needs of maize, and the water consumption of the short-term S treatment and long-term SM treatment was higher than other treatments. The total water consumption of the short-term S treatment was the highest compared with that of other treatments in both experiments, while the long-term SS treatment had the lowest water consumption.
Biomass of Wheat and Maize Under Different Measures in Different Years
Biomass of Wheat
The aboveground biomass of crops reflects its ability to accumulate photosynthetic dry matter. It can be seen from Figure 7A that, as the wheat growth period progressed, the biomass of wheat increased gradually, and the biomass of wheat in 2015 was significantly higher (P < 0.05) than that in 2016. In 2015, the biomass under the SM treatment in the long-term experiment was higher than that under other treatments in different growth stages, followed by the S treatment in the short-term experiment at the jointing and harvest stages, and the biomass under control was lower than that under other treatments in the short-term experiment. At harvest, the biomass under the long-term treatment was higher than that under the short-term experiment; in particular, the biomass under the SM treatment in the long-term experiment was significantly higher (P < 0.05) than that under other treatments. In 2016, the biomass under the long-term experiment was lower than that under the short-term experiment at the different growth stages of wheat except for the control. At the filling and harvest stages, the biomass under the S treatment in two experiments was higher than other treatments, while that under the control was the lowest. At different stages except the harvest stage of wheat, the biomass under SS treatment in long-term experiment was lower than under other treatments except the control, which was related to its water consumption (Figure 6B).
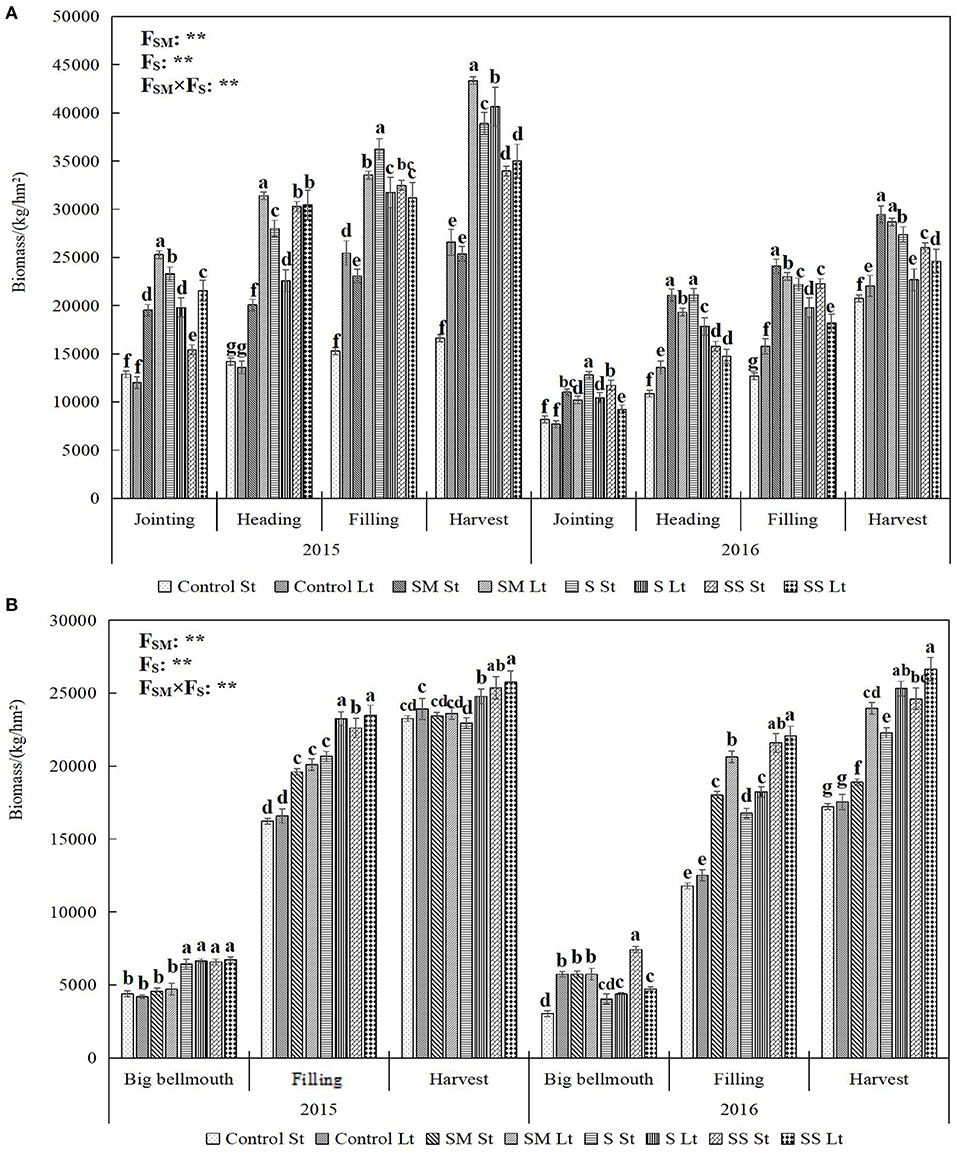
Figure 7. Aboveground biomass in different growth stages of wheat (A) and maize (B) under the Control, SM, S and SS treatments. Error bars represent standard deviation (n = 3). Columns labeled with different letters represent significant differences at P < 0.05 among treatments of two experiments at same growth stage. St, short-term; Lt, long-term; Control, conventional tillage; SM, straw mulching; S, subsoiling; SS, subsoiling + straw mulching. FSM, FS and FSM × FS mean F-values of straw mulching, subsoiling and their interactions in variance analysis respectively. “**” indicate difference at the 0.01 probability levels, respectively.
Biomass of Maize
From Figure 7B, it can be seen that, as the maize growth period progressed, the biomass increased. In 2015, the biomass of the SS treatment was the highest, followed by the S and SM treatments, and the control treatment had the lowest biomass in the different periods of short- and long-term experiments. After the big bellmouth stage, the biomass under each treatment in the long-term experiment was higher than that in the short-term experiment. In 2016, the biomass under each treatment in the long-term experiment was still higher than that in the short-term experiment except the big bellmouth stage. The biomass in two experiments of SS treatment was the highest compared with other treatments, followed by the SM treatment except the big bellmouth stage.
Photosynthetic Characteristics of Wheat Under Different Measures in Different Years
The Net Photosynthetic Rate of Wheat
It can be seen from Table 2 that the net photosynthetic rate (Pn) was the highest at the heading stage, followed by the filling stage and was the lowest at the heading stage in 2015. At the jointing stage, the Pn under each treatment in the long-term experiment was higher than that in the short-term experiment, and the Pn under the SS treatment was the highest in both experiments. At the heading stage, except the SS treatment, the Pn under other treatments in the short-term experiment was higher than that in the long-term experiment, and the SM treatment was higher in both experiments. At the filling stage, the Pn under the SS treatment in the long-term experiment, 18.21 μmol m−2s−1, was significantly higher than that in the short-term experiment, but the Pn under the other treatments in the long-term experiment was lower than that in the short-term experiment. In the short-term experiment, the SM treatment was more beneficial in increasing the Pn of wheat, while the SS treatment showed the highest Pn in the long-term experiment in the whole stage of wheat. In 2016, at different growth stages of wheat, the Pn in the long-term experiment was higher than that under the short-term experiment. The Pn under the SS treatment was significantly higher (P < 0.05) than that under other treatments at different stages in the two experiments.
The Transpiration Rate of Wheat
In 2015, the transpiration rate (Tr) of wheat was shown as follows: filling stage > heading stage > jointing stage. The Tr in the long-term experiment was higher than that in the short-term experiment at the jointing stage, and the Tr in the long-term SM and SS treatments was higher than that in other treatments. At the heading stage, the Tr in the short-term control was lowest compared with that in other treatments, but the result was reverse at the filling stages. In 2016, the Tr in the long-term experiment was higher than that in the short-term experiment at the jointing and booting stages, and the S treatment in the long-term experiment was the highest in each treatment. At the filling stage, the Tr in the short-term experiment was higher than that in the long-term experiment, and the Tr under the SS treatment was the highest compared with other treatments in the short-term experiment.
Stomatal Conductivity of Wheat
The stomatal conductivity (gs) of wheat at different growth stages was as follows: in 2015, heading > filling > jointing, and the gs in long-term experiment were higher than that in the short-term experiment at the jointing stage. At the heading and filling stages, the gs of wheat was increased by SM, S, and SS treatments, and the gs under the SM treatment was basically higher than that under other treatments. In 2016, the gs of wheat was as follows: jointing > booting > filing. The gs in the long-term experiment was higher than that in the short-term experiment. At the jointing stage, the gs under the S and SS treatments was higher than that under other treatments in the two experiments. However, the gs was not significant between different treatments at the jointing and filling stages.
Leaf Water Use Efficiency of Wheat
As for the leaf water use efficiency (LWUE) of wheat, in 2015, with the advance of the wheat growth period, the LWUE was decreased. At the jointing and filling stages, the LWUE of wheat in the short-term experiment was higher than that in the long-term experiment. However, LWUE under the SS treatment in the short-term experiment was significantly higher than that under other treatments. LWUE under the S treatment at the jointing stage and under the SS treatment at the filing stage in the long-term experiment was significantly higher than that in the other treatments at these two stages. At the heading stage of both experiments, the LWUE under SM treatment was significantly higher than that under other treatments. In 2016, with the advance of the wheat growth period, the LWUE increased gradually. In the short-term experiment, the LWUE under the SM treatment was higher than that under other treatments. In the long-term experiment, the LWUE under the SS treatment was the highest compared with other treatments. The LWUE at the jointing and booting stages in the short-term experiment was higher than that in the long-term experiment, but the results at the filling stage were opposite as the long-term SS treatment had the highest LWUE, reaching 11.02 μmol mmol−1.
Photosynthetic Characteristics of Maize Under Different Measures in Different Years
The Net Photosynthetic Rate of Maize
It can be seen from Table 3 that, in 2015, the Pn was: big bellmouth stage > filling stage. In the short- and long-term experiments, different measures increased the Pn of maize. The Pn under the SS treatment in the short-term experiment was significantly higher than that under other treatments in the two experiments at the big bellmouth stage. At the filling stage, the Pn under control, SM, and S treatments in the short-term experiment was higher than that in the long-term experiment, but it was the opposite under the SS treatment. In 2016, Pn in the short-term experiment was significantly lower than that in the long-term experiment, and Pn under the SS treatment in the two experiments was higher than that under other treatments.
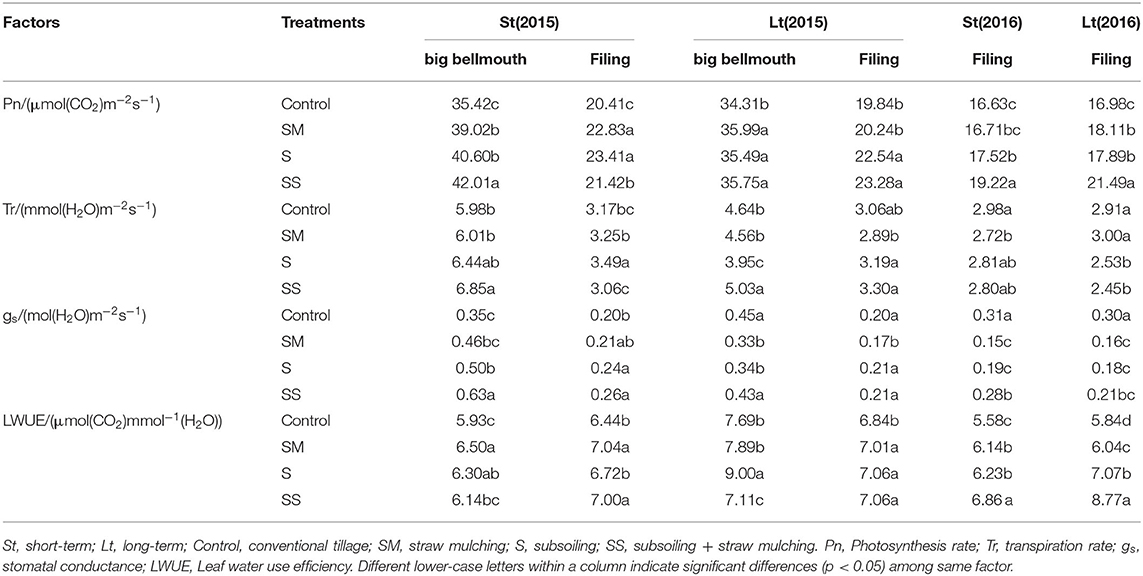
Table 3. Photosynthetic characteristics in different growth stages of maize under the Control, SM, S and SS treatments in different years.
The Transpiration Rate and Stomatal Conductivity of Maize
For the Tr of maize, in 2015, there was a still higher Tr at the big bellmouth stage compared with the filling stage, and the Tr in the long-term experiment was lower than that in the short-term experiment. The Tr under the SS treatment at the big mouth stage, and under the S treatment at the filling stage in the short-term experiment and the Tr under the SS treatment in the long-term experiment were the highest compared with other treatments. In 2016, the Tr of control was the highest in the two experiments, while the Tr under the S and SS treatments in the long-term experiment was lower than that under other treatments and that in the short-term experiment. In 2015, the gs of the SS treatment in two experiments was the highest compared with other treatments. The gs of maize in 2016 showed the same trend as that of Tr.
Leaf Water Use Efficiency of Maize
In 2015, The LWUE of maize at the filling stage was higher than that at the big bellmouth stage in the short-term experiment, but, in the long-term experiment, LWUE at the big bellmouth stage was higher than that at the filling stage. The SM, S, and SS treatments all increased LWUE clearly at the big bellmouth stage in the short-term experiment and at the filling stage in the long-term experiment, and SM in the two experiments performed better. In 2016, the LWUE in the long-term experiment was higher than that in the short-term experiment except for the SM treatment and the SS treatment that showed the best result.
Yield Factors, Yield, and Water Use Efficiency of Wheat Under Different Measures in Different Years
Different measures affect soil moisture, crop physiological characteristics, and dry matter accumulation and thus influence crop yield factors, yield, and water use efficiency. From Table 4, it can be seen that the plant height, panicle length, spikelet number, grain number per panicle, 1,000-grain weight, total water consumption, and yield of wheat in 2015 were higher than those in 2016, and the important reason was that the rainfall in 2016 was obviously less compared with 2015. In 2015, different measures increased the plant height, panicle length, spikelet number, grain number per panicle and 1,000-grain weight of wheat. Compared with the SM treatment and the S treatment, the plant height and grain number per panicle under the SS treatment were increased by 2.4 and 8.6, 1.8 and 0.9%, respectively. However, the ear length, grain number per panicle and 1,000-grain weight were decreased. In the long-term experiment, compared with the SM treatment and the S treatment, the plant height and 1,000-grain weight under the SS treatment were also decreased, but the ear length, spikelet number, and grain number per panicle were increased. The total water consumption of wheat in long-term experiment was higher than that in the short-term experiment. In the short-term experiment, the total water consumption of wheat under the SS treatment was decreased by 10.1, 6.8, and 8.5% compared with the control, SM, and S treatments, respectively. The yield under each treatment in the long-term experiment was higher than that in the short-term experiment, and the yield in the long-term experiment was 3.6–10.6% higher than that in the short-term experiment. In both experiments, the yield under the S treatment was the highest, which was 14.6 and 17.7% higher than that under the control, respectively. In the short-term experiment, the water use efficiency (WUE) under the SM, S, and SS treatments was 9.7, 16.6, and 19.4% higher than that under the control, respectively. In the long-term experiment, the WUE under the SM and S treatments was 1.6 and 13.7% higher than that under the control, respectively, while that under the SS treatment was 2.2% lower than that under the control.
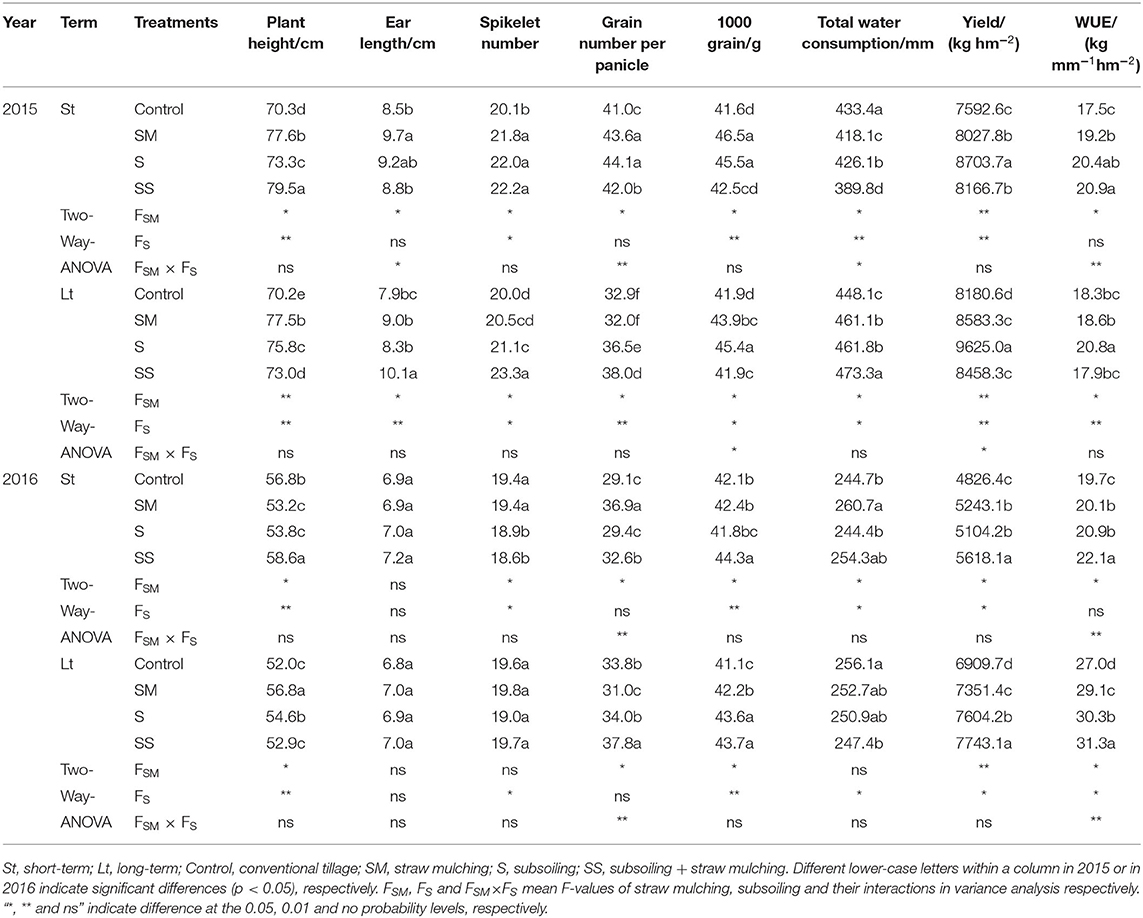
Table 4. Yield, water use efficiency and yield component of wheat under the Control, SM, S and SS treatments in different years.
In 2016, in the short-term experiment, compared with the SM and S treatments, the plant height, panicle length, and 1,000-grain weight of wheat under the SS treatment were increased, and the number of spikelets was decreased. In the long-term experiment, the plant height of wheat under the SS treatment was decreased by 6.9 and 3.1%, and the number of grains per panicle and 1,000-grain weight was increased by 21.9 and 11.2%, 3.6, and 0.2%, respectively, compared with the SM and S treatments. In the short-term experiment, the total water consumption under the SM and SS treatments was higher than that under control. However, the long-term application of different maintenance measures was lower than that of control. The yield and WUE of each treatment in the long-term experiment were higher than those in the short-term experiment. In the short-term experiment, yield and WUE under the SS treatment were the highest, 16.4 and 12.2% higher than the control, respectively. While in the long-term experiment, the yield and WUE under the SS treatment were the highest, which were 12.1 and 15.9% higher than those under the control, respectively.
Yield Component, Yield, and Water Use Efficiency of Maize Under Different Measures in Different Years
For maize (Table 5), in 2015, different measures increased maize plant height, row number of panicle, double row grain number, panicle length, but decreased maize panicle position. Compared with the SM and S treatments, the SS treatment was more beneficial to increase plant height, panicle position, and row number per ear in the short-term experiment, and the water consumption of this treatment was also higher, so its water use efficiency was lower. In the long-term experiment, the plant height, double row grain number, and panicle length under the SS treatment were still higher than those under other treatments, but the water consumption under this treatment was lower, so its water use efficiency was higher than that under other treatments. In the short- and long-term experiments, the yield and water use efficiency of wheat under the SS treatment were 16.2 and 7.%, 11.9 and 12.4% higher than those under the control, respectively.
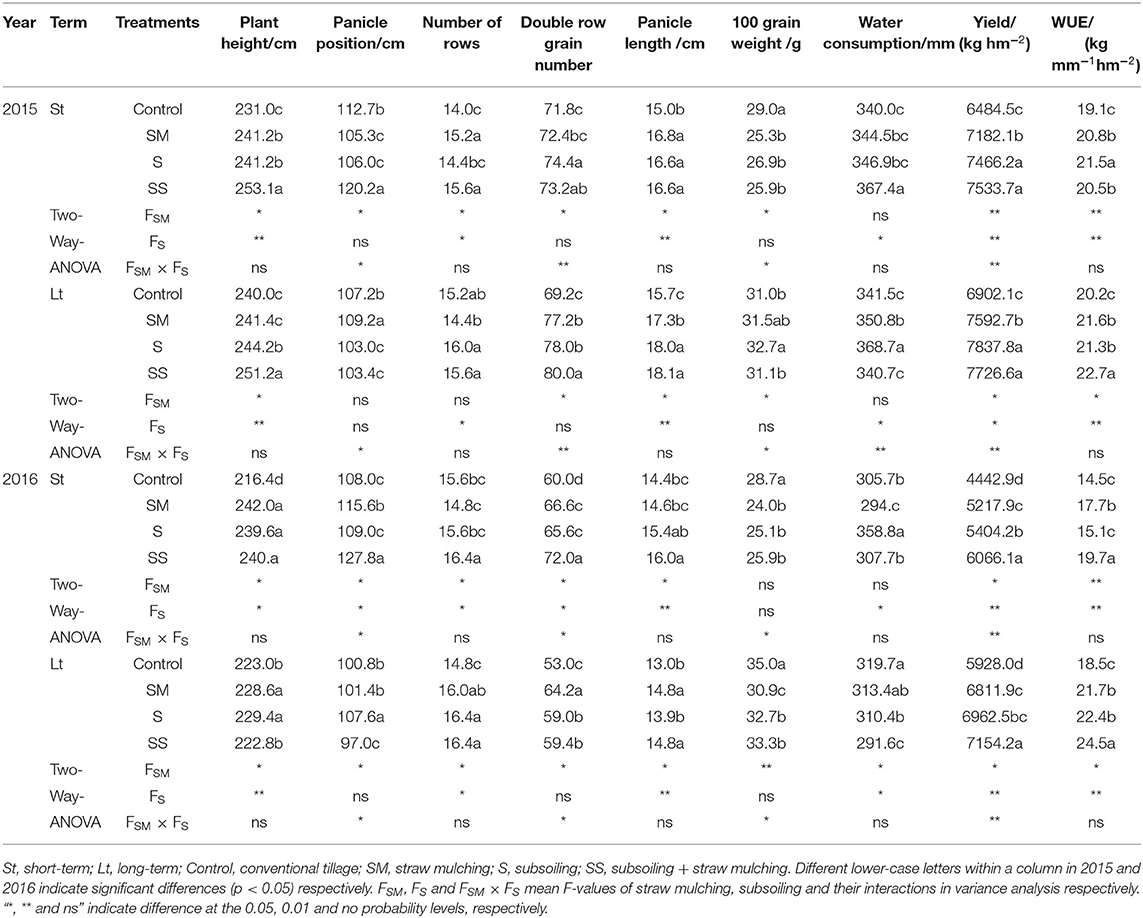
Table 5. Yield and water use efficiency and yield component of maize under the Control, SM, S and SS treatments in different years.
In 2016, in the short-term experiment, the panicle position, panicle row number, double row grain number, and panicle length under the SS treatment were higher than those under other treatments, yet the water consumption under the SS treatment was lower, and the yield under the SS treatment was significantly higher than that under other treatments; therefore, the WUE was higher. In the long-term experiment, the plant height, panicle position, and 100-grain weight under the SS treatment were lower than those under other treatments, and its water consumption was the lowest, but the yield was higher. Therefore, the WUE under the SS treatment was significantly higher than that under other treatments. Compared with the short-term experiment, the 100-grain weight, yield, and WUE in the long-term experiment were higher. Based on the comprehensive factors, the effect of the SS treatment on increasing yield and saving water was better than other treatments.
Annual Total Yield, Water Consumption, and Water Use Efficiency of Wheat and Maize Under Different Measures in Different Years
As seen in Table 6, in 2015, the annual total yield of wheat and maize under the S treatment was the highest, while, in 2016, the SS treatment in the short-term experiment showed the highest total yield compared with the other treatments, but there was no significant difference between the SM, S, and SS treatments in the long-term experiment. The annual total yield of wheat and maize in 2015 was higher than that in 2016, and the annual total water consumption was still higher in 2015. In all treatments, the annual total water consumption under the S treatment in the two experiments in 2015 and in the short-term experiment in 2016 was higher than that under other treatments. The annual total WUE in the long-term treatments in 2016 was higher than the short-term treatments, and that under the SS treatment was significantly higher than under the other treatments. In the two experiments in 2015, the S treatment resulted in the highest annual total WUE.
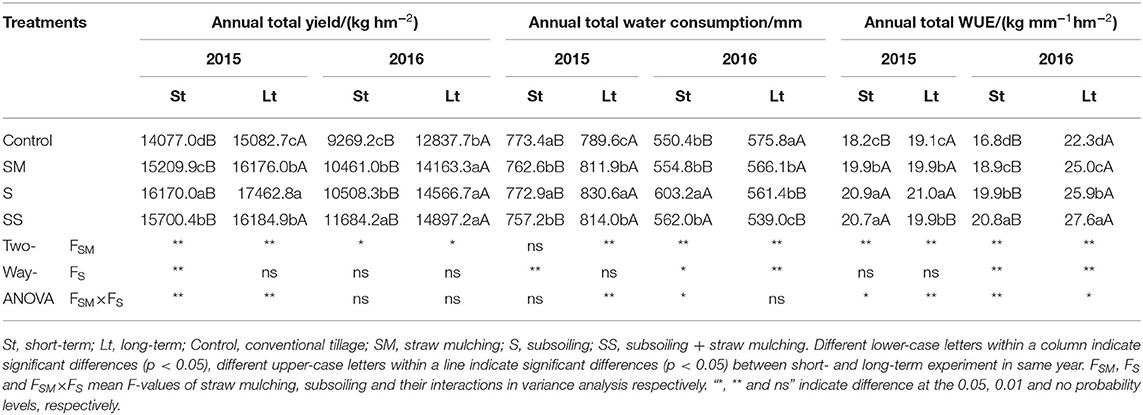
Table 6. Annual total yield, water consumption and water use efficiency of wheat and maize under the Control, SM, S and SS treatments in different years.
Correlation Analysis Between Biomass, Yield, Water Consumption, WUE of Wheat and Maize, and Annual Total Yield Under Different Term Experiments
The correlation between yield, biomass, water consumption, WUE of wheat and maize, and annual total yield was analyzed (Table 7). It can be seen that the annual total yield was significantly (P < 0.05) or extremely significantly (P < 0.01) positively correlated with yield and water consumption of wheat, biomass, and the yield and WUE of maize under the short-term experiment. However, under the long-term experiment, the annual total yield was significantly or extremely significantly positively correlated with biomass, yield, and water consumption of wheat, and yield, and water consumption of maize, while negatively correlated with wheat WUE. The above indicates that the same treatment has different effects on the total yield and WUE of wheat and maize in different years. We should coordinate the biomass and water consumption of wheat and maize to promote the annual total yield and WUE.
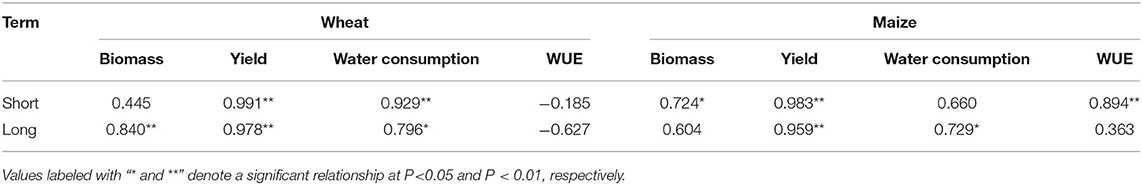
Table 7. Correlation between annual total yield and yield, water consumption and WUE of wheat and maize under different term experiments.
Discussion
Impact of Different Measures on Soil Water Storage and Water Consumption of Crops
The effects of the different measures are mainly to increase organic matter content, improve soil pore characteristics and soil structure (Yang et al., 2013), and to regulate the exchange of water and gas at the soil interface, thus affecting soil moisture and crop growth. It also slows down the damage to crops caused by unfavorable environmental conditions, promotes the stable and increased yield (Yang et al., 2018), and boosts the water use efficiency of the crop (Hou et al., 2012). Different measures in different duration have various impacts on the annual water content regulation and utilization characteristics of wheat and maize.
In our study, it was found that, during the wheat growth phase, from 2014 to 2015, the soil water storage in the short-term experiment at the regreening stage was higher than that in the long-term experiment because of the lower population number in the short-term experiment. Furthermore, the short-term SS treatment resulted in the highest soil water storage at the whole stages of wheat, except the jointing stage, compared with the long-term SS treatment and other treatments in two experiments, possibly due to a temporary large increase in soil porosity through short-term subsoiling, which improved the infiltration capability of the soil (Pagliai et al., 2004; Jin et al., 2007), especially in years with more rainfall and the retention of water. It is also more likely to generate an immediate impact for the given cropping season (Bodner et al., 2015), especially combined with straw mulching that reduces evaporative losses and prevents rain from hitting the ground directly and causing damage to newly loose soil (Liu et al., 2017). Moreover, the short-term SS treatment maintained low population numbers, thereby reducing soil water consumption (Figure 2A). However, from the booting to the filling stages, although the population numbers under the S and SM treatments in the long-term experiment are still higher than that in the long-term experiment, their soil water storage was higher than that in the short-term experiment because they had a stable soil structure (Yang et al., 2018) and can resist the destruction of soil structure by rain and keep more water to supply crops after the jointing stage. Yet, from 2015 to 2016, the long-term SS treatment retained more water in the soil compared with the short-term SS and other treatments during the whole stage of wheat. This may also be caused by the stable soil stratification and soil structure formed by the long-term S and SM treatments. Moreover, less erosion of the soil occurs during precipitation, and the soil structure is preserved, which improves crop root growth (Shi et al., 2016; Sun et al., 2017), compared with the other treatments. As for the water consumption, the short-term SS treatment consumed the lowest amount of water during the whole stage of wheat from 2014 to 2015, but it was the highest from 2015 to 2016, which was related to biomass [high biomass appeared in the short-term SS treatment from 2015 to 2016 (Figure 7A)]. However, the long-term SS treatment had opposite results compared with the short-term SS treatment because there was higher biomass from 2014 to 2015, and this was reversed from 2015 to 2016 (Figure 7). We also found that the short-term and long-term S treatments consumed less water, although they had high biomass at the different stages of wheat, which may be due to lower losses by soil evaporation between plants. This may be because of high vegetation coverage, and it needs further study.
However, the effect on the soil water storage of maize in the next stubble is not the same. At different growth stages of maize in 2015, the soil water storage of each treatment in the long-term experiment was higher than that in the short-term experiment except the control, which is consistent with the biomass and indicates that, compared with loss of maize transpiration, the high vegetation coverage during the maize growth season is more conducive to reducing intertree evaporation and maintaining a high-soil water content. In addition, the soil water storage under the long-term SS treatment was the highest at the whole stage, which indicates that mulching was highly effective in reducing evaporation (Zaongo et al., 1997; Ramakrishna et al., 2006; Eberbach et al., 2011) because straw could well protect the soil from rainfall damage to the soil structure and pore, especially when combined with subsoiling in summer. In addition, the SS treatment promoted the root growth in the wheat season, thus improving the soil structure, and promoted water storage and moisture conservation. Water consumption of maize under the SS treatment in the long-term treatment was the lowest compared with the other treatments from the sowing to filling stages in 2015. However, in 2016, the soil water storage of maize in the short-term experiment was higher than that in the long-term experiment, especially under the SM and SS treatments, which was higher than other treatments. This indicates that straw mulching served as a protective covering layer and improved moisture conservation (Akhtar et al., 2019), especially along with subsoiling. The SS treatment in the long-term experiment led to lower water consumption, which kept more water in the soil, followed by the SM treatment in the short-term experiment, especially at the big bellmouth-filling stage. This indicates that subsoiling combined with straw mulching was a good choice for reducing soil water losses from soils in years of less rainfall.
Comparing the rainfall of these 2 years, we found that, in the years with more rainfall (2014–2015), rainfall alone could fulfill the entire water requirement of maize, but not of wheat. In the period of less rainfall in 2015–2016, deeper soil water had to be accessed by the crops.
Impact of Different Measures on Physiological Characteristics of Crops
When soil water availability is improved, the physiological characteristics of crops are also improved (Xiao et al., 2007; Lamptey et al., 2020). Subsoiling is more beneficial to the improvement of photosynthetic physiological characteristics of wheat (Yang et al., 2014b) and maize (Lamptey et al., 2020). Straw mulching can increase soil moisture and improve the leaf area index and the net photosynthetic rate of wheat (Zhang et al., 2010, 2019; Yang et al., 2014b). However, our study found that, in 2015, although the soil moisture was lower at the heading and filling stages of wheat, the Pn of the SM treatment in the short-term experiment at the two growth stages of wheat was higher than that of other treatments, and also higher than that of the SM treatment in the long-term experiment. In addition, the Pn under the SS treatment (low-soil water) in the long-term experiment was higher than that under the SS treatment in the short-term experiment. These indicate that moderate drought is beneficial for increasing the Pn of plants (Zhang et al., 2008), but these findings are not in accord with the research by Lamptey et al. (2020), which may be related to differences in crop types and climate. Furthermore, the short-term SM treatment and the long-term SS treatment were more beneficial for improving the Pn of wheat, and the Tr of those treatments was also relatively higher, but, compared with the control, the Pn increased more significantly than Tr, which improved the LWUE and promoted the accumulation of dry matter (Shi et al., 2016). In 2016, with the lower rainfall, in the long-term experiment, the Pn under the S treatment was the highest at the heading and booting stages, while that under the SS treatment was the highest at the filling stage. This shows that the S and SS treatments promoted chlorophyll synthesis, slowed chlorophyll degradation, and maintained a higher leaf area index and the photosynthetic rate, thus prolonging the functional period and increasing the distribution of dry matter post-anthesis (Li et al., 2006), ensuring the accumulation of dry matter and grain filling, and ultimately resulting in the increment of crop yields (Sun et al., 2017; Xu et al., 2017). This also indicates that the long-term practices improve reliability of access to soil moisture by buffering against the influence of drought stress (Bodner et al., 2015).
However, the short-term SM treatment and the long-term SS treatment were more beneficial for increasing of the LWUE. The results show that, in the year with less rainfall (2016), long-term application of measures was more beneficial for improving the photosynthetic physiological characteristics of wheat and promoting Pn, which might be due to an improvement of soil structure and aggregate stability (Dossou-Yovo et al., 2016; Zhang et al., 2017a) and an increase and retention in soil water content (Zhang et al., 2015). For maize, in 2015, short-term measures were more beneficial for improving the Pn of maize than long-term application, and the Tr was also significantly higher than that under the long-term application, because they had higher stomatal conductance (gs) of its leaves. However, soil moisture content was lower under the short-term treatment than that under the long-term treatment, which indicates that gs does not necessarily increase with soil moisture but will decrease when soil moisture is below a critical level (Baronti et al., 2014). At different years, the Pn of maize under the SS treatment was significantly higher than those under the other treatments in the two experiments, while the LWUE of the SS treatment at the filling stage of maize in different years was still higher than other treatments, which was related to high leaf N and leaf area indexes (Zhang et al., 2019). Compared with the short-term experiment, the Pn and LWUE of maize in the long-term experiment were higher, and the SS treatment had the best results. This indicates that the long-term application of treatments results in stable soil physical properties that regulate soil moisture, temperature, nutrients, and microbial community and are more beneficial for improving the photosynthetic efficiency per unit water utilization and promoting dry matter accumulation (Shi et al., 2016).
Impact of Soil Moisture Conservation Measures on Growth and Water Use of Crops
The improvement of soil moisture regulation, physiological characteristics, and the characteristics of soil microbial communities (Ji et al., 2014) through such agricultural practices is beneficial for crop growth, yield, and water production efficiency. Wang et al. (2013) showed that subsoiling improved photosynthetic capacity at the later stages of wheat growth, leading to yield increases and water savings. Straw mulching preserved the topsoil structure and maintained water infiltration (Barton et al., 2004), increased soil organic carbon, improved the physicochemical properties of soil (Jordán et al., 2010), altered the soil temperature, and provided a good living condition for crop growth. Thus, straw mulching had a positive effect on maize yield and WUE (Ocio et al., 1991). However, straw mulch has also been shown to negatively affect crop growth and yield (Li et al., 2008; Balwinder et al., 2011). In our study, it was found that, in 2015, with more rainfall, the yield of wheat under the SM and SS treatments was not higher than that under the S treatment because of changes in microclimate (soil surface temperature) (Balwinder et al., 2011). Therefore, the S treatment in two experiments increased the yield by 14.6 and 17.7% and had a positive effect on the 1,000-grain weight, similar to the findings of Kuang et al. (2020), and the WUE under the S treatment in the long-term experiment was the highest, 13.7% higher than those under the control. These indicate that subsoiling improved photosynthesis, dry matter accumulation (Shi et al., 2016), translocation post anthesis to the grain (Huang et al., 2009), and could improve soil structure by eliminating soil compaction, thereby increasing both yield and water use efficiency (Pikul and Kristian, 2003). In contrast, the growing season of summer maize is generally from middle June to end of September, and lower temperature may have positive effect on its growth (Zhang et al., 2019). Accordingly, in our study, we found that the yield and WUE of maize of the short-term and long-term SS treatments were all higher than those of other treatments in two experiments, the yield was 16.2 and 11.9% higher than that of the control, and the WUE was 7.3 and 12.4% higher than that of the control, respectively. This also agrees with previous studies that have concluded that straw mulching modifies the crop growth environment and increases the yield (Zhang et al., 2019) and WUE of maize (Gao et al., 2019), and the effect is more obvious when straw mulching is combined with subsoiling.
However, Yang et al. (2020) found that mulching was more effective in avoiding yield losses in a dry climate than in a humid climate. In our study, we found that, in 2016, with less rainfall, the yield and WUE of wheat of the SM treatment in the short-term experiment and the SS treatment in the long-term experiment were the highest; the yield increased by 16.4 and 12.1%, and the water use efficiency increased by 12.2 and 15.9% compared to the control, respectively. The yield and WUE of maize of the SS treatment in the short-term experiment were 36.5 and 35.9% higher than that of the control, respectively. In the long-term experiment, the yield and WUE of the SS treatment were still the highest, at 23.3 and 32.4% higher than that of the control, respectively. The results agree with previous studies that have shown that the SS treatment reduces evaporation, improves soil water retention, and promotes crop growth (Zhang et al., 2019) and water utilization during the maize growing season (Kuang et al., 2020), especially in the year of less rainfall.
The total yield of wheat and maize under the S treatment was the highest in the short-term experiment of 2 years, which is consistent with the results obtained by Yang et al. (2014a). The annual total WUE of these two scenarios was much higher than that of other scenarios, at 24.4 and 23.8% higher than that of the control, respectively. The total WUE of all the treatments, especially the SS treatment, in the long-term experiment in 2016 was significantly higher than that in the short-term experiment and that in 2015. This suggests that, in years with less rainfall, long-term application of SS can better keep more water in soil and then improve photosynthetic physiological characteristics, coordinate biomass distribution, and ameliorate crop water stress, thus promoting crop yield and WUE. This further indicates that the effects of tillage and straw mulch on grain yield and WUE greatly depend on in-season rainfall (Wang and Shangguan, 2015; Zhang et al., 2017b). This practice can be a good choice for farmers, because it saves time and handling costs, instead of burning the crop straw in the open field, and, as such, also avoids environmental problems (Sun et al., 2016).
Conclusion
In this study, we compared the effects of the short-term and long-term applications of proper tillage and soil conservation measures. The short- and long-term applications of the SM, S, and SS treatments improved the photosynthetic characteristics of wheat and maize and promoted dry matter accumulation, which increased yield and WUE of wheat and maize. Long-term applications of the same measure were more beneficial for improving the yield and WUE of wheat and maize. Rainfall played a vital role as higher crop yield was possible under larger rainfall, for example, in 2015 compared with 2016. Thus, according to our results, during a drought year, such as 2016, the S treatment can be the better choice for increasing annual total water efficiency and production, whereas, in years of adequate rainfall, such as 2015, the SS treatment performed better. The long-term practices had a better effect on yield and WUE of wheat and maize than the short-term treatments in the various rainfall years. Therefore, the appropriate climate suitable measures (S and SS), especially in the long-term treatments, as investigated in this study, should be adopted to regulate the water consumption of wheat and maize during the various growth stages of wheat and maize rotation system.
Data Availability Statement
The original contributions presented in the study are included in the article, further inquiries can be directed to the corresponding authors.
Author Contributions
YY wrote the main manuscript. MP edited language and modified the main manuscript. DT edited the language and modified the main manuscript. XP performed most of the experiments. CG prepared the Figure and Table of the manuscript. JW and Y-LD revised and gave some advice for the manuscript. All authors reviewed the manuscript.
Funding
This work was financially supported by the National Key R&D Program of China (Grant No. 2017YFD0301102), the National Natural Science Foundation of China (Grant No. U1404404), the Re-USe of Treated effluent for agriculture (RUST) project of the Netherlands Organization for Scientific Research (NWO), and Special Fund for Independent Innovation Project of Henan Academy of Agricultural Sciences (Grant No. 2021ZC33).
Conflict of Interest
The authors declare that the research was conducted in the absence of any commercial or financial relationships that could be construed as a potential conflict of interest.
Publisher's Note
All claims expressed in this article are solely those of the authors and do not necessarily represent those of their affiliated organizations, or those of the publisher, the editors and the reviewers. Any product that may be evaluated in this article, or claim that may be made by its manufacturer, is not guaranteed or endorsed by the publisher.
References
Acharya, C., and Sharma, P. D. (1994). Tillage and mulch effects on soil physical environment root growth, nutrient uptake and yield of maize and wheat on an alfisol in north-west India. Soil Till Res. 32, 291–302. doi: 10.1016/0167-1987(94)00425-E
Akhtar, K., Wang, W., Ren, G., Khan, A., Feng, Y., Yang, G., et al. (2019). Integrated use of straw mulch with nitrogen fertilizer improves soil functionality and soybean production. Environ. Int. 132. doi: 10.1016/j.envint.2019.105092
Balwinder, S., Humphreys, E., Eberbach, P. L., Katupitiya, A., Yadvinder, S., and Kukal, S. S. (2011). Growth, yield and water productivity of zero till wheat as affected by rice straw mulch and irrigation schedule. Field Crops Res. 121, 209–225. doi: 10.1016/j.fcr.2010.12.005
Baronti, S., Vaccari, F. P., Miglietta, F., Calzolari, C., Lugato, E., Orlandini, S., et al. (2014). Impact of biochar application on plant water relations in Vitis vinifera (L.). Eur. J. Agron. 53, 38–44. doi: 10.1016/j.eja.2013.11.003
Barton, A. P., Fullen, M. A., Mitchell, D. J., Hocking, T. J., Liu, L., Wu Bo, Z., et al. (2004). Effects of soil conservation measures on erosion rates and crop productivity on subtropical Ultisols in Yunnan Province, China. Agric. Ecosyst. Environ. 104, 343–357. doi: 10.1016/j.agee.2004.01.034
Bodner, G., Alireza Nakhforoosh, A., and Kaul, H. P. (2015). Management of crop water under drought: a review. Agron. Sustain. Dev. 35, 401–442. doi: 10.1007/s13593-015-0283-4
Dossou-Yovo, E. R., Bruggeman, N., Ampofo, E., Igue, A. M., Jesse, N., Huat, J., et al. (2016). Combining no-tillage, rice straw mulch and nitrogen fertilizer application to increase the soil carbon balance of upland rice field in northern Benin. Soil Tillage Res. 163, 152–159. doi: 10.1016/j.still.2016.05.019
Eberbach, P. L., Humphreys, E., and Kukal, S. S. (2011). The effect of rice straw mulch on evapotranspiration, transpiration and soil evaporation of irrigated wheat in Punjab, India. Agric. Water Manage. 98, 1847–1855. doi: 10.1016/j.agwat.2011.07.002
Faramarzi, M., Yang, H., Schulin, R., and Abbaspour, K. C. (2010). Modeling wheat yield and crop water productivity in Iran: implications of agricultural water management for wheat production. Agric. Water Manage. 97, 1861–1875. doi: 10.1016/j.agwat.2010.07.002
Fischer, R. A., and Turner, N. C. (1978). Plant production in the arid and semiarid zones. Annu. Rev. Plant Phys. 29, 277–317. doi: 10.1146/annurev.pp.29.060178.001425
Gao, H. H., Yan, C. R., Liu, Q., Li, Z., Yang, X., and Qi, R. M. (2019). Exploring optimal soil mulching to enhance yield and water use efficiency in maize cropping in China: a meta-analysis. Agric. Water Manage. 225:105741. doi: 10.1016/j.agwat.2019.105741
Hawkins, E., Fricker, T. E., Challinor, A. J., Ferro, C. A. T., Ho, C. K., and Osborne, T. M. (2013). Increasing influence of heat stress on French maize yield from the 1960s to the 2030s. Glob. Chang. Biol. 19, 937–947. doi: 10.1111/gcb.12069
He, J., Li, H. W., Wang, X. Y., McHugh, A. D., Li, W. Y., Gao, H. W., et al. (2007). The adoption of annual subsoiling as conservation tillage in dryland maize and wheat cultivation in northern China. Soil Tillage Res. 94, 493–502. doi: 10.1016/j.still.2006.10.005
Hou, X. Q., Li, R., Han, Q. F., Wang, W., and Jia, Z. K. (2012). Effects of different tillage patterns during summer fallow on soil water conservation and crop water use efficiency. Trans. CSAE 28, 94–100. doi: 10.3969/j.issn.1002-6819.2012.03.017
Huang, M., Wu, J. Z., Li, Y. J., Yao, Y. Q., Zhang, C. J., Cai, D. X., et al. (2009). Effects of different tillage management on production and yield of winter wheat in dryland. Trans. CSAE 25, 50–54.
Ji, B. Y., Hu, H., Zhao, Y. L., Mu, X. Y, Liu, K., et al. (2014). Effects of deep tillage and straw returning on soil microorganism and enzyme activities. Scien. World J. 451493. doi: 10.1155/2014/451493
Jin, K., Cornelis, W. M., Schiettecatte, W., Lu, J., Yao, Y., Wu, H. J., et al. (2007). Effects of different management practices on the soil-water balance and crop yield for improved dryland farming in the Chinese Loess Plateau. Soil Tillage Res. 96, 131–144. doi: 10.1016/j.still.2007.05.002
Jordán, A., Zavala, L. M., and Gil, J. (2010). Effects of mulching on soil physical properties and runoff under semi-arid conditions in southern Spain. Catena 81, 77–85. doi: 10.1016/j.catena.2010.01.007
Kuang, N. K., Tan, D. C., Li, H. J., Gou, Q. S., Li, Q. Q., and Han, H. F. (2020). Effects of subsoiling before winter wheat on water consumption characteristics and yield of summer maize on the North China Plain. Agric. Water Manage. 227, 105786. doi: 10.1016/j.agwat.2019.105786
Lamptey, S., Li, L. L., Xie, J. H., and Coulter, J. A. (2020). Tillage system affffects soil water and photosynthesis of plastic-mulched maize on the semiarid Loess Plateau of China. Soil Tillage Res. 196, 104479. doi: 10.1016/j.still.2019.104479
Lei, J. Y., Wu, F. Q., Wang, J., and Guo, J. H. (2008). Effects of conservation tillage on soil physical properties and corn yield. Trans. CSAE 24, 40–45.
Li, Q., Chen, Y., Mengyu, L., Zhou, X., Yu, S., and Dong, B. (2008). Effects of irrigation and straw mulching on microclimate characteristics and Water use efficiency of winter wheat in North chinas. Plant Prod. Sci. 11, 161–170. doi: 10.1626/pps.11.161
Li, Q. Q., Dong, B. D., Qiao, Y. Z., Liu, M. Y., and Zhang, J. W. (2010). Root growth, available soil water, and water-use efficiency of winter wheat under different irrigation regimes applied at different growth stages in North China. Agric. Water Manage. 97, 1676–1682. doi: 10.1016/j.agwat.2010.05.025
Li, Z., Lai, X. F., Yang, Q., Yang, X., Cui, S., and Shen, Y. Y. (2018). In search of long-term sustainable tillage and straw mulching practices for a maize-winter wheat-soybean rotation system in the Loess Plateau of China. Field Crops Res. 217, 199–210. doi: 10.1016/j.fcr.2017.08.021
Li, Y., Wu, J., Huang, M., Yao, Y., and Jin, K. (2006). Effects of different tillage systems on photosynthesis characteristics of flag leaf and water use efficiency in winter wheat. Transac. Chinese Soc. Agric. Eng. 22:44–48.
Liu, X., Ren, Y., Gao, C., Yan, Z., and Li, Q. (2017). Compensation effect of winter wheat grain yield reduction under straw mulching in wide-precision planting in the North China Plain. Sci. Rep. 7:213. doi: 10.1038/s41598-017-00391-6
Ma, S. Y., Yu, Z. W., Shi, Y., Gao, Z. Q., Luo, L. P., Chu, P. F., et al. (2015). Soil water use: grain yield and water use efficiency of winter wheat in a long-term study of tillage practices and supplemental irrigation in the North China Plain. Agric. Water Manage. 150, 9–17. doi: 10.1016/j.agwat.2014.11.011
Mohanty, M., Bandyopadhyay, K. K., Painuli, D. K., Ghosh, P. K., Misra, A. K., and Hati, K. M. (2007). Water transmission characteristics of a Vertisol and water use efficiency of rainfed soybean (Glycine max (L.) Merr.) under subsoiling and manuring. Soil Tillage Res. 93, 420–428. doi: 10.1016/j.still.2006.06.002
Ocio, J. A., Brookes, P. C., and Jenkinson, D. S. (1991). Field incorporation of straw and its effects on soil microbial biomass and soil inorganic N. Soil Biol. Biochem. 3, 171–176. doi: 10.1016/0038-0717(91)90131-3
Pagliai, M., Vignozzi, N., and Pellegrini, S. (2004). Soil structure and the effect of management practices. Soil Tillage Res. 79, 131–143. doi: 10.1016/j.still.2004.07.002
Pikul, J. L., and Kristian, J. S. (2003). Water infiltration and storage affected by subsoiling and subsequent tillage. Soil Sci. Soc. Am. J. 3, 859–866. doi: 10.2136/sssaj2003.8590
Powles, S. B. (1984). Photo inhibition of photosynthesis induced by visible light. Rev. Plant Physiol. 35, 15–44. doi: 10.1146/annurev.pp.35.060184.000311
Qin, H. L., Gao, W. S., Ma, C. Y., Ma, L., and Yin, C. M. (2008). Effects of subsoiling on soil moisture under no-tillage 2 years later. Sci. Agric. Sin. 41, 78–85.
Ramakrishna, A., Tam, H. M., Wani, S. P., and Long, T. D. (2006). Effect of mulch on soil temperature, moisture, weed infestation and yield of groundnut in northern Vietnam. Field Crops Res. 95, 115–125. doi: 10.1016/j.fcr.2005.01.030
Schneider, F., Don, A., Hennings, I., Schmittmann, O., and Seidel, S. J. (2017). The effect of deep tillage on crop yield-what do we really know? Soil Till. Res. 174, 193–204. doi: 10.1016/j.still.2017.07.005
Shi, Y., Yu, Z., Man, J., Ma, S., Gao, Z., and Zhang, Y. (2016). Tillage practices affect dry matter accumulation and grain yield in winter wheat in the North China Plain. Soil Till. Res. 160, 73–81. doi: 10.1016/j.still.2016.02.009
Sun, J. F., Peng, H. Y., Chen, J. M., Wang, X. M., and Wei, M. (2016). An estimation of CO2 emission via agricultural crop residue open field burning in China from 1996 to 2013. J. Clean Prod. 112, 2625–2631. doi: 10.1016/j.jclepro.2015.09.112
Sun, X. F., Ding, Z. S., Wang, X. B., Hou, H. P., Zhou, B. Y., Yue, Y., et al. (2017). Subsoiling practices change root distribution and increase post-anthesis dry matter accumulation and yield in summer maize. PLoS ONE 12:e0174952. doi: 10.1371/journal.pone.0174952
Wang, L. F., and Shangguan, Z. P. (2015). Water-use efficiency of dryland wheat in response to mulching and tillage practices on the Loess Plateau. Sci. Rep. 5:12225. doi: 10.1038/srep12225
Wang, W., Han, Q. F., Lu, L. X., Hou, X. Q., Zhang, P., Jia, Z. K., et al. (2013). Effects of different tillage patterns on photosynthetic characteristics and yield of dryland wheat. Agric. Res. Arid Areas 31, 20–16. doi: 10.3969/j.issn.1000-7601.2013.01.004
Xiao, J. F., Liu, Z. D., Duan, A. W., Liu, Z. G., and Liu, H. (2007). Root distribution and water conservation characteristics of winter wheat under different soil moisture. Rural Water Conserv. Hydropower China 8, 18–21. doi: 10.3969/j.issn.1007-2284.2007.08.006
Xu, J., He, Z. K., Feng, Q. Q., Zhang, Y. Y., Li, X. S., Xu, J. J., et al. (2017). Effect of tillage method on photosynthetic characteristics and annual yield formation of winter wheat-summer maize cropping system. Plant Nutri. Fertiliz. Sci. 23, 101–109. doi: 10.11674/zwyf.16102
Yang, H. K., Wu, G., Mo, P., Chen, S. H., Wang, S. Y., Xiao, Y., et al. (2020). The combined effects of maize straw mulch and no-tillage on grain yield and water and nitrogen use efficiency of dry-land winter wheat (Triticum aestivum L.). Soil Tillage Res. 197:104485. doi: 10.1016/j.still.2019.104485
Yang, Y. H., Ding, J. L., Zhang, Y. H., Wu, J. C., Zhang, J. M., Pan, X. Y., et al. (2018). Effects of tillage and mulching measures on soil moisture and temperature, photosynthetic characteristics and yield of winter wheat. Agric. Water Manage. 201, 299–308. doi: 10.1016/j.agwat.2017.11.003
Yang, Y. H., Wu, J. C., Zhang, J. M., Pan, X. Y., Wang, Y., He, F., et al. (2017). Effects of different tillage measures maintaining soil moisture on water consumption characteristics and anniversary water utilization for wheat and maize. ACTA Agric. Boreali-sinica 32, 103–110. doi: 10.7668/hbnxb.2017.03.016
Yang, Y. H., Wu, J. C., Li, X. J., Pan, X. Y., Li, Z. J., and He, F. (2014a). Impact of tillage and soil moisture conservation measures on photosynthetic characteristics and water use of winter wheat. Chinese J. Eco-Agric. 22, 534–542. doi: 10.3724/SP.J.1011.2014.31106
Yang, Y. H., Wu, J. C., Mao, Y. P., Han, Q. Y., and He, F. (2013). Using computed tomography scanning to study soil pores under different soil structure improvement measures. Trans. CSAE 29, 99–108.
Yang, Y. H., Wu, J. C., Wang, H. Q., Guo, Q., He, F., and Pan, X. Y. (2014b). Effects of different measures of tillage and soil moisture conservation on anniversary water use efficiency of wheat and corn. Journal of irrigation drainage, 33(4/5): 63–66. doi: 10.13522/j.cnki.ggps.2014.04/05.014
Zaongo, C. G. L., Wendt, C. W., Lascano, R. J., and Juo, A. S. R. (1997). Interactions of water, mulch and nitrogen on sorghum in Niger. Plant Soil 197, 119–126. doi: 10.1023/A:1004244109990
Zhang, P., Wei, T., Wang, H., Wang, M., Meng, X., Mou, S., et al. (2015). Effects of straw mulch on soil water and winter wheat production in dryland farming. Sci. Rep. 5:10725. doi: 10.1038/srep10725
Zhang, Q. P., Wang, Z. N., Miao, F. H., and Wang, G. L. (2017b). Dryland maize yield and water-use efficiency responses to mulching and tillage practices. Agron. J. 109, 1196–1209. doi: 10.2134/agronj2016.10.0593
Zhang, X., Li, H., He, J., Wang, Q., and Golabi, M. H. (2009). Influence of conservation tillage practices on soil properties and crop yield for maize and wheat cultivation in Beijing, China. Aust. J. Soil Res. 47, 362–371. doi: 10.1071/SR08110
Zhang, X., Xin, X., Zhu, A., Zhang, J., and Yang, W. (2017a). Effects of tillage and residue managements on organic C accumulation and soil aggregation in a sandy loam soil of the North China Plain. CATENA 156, 176–183. doi: 10.1016/j.catena.2017.04.012
Zhang, X. N., Sun, X. Y., Wang, B. P., Qiao, J., Cui, L. J., and Huang, Y. (2008). Effects of soil moisture on photosynthetic characteristics of Larrea tridentata seedlings. J. Beijing Forestr. Univ. 30, 95–101. doi: 10.3321/j.issn:1000-1522.2008.02.016
Zhang, Y. Q., Wang, J. D., Gong, S. H., Xua, D., and Mo, Y. (2019). Straw mulching enhanced the photosynthetic capacity of field maize by increasing the leaf N use efficiency. Agric. Water Manage. 218, 60–67. doi: 10.1016/j.agwat.2019.03.023
Zhang, S. L., Lovdahl, L., and Tong, Y. A. (2005). Effects of different field management practices on winter wheat yield and water utilization efficiency in Weibei Loess Plateau. Trans. CSAE 21, 20–24. doi: 10.3321/j.issn:1002-6819.2005.04.005
Zhang, Y. L., Wang, L. C., Zou, C. M., Hu, X. D., He, S., and Zhu, J. G. (2010). Effects of conversation tillage on growth and WUE in wheat. Agric. Res. Arid Areas 28, 71–74.
Zhao, X. R., Zhao, X. J., and Chen, X. Z. (2009). Effects of conservation tillage on soil moisture on soil moisture and wheat yield. Trans. CSAE, 25(Supp.1), 6–10.
Keywords: short- and long-term, subsoiling, straw mulching, photosynthetic physiology, water use efficiency
Citation: Yang Y, Wu J, Du Y-L, Gao C, Pan X, Tang DWS and van der Ploeg M (2021) Short- and Long-Term Straw Mulching and Subsoiling Affect Soil Water, Photosynthesis, and Water Use of Wheat and Maize. Front. Agron. 3:708075. doi: 10.3389/fagro.2021.708075
Received: 11 May 2021; Accepted: 19 July 2021;
Published: 25 August 2021.
Edited by:
Michel Edmond Ghanem, Mohammed VI Polytechnic University, MoroccoReviewed by:
Xiancan Zhu, Anhui Normal University, ChinaWaqas ud din Khan, Government College University, Lahore, Pakistan
Rachid Mrabet, National Institute for Agricultural Research, Morocco
Copyright © 2021 Yang, Wu, Du, Gao, Pan, Tang and van der Ploeg. This is an open-access article distributed under the terms of the Creative Commons Attribution License (CC BY). The use, distribution or reproduction in other forums is permitted, provided the original author(s) and the copyright owner(s) are credited and that the original publication in this journal is cited, in accordance with accepted academic practice. No use, distribution or reproduction is permitted which does not comply with these terms.
*Correspondence: Yonghui Yang, eWFuZ3lvbmdoMjAyMEAxMjYuY29t