
95% of researchers rate our articles as excellent or good
Learn more about the work of our research integrity team to safeguard the quality of each article we publish.
Find out more
ORIGINAL RESEARCH article
Front. Agron. , 15 January 2021
Sec. Plant-Soil Interactions
Volume 2 - 2020 | https://doi.org/10.3389/fagro.2020.607792
 Biswajit Karmakar1*
 Stephan M. Haefele2
 Amelia Henry3
 Md Humayun Kabir1
 Aminul Islam1Jatish Chandra Biswas1
Nitrogen (N) use efficiency in rainfed agriculture is generally low because of poor management and unavailability of suitable rice genotypes. There is a need to select rice genotypes with high N use efficiency for these specific environments, which was investigated at the Bangladesh Rice Research Institute, Regional Station, Rajshahi, in two successive years. The performance of six rice genotypes, IR7437170-1-1, BR7873-5*(NIL)-51-HR6, IR83377-B-B-93-3, International Rice Research Institute (IRRI) 123, IR83381-B-B-6-1, and Binadhan-7, were tested under four N rates (0, 55, 83, and 110 kg N ha−1) in a strip-plot design. Grain yields generally increased up to 83 kg N ha−1 and declined thereafter. Depending on N rates, mean grain yields increased by 35–45% compared to the control (N0). However, the grain yields of IR83377-B-B-93-3, IRRI 123, and Binadhan-7 increased up to 110 kg N ha−1. N uptake and its use efficiencies were the highest in IR83377-B-B-93-3, which was at par with those in IRRI 123. Bangladesh Rice Research Institute (BRRI) dhan56 and Binadhan-7 showed intermediate performance, while BRRI dhan57 and IR83381-B-B-6-1 showed lower N uptake and N efficiencies. Between 16.5 and 19.2 kg N uptake was required to produce 1 ton of paddy. The genotypes IR83381-B-B-93-3 and IRRI 123 were the most N use efficient irrespective of N rates, but BRRI dhan57 and IR87781-B-B-6-1 were observed to be inefficient genotypes, while BRRI dhan56 and Binadhan-7 were intermediate. Thus, this study indicates the need to test existing and new germplasm for optimal N rates and their NUE, especially in rainfed environments where optimized resource use is essential for higher yields and increased farmers' income.
More than 50% of rice fields (5.1 m ha) in Bangladesh are rainfed (Karmakar et al., 2015), which may experience early, intermittent, or terminal drought, hampering yields and contributing to inefficient use of added inputs. Of all plant nutrients, N is the most yield limiting in different agro-ecological zones of the world (Fageria and Baligar, 2005), and the utilization efficiency of applied N in rainfed systems is lower than in irrigated lowland rice ecosystems (Haefele et al., 2008). A major reason for N limitation in these systems is low recovery efficiency of applied N (Fageria et al., 2011). Uptake of applied N is typically less than 40% in cereal crops (Raun et al., 2002); this low uptake is associated with N losses from the soil through leaching, denitrification, and volatilization (Fageria and Baligar, 2005). Many research studies have focused on crop management to improve N efficiency by reducing N losses and increasing N uptake. However, genotype selection for improved N use efficiency (NUE) is another option of resource optimization. Many studies worldwide have been accomplished on nitrogen use efficiencies of rice genotypes under water stress (Haefele et al., 2008; Wu et al., 2016); however, limited research has been conducted on genotype selection for increased NUE under rainfed environments in Bangladesh. It could be an important step to improve rice yield through better use of applied and indigenous soil N.
Screening, selection, and evaluation of rice genotypes in the breeding process are usually conducted under standard conditions, including the use of high inputs and optimal crop management practices (Haefele et al., 2008). Fertilizer rates used by breeders are often above the rates used by most farmers (Inthapanya et al., 2000a). In general, fertilizer use in rainfed areas is lower than in irrigated culture due to several reasons including limited resources and risk management. Development of rice genotypes with improved NUE is therefore essential for rainfed ecosystems (Kant et al., 2011). Widespread acceptance and adoption of rice varieties by rainfed farmers depends on performance under suboptimal nutrient conditions considering that many farmers cannot afford or do not intend to apply fertilizers at the recommended levels. Genotypic variability and genotype by N rate interactions might exist (Gallais and Coque, 2005; Ju et al., 2015), and studies needs to be conducted in real field conditions to be relevant for farmers. Therefore, screening of rice genotypes under suboptimal nutrient conditions is necessary to identify genotypes that are most likely to perform well in farmers' field conditions.
The northwest part (Rajshahi region) of Bangladesh is drought prone and experiences low and erratic rainfall and extreme temperature events (Karmakar et al., 2015) and has limited irrigation potential (Saleh and Bhuiyan, 1995; Saleh et al., 2000). Drought is also predicted at the beginning of the wet season (WS), usually prior to transplanting of rice seedlings, and at the reproductive stage (panicle initiation to panicle exertion and grain filling) (Karmakar and Sarkar, 2015). However, rice crops could experience intermittent drought at any growth stage due to uneven rainfall patterns (Kamoshita et al., 2008). The majority of northwest Bangladesh is considered the Barind Tract, featuring a series of undulating terraces and higher elevation ranging between 20–40 m asl (Riches, 2008). Mean annual rainfall is lowest (1,000 to 1,200 mm) in the northwestern region (Saleh et al., 2000; Karmakar et al., 2012) compared to 1,000 to 5,000 mm in other areas in Bangladesh (Karmakar and Sarkar, 2015). Karmakar et al. (2010) reported that only 800 mm of rain occurred in Rajshahi during 2009, and the trend is declining by 3.1 mm year−1 during last five decades (Ferdous and Baten, 2011).
Water and nutrient availability are the two major constraints that cause low productivity in most of the rainfed rice fields of Asia (Haefele et al., 2008). Consequently, most rice farmers achieve <60% of the genetic yield potential of high-yielding rice varieties (Dobermann and Fairhurst, 2000) because of many factors including low NUE. Efficient and cost-effective N management practices intend to maximize N uptake from applied and soil indigenous N sources and thus reduce production cost and environmental pollution. Optimal plant N uptake at harvest of modern rice varieties has been estimated at about 15 kg N t−1 grain yield (Dobermann, 2005; Witt et al., 2007), but in general, it has not been characterized in drought-prone rice systems. Therefore, cultivar improvement for tolerance to abiotic stress especially drought must be combined with management approaches that improve NUE in rainfed environments (Fischer, 1998). Improving N-efficient genotypes, combined with proper agronomic management, offers exciting prospects to improve NUE of the system. Therefore, this study was conducted to investigate the response of different rice genotypes under a range of N rates and to identify N use-efficient genotypes for rainfed environments.
The experiments in this study were conducted at the experimental farm of the Bangladesh Rice Research Institute, Regional Station, Rajshahi, Bangladesh (24°22′N, 88°40′E; 40 m from sea level) in the High Gangetic River Floodplain. Initial soil properties of the experimental field, which is classified as calcareous alkaline silty loam (BARC, 2018) are shown in Table 1.
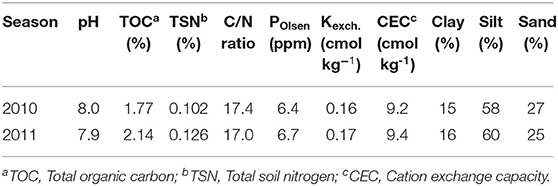
Table 1. Soil properties of composite samples (0–20 cm) collected from the experimental plots at BRRI Regional Station, Rajshahi.
The experiments utilized six rice genotypes and four N rates in a strip-plot design with three replications during two successive WSs (2010 and 2011) from July to November. N rates considered were N0 = control (no N applied), N55 = 55 (33% lower than the recommended dose applied), N83 = 83 [soil test based (STB), recommended dose applied], and N110 = 110 kg N ha−1 (33% higher than the recommended dose applied), and N with different rates was placed in vertical plots, while the six rice genotypes (Table 2) were placed in horizontal plots. The rice genotypes were collected from the International Rice Research Institute (IRRI), Bangladesh Rice Research Institute (BRRI), and Bangladesh Institute of Nuclear Agriculture (BINA). The breeding lines were developed by crossing drought-tolerant entries with high-yielding popular drought-susceptible lines. The parentage of the rice genotypes is presented in Table 2. Unit plot size was 3 × 4 m.
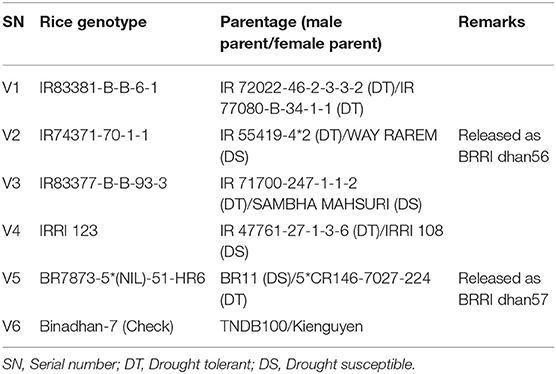
Table 2. Rice genotypes used in this study.
Seedlings were grown according to traditional farm practice. Sprouted seeds were sown in a seedbed at 80 g m−2 (BRRI, 2011) on 15 July in each year. The seedbed was fertilized with N, P, K, and S at 46, 20, 30, and 18 kg ha−1, respectively. Triple super phosphate (TSP), muriate of potash (MOP), and gypsum were applied basally during the final land preparation. Urea was top dressed at 10 days after seeding (DAS). Land preparation was done by plowing followed by puddling of the flooded field after sufficient rainfall. Individual plots were separated by levees. A polythene sheet was placed down to a 50-cm depth inside the levees to prevent lateral nutrient movement between treatments. The STB nutrient rates (15, 38, 11, and 1 kg ha−1, respectively, for P, K, S, and Zn) were applied in all plots as basal fertilizer. Three 25-day-old seedlings were transplanted at 20 cm × 15 cm spacing on 10 August in both years. According to each treatment, N as urea was top dressed in three equal splits at about 10, 25, and 40 days after transplanting (DAT), synchronizing with rainfall or wet soil conditions. Standard crop management practices were followed for all treatments (BRRI, 2011).
The experiments were conducted under rainfed conditions. The soil was puddled and initially flooded in both seasons and subsequently became dried out as the only water received after planting was from rainfall. Data on rainfall, air temperature, and sunshine hours were collected from the nearby meteorological station of BRRI Rajshahi, 50 m away from the experimental plots. Total rainfall from July to November of 2010 and 2011 was 461 and 810 mm, respectively (Figure 1). Although the total rainfall in July to November 2010 was much lower than in 2011, rainfall in 2010 was well-distributed throughout the season, especially up to the reproductive stage of the crop (mid-October 2011). Uneven distribution of rainfall was observed in 2011; major rains occurred during mid-July to mid-September, and thereafter, no rains occurred. The crop was therefore severely affected by drought in 2011. Relative humidity (%) in July to November of 2010 and 2011 was presented in Figure 2. During the experimentation period, the highest and the lowest temperatures were 38 and 13.6°C in July and 37.5 and 13.3°C in November, respectively. However, monthly mean maximum and minimum temperatures were 32.6°C and 24.2°C in 2010 and 32.1 and 23.8°C in 2011, respectively, at BRRI Rajshahi. The mean daily sunshine duration was 6.14 and 5.65 h in 2010 and 2011, respectively.
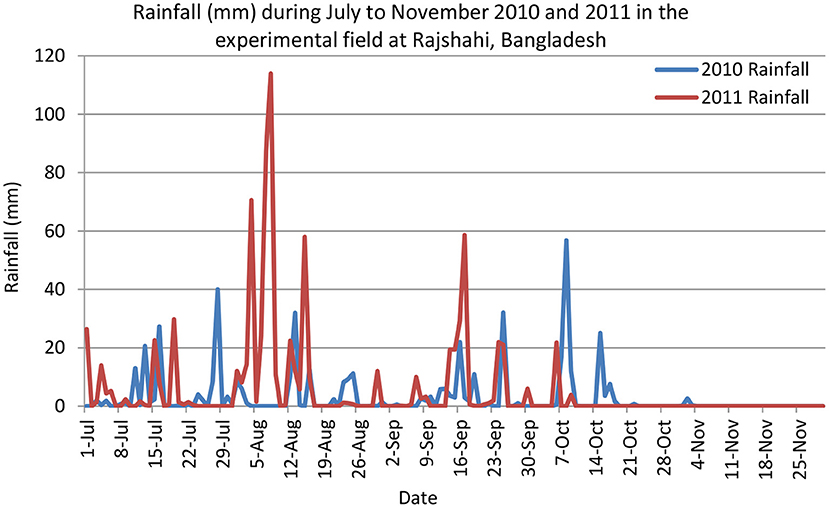
Figure 1. Rainfall distribution in the experimental field of BRRI Rajshahi during July–November 2010 and 2011 (Data source: Weather station of BRRI Rajshahi, Bangladesh).
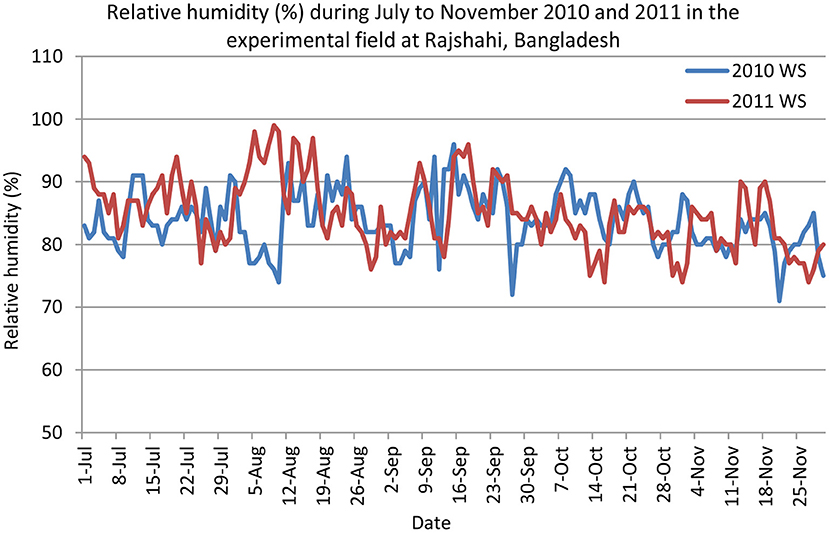
Figure 2. Relative humidity (%) in the experimental field of BRRI Rajshahi during July–November 2010 and 2011 (Data source: Weather station of BRRI Rajshahi, Bangladesh).
At maturity, the crops were harvested from 6 m2 in each plot to determine grain yield. Grain and straw samples were collected from each plot and oven-dried at 72°C for 3 days until a constant weight. Grain yield was adjusted to 14% moisture content and expressed as t ha−1. Samples were finely ground to pass through a 0.5-mm sieve and analyzed for N according to Bremner (1996) and Yoshida et al. (1976) in the laboratory of the Department of Soil Science, Bangladesh Agricultural University, Mymensingh.
The following parameters were assessed to determine nitrogen use efficiency.
The partial factor productivity of nitrogen (PFPN) refers to the amount of grain yield produced for each kg of N applied (Dobermann, 2005; Rakotoson et al., 2017) and calculated according to the following formula:
where PFPN, partial factor productivity of nitrogen; GY+N, grain yield with N application (kg ha−1); and FN, the amount of N applied (kg ha−1). Grain yields at a given level of fertilizer N represent the sum of yield without N inputs (GY0N), plus the increase in yield from applied N (ΔGY+N). Thus, the PFPN can also be expressed as follows:
The agronomic efficiency of nitrogen (AEN) is the incremental efficiency of applied N. The AEN reflects how much additional yield is produced for each kg of N applied. The agronomic efficiency from applied N is the ratio of kg grain yield increase per kg N applied (Dobermann and Fairhurst, 2000; Dobermann, 2005; Rakotoson et al., 2017):
where AEN, agronomic efficiency of nitrogen; GY+N, grain yield with N application; GY0N, grain yield without N application; and FN, amount of N applied, all in kg ha−1.
Recovery efficiency of nitrogen (REN) is the uptake efficiency for the applied N. REN is the answer to the question of how much N applied was recovered and taken up by the crop and how much remained in the soil or was lost from the field. REN from applied N is the ratio of kg N taken up per kg N applied (Dobermann and Fairhurst, 2000; Dobermann, 2005; Rakotoson et al., 2017):
where REN, recovery efficiency of nitrogen; UN+N, total plant N uptake measured in aboveground biomass at physiological maturity (kg ha−1); UN0N, total N uptake without the addition of N (kg ha−1); and FN, amount of N applied (kg ha−1).
Physiological efficiency of nitrogen (PEN) equates how much additional yield is produced for each additional kg of N uptake. PEN from applied N is the ratio of kg grain yield increase per kg N taken up (Dobermann and Fairhurst, 2000; Dobermann, 2005; Rakotoson et al., 2017):
where PEN, physiological efficiency of nitrogen; GY+N, grain yield with N application (kg ha−1); GY0N, grain yield without N application; and UN+N, total N uptake (kg ha−1).
Internal efficiency of nitrogen (IEN) is the utilization efficiency of the nutrient taken up by the crop. Thus, IEN is the answer to the question of how much yield is produced per kg N taken up from both fertilizer and indigenous (soil) sources. The IEN is the ratio of kg grain per kg N taken up (Dobermann and Fairhurst, 2000; Dobermann, 2005; Rakotoson et al., 2017):
where IEN, internal efficiency of N; GY, grain yield (kg ha−1); and UN, total N uptake (kg ha−1) from both the indigenous and applied fertilizer sources.
Nitrogen harvest index (NHI) is computed as the ratio of total grain N uptake and total plant N uptake. NHI can be expressed using the following formula (Singh et al., 1998; Fageria et al., 2010; Tayefe et al., 2011):
where NHI, nitrogen harvest index; GN, grain N uptake (kg ha−1); TN, total plant N uptake (kg ha−1).
Data gathered in the experiment were subjected to analysis of variance (ANOVA) using the statistical software CropStat 7.2, followed by the least significant difference (LSD) test and post hoc test according to Gomez and Gomez (1984).
Grain yield was significantly (p ≤ 0.01) influenced by N rates (Figure 3). Irrespective of tested genotype, grain yield generally increased with higher N application rate up to N83 and attained its plateau at N110. In general, the mean grain yield increased by 35–45% depending on the N rate compared to the control (N0). Growth duration, plant height, tillers and panicles per square meter, grains per panicle, 1,000-grain weight, spikelet sterility, biological yield, and harvest index were significantly (p ≤ 0.01) influenced by the N rate in both years (Table 3). Irrespective of genotype, growth duration was the longest (115 days) in the N110 treatment, while it was the shortest in the N0 treatment (109 days). Irrespective of genotype, growth duration reduced 6% in N0 treatment compared to N110. Plant height followed similar trends as growth duration in that it generally increased up to N110 from the control treatment. Plant height and tillers and panicles per square meter were highest in N110 and were lowest in N0. In contrast, grains per panicle increased up to N83 and thereafter decreased insignificantly in N110. The N rates had statistically significant effects on 1,000-grain weight ranging from 22.0 to 22.9 g, which was a 4% reduction without nitrogen to the highest dose. Biological yield was significantly affected by the N rate and was the highest (9.51 t ha−1) in N83 and N110 in 2010 and the lowest (5.98 t ha−1) in N0. Nevertheless, the biological yield increased up to N83 and thereafter decreased to some extent in N110 during 2011. There was a significant difference in harvest index among the treatments in that the harvest index increased with greater N rates up to N83 and then declined. Harvest index values ranged from 0.44 in N0 (control) to 0.48, 0.50, and 0.47 in N55, N83, and N110, respectively.
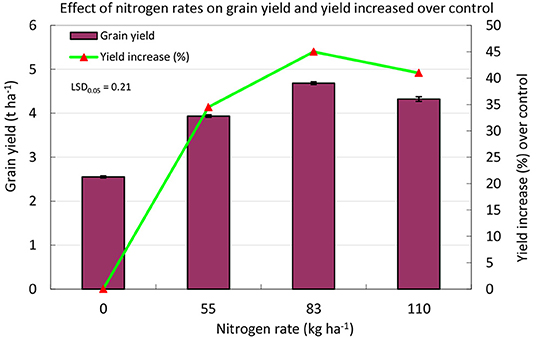
Figure 3. Mean rice grain yield and its increase as influenced by N rates and genotypes in a drought-prone rainfed rice system. Bars indicate the standard error of the mean.
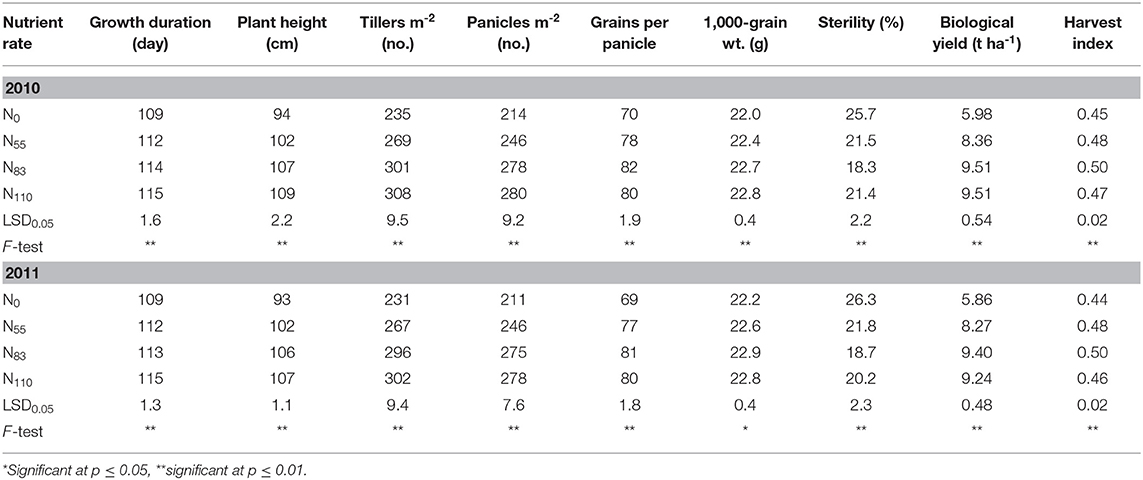
Table 3. Effect of N rates on growth duration, yield components, and agronomic attributes (averaged across all genotypes).
ANOVA revealed significant (p < 0.01) differences among the genotypes in terms of grain yield in both years (Figure 4). The genotype IR83377-B-B-93-3 produced the highest mean grain yields (4.43 and 4.31 t ha−1 in 2010 and 2011, respectively), irrespective of N rate, which was statistically similar to IRRI 123. The lowest grain yields (3.47 and 3.23 t ha−1 in 2010 and 2011, respectively), were observed for BRRI dhan57 followed by IR83381-B-B-6-1. Yield difference between the highest and lowest yielders was 23%. In case of grain production in kg ha−1 day−1, IR83377-B-B-93-3 produced the highest amount (38 kg ha−1 day−1) followed by BRRI dhan56 (37 kg ha−1 day−1) and IRRI 123 (36 kg ha−1 day−1), while it was lowest in IR83377-B-B-6-1 (32 kg ha−1 day−1).
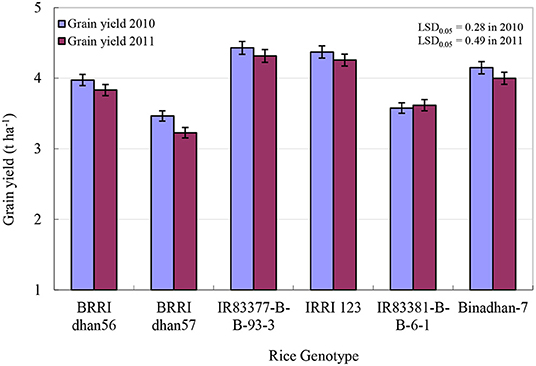
Figure 4. Average grain yield of the rice genotypes in this study across all N treatments during 2010WS and 2011WS. Bars indicate the standard error of the mean.
The interaction effect of N rates and genotypes on grain yield was significant in both experimental years (Figure 5). The highest grain yield (5.43 t ha−1) was obtained in the combination of IR83377-B-B-93-3 × N110 followed by IRRI 123 × N110 (5.23 t ha−1) in 2010. Generally, yield was lower in control plots, and it was the lowest (2.35 t ha−1) with the BRRI dhan57 × N0 combination during 2011. Genotypic variation was 36% between the highest and lowest yielders in N110. Yield variation in control plots was significantly lower compared to the fertilized plots, and the variation was highest in N110. Growth duration, grains per panicle, spikelet sterility, and harvest index were significantly affected by the interaction of N rates and genotypes. However, the interaction effect on the remaining parameters was insignificant in both years. IRRI 123 matured in 124 days at N110, whereas BRRI dhan57 matured at 100 days at N0. The interaction of genotypes and N rates had no significant effect on 1,000-grain weight. The harvest index was significantly affected by the N rate × genotype interaction and generally increased from N0 to N83 for most genotypes and thereafter remained stable with N110.
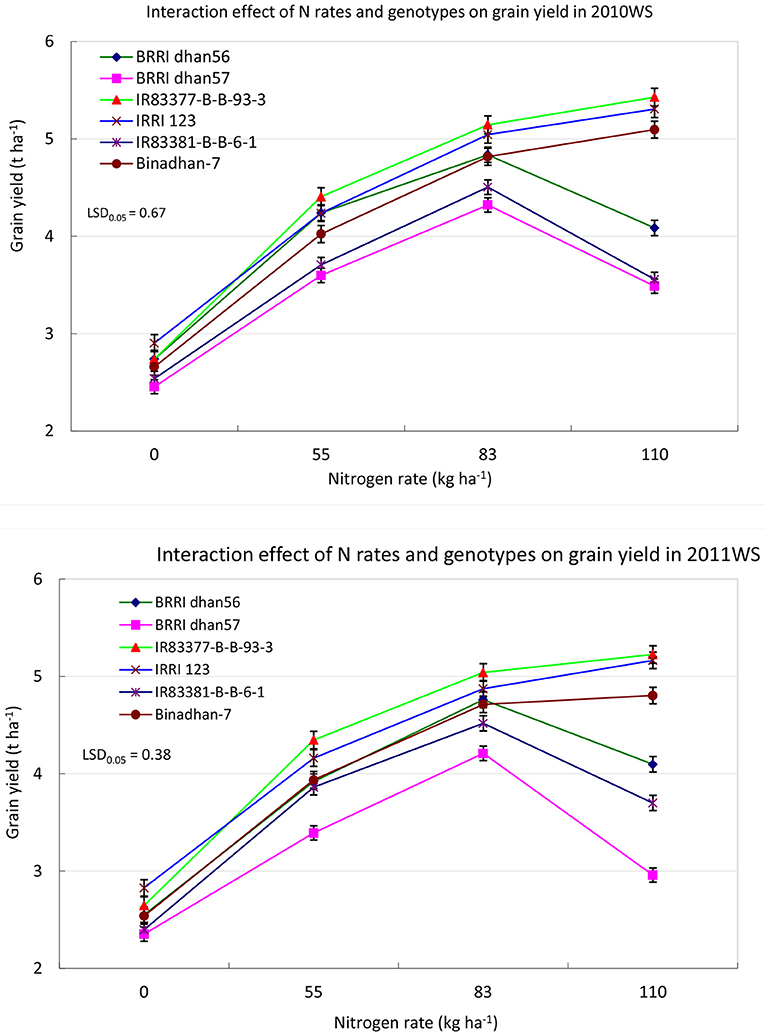
Figure 5. Interaction of genotypes and N rates on grain yield of the rice genotypes during 2010WS and 2011WS. Bars indicate the standard error of the mean.
Among the tested genotypes, grain N content, total biomass N content, kg N uptake t−1 grain yield, PFPN, AEN, REN, PEN, and NHI were significantly affected by N rates in both years (Table 4). Irrespective of genotype, total N content in the grains increased with higher N rates up to N83 and then slightly reduced in both years. The highest N uptake in the grains (53 kg ha−1 in 2011) was obtained at N83, and the lowest (21 kg ha−1) was in the N0 treatment, and it was 60% higher in N-fertilized treatments without N plots. In contrast, total plant N content increased by 53 and 57% from N0 to N110 treatments in 2010 and 2011, respectively. Similarly, the N (kg) uptake t−1 grain yield also increased continuously with greater N rate, and it was 21 and 28% in the highest N rate (N110) compared to N0 in 2010 and 2011, respectively. PFPN decreased with increased N rates, and the mean reduction was 22 and 45% in the N110 and N83 treatments, respectively. In both years, AEN was statistically similar in N55 and N83, but it was significantly higher in comparison to N110. The highest REN (0.52 and 0.59 kg kg−1 in 2010 and 2011, respectively), was observed in N83 followed by N55, and it was the lowest in N110. PEN and IEN also decreased continuously from lower N to higher N doses. Irrespective of genotype, IEN varied significantly among the treatments. IEN fluctuated from 46 to 67 kg grain kg−1 N uptake among the treatments in both years, and it was 31% from N0 to N110. NHI varied significantly from 0.52 to 0.59 kg kg−1 in N0 (control) to N110, but the highest value obtained was in the N83 treatment in both years.
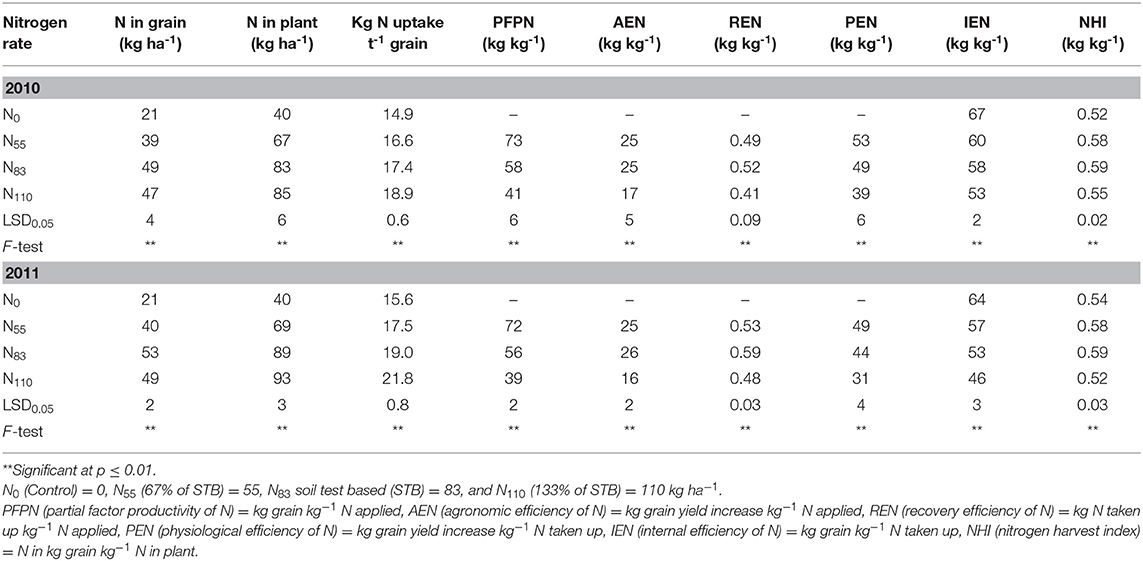
Table 4. Effect of N rate on its content and use efficiencies (averages across tested genotypes).
The N content and NUEs of the tested genotypes varied significantly (p ≤ 0.01) with the exception of AEN, REN, and PEN (Table 5). Irrespective of treatment, the highest amount of grain N content (44 and 47 kg ha−1) was found in the genotype IR83377-B-B-93-3, which was at par with IRRI 123 (43 and 46 kg ha−1), and the lowest grain N content was observed in BRRI dhan57 (32 and 33 kg ha−1) in 2010 and 2011, respectively. Among genotypes, differences in total plant N uptake were significant in 2010 (p ≤ 0.01) and 2011 (p ≤ 0.05). Greater N uptakes were observed in IR83377-B-B-93-3 and IRRI 123, medium ranges were observed in BRRI dhan56 and Binadhan-7, and lower N uptakes were observed in BRRI dhan57 and IR83381-B-B-6-1. The amount of N (kg) required per ton of grain yield was also significantly different among the genotypes and also the years. The amount of required N varied between 16.5 and 17.9 kg N t−1 grain and between 18.3 and 19.2 kg N t−1 grain in 2010 and 2011, respectively. The mean variation among the genotypes was 16.5 to 19.2 kg N t−1 grain production, and the variation was 14%. PFPN varied significantly from genotype to genotype with a range of 37 to 48 and 35 to 47 kg kg−1 in 2010 and 2011, respectively. The highest PFPN (48 kg kg−1) was obtained in IR83377-B-B-93-3 followed by IRRI 123 (46 kg kg−1), and the lowest was found in BRRI dhan57 (36 kg kg−1). We observed substantial differences in relation to AEN, REN, and PEN among the genotypes (Table 5); however, the variability was not significant. The IEN varied significantly (p ≤ 0.01) among the genotypes in both years. BRRI dhan56 and IR83377-B-B-93-3 showed the highest IEN (61 kg kg−1) followed by IRRI 123 (60 kg kg−1), and the lowest IEN (56 kg kg−1) was found in IR83381-B-B-6-1. Genotypic responses to NHI differed significantly among genotypes in both years ranging from 0.52 to 0.58.
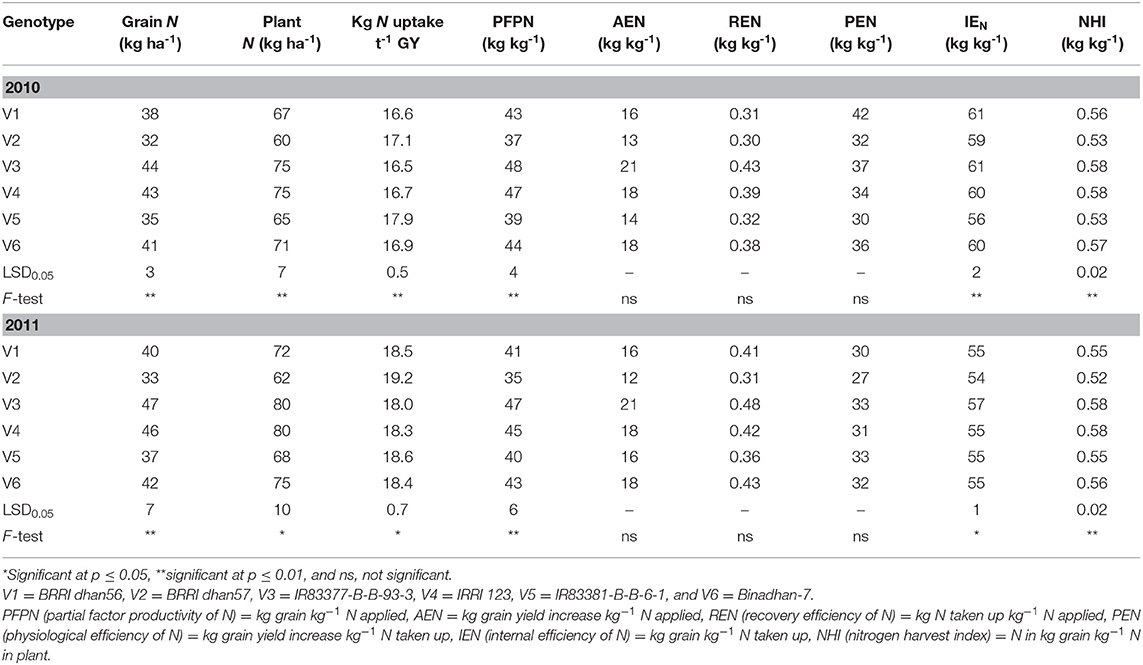
Table 5. Nitrogen content and N use efficiencies among tested rice genotypes (average over N treatments).
Interaction effects of N rate and genotype (N × V) were significant for grain N content, kg N uptake t−1 grain, PEN, and NHI in 2010, while significant interaction effects were detected for N content in grain, kg N uptake t−1 grain, PEN, PFPN, and IEN in 2011. However, interaction of V × N for total plant N, PFPN, AEN, REN, and IEN was insignificant in 2010 as well as for total plant N, AEN, REN, and NHI in 2011. Grain N content was the highest (57 kg kg−1) for the interaction of N110 × IR83377-B-B-93-3, which was at par with N110 × IRRI 123 (56 kg kg−1) and was lowest for N0 × BRRI dhan57 (17 kg kg−1). Significant V × N interaction was found for kg N uptake t−1 grain, at the level of p ≤ 0.05 and p ≤ 0.01 in 2010 and 2011, respectively. The amount of kg N uptake t−1 grain was highest (20.2) in N110 × IR83381-B-B-6-1 and lowest (14.4) in N0 × IR83377-B-B-93-3. In general, kg N uptake t−1 grain increased with greater N rates. PFPN and PEN followed the reverse trend and decreased with increasing N rates. Variation in the V × N interaction on PFPN and PEN ranged from 27 to 80 and 29 to 78, respectively, in both years, and it was 66 and 63%, respectively. The genotypes BRRI dhan56, BRRI dhan57, IR83377-B-B-93-3, and IR 83381-B-B-6-1 showed the highest NHI values at N83, whereas IRRI 123 and Binadhan-7 showed the highest NHI values at N55.
The relationships between plant N content and grain yield are presented in Figure 6. There were significant correlations of grain yield and plant N content for all genotypes. A close relationship between total N uptake in plant and grain yield was observed for all genotypes, and the linear regressions accounted for 68.6 to 98.6% of the variance in yield. The slope of the regression as another measure of nitrogen use efficiency was the steepest for Binadhan-7 and IR83377-B-B-93-3, and it was the lowest for BRRI dhan56. Grain yield showed significant and positive association with total above-ground biomass N contents at maturity. BRRI dhan56, BRRI dhan57, and IR 83381-B-B-6-1 produced the highest grain yields with N83 that were also highly related with their biomass N contents at maturity. Similar results were also found for the cultivars IR83377-B-B-93-3, IRRI 123, and Binadhan-7 with N110.
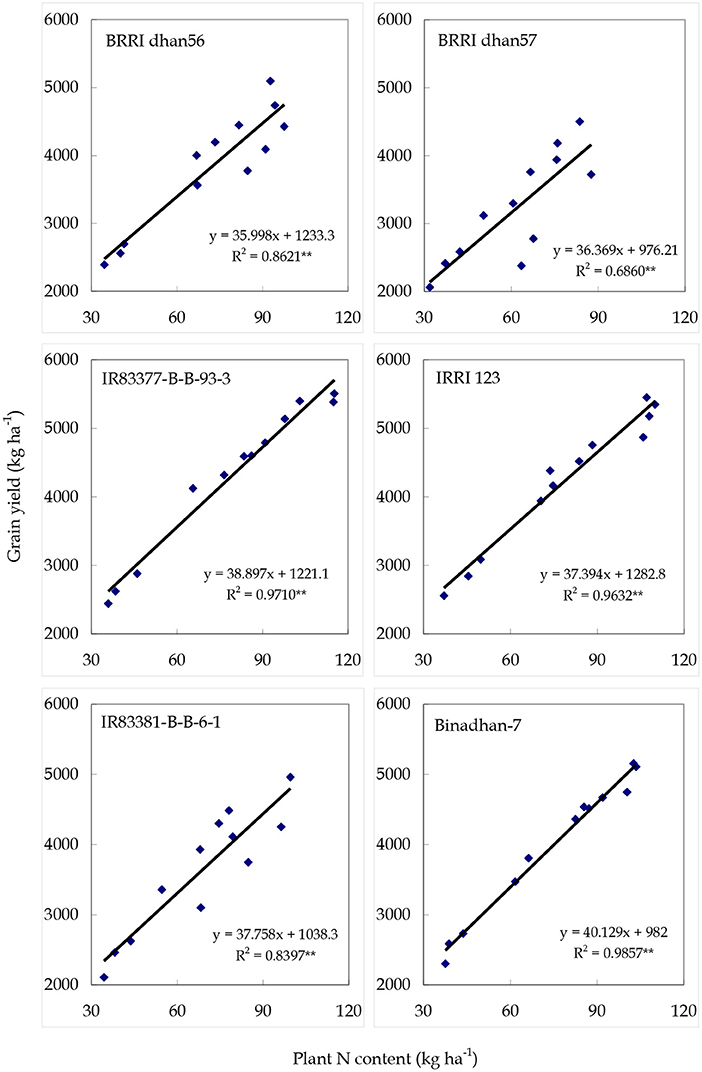
Figure 6. Relationship between grain yield and plant N contents at maturity of the tested rice genotypes (averaged over N treatments).
Genotypes, nitrogen (N) rates, interaction of genotypes by N rates, and effect of year had a significant effect on almost all the variables over the 2 years of investigation of six rice genotypes under four levels of N. These findings are in alignment with those of Rakotoson et al. (2017) who found similar results with 3 years of evaluation of 13 upland rice varieties under two levels of N inputs. Increased nitrogen application rates significantly increased yield of all tested genotypes up to N83 and then declined, which is in agreement with previous reports that grain yield of rice genotypes may increase up to a certain limit of N rate and could then stagnate or even reduced slightly (Singh et al., 1998; Fageria et al., 2010; Zhao et al., 2012). As the highest yields observed were still below the potential yields of most of the germplasms tested, there were likely other yield-limiting factors in these experiments such as inadequate moisture and other nutrient deficiencies. Notably, the rice in this study was grown as a rainfed crop, and the supply of rainwater was deficient. It also indicated from these results that N rates above 83 kg N ha−1 are probably not advisable in the rainfed environments of Bangladesh. We found significant deviations in yield because of variation in yield potential of the tested genotypes. Similar views are reported by Swain et al. (2006) and Zhao et al. (2012). The genotypes IR83377-B-B-93-3 and IRRI 123 had significantly higher yields than the other genotypes at high N application rates. This could be attributed to their higher values for yield components (Tirol-Padre et al., 1996; Gueye and Becker, 2011), which could give them an advantage under mild drought stress as occurred in both years (Singh et al., 1998; Swain et al., 2006). The varieties BRRI dhan56 and BRRI dhan57 were selected for more severely drought-stressed conditions and have a shorter duration to address frequent terminal drought stress, which is common in many rainfed environments. Under these rainfed conditions, the grain yields were generally reduced by an average of 40% in control plots (without N) compared to N-applied plots. These results are in alignment with Haefele et al. (2008) who observed grain yield reductions of 59% in control plots under rainfed conditions. Yield and efficiencies of the rice cultivars were lower in 2011 compared to 2010, as the crop of 2011WS was severely affected by drought stress due to lower and erratic rainfall. Growth duration of the genotypes was significantly affected by the genotypes, N rates, and their interactions, and it was increased with increasing N rates. Panicles per square meter and harvest index were increased with increased N rates; however, the harvest index reduced in the higher N rate (N110). Rakotoson et al. (2017) found that panicles per square meter and the harvest index were consistently positively correlated with N rates.
Nitrogen uptake and NUEs were significantly influenced by variations in rice genotypes and N levels. These findings are in agreement with Rakotoson et al. (2017) who reported significant genetic variability for NUE, nitrogen uptake efficiency (NUPE), and nitrogen utilization efficiency (NUTE) in both high-N and low-N treatments but a low level of G × N interaction. Similar results are also obtained by Zhao et al. (2012), Tayefe et al. (2011), Fageria et al. (2009), Haefele et al. (2008), Inthapanya et al. (2000b), Witt et al. (1999), and Singh et al. (1998). In general, we have found N uptake in the range of 60 to 80 kg N ha−1. Swain et al. (2006) also reported 33.4 to 65.5 kg ha−1 N uptake under non-water-stressed conditions (0–25 cm standing water). Irrespective of genotype, N uptake ranged from 40 to 93 kg N ha−1 depending on N rates. N uptake by grain varied from 21 to 53 kg ha−1. These results of N accumulation in grain as well as the range of uptake were identical to those in reports by Naklang et al. (2006), Haefele et al. (2003), Roberts (2008), and Witt et al. (1999) for modern varieties in Asia and Africa. We have found decreased NUE with higher N rates in this study that indicated the negative correlation between NUE and N rates. Rakotoson et al. (2017) also observed a negative relationship between grain yield and grain N concentration under low N. The PFPN, AEN, REN, PEN, and IEN were generally higher with lower N rates, and the efficiencies decreased with greater N rates [as previously described by Peng et al. (2006); Tayefe et al. (2011), Inthapanya et al. (2000b), and Singh et al. (1998)]. PFPN varied significantly among the genotypes, ranging from 35 to 48 kg kg−1. The results are in line with the findings of Dobermann and Fairhurst (2000) and Singh et al. (1998) who reported PFPN < 50 and 51 kg kg−1, respectively. Cultivars that generally show higher AEN produce higher yield with higher N rates and ultimately give higher NUE (Zhang et al., 2009) and low NUE for poor-yielding varieties (Ladha et al., 1998). Fischer (1998) also recommended higher NUE for improving rice yield potential. Increases in N uptake efficiency and/or N utilization efficiency lead to an increase of NUEs (Gueye and Becker, 2011; Salem et al., 2011). The AEN was highest (21 kg kg−1) in IR83377-B-B-93-3 and lowest (12 kg kg−1) in BRRI dhan57 in this study. These findings are similar to those of Dobermann and Fairhurst (2000) who stated that AEN of modern rice cultivars ranged from 10 to 25 kg kg−1 but can range from 0 to 35 kg kg−1. Dobermann (2005) also reported that the AEN ranged from 10 to 30 kg grain kg−1 N applied in his other investigation. Ladha et al. (2005) reported AEN values of 22.0 kg grain kg−1 N for rice. Yoshida (1981) reported that AEN ranged from 15 to 25 kg grain yield kg−1 N applied. However, BRRI dhan56 also provided better yield and efficiencies with low N rates. The genotypes IR83377-B-B-93-3 and IRRI 123 also showed higher recovery efficiency (0.43–0.48 and 0.39–0.42 kg kg−1, respectively), that contributed for higher grain yield compared to other genotypes. Dobermann and Fairhurst (2000) found that REN ranged from 0.30 to 0.40 kg N kg−1 in Asia. PEN ranged from 31 to 53 kg kg−1 toward the N rates while it was 27 to 42 kg kg−1 across the genotypes. These results are also in accordance with Dobermann and Fairhurst (2000) who reported that PEN ranges from 22 to 49 kg kg−1 with an average of 35 kg kg−1. IEN of IR83377-B-B-93-3 and BRRI dhan56 was the highest (61 kg kg−1). Grain production was mainly dependent on the utilization of taken up N (Singh et al., 1998; Inthapanya et al., 2000b). IEN varied from 46 to 67 kg kg−1, which is in alignment with Witt et al. (1999) who reported that the optimal IEN of tropical Asian rice is 68 kg kg−1 with a range of 51 to 68 kg kg−1. Although not identical, the findings are close to the IEN boundaries (48 and 112 kg grain kg−1 N) and with the mean (71 kg grain kg−1 N) determined by Haefele et al. (2003). Interaction of N levels and genotypes showed higher NUE at lower N rates than at high N levels as also supported by Gueye and Becker (2011) and Tirol-Padre et al. (1996). We have found that NHI is related with N uptake and NUE, in agreement with Singh et al. (1998). The variations in NHI are related with the capacity of a genotype to utilize N and N levels for growth and development (Singh et al., 1998; Swain et al., 2006). The variations in NHI could be 0.45 to 0.69 (Swain et al., 2006), which is very much true for our findings. Grain yield and plant N content showed a consistent significant relationship across genotypes. Previous studies also suggest that grain yield was linearly and positively correlated with plant N content and that it varied among genotypes (Swain et al., 2006; Fageria et al., 2009; Gueye and Becker, 2011). The significant correlation between grain yield, N uptake, and NUE indicated that the higher grain yield of genotypes IR83377-B-B-93-3 and IRRI 123 was mostly dependent on higher N uptake of the crop under rainfed conditions (Rakotoson et al., 2017). Thus, genotypes IR83377-B-B-93-3 and IRRI 123 were observed to be N efficient, while BRRI dhan57, Binadhan-7, and IR83381-B-B-6-1 were classified as N inefficient.
Nitrogen levels significantly influenced grain yield, yield components, N uptake, and NUEs of the studied genotypes. Depending on the N rate, grain yield increased by 35–45% compared to the control (N0). BRRI dhan56 produced higher grain yield under lower N levels and was not responsive to higher N application rates, indicating that this variety can be recommended as a low-input genotype suitable for growing in less fertile soils with minimum added N fertilizer. Grain yields of genotypes IR83377-B-B-93-3, IRRI 123, and Binadhan-7 increased up to N110 while BRRI dhan56, BRRI dhan57, and IR83377-B-B-6-1 produced their highest yields at N83. Such responses indicate that N management should be variety specific, and such knowledge must be disseminated among farmers during varietal adoption trials. Among the tested genotypes, IR83377-B-B-93-3 and IRRI 123 were the most N-efficient genotypes. Genotypes IR83377-B-B-93-3 and IRRI 123 were recognized as high yielding and N use efficient at high as well as low N levels under rainfed conditions. That superior genotype linked with proper agronomic management practices could be released as varieties or be utilized to develop N use-efficient varieties under rainfed environments.
The original contributions presented in the study are included in the article/supplementary materials, further inquiries can be directed to the corresponding author/s.
BK, SH, and AH planned, designed the research activities, collected, and analyzed the data. BK conducted the research and wrote the manuscript. SH, AH, MK, AI, and JB edited and fine-tuned the manuscript. All authors contributed to the article and approved the submitted version.
The research activities were funded by the National Agricultural Technology Project (NATP) Phase II funded by World Bank and Stress-Tolerant Rice for Africa and South Asia (STRASA) project funded by Bill & Melinda Gates Foundation [Grant number OPP1088843].
The authors declare that the research was conducted in the absence of any commercial or financial relationships that could be construed as a potential conflict of interest.
Bremner, J. M. (1996). “Nitrogen total,” in Methods of Soil Analysis Part 3: Chemical Methods, SSSA Book Series 5, ed D.L. Sparks (Madison, WI: Soil Science Society of America), 1085–1122.
Dobermann, A., and Fairhurst, T. (2000). Rice: Nutrient Disorders and Nutrient Management. Los Banos: International Rice Research Institute.
Dobermann, A. R. (2005). Nitrogen Use Efficiency–State of the Art. Lincoln: Agronomy–Faculty Publications (Paper 316).
Fageria, N. K., and Baligar, V. C. (2005). Enhancing nitrogen use efficiency in crop plants. Adv. Agron. 88, 97–105. doi: 10.1016/S0065-2113(05)88004-6
Fageria, N. K., Morais, O. P. D., and Santos, A. B. D. (2010). Nitrogen use efficiency in upland rice genotypes. J. Plant Nutr. 33, 1696–1711. doi: 10.1080/01904167.2010.496892
Fageria, N. K., Moreira, A., and Coelho, A. M. (2011). Yield and yield components of upland rice as influenced by nitrogen sources. J. Plant Nutr. 34, 361–370. doi: 10.1080/01904167.2011.536878
Fageria, N. K., Santos, A. B. D., and Cutrim, V. D. A. (2009). Nitrogen uptake and its association with grain yield in lowland rice genotypes. J. Plant Nutr. 32, 1965–1974. doi: 10.1080/01904160903245121
Ferdous, M. G., and Baten, M. A. (2011). Climatic variables of 50 years and their trends over rajshahi and rangpur division. J. Environ. Sci. Nat. Resour. 4, 147–150. doi: 10.3329/jesnr.v4i2.10165
Fischer, K. S. (1998). Toward increasing nutrient-use efficiency in rice cropping systems: the next generation of technology. Field Crops Res. 56, 1–6. doi: 10.1016/S0378-4290(97)00139-1
Gallais, A., and Coque, M. (2005). Genetic variation and selection for nitrogen use efficiency in maize: a synthesis. Maydica 50:531.
Gomez, K. A., and Gomez, A. A. (1984). Statistical Procedures for Agricultural Research. New York, NY: John Wiley and Sons Inc. 97–423.
Gueye, T., and Becker, H. (2011). Genetic variation in nitrogen efficiency among cultivars of irrigated rice in Senegal. J. Agric. Biotech. Sust. Dev. 3, 35–43.
Haefele, S. M., Jabbar, S. M. A., Siopongco, J. D. L. C., Tirol-Padre, A., Amarante, S. T., Sta Cruz, P. C., et al. (2008). Nitrogen use efficiency in selected rice (Oryza sativa L.) genotypes under different water regimes and nitrogen levels. Field Crops Res. 107, 137–146. doi: 10.1016/j.fcr.2008.01.007
Haefele, S. M., Wopereis, M. C. S., Ndiaye, M. K., Barro, S. E., and Isselmou, M. O. (2003). Internal efficiencies, fertilizers recovery rates and indigenous nutrient supply of irrigated lowland rice in sahelian West Africa. Field Crops Res. 80, 19–32. doi: 10.1016/S0378-4290(02)00152-1
Inthapanya, P., Sipaseuth, S. P., Sihathep, V., Chanphengsay, M., Fukai, S., and Basnayake, J. (2000a). Genotypic performance under fertilized and non-fertilized conditions in rainfed lowland rice. Field Crops Res. 65, 1–14. doi: 10.1016/S0378-4290(99)00065-9
Inthapanya, P., Sipaseuth, S. P., Sihathep, V., Chanphengsay, M., Fukai, S., and Basnayake, J. (2000b). Genotype differences in nutrient uptake and utilization for grain yield production of rainfed lowland rice under fertilized and non-fertilized conditions. Field Crops Res. 65, 57–68. doi: 10.1016/S0378-4290(99)00070-2
Ju, C., Buresh, R. J., Wang, Z., Zhang, H., Liu, L., Yang, J., et al. (2015). Root and shoot traits for rice varieties with higher grain yield and higher nitrogen use efficiency at lower nitrogen rates application. Field Crop. Res. 175, 47–55. doi: 10.1016/j.fcr.2015.02.007
Kamoshita, A., Babu, R. C., Boopathi, N. M., and Fukai, S. (2008). Phenotypic and genotypic analysis of drought-resistance traits for development of rice cultivars adapted to rainfed environments. Field Crops Res. 109, 1–23. doi: 10.1016/j.fcr.2008.06.010
Kant, S., Bi, Y. M., and Rothstein, S. J. (2011). Understanding plant response to nitrogen limitation for the improvement of crop nitrogen use efficiency. J. Expt. Bot. 62, 1499–1509. doi: 10.1093/jxb/erq297
Karmakar, B., Haefele, S. M., Aditya, T. L., Ali, M. A., Islam, M. T., and Islam, M. R. (2010). “Evaluation of rice germplasm under drought prone rainfed environment in northwest Bangladesh,” in Proceedings of the 3rd International Rice Congress (Hanoi), 49.
Karmakar, B., Islam, M. A., Islam, M. R., Mukul, M. H. R., and Biswash, M. R. (2015). On-farm evaluation of rice genotypes under drought prone rainfed environments. Sci. Agric. 12, 72–77. doi: 10.15192/PSCP.SA.2015.12.2.7277
Karmakar, B., Haefele, S. M., Ali, M. A., Ansari, T. H., Aditya, T. L., and Islam, A. K. M. S. (2012). Yield and yield components of rice genotypes as affected by planting dates in drought prone environment. Bangladesh Agron. J. 15, 71–79.
Karmakar, B., and Sarkar, M. A. R. (2015). Optimizing seedling age of promising rice genotypes in rainfed environment. J. Crop Weed. 11, 149–160.
Ladha, J. K., Kirk, G. J. D., Bennett, J., Peng, S., Reddy, C. K., Reddy, P. M., et al. (1998). Opportunities for increased nitrogen-use efficiency from improved lowland rice germplasm. Field Crops Res. 56, 41–71. doi: 10.1016/S0378-4290(97)00123-8
Ladha, J. K., Pathak, H. J., Krupnik, T., Six, J., and van Kessel, C. (2005). Efficiency of fertilizer nitrogen in cereal production: retrospects and prospects. Adv. Agron. 87, 85–156. doi: 10.1016/S0065-2113(05)87003-8
Naklang, K., Harnpichitvitaya, D., Amarante, S. T., Wade, L. J., and Haefele, S. M. (2006). Internal efficiency, nutrient uptake and the relation to field water resources in rainfed lowland rice of northeast Thailand. Plant Soil 286, 193–208. doi: 10.1007/s11104-006-9037-z
Peng, S., Buresh, R. J., Huang, J., Yang, J., Zou, Y., Zhong, X., et al. (2006). Strategies for overcoming low agronomic nitrogen use efficiency in irrigated rice systems in China. Field Crops Res. 96, 37–47. doi: 10.1016/j.fcr.2005.05.004
Rakotoson, T., Dusserre, J., Letourmy, P., Ramonta, I. R., Cao, T. V., Ramanantsoanirina, A., et al. (2017). Genetic variability of nitrogen use efficiency in rainfed upland rice. Field Crops Res. 213, 194–203. doi: 10.1016/j.fcr.2017.07.023
Raun, W. R., Solie, B. S., Johnson, G. V., Stone, M. L., Mullen, R. W., Freeman, K. W., et al. (2002). Improving nitrogen use efficiency in cereal grain production with optical sensing and variable rate application. Agron. J. 94, 815–820. doi: 10.2134/agronj2002.8150
Riches, C. R. (2008). “The high barind tract: a challenging drought prone agricultural environment,” in Proceedings of the International Workshop on Improving Agricultural Productivity in Rice-Based Systems of the High Barind Tract of Bangladesh Organized by IRRI (Dhaka: BRAC Center), 3–6.
Saleh, A. F. M., and Bhuiyan, S. I. (1995). Crop and rainwater management for increasing productivity of rainfed lowland rice systems. Agril. Syst. 49, 259–276. doi: 10.1016/0308-521X(94)00048-V
Saleh, A. F. M., Mazid, M. A., and Bhuiyan, S. I. (2000). “Agro-hydrologic and drought-risk analyses of rainfed cultivation in northwest Bangladesh,” in Characterizing and Understanding Rainfed Environments, eds T. P. Tuong, S. P. Kam, L. J. Wade, S. Pandey, B. A. M. Bouman, and B. Hardy (Los Banos: International Rice Res. Inst), 233–244.
Salem, A. K. M., ElKhoby, W. M., Abou-Khalifa, A. B., and Ceesay, M. (2011). Effect of nitrogen fertilizer and seedling age on inbred and hybrid rice varieties. Am. Eurasian J. Agric. Env. Sci. 11, 640–646.
Singh, U., Ladha, J. K., Castillo, E. G., Punzalan, G., Tirol-Padre, A., and Duqueza, M. (1998). Genotypic variation in nitrogen use efficiency in medium-and long-duration rice. Field Crops Res. 58, 35–53. doi: 10.1016/S0378-4290(98)00084-7
Swain, D. K., Bhaskar, B. C., Krishnan, P., Rao, K. S., Nayak, S. K., and Dash, R. N. (2006). Variation in yield, N uptake and N use efficiency of medium and late duration rice varieties. J. Agril. Sci. 144, 69–83. doi: 10.1017/S0021859605005745
Tayefe, M., Gerayzade, A., Amiri, E., and Zade, A. N. (2011). “Effect of nitrogen fertilizer on nitrogen uptake, nitrogen use efficiency of rice,” in Proceedings of the International Conference on Biology, Environment and Chemistry (IPCBEE), (Singapore) 470–473.
Tirol-Padre, A., Ladha, J. K., Singh, U., Laureles, E., Punzalan, G., and Akita, S. (1996). Grain yield performance of rice genotypes at suboptimal levels of soil N as affected by N uptake and utilization efficiency. Field Crops Res. 46, 127–143. doi: 10.1016/0378-4290(95)00095-X
Witt, C., Buresh, R. J., Peng, S., Balasubramanian, V., and Dobermann, A. (2007). Rice: a Practical Guide to Nutrient Management. International Rice Research Institution.
Witt, C., Dobermann, A., Abdulrachman, S., Gines, H. C., Guanghuo, W., Nagarajan, R., et al. (1999). Internal nutrient efficiencies in irrigated lowland rice of tropical and subtropical Asia. Field Crops Res. 63:113–138.
Wu, L., Yuan, S., Huang, L., Sun, F., Zhu, G., Li, G., et al. (2016). Physiological mechanisms underlying the high-grain yield and high-nitrogen use efficiency of elite rice varieties under a low rate of nitrogen application in China. Front. Plant Sci. 7:1024. doi: 10.3389/fpls.2016.01024
Yoshida, S. (1981). Fundamentals of Rice Crop Science. Los Banos: International Rice Research Institution.
Yoshida, S., Forno, D. A., Cock, D. H., and Gomez, K. A. (1976). Laboratory Manual for Physiological Studies of Rice, 3rd Edn. Los Banos: International Rice Research Institution.
Zhang, Y. L., Fan, J. B., Wang, D. S., and Shen, Q. R. (2009). Genotypic differences in grain yield and physiological nitrogen use efficiency among rice cultivars. Pedosphere 19, 681–691. doi: 10.1016/S1002-0160(09)60163-6
Keywords: grain yield, harvest index, agronomic, internal, physiological and recovery efficiency of N
Citation: Karmakar B, Haefele SM, Henry A, Kabir MH, Islam A and Biswas JC (2021) In Quest of Nitrogen Use-Efficient Rice Genotypes for Drought-Prone Rainfed Ecosystems. Front. Agron. 2:607792. doi: 10.3389/fagro.2020.607792
Received: 18 September 2020; Accepted: 17 November 2020;
Published: 15 January 2021.
Edited by:
Honghai Luo, Shihezi University, ChinaReviewed by:
Adnan Noor Shah, Anhui Agricultural University, ChinaCopyright © 2021 Karmakar, Haefele, Henry, Kabir, Islam and Biswas. This is an open-access article distributed under the terms of the Creative Commons Attribution License (CC BY). The use, distribution or reproduction in other forums is permitted, provided the original author(s) and the copyright owner(s) are credited and that the original publication in this journal is cited, in accordance with accepted academic practice. No use, distribution or reproduction is permitted which does not comply with these terms.
*Correspondence: Biswajit Karmakar, Ymlzd2FqaXRicnJpQGdtYWlsLmNvbQ==
Disclaimer: All claims expressed in this article are solely those of the authors and do not necessarily represent those of their affiliated organizations, or those of the publisher, the editors and the reviewers. Any product that may be evaluated in this article or claim that may be made by its manufacturer is not guaranteed or endorsed by the publisher.
Research integrity at Frontiers
Learn more about the work of our research integrity team to safeguard the quality of each article we publish.