 R.-L. Scanlan
 L. Pease1
 L. Rasmussen
 D. Shanley
- 1Campus for Ageing and Vitality, Newcastle University, Newcastle, United Kingdom
- 2Center for Healthy Aging, Institute of Cellular and Molecular Medicine, University of Copenhagen, Copenhagen, Denmark
Cellular senescence is a diverse phenotype characterised by permanent cell cycle arrest and an associated secretory phenotype (SASP) which includes inflammatory cytokines. Typically, senescent cells are removed by the immune system, but this process becomes dysregulated with age causing senescent cells to accumulate and induce chronic inflammatory signalling. Identifying senescent cells is challenging due to senescence phenotype heterogeneity, and senotherapy often requires a combinatorial approach. Here we systematically collected 119 transcriptomic datasets related to human fibroblasts, forming an online database describing the relevant variables for each study allowing users to filter for variables and genes of interest. Our own analysis of the database identified 28 genes significantly up- or downregulated across four senescence types (DNA damage induced senescence (DDIS), oncogene induced senescence (OIS), replicative senescence, and bystander induced senescence) compared to proliferating controls. We also found gene expression patterns of conventional senescence markers were highly specific and reliable for different senescence inducers, cell lines, and timepoints. Our comprehensive data supported several observations made in existing studies using single datasets, including stronger p53 signalling in DDIS compared to OIS. However, contrary to some early observations, both p16 and p21 mRNA levels rise quickly, depending on senescence type, and persist for at least 8–11 days. Additionally, little evidence was found to support an initial TGFβ-centric SASP. To support our transcriptomic analysis, we computationally modelled temporal protein changes of select core senescence proteins during DDIS and OIS, as well as perform knockdown interventions. We conclude that while universal biomarkers of senescence are difficult to identify, conventional senescence markers follow predictable profiles and construction of a framework for studying senescence could lead to more reproducible data and understanding of senescence heterogeneity.
Introduction
Multiple studies now suggest that the accumulation of senescent cells is causal in ageing (Childs et al., 2015; Mylonas and O'Loghlen, 2022; van Deursen, 2014; Wlaschek et al., 2021), and their ablation extends healthspan and mean lifespan in rodents (Baker et al., 2016; Baker et al., 2011). Novel senolytic and senostatic drugs are in development (Kim and Kim, 2019; Niedernhofer and Robbins, 2018) with some drugs in clinical trials (Hickson et al., 2019; Justice et al., 2019) which might shortly lead to treatments capable of improving healthspan and extending lifespan in humans. However, the exact nature of senescent cells is often difficult to define, with multiple studies indicating that the most common biomarkers of senescence show different profiles across cell lines, types of senescence inducer, and the timepoint after the initial stimulus (Avelar et al., 2020; Basisty et al., 2020; Casella et al., 2019; Hernandez-Segura et al., 2017; Neri et al., 2021). This makes targeting senescent cells difficult, often requiring combinatorial approaches (Nayeri Rad et al., 2022; Saccon et al., 2021; Xu et al., 2018; Zhu et al., 2015). Although combination therapies can be effective, they also have potential to impact additional molecular networks and their off-target effects can be unpredictable.
To gain a comprehensive understanding of cellular senescence, an integrative, systematic, multi-omic approach is needed. Consequently, we have taken an integrative approach and conducted a transcriptomic systematic review of cellular senescence in human fibroblasts alongside development of a qualitative computational model which simulates protein changes in DNA damage induced senescence (DDIS) and oncogene induced senescence (OIS). We have systematically analysed all transcriptomic data for senescent fibroblasts, meeting pre-specified inclusion criteria, and produced an online database that allows public analysis of the results. Firstly, changes across four types of senescence were compared before analysing temporal changes in key senescence biomarkers in DDIS and OIS, comparing our results to existing single dataset studies. We then examined the literature to build a qualitative protein level model of cellular senescence, using the transcriptomic profiles observed here to aid in the development of the model. For validation of the model, knockdown (KD) interventions of p53 and RelA were performed and compared to data.
This integrated approach has allowed us to address universal biomarkers for senescence, whether findings from individual studies are consistent across the total data, and the mechanisms by which the network of interactants might induce the senescence response. Our results indicated differences in DDIS and OIS for expression of several of the key senescence genes, but profiles were largely consistent with results from individual studies. One exception was the TGF-β-centric SASP identified by Hoare et al. (2016), which does not appear to be replicated at the transcript level.
Methods
Systematic review protocol
Three independent systematic searches were conducted and updated to identify all transcriptomic data meeting our inclusion criteria for cellular senescence in human fibroblasts publicly available by 05 October 2023. Datasets were included if they met the following inclusion criteria:
• Unbiased transcriptomic datasets for senescent human fibroblasts. Where senescence was defined exclusively by permanent cell cycle arrest induced by a stimulus in a cell type that would otherwise be proliferating.
• RNA-seq or microarray datasets stored on Gene Expression Omnibus (GEO) (Edgar et al., 2002) or Array Express (Parkinson et al., 2007) by the deadline date of 05 October 2023.
• Data had at least two repeats for all conditions included.
As some datasets meeting the inclusion criteria could not be analysed by the methods described below, they were further excluded if they met the following exclusion criteria:
• Exclusively microRNA or long non-coding RNA datasets.
• Performed at the single cell level.
• Two colour or custom microarrays.
• Data could not be downloaded from GEO or Array Express, nor provided by contact with the corresponding author.
Search terms were developed to include all relevant MeSH terms and text terms that might identify datasets meeting the inclusion criteria. Initial terms were used in combinations on PubMed PubReMiner (Slater, 2014) to identify additional search terms. The search terms selected for GEO and search results of the initial and updated searches are shown in Supplementary Table S1 used in the Advanced Search tool to combine individual searches.
For the smaller Array Express database we searched for “Ageing” OR “Aging” and then manually filtered the results.
As described, manual exclusion was done for both databases in three independent searches firstly on 10 August 2020. At this time the results were compared to an initial non-systematic search of both databases as well as a PubMed search for studies including transcriptomic data, producing a control dataset that ensured the systematic search identified all the studies in the preliminary search. The initial systematic search was then followed by two updated searches, on 06 July 2022 and 05 October 2023. All three searches were done by the same two individuals for two independent searches per search date. After each search, the results were compared to those of the other individual and previous searches to ensure that no studies were missed.
Database creation
For each study, a comparison matrix was constructed in Microsoft Excel listing all data of interest that could then be combined into a single searchable database. If the data of interest were not available on GEO or Array Express and the datasets had accompanying publications, we checked the papers for any missing data. Key data such as senescence type and cell line were available for all datasets; however, in some cases, the timepoint of senescence induction was not stated in the paper or online databases. As this was a key part of constructing a senescence profile, we then contacted the corresponding author, but we did not do so for any other missing categories.
Data preparation and analysis
RNA-seq data was downloaded as fastq files from GEO or Array Express. Each file underwent quality check using the fastqcr R package (de Sena Brandine and Smith, 2019) (in R version 3.6.3) and files were compared using the MultiQC BASH command (Ewels et al., 2016). Adapter trimming and removal of low quality read ends was carried out using the Cutadapt tool (Martin, 2011). Once fastq files passed fastqc, or were excluded, they were converted by mapping-based quantification to quant.sf files using Salmon (version 1.1.0) (Patro et al., 2017). The--gcBias--seqBias and--validateMappings options were used to remove additional biases.
For microarrays, series matrix files for selected studies were downloaded from GEOquery and loaded into R using GEOquery (Davis and Meltzer, 2007), converted to esets and labelled with normalisation and processing information provided with the files. Array Express raw data sets were downloaded using ArrayExpress and RMA normalised using affy (Gautier et al., 2004).
Quant.sf files and microarray data underwent differential expression analysis using the R limma package (Ritchie et al., 2015). Data were normalised by cpm or voom commands depending on variance, and plotDensities was used to compare sample curves. Samples with irregular curves not consistent with the rest of the data were removed from further analysis. Log fold change (LogFC) and p values were calculated for each comparison defined in the comparison matrix using the eBayes function and combined into a single database for all studies (available on website, see below).
During initial analyses it was noted that the LogFC of some genes were clear outliers. To prevent outliers skewing the analyses, the interquartile range (IQR) was calculated for each gene per timegroup. Outliers were identified as anything less than Q1 (25th percentile) - 1.5*IQR or more than Q3 (75th percentile) + 1.5*IQR. Outliers were removed prior to all analyses presented in this paper.
For some analyses p values were inverted (pi value) by the formula in Equation 1. This created a scale that put p values for significant upregulation at the opposite end to p values for significant downregulation, with non-significant values in the middle.
Gene set enrichment analysis was carried out using the GSEA command from the ClusterProfiler library (Wu et al., 2021), using the GSEA index h.all.v7.0.symbols.gmt.
We employed the Wilcoxon signed-rank test (which comes in the base R software) for paired sample statistical analysis (Bauer, 1972).
Online database creation
We transformed the database into a Power BI report. This allows users to access various clusters of the data in easily readable visuals. Data clusters are accessible by button selection and users can sift the data through 13 different filters provided in the report. We used Power BI basic functions and DAX programming language to build the report; specifically, DAX was used to create measures which control the filtering selections. The Power BI report is embedded via an iframe in a Newcastle University research website, available at: https://research.ncl.ac.uk/cellularsenescence. The website holds subsidiary information on the report, project and research team.
Computational model development
A computational model network was developed for the purpose of qualitatively simulating temporal protein expression changes in DDIS and OIS. A protein network of reactions and interactions in cellular senescence was designed in CellDesigner (Funahashi et al., 2008), informed from extensive literature searching of temporal protein profiles in human fibroblasts (Supplementary Table S2). When there was no available published protein data, transcriptomic data from our systematic database was used as the best available proxy for temporal protein behaviour. A base model composed of reactions, reaction rates and initial parameters was developed using Tellurium (Choi et al., 2018) in a Python 3.6 environment, based on the collected information of the temporal protein profile of senescent human fibroblasts (Supplementary Table S2). Some reactions required Michaelis-Menten kinetics to be applied.
Criteria for the model to meet were devised from commonly accepted senescence phenotypes in the literature as well as from the systematic analysis. KDs (p53 and RelA) were also introduced into the model network to investigate whether senescent KD phenotypes could be successfully recapitulated.
KD phenotype criteria were devised based on the transcriptomic analysis presented here. Meeting of these criteria is how we measured if the protein network could successfully simulate cellular senescence.
To induce senescence, specific inputs were introduced into the base model to induce either DDIS or OIS (Table 1). The inputs were selected and devised based on knowledge from published literature. All expression and time units in the simulations are arbitrary (AU).
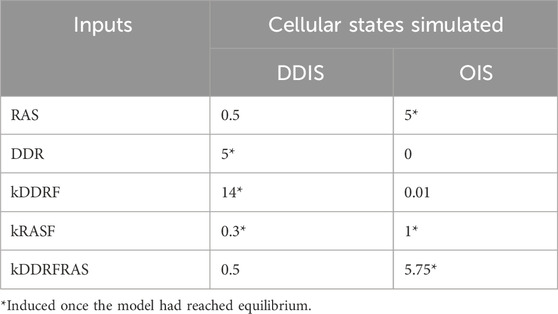
Table 1. Inputs for simulating different cellular states.
Additionally, an inducible event termed the Notch switch was included in the model network. The Notch switch creates a dynamic change in Notch signalling activity. Activation of the Notch switch results in diminished Notch signalling through the downregulation of NICD (Notch intracellular domain) levels.
Similar to the Notch switch, KDs were simulated through an inducible event. For simulation of a p53 KD, p53 levels and formation of p53 was downregulated. Likewise, for RelA KD simulations NF-κB levels and formation of active NF-κB were downregulated. KDs were induced at the same time as senescence induction, a decision based on the methods described in the p53 and RelA KD studies in the transcriptomic database.
Dynamic sensitivity analysis was performed on the model in both DDIS and OIS conditions at four timepoints (pre-senescence, T20 (Time 20); post-senescence induction, T40; pre-Notch switch, T60; post-Notch switch, T80). We followed the X-method by (Yue et al., 2006) for calculating scaled sensitives to parameter perturbations as ‘events’ at specific simulation time points using SIMBIOLOGY, MATLAB. Results from dynamic sensitivity analysis were as expected, with all proteins appropriately sensitive to senescence inputs and the Notch switch event at the expected timepoints (Supplementary Figure S1).
Results and discussion
The systematic search criteria outlined in the methods initially identified 5063 studies from GEO and 32 studies from Array Express. Of these, 26 were removed as duplicates leaving 5069 datasets for manual analysis against inclusion and exclusion criteria. Of these, 82 were identified as meeting the inclusion criteria and not disqualified by the exclusion criteria. The update searches identified a further 37 studies, as shown in the PRISMA flowchart in Figure 1. A total of 119 studies, including 85 RNA-seq datasets and 34 microarray datasets, were identified in the systematic review.

Figure 1. PRISMA flowchart showing identification and exclusion of studies.
For each study, comparisons were drawn between sample groups, making a total of 1069 comparisons in the 119 studies. 220 of which were between senescent cells and proliferating controls without treatment or disease. The details of the studies included are shown in Table 2. The main categories, acronyms, and number of comparisons for each are shown in Supplementary Table S3. All data was collated into one large database.
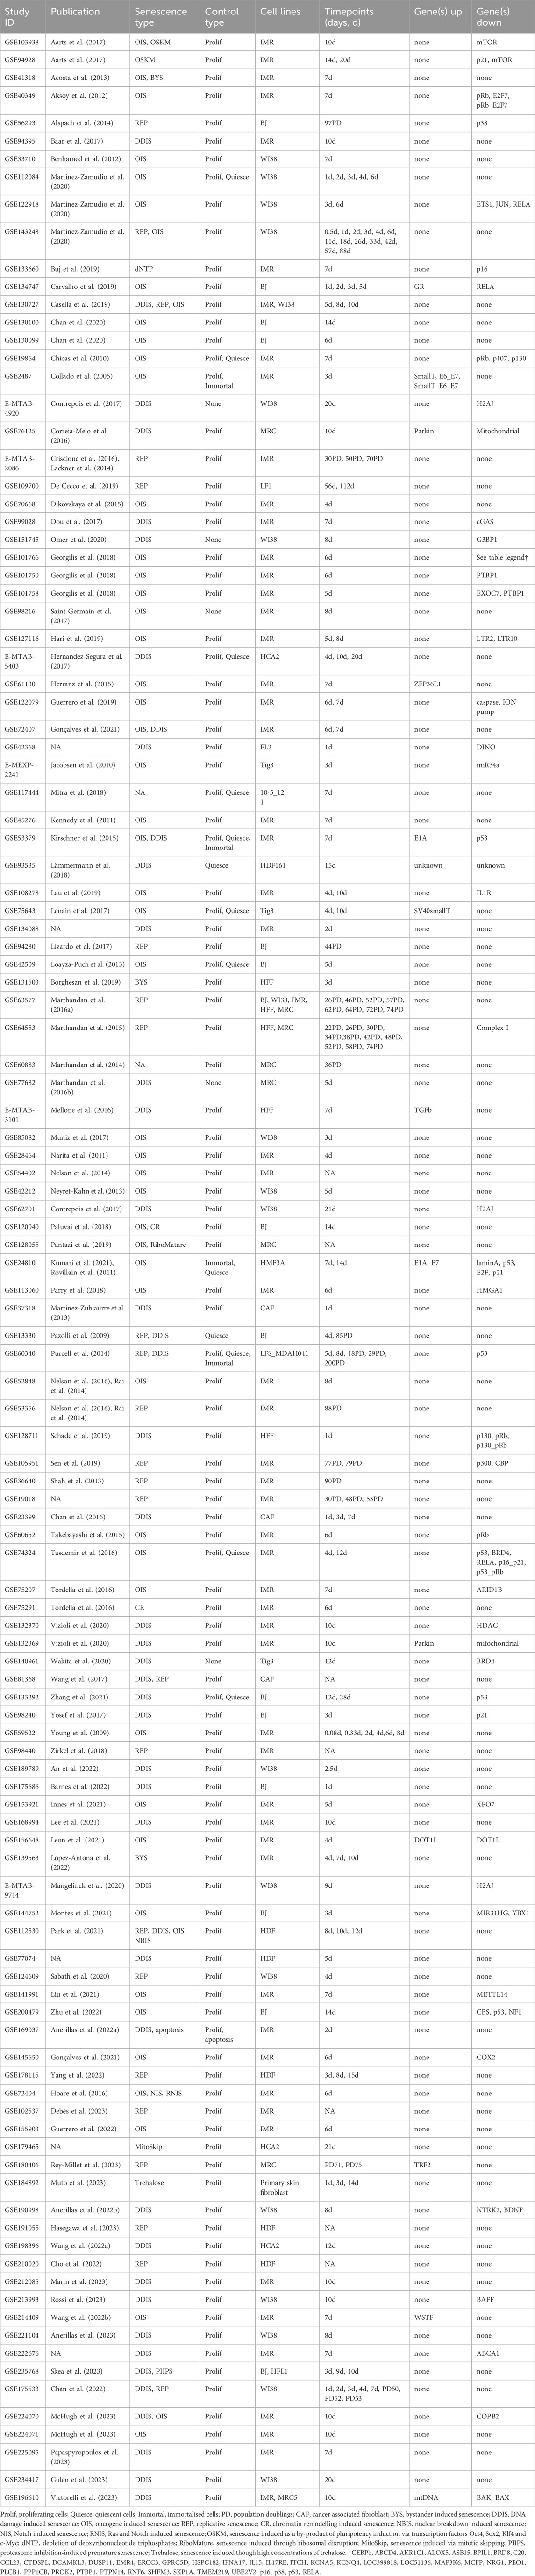
Table 2. Study data for the 119 studies.
Fourteen types of senescence induction were identified from the literature and included in the database: replicative senescence (REP) from telomere erosion (Bodnar et al., 1998); DNA damage induced senescence (DDIS) which can be induced in a number of ways including UV and ionising irradiation or the use of compounds such as etoposide, leading to constitutive activation of the DNA damage response (DDR) and the expression of cell cycle inhibitors; oncogene induced senescence (OIS) occurring through the aberrant activation of oncogenes such as RAS or BRAF; secondary paracrine bystander senescence (BYS) in which neighbouring cells become senescent in response to secreted factors from primary senescent cells; senescence induced through chromatin remodelling (CR); the breakdown of the nuclear barrier leading to nuclear barrier induced senescence (NBIS); Notch induced senescence (NIS) through ectopic NICD activation as well as Ras and Notch (combined) induced senescence (RNIS) (Hoare et al., 2016); OSKM-induced senescence as a by-product of trying to induce pluripotency; induction of senescence through the disruption of ribosomal function (RiboMature) (Pantazi et al., 2019); depletion of deoxyribonucleotide triphosphates (dNTP) induced senescence (Buj et al., 2019); senescence induction through mitotic skipping through the inhibition of CDK1 and MDM2 (MitoSkip) (Johmura et al., 2014); inhibition of the proteasome with drugs such as bortezomib, leading to proteasome inhibition-induced premature senescence (PIIPS) (Skea et al., 2023); highly concentrated treatment with trehalose (Trehalose) (Muto et al., 2023). Control cells could be proliferating or quiescent, and some lines were immortalised or treated with agents that immortalised them as part of the study. Twenty studies compared senescent cells to cells immortalised primarily through hTERT activation, although one study used immortalised cells with p53 knockout (Purcell et al., 2014).
Some comparisons included treatments such as sh/siRNAs against genes designed to observe their effects on senescence, while others used cells from patients with diseases such as breast cancer (Chan et al., 2016), non-small-cell lung cancer (Martinez-Zubiaurre et al., 2013), and Li-Fraumeni syndrome; an inherited syndrome causing vulnerability to rare cancers (Malkin, 1993), here due to mutation of p53 (Purcell et al., 2014). Overexpression of the mitochondrial related gene Parkin (Correia-Melo et al., 2016; Victorelli et al., 2023; Vizioli et al., 2020) also affected gene expression. Another study looked at senescent cells treated with compound “1201,” an alcoholic extract from the plant Solidago alpestris, that had unknown effects on gene expression (Lämmermann et al., 2018).
The database, named SenOmic, hosts all the processed transcriptomic data identified in the systematic analysis. To make SenOmic widely accessible, we created a website allowing users to filter for multiple variables to find studies and genes of interest. Users can identify all study or gene data meeting these criteria. For example, comparisons that meet multiple criteria such as ‘OIS in skin fibroblasts with p53 inhibition versus proliferating controls’ can be made using the online database available at: https://research.ncl.ac.uk/cellularsenescence. The median LogFC and p values can also be calculated, and the data can be downloaded for further analysis. The website comes with an “About” page that explains further details.
Comparison of senescence profiles and biomarker identification
In our initial analysis, we included only the 220 comparisons between senescent cells and proliferating controls without genetic abnormalities or treated with agents that altered gene expression (outside of genes such as RAS, RAF and RCC1 used to induce senescence). Of the 220 comparisons of senescence vs. proliferating controls, 196 of them involved REP, DDIS, OIS, or BYS. We therefore compared these four types of senescence to see which genes were commonly significantly different to proliferating cells. For this calculation we used the inverted p-value (pi value) (see Methods) so that genes that showed repeated significant change including both increases and decreases compared to proliferating cells were excluded from the set of genes that showed significant change in a consistent direction. The median value was calculated for each gene for each senescence inducer, and a Venn diagram was plotted showing which genes had significant values for which groups (Figure 2A). 28 genes were identified as significant for all four types of senescence; 14 genes consistently downregulated, 10 genes consistently upregulated and 4 genes with regulation dependent on senescence type (Figure 2B). Gene set enrichment analysis (GSEA) of these 28 genes revealed significant suppression of E2F targets and significant activation of genes upregulated by KRAS signalling (Figure 2C). The identification of only two pathways enriched across the four types of senescence mainly reflected that BYS cells had fewer significant changes across all BYS studies (a total of 388 significant genes compared to DDIS, OIS and REP which all identify over 4000 significant genes). There were 916 genes showing consistent and significant changes for OIS, DDIS, and REP. As might be expected, GSEA of the 916 genes common to OIS, DDIS and REP showed significant suppression of the mitotic spindle, G2M checkpoint, E2F targets, and DNA repair (Figure 2D), all of which suggest inhibition of the cell cycle and the DDR. There was additionally significant inhibition of MTORC1 signalling, spermatogenesis, and MYC targets, while there was significant activation of xenobiotic metabolism, KRAS signalling, p53 pathway and hypoxia pathways. Suppression of MTORC1 signalling is interesting as there is a large focus on rapalogues and how inhibition of mTOR can extend lifespan (Weichhart, 2018). However, some studies have found that mTOR signalling is required for senescence (for example, PTEN-loss-induced cellular senescence (Jung et al., 2019)), and that inhibition of mTOR with rapamycin can delay senescence progression (Demidenko and Blagosklonny, 2008; Xu et al., 2014).
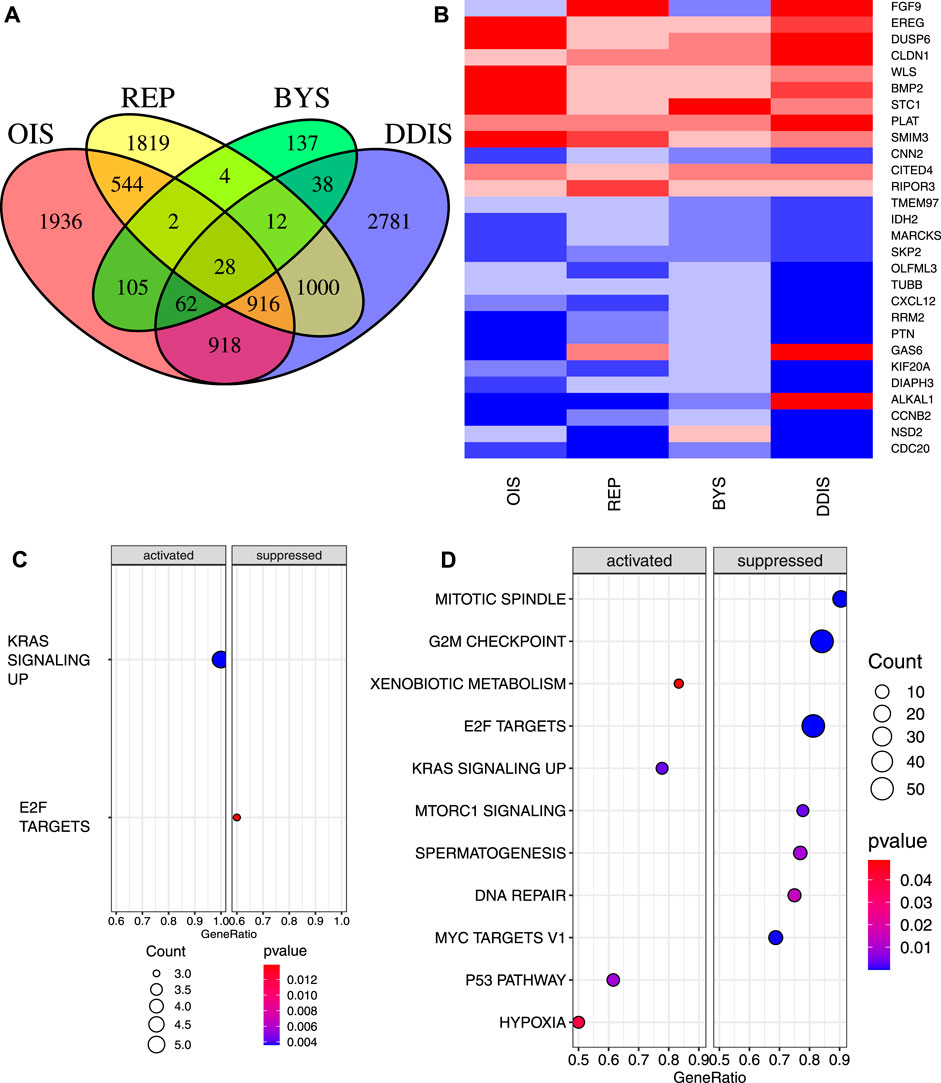
Figure 2. Significant genes and pathways across four types of senescence compared to proliferating control cells. (A) Venn diagram of genes with median pi value that is significant across OIS, REP, BYS and DDIS. (B) Heatmap of the 28 genes that were significant for all four senescence inducers. Upregulated, red; downregulated, blue. (C, D) Dot plot of pathways from GSEA of significantly activated and suppressed pathways identified in (C) the 28 genes common in OIS, REP, BYS and DDIS and (D) 916 genes common in OIS, REP and DDIS. p-value refers to the significance of the overrepresentation of the pathway and count reflects the number of genes associated with the pathway. OIS, oncogene induced senescence; REP, replicative senescence; BYS, bystander induced senescence; DDIS, DNA damage induced senescence; GSEA, gene set enrichment analysis.
Similarly, GSEA for the 918 genes showing significance for both OIS and DDIS indicated these pathways plus the activation of TNFα signalling via NF-κB and the suppression of genes involved in downregulating the UV response (Supplementary Figure S2A). When performing GSEA with a less stringent p-value (p < 0.1), the 1000 genes significant to only DDIS and REP and the 137 genes significant for just BYS identified no enriched pathways. GSEA of the 388 genes identified as significantly expressed in BYS identified only 3 pathways as significantly activated–the inflammatory response, TNFA signalling via NF-κB, and coagulation (Supplementary Figure S2B), none of which are related to cell cycle arrest or DNA damage. Identification of the inflammatory response and TNFα signalling via NF-κB, however, does support existing literature which demonstrate the inflammatory SASP and NF-κB as being causal in inducing bystander senescence (Acosta et al., 2013; Nelson et al., 2018). The analysis strongly suggested that the common changes in expression for senescent cells, with the exception of BYS cells, is the suppression of the cell cycle and DDR, with different inducers suppressing different genes within these pathways. The fact that BYS cells are not suppressing these genes is interesting. Of the four senescence inducers, BYS had the fewest studies and comparisons, which increases the impact of outlier studies when calculating the median pi value. Thus, this difference may simply reflect that BYS cells have less data available. However, it may also reflect the difference between primary and secondary senescence which is not yet well understood (Admasu et al., 2021; Teo et al., 2019).
Notably, in their non-systematic review of transcriptomic data, Hernandez-Segura et al. (2017) identified a 55 gene core signature for all types of senescence observed. The analysis included six different fibroblast strains (BJ, IMR90, HFF, MRC5, WI38, and HCA-2) for three different inducers (REP, OIS, and DDIS). None of our 28 genes with significant median pi values were in this 55 gene core signature, and only CNTLN, FAM214B, MEIS1, PLK3 and TSPAN13 were consistent with our 916 genes which excluded BYS. Another study by Casella et al. (2019) produced a 68 gene core signature for cellular senescence (not including BYS), of which only one gene (CLDN1) was consistent with our 28 core gene signature, which was upregulated in both cases. There were sixteen genes consistent with our 916 gene signature excluding BYS: ANP32B, CDCA7L, DHRS7, ELMOD1, HIST1H1A, HIST1H1D, HIST2H2AB, ITPRIPL1, JCAD, KIAA1671, LBR, LRP10, PAM, PARP1, PTMA, and SLC9A7. Only POFUT2 was consistent between the core signatures identified between Casella et al. (2019) and Hernandez-Segura et al. (2017). Notably both studies included non-fibroblast cells, and Hernandez-Segura et al. (2017) only included genes that were also significantly different to quiescent cells. However, the identification of a consistent transcriptional biomarker for senescence is clearly problematic. One possible explanation for the lack of any clear core senescence signature is that the senescence profile may change temporally and our above data spans from day 0 to day 112 post-senescence induction, while Hernandez-Segura et al. (2017) and Casella et al. (2019) only investigate up to day 10 post-senescence induction. To support this systematic analysis, we investigated temporal changes in gene expression of core senescence proteins and developed a qualitative computational model of DDIS and OIS which simulates temporal changes of protein expression as senescence progresses, demonstrating how different stages of senescence are characterised by different signatures.
Cellular senescence protein network and phenotypes
The senescence model network was developed based on a non-systematic literature review of protein profiles and our systematic transcriptomic analysis to determine the temporal senescence phenotype. From these combined reviews we developed a total of 12 molecular profiles defining senescence, four of which were related to how senescent cells responded when key network components were knocked down (Table 3). The network is composed of five different interlinking signalling pathways (Figure 3) – cell cycle arrest and DDR related proteins, RAS, p38 signalling, inflammatory signalling, and Notch signalling. The model can be adapted to investigate different dynamic aspects of senescence such as the impact of changes in Notch signalling (Hoare et al., 2016; Teo et al., 2019) or the impact of p53 KD or inhibition (Kumari et al., 2021; Zhang et al., 2021; Zhu et al., 2022).
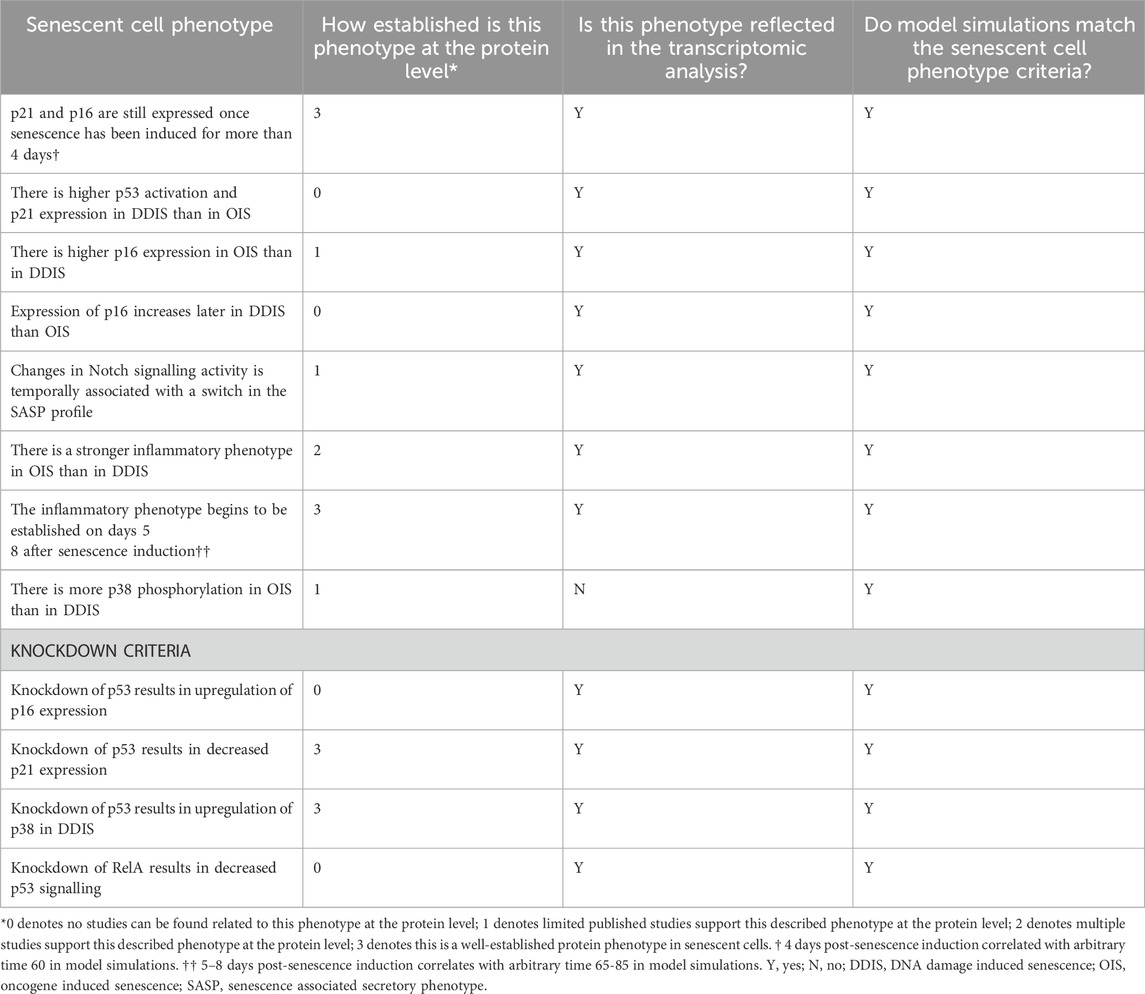
Table 3. Phenotypes of cellular senescence.
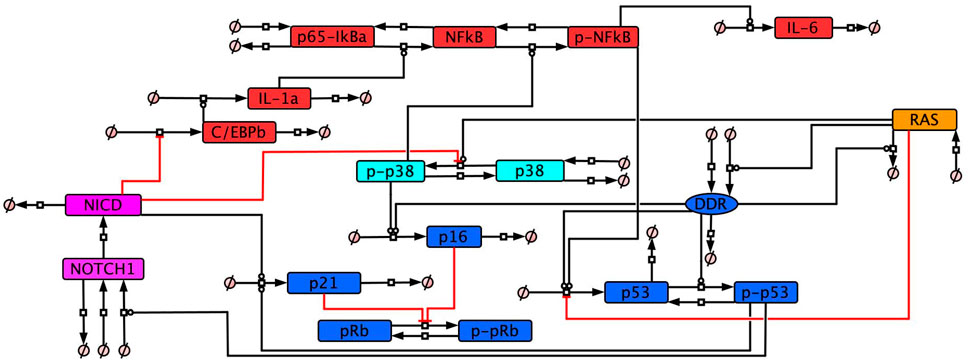
Figure 3. Cellular senescence protein network. The network of interactions between selected proteins recognised as being involved in key aspects of cellular senescence. All interactions in the network have been non-systematically searched in the literature, providing evidence to justify the network (Supplementary Table S2).
Both the DDR and RAS were included as a source of senescence stimulus. Both DDIS and OIS are known to require activation of the DDR leading to cell cycle arrest (Kumari and Jat, 2021), with hyperactivation of an oncogene such as RAS additionally required for OIS (Liu et al., 2018). In simulations, DDIS is induced by introducing an input which would simulate DNA damage and activation of the DDR to induce cell cycle inhibitor expression and the resultant arrest. While OIS is induced through RAS expression which leads to the activation of p38/p16 with subsequent DDR activation and cell cycle arrest.
The SASP is a key characteristic of senescent cells involved in the spreading of secondary senescence (Acosta et al., 2013; Coppé et al., 2010; Kuilman and Peeper, 2009) and signalling to the immune system for senescent cell removal (Krizhanovsky et al., 2008; Muñoz-Espín and Serrano, 2014). SASP composition can be variable dependent on senescence type and cell type (Childs et al., 2015). However there is also a temporal aspect to the SASP, with some studies observing a shift from a TGFβ-rich secretome in early senescence to an inflammatory-rich secretome in late senescence (Hoare et al., 2016; Ito et al., 2017). The inflammatory SASP is established 5–8 days after senescence induction (Coppé et al., 2010) and is controlled by proteins including p38 (Freund et al., 2011) and NF-κB (Chien et al., 2011). In this study we refer to early senescence as occurring prior to inflammatory SASP induction and late senescence as occurring after induction of the inflammatory SASP.
Studies which have observed this shift from a TGFβ-rich SASP to an inflammatory-rich SASP have observed a dynamic switch in Notch signalling as mediating temporal changes in SASP composition (Hoare et al., 2016; Ito et al., 2017). Notch signalling was therefore included in the model network as a means of mediating a temporal change in SASP composition through an inducible event termed ‘The Notch Switch’. The Notch Switch dynamically changes Notch signalling from active to inactive when induced, allowing for modulation of the SASP.
Activity of p53 in senescent cells
Our study and those by Hernandez-Segura et al. (2017) and Casella et al. (2019) indicate that the standard markers of senescence, including those believed to be causal in senescence induction such as p53 and p21, are not reliable biomarkers at the RNA level. Therefore, we looked more deeply at the genes commonly associated with senescence, attempting to identify conditions where they were demonstrably and reliably active or upregulated at the mRNA level.
We first looked at DDR genes thought to play a central role in initiating the senescence response. Double strand breaks or uncapped telomeres activate ATM and ATR followed by downstream CHEK1 and CHEK2 which activate p53 and cause the transcription of p21. Splitting the data into groups by timepoint (0–4 days, 5–7 days, 8–11 days, 12–14 days, and 15+ days), we looked at these damage response genes. Evidence for 12–14 days, excluding REP, is limited to eight comparisons from seven studies, while the 15 + day data is limited to five comparisons from four separate studies only investigating DDIS. The latter was excluded from the graphs due to the limited datapoints. Further research is required at these late time points to complete the temporal profile. REP cells were split into two categories: 0–40 days post-senescence induction and 41+ days post senescence induction. As the vast majority of studies of REP cells did not state the timepoint after induction, these were put in the 0–40 days group under the assumption that waiting 41+ days reflected a deliberate attempt to look at the longterm senescence gene profile and would be noted in the study.
ATM (Figure 4A) and ATR (Supplementary Figure S3A) mRNAs showed no observable temporal trend in LogFC, in senescence staying around the level of proliferating cells, although ATM expression in DDIS was higher than proliferating cells between days 12–14 post-senescent induction. The same was true for CHEK1 (Figure 4B) and CHEK2 (Supplementary Figure S3B), except that CHEK1 was observably reduced compared to proliferating cells in both DDIS and OIS at least until day 12. CHEK1 and CHEK2 activity is primarily increased at the protein level by phosphorylation by ATM and ATR (Ahn et al., 2000; Jazayeri et al., 2006). A function of both CHEK1 and CHEK2 is to phosphorylate CDC25A, causing its degradation. The mRNA data suggest that CDC25A was decreased compared to proliferating cells (Supplementary Figure S3C), potentially sufficient to induce the S and G2 checkpoints (Falck et al., 2001; Xiao et al., 2003). Additionally, CDC25A expression was significantly lower in DDIS compared to OIS at days 0–4 (p-value <0.01) and days 8–11 (p-value <0.05). However, the main role of CHEK1/2 is thought to be in the stabilisation of p53 protein (Chehab et al., 2000). p53 signalling is known to be active in senescence (Mijit et al., 2020; Rufini et al., 2013), but this is not reflected in its transcriptional profile, which shows no evidence of an increase in mRNA compared to proliferating cells, and possibly a decrease at some time points (Figure 4C). Not observing a change in p53 mRNA expression likely reflects the pulsatile signalling of p53 (Hunziker et al., 2010; Sun et al., 2011), which is bound and inactivated by MDM2 targeting it for ubiquitin-mediated degradation (Michael and Oren, 2003). Although p53 activity is regulated in large by post-translational modifications and coactivators (Fielder et al., 2017), it is also a short-lived protein, and must in some way be regulated at the transcriptional level; however, the pulses are likely too fast for a single measurement or measurements across multiple days to capture the average level of p53 mRNA compared to control cells (Hunziker et al., 2010; Sun et al., 2011). The level of mouse double minute 2 (MDM2) mRNA, the negative regulator of p53, is increased in DDIS (Figure 4D). Interestingly, expression of MDM2 is significantly higher in DDIS cells compared to OIS cells at 0–4 days (p-value <0.0001), 5–7 days (p-value <0.01) and 8–11 days (p-value <0.0001) post-senescence induction. Although MDM2 inhibits p53, increased expression reflects increased p53 activity, as p53 induces the transcription of MDM2 (Barak et al., 1993). This trend is reinforced by other p53-induced genes such as GADD45A (Kastan et al., 1992) and p21 (CDKN1A) (Figures 4E,F), which are increased across all timepoints in DDIS, while only p21 is notably increased in OIS. Notably, the systematic analysis gives little indication that p53 activity decreases before day 11, with p21, GADD45A, and MDM2 trending to increase at 8–11 days compared with 5–7 days in both OIS and DDIS, typically remaining above proliferating controls at days 12–14 days post-senescence induction.
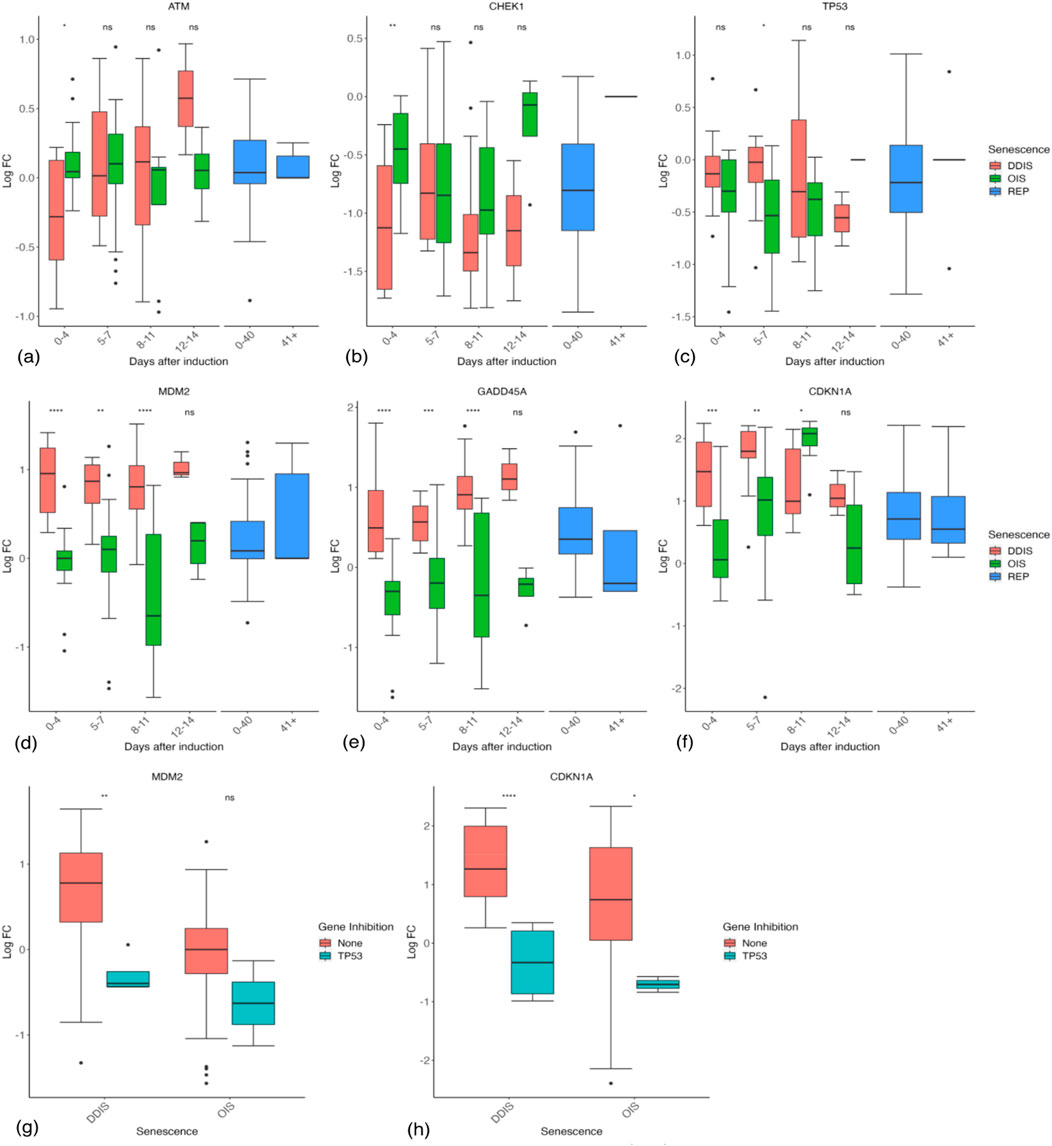
Figure 4. Expression of the damage and p53 response in senescent cells. (A–F) Gene expression during the timeline of senescence induction measured in days after the initial stimulus. (G, H) Gene expression for different senescence inducers with and without p53 inhibition. Control groups for inhibition include all data for days 1–11. DDIS, DNA damage induced senescence; OIS, oncogene induced senescence; REP, replicative senescence; LogFC, log fold change; p-value refers to significance in expression between DDIS and OIS (A–F) and expression with and without gene inhibition (G–H), *p-value <0.05; **p-value <0.01; ***p-value <0.001; ****p-value <0.0001.
To confirm the role of p53 in the upregulation of these genes, we looked at the studies which inhibited p53. REP cells were excluded as these cells have no defined time after senescence induction, as was one comparison at day 28, long after p53 signalling is thought to have subsided (Robles and Adami, 1998). As expected, p53 mRNA was observably reduced in p53 inhibition studies (Supplementary Figure S4A). As predicted, the downstream targets of p53, MDM2 and p21 mRNAs, both showed observable reductions in the p53 inhibition group (Figures 4G,H), but interestingly this was not true of GADD45A or B (Supplementary Figure S4B, C). We concluded that although p53 mRNA was not a reliable biomarker of senescent cells (Hernandez-Segura et al., 2017), the combined transcriptional data from all available studies suggest that p53 is highly active in senescent cells up to at least 14 days (Figures 4D–F). However, p53 activity is lower (as measured by p21, MDM2, and GADD45A mRNA levels) in OIS compared to DDIS (Figures 4D–H), suggesting that p53 may play a larger role in DDIS than in OIS.
p53 expression and phosphorylation (pp53) begins at senescence induction, with pp53 increasing as senescence progresses (Freund et al., 2011). This leads to p21 expression and induction of cell cycle arrest. One interesting observation in this transcriptomic analysis is significantly stronger p53 signalling in DDIS compared to OIS up to day 11 (Figures 4D–F), a comparison which has not been made or observed in the literature. When simulating the model, the temporal dynamics of p53, pp53 and p21 meet all criteria devised relating to p53 signalling (Table 3) for both the senescence phenotypes and knockdown phenotypes. There is sustained higher activation of p53 expression in DDIS compared to OIS (Figures 5A,B); p21 is expressed into late senescence (Figure 5C); p53 KD reduced p53 signalling (Figure 5); RelA KD reduces p53 signalling (Figure 5). When the Notch Switch is induced, there is a decrease in the level of p21 expression in both senescence types (Figure 5C), and interestingly we also see a decrease in p21 transcript expression at later timepoints (Figure 4F).
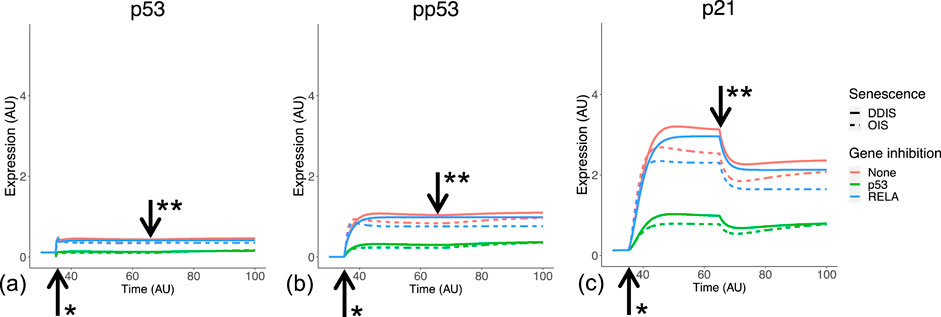
Figure 5. Simulation of p53 signalling dynamics. Simulations show temporal expression of p53 (A), phosphorylated p53 (B), and p21 (C), in DDIS and OIS, and when a p53 or RelA KD is introduced. Units are arbitary (AU). *Senescence and/or KD induced. ** Notch Switch induced. DDIS, DNA damage induced senescence; OIS, oncogene induced senescence.
OIS and DDIS rely on different mechanisms for arrest
The differences between OIS and DDIS are still being elucidated. DDIS reflects the direct sub-apoptotic chronic induction of the DDR, typically mediated by double strand breaks (DSBs), but OIS need not. Some studies have shown that OIS is bypassed in the absence of the DDR (Bartkova et al., 2006; Di Micco et al., 2006; Mallette et al., 2007), and RAS-induced OIS cells can re-enter the cell cycle if the DDR is inactivated, reflecting that OIS relies on the DSBs induced by the aberrant activation of oncogenes and the resultant hyperproliferation (Di Micco et al., 2006). However, other reports suggest that OIS can be induced independently of the DDR (Alimonti et al., 2010), although still requiring p53 (Wolyniec et al., 2009) or p16 (Bracken et al., 2007). Interestingly, while p21 is significantly higher in DDIS compared to OIS up to day 11 post-senescence induction (Figure 4F), p16 (CDKN2A) is significantly higher in OIS compared to DDIS up to day 11 post-senescence induction, and non-significantly higher at days 12–14 (Figure 6A). Upon inhibition of p53 in senescent cells, p16 expression does not significantly change (Figure 6B), suggesting that p16 is independent of p53 signalling (Alcorta et al., 1996).
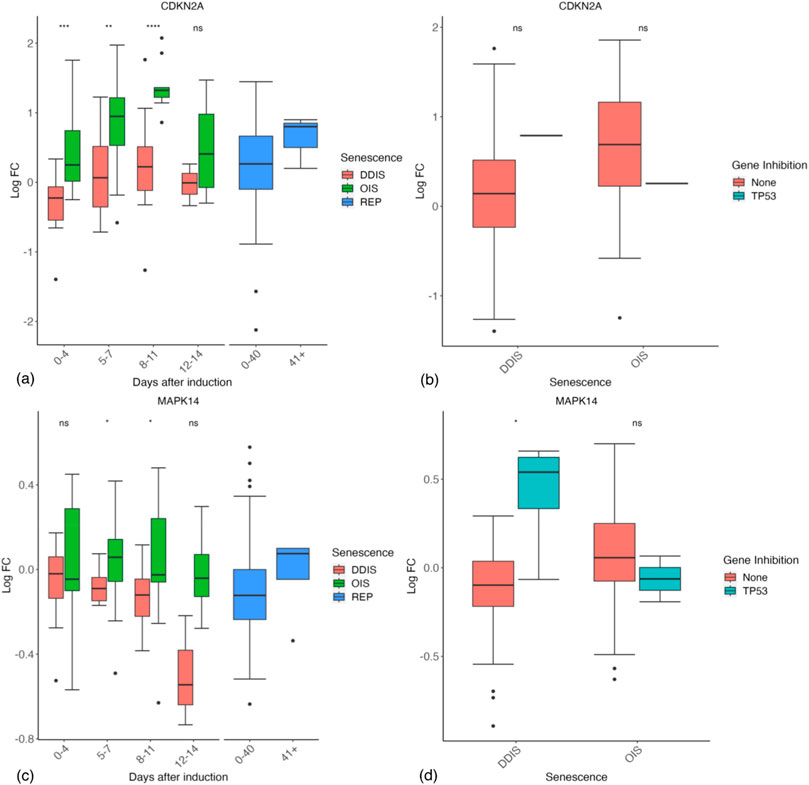
Figure 6. Expression of p16 and p38 genes in senescent cells. (A, B) Expression of p16 (CDKN2A) during different timepoints (A) and with p53 inhibition (B). (C, D) Expression of p38 (MAPK14) during different timepoints (C) and with p53 inhibition (D). Control groups for inhibition include all data for days 1–11. DDIS, DNA damage induced senescence; OIS, oncogene induced senescence; REP, replicative senescence; LogFC, log fold change; p-value refers to significance in expression between DDIS and OIS (A, C) and expression with and without gene inhibition (B, D), *p-value <0.05; **p-value <0.01; ***p-value <0.001; ****p-value <0.0001.
The activation pathway of p16 is still somewhat controversial. One suggestion is that DNA damage activates p38 (Bulavin et al., 2003; Ito et al., 2006; Iwasa et al., 2003), which then activates p16 (Spallarossa et al., 2010). Our data are consistent with this idea, with p38 (MAPK14) being higher in OIS than DDIS, significantly higher 5–11 days post-senescence induction (p-value <0.05) (Figure 6C), and higher in p53 inhibited DDIS cells (Figure 6D). Consistently, Freund et al., 2011 found that p53 inhibited p38 phosphorylation which has implications for the SASP. Several genes showed a stronger response to p53 inhibition in DDIS than in OIS, presumably reflecting that p53 activity is higher in DDIS.
It has been repeatedly suggested that p21 is transient in senescence, required only for induction (He and Sharpless, 2017; Kumari and Jat, 2021). Robles and Adami (1998) showed p21 levels were decreasing by day 8 in DDIS, suggesting that p53 activity peaked around day 4. While this may be true, we saw little evidence of mRNA decline by 8–11 days (Figure 4F), and even at days 12–14 certainly in DDIS expression of p21 mRNA was still higher than in control proliferating cells. Two other frequently cited studies describing transient p21 levels are in REP, and show p21 levels declining over weeks of passaging (Alcorta et al., 1996; Stein et al., 1999). Our systematic analysis indicates p21 levels are still increasing at 8–11 days compared to 5–7 days cells. From this data, p21 seems no more transient than p16, which is generally described to be absent in early senescence and rise slowly over time. Robles and Adami (1998) showed p16 mRNA was no higher than control at day 4 DDIS, slightly increased at day 12 and then peaking at day 30. Stein et al. (1999) indicated that in REP, p16 began its steepest increase after 30 weeks of passaging (compared to 10 weeks for p21). However, systematic analysis indicates that p16 is already increasing in OIS by day 4, and is significantly higher in OIS than DDIS (p-value <0.001) (Figure 6A). The rise is less obvious in DDIS, but it does tend to increase temporally up to 8–11 days.
This contrasts p21, which rises at 0–4 days in DDIS but median expression does not increase above 0 LogFC until 5–7 days in OIS. Speculatively, this may reflect that the damage is the primary initiator in DDIS, promptly activating p21, whereas in OIS the damage from hyperproliferation may take longer, while RAS, p38, or other mechanisms independently activate p16. In DDIS, the rise in p16 is slower as reflected by the median LogFC just above zero even by 8–11 days. However, Hoare et al. (2016) show western blots of p16 protein levels increasing by 2 days for both OIS and DDIS. The band at 8 days is observably thicker for OIS than in DDIS, which is consistent with the systematic analysis. Notably, while p38 may activate p16, p38 phosphorylation is increased between 6 and 8 days in OIS (Freund et al., 2011), so it is unlikely to explain the early rise, but if p38 is also activated by RAS signalling (Chen et al., 2000), it may reflect an additional mechanism upregulating p16 in OIS but not DDIS, which might explain the later difference.
Although there is controversy surrounding p16 dynamics in senescence, our analyses suggest p16 expression is maintained into late senescence, significantly more expressed in OIS compared to DDIS, and is expressed in OIS before it is expressed in DDIS (Figure 6A). Our systematic analysis reveals limited change in p38 expression as senescence progresses (Figure 6C), something which is recapitulated at the protein level in the study by Freund et al. (2011) who also demonstrate that while total p38 levels remain similar throughout senescence, phosphorylation levels increase from day 4 to day 6 and continue to increase to at least day 10. As phosphorylation status cannot be explicitly determined at the mRNA level, we are unable to check if this is reflected in the transcriptomic data.
p16 is involved in cell cycle arrest and is well-known as a senescence marker which has been used for targeted removal of senescent cells in animal models (Baker et al., 2016; Baker et al., 2011). Some studies have observed a link between p38 and p16, with active phosphorylated p38 (pp38) increasing p16 expression (Kwong et al., 2009; Sun et al., 2007), therefore our model network has pp38 contributing to p16 expression. As previously mentioned, phosphorylation status cannot be explicitly investigated at the mRNA level, however it can be in the protein level computational model. Simulation of the senescence model meets all senescence phenotype and KD criteria relating to p16 and p38 outlined in Table 3. Expression of p16 is higher and begins earlier in OIS than in DDIS and is increased when p53 is knocked down (Figure 7A) as expected from our analyses (Figure 6A). One study does find decreased p16 transcript expression when p53 is knocked down (Georgilis et al., 2018) which aligns with our transcriptomic analysis. p38 expression is steady throughout simulations of DDIS and OIS, also consistent with our analyses (Figure 6C) and published protein level studies (Freund et al., 2011), while pp38 increases, particularly in late senescence, and KD of p53 results in increased p38 expression (Figures 7B,C), which is seen at the transcript level (Figures 6B,D).
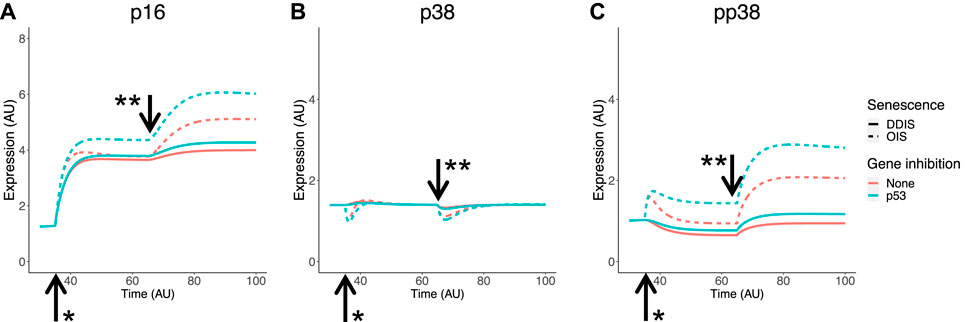
Figure 7. Simulation of p16 and p38 in senescence. Simulations show temporal expression of p16 (A), p38 (B), and phosphoylated p38 (C), in DDIS and OIS, and when a p53 KD is introduced. Units are arbitary (AU). *Senescence and/or KD induced. ** Notch Switch induced. DDIS, DNA damage induced senescence; OIS, oncogene induced senescence.
Induction of the SASP
The processes that lead to the induction of the SASP are still uncertain. As discussed by Freund et al. (2011), one possible mechanism is that p38 activates NF-κB. Perhaps the most detailed temporal profile comes from Hoare et al. (2016) who suggested that the initial SASP of OIS and DDIS was a TGFβ-rich secretome, which due to a breakdown in Notch signalling around day 4–5 became an inflammatory secretome.
Notch signalling is a juxtacrine mechanism. When a ligand from one cell binds the Notch receptor of an adjacent cell there are multiple cleavage events which result in the release of the Notch intracellular domain (NICD) which can then translocate into the nucleus and enact Notch targeted gene transcription (Bray, 2006). As Notch signalling is regulated through receptor cleavage and ligand binding, we would not expect to see much change in expression of the NOTCH1 receptor gene. Analysis of NOTCH1 in our database revealed that expression is higher in OIS than in DDIS, being significantly higher at day 0–4 (p values <0.01) and 8–11 days (p vales <0.001) (Figure 8A). We then used the database to investigate changes in Notch signalling through expression of two well-known Notch target genes, HES1 and HEY1. It should be noted that NOTCH1 transcriptional activity is still not well understood, even HES1 is not always responsive to NOTCH1 activation (Kopan and Ilagan, 2009; Lee et al., 2007). In our analyses, both HES1 and HEY1 show an increase in median expression compared to control proliferating cells at 0–4 days in DDIS and OIS. Expression stays relatively similar at days 5–7 for HEY1 (Figure 8B) before decreasing at days 8–11, while median HES1 expression decreases from days 0–4 to days 5–7 (Figure 8C). This corresponds with the study by Hoare et al. (2016) who see an initial increase in Notch signalling activity (determinised via the presence of the NICD and HES1) followed by a decrease between days 4–6.
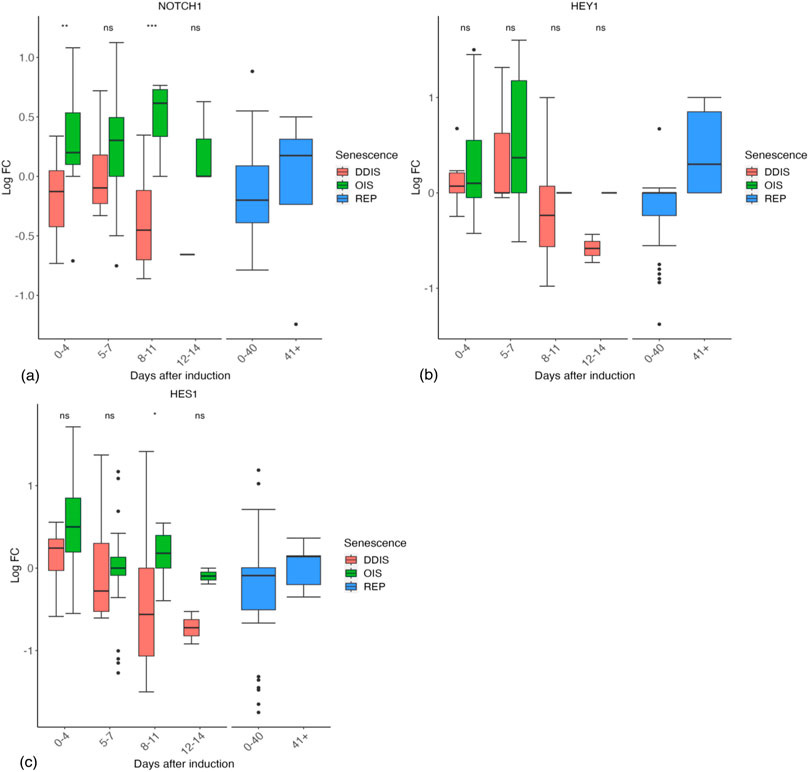
Figure 8. Expression of Notch signalling related genes in senescent cells. (A–C) Gene expression during the timeline of senescence induction measured in days after the initial stimulus. DDIS, DNA damage induced senescence; OIS oncogene induced senescence; REP, replicative senescence; LogFC, log fold change; p-value refers to significance in expression between DDIS and OIS, *p-value <0.05; **p-value <0.01; ***p-value <0.001; ****p-value <0.0001.
To model a change in Notch signalling dynamics, we introduced the NOTCH1 receptor and NICD as protein species in the model network. This model is at the single cell level therefore to induce a change in Notch receptor activity we introduced an event termed the ‘Notch Switch’ which results in the downregulation of NICD expression, representing less ligand-receptor activity as less NICD is cleaved from NOTCH1. Simulations demonstrated dynamic changes in Notch signalling temporally. NICD is expressed in early senescence while senescence is being established, indicating active Notch signalling. This is followed by a reduction in NICD and therefore Notch signalling once the Notch switch is activated (Figure 9). Simulation dynamics recapitulate published protein profiles in senescence (Hoare et al., 2016) and reflect our systematic analysis of HES1 transcript expression (Figure 8C), supporting the observation that dynamic Notch signalling is involved in regulation of the SASP.
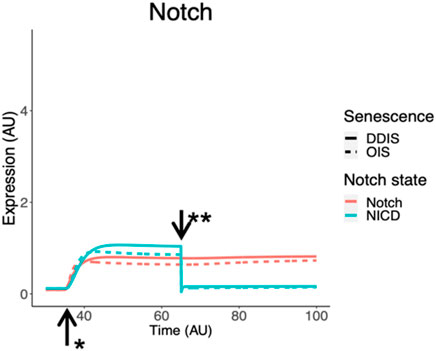
Figure 9. Simulation of Notch signalling dynamics in cellular senescence. Simulations show dynamic temporal changes in Notch signalling from active to inactive in both DDIS and OIS. Units are all arbitrary (AU). *Senescence induced. **Notch Switch induced. DDIS, DNA damaged induced senescence; OIS, oncogene induced senescence.
The SASPs of OIS and DDIS are governed by the activity of p38 and p53
NF-κB is essential for the production of the inflammatory SASP (Chien et al., 2011; Freund et al., 2011), and co-suppression with p53 leads to bypass of arrest (Beauséjour et al., 2003). Notably, BJ fibroblasts required only shRNA against RelA to bypass arrest, which the authors concluded may reflect the previously identified less robust senescence program in this cell type (Beauséjour et al., 2003). We compared gene expression for the different cell lines discussed in Supplementary Figure S5 and the results were consistent with a different profile for BJ cells.
Importantly, there is strong evidence of an increased inflammatory response in OIS compared with DDIS, with the main SASP factors including IL-6, IL-8 (CXCL8), and IL-1β all showing higher levels in OIS cells over DDIS at least between 5 and 11 days (Figures 10A–C), although this is not significant at any timepoints. Interestingly, in REP cells the expression of IL-6, IL-8 and IL-1β are all increased at days 40+ compared to 0–40 days whose median expression is around 0 LogFC and therefore similar to proliferating control cells (Figures 10A–C). This shows that while the SASP may be more strongly expressed in OIS, the SASP is still an important mechanism in other types of senescence at later timepoints.
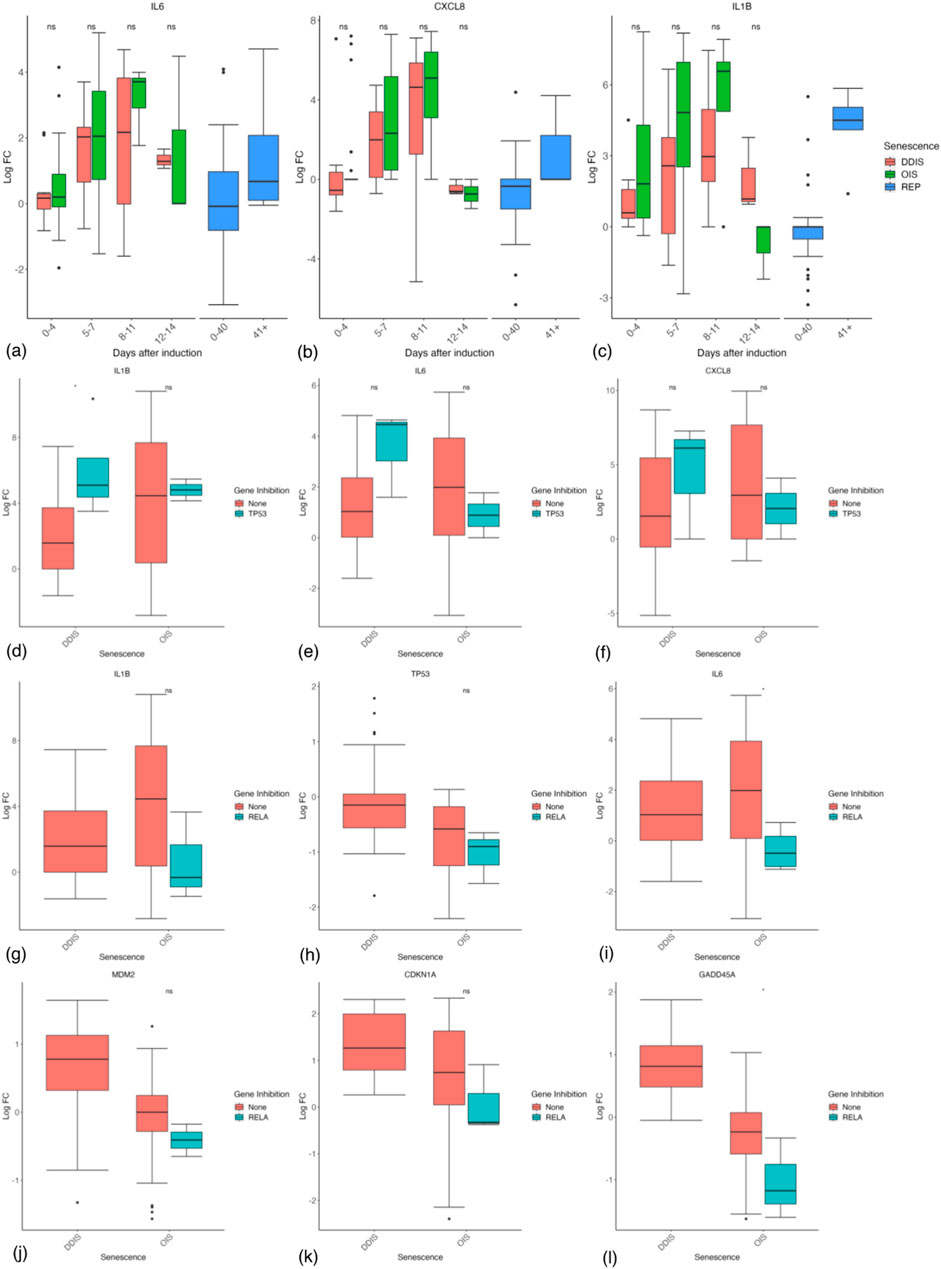
Figure 10. Expression of inflammatory and p53 genes in senescent cells. (A–C) Gene expression during the timeline of senescence induction measured in days after the initial stimulus. (D, E) Gene expression for different senescence inducers with and without p53 inhibition. (F–K) Gene expression for different senescence inducers with and without RelA inhibition. Control groups for inhibition include all data for days 1–11. DDIS, DNA damage induced senescence; OIS, oncogene induced senescence; REP, replicative senescence; LogFC, log fold change; p-value refers to significance in expression between DDIS and OIS (A–C) and expression with and without gene inhibition (D–L), *p-value <0.05; **p-value <0.01; ***p-value <0.001; ****p-value <0.0001.
Expression of inflammatory proteins increasing from 5 to 7 days is consistent with the timing of the SASP concluded by others (Coppé et al., 2008; Freund et al., 2011; Hoare et al., 2016). There is also some evidence that p53 is inhibiting the SASP, with trends toward increased IL-1β (p-value <0.05), IL-6, and IL-8 in p53 inhibited cells, particularly in DDIS where p53 levels are higher (Figures 10D–F). However, fascinatingly when we looked at the studies where RelA had been inhibited, the results demonstrated the opposite effect. As expected, RelA inhibition showed reduced levels of IL-1β and to a lesser extent IL-6 (Figures 10G,H), suggesting reduced inflammatory signalling. However, both p53 mRNA levels and p53 activity (as represented by MDM2, p21 and GADD45A mRNA levels) were all reduced by RelA inhibition (Figures 10I–L). This strongly suggests that the reduced p53 signalling in OIS is not due to the increased inflammatory signalling, and makes it difficult to explain why p53 activity might peak at 4 days as has been suggested (Robles and Adami, 1998), before upregulation of the SASP. These results are contrary to results by Chien et al. (2011) who investigated the impact of a RelA KD in senescence and found at the protein level when RelA was knocked down, total p53 and p21 expression remained similar to that of control senescent cells.
NF-κB is a major transcriptional regulator of senescence (Oeckinghaus and Ghosh, 2009). In senescence, high level binding of the NF-κB subunit RelA has been shown in complexes at promoters of transcription (Chien et al., 2011) suggesting the active homo/heterodimer in senescence involves RelA. As the most common subunit conformation of NF-κB is p50-RelA (Hoffmann and Baltimore, 2006), we chose to represent NF-κB as a p50-RelA heterodimer in the model network. To be considered a successful representation of cellular senescence, expression of inflammatory proteins must be higher in OIS compared to DDIS, and should not be expressed until senescence has been established at the equivalent of 5–7 days post-senescence induction (Figures 10A–C). Many studies additionally support the activation of the SASP as occurring between 5 and 8 days post senescence induction (Coppé et al., 2008; Freund et al., 2011; Hoare et al., 2016).
We simulated SASP induction to begin once the Notch switch is induced at the equivalent of day 5 post senescence induction (Figure 11), producing a stronger inflammatory phenotype in OIS compared to DDIS as pNF-κB and IL-6 expression are both higher (Figures 11B,C). Although NF-κB levels remain similar in OIS and DDIS, there is more pNF-κB in OIS than DDIS, which likely contributes towards the increased inflammatory response observed in OIS in comparison to DDIS, which we also see in our systematic analysis (Figures 10A–C).
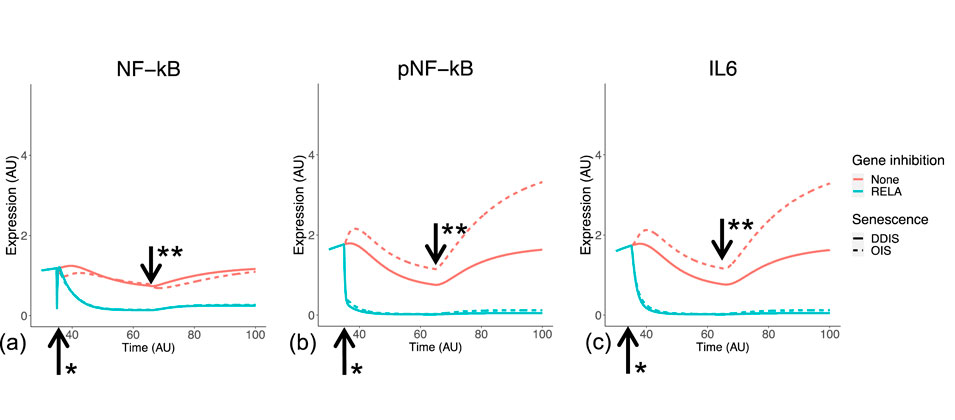
Figure 11. Simulation of the inflammatory SASP in cellular senescence. Simulations show temporal expression of NF-kB (A), phosphorylated NF-kB (B), and IL6 (C), in DDIS and OIS, and when a RelA KD is introduced. Units are arbitary (AU). *Senescence and/or KD induced. **Notch Switch induced. DDIS, DNA damage induced senescence; OIS, oncogene induced senescence.
Both the systematic analysis and computational model suggest that SASP factors are not delayed in DDIS but are rather reduced in comparison to OIS. For example, median expression of the IL-6 transcript initially increases between days 5 and 7 in both DDIS and OIS; however, it has a larger range of expression in OIS than in DDIS (Figure 10A). The same is true at the protein level as observed in simulations of the senescence model (Figure 11C). While both transcriptomic analyses and model simulations support a stronger expression of SASP proteins in OIS, whether the SASP is primarily contributing towards senescence maintenance or bystander induced senescence is unknown. However, our analyses do find persistent expression of cell cycle arrest proteins such as p53, p21, and p16. Therefore, it could be possible that the inflammatory nature of the SASP is causing further DNA damage to sustain cell cycle arrest. Alternatively, the DNA damage initially caused by the senescence stimulus may not be resolved and could be the cause behind persistent expression of cell cycle arrest proteins.
Contrary to expectations, we could find little evidence of an initial TGFβ-rich secretome at the transcript level in DDIS or OIS as in Hoare et al. (2016). Both TGFB1 and TGFBR1 mRNAs showed no trend toward upregulation at early timepoints followed by a decrease in expression (Figures 12A,B). However, COL1A1, PDGFA, and ACTA2 do tend to decrease in expression from days 0–4 to days 5–7 (Figures 12C–E). Furthermore, the ACTA2 gene encoding the α-SMA protein, a biomarker of myofibroblast development (Wynn and Ramalingam, 2012), which is robustly expressed in response to prolonged TGFβ in both proliferating and senescent cells (Fullard et al., 2024), had reduced expression in OIS at 0–4 days compared to proliferating controls, while DDIS showed no change compared to proliferating cells (Figure 12E). If these observations are correct, the early TGFβ SASP observed by Hoare et al. (2016) may reflect normal function of proliferating fibroblasts that is reduced as Notch signalling declines and the inflammatory SASP activates.
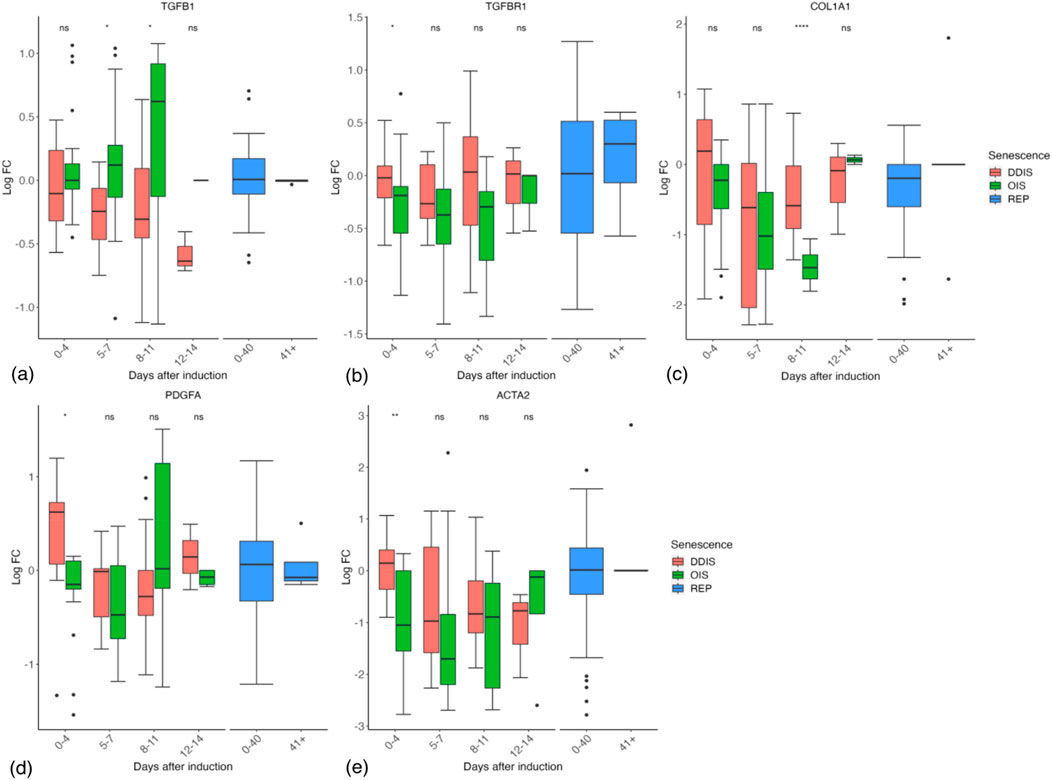
Figure 12. Expression of TGFβ response genes in senescent cells. (A–E) Gene expression during the timeline of senescence induction measured in days after the initial stimulus. DDIS, DNA damage induced senescence; OIS, oncogene induced senescence; REP, replicative senescence; IQR, interquartile range; LogFC, log fold change; p-value refers to significance in expression between DDIS and OIS, *p-value <0.05; **p-value <0.01; ***p-value <0.001; ****p-value <0.0001.
Although we saw no evidence of an initial TGFβ SASP in OIS or DDIS, the data are still far from conclusive, and of course only reflects the senescence profile to the extent it is determined at the transcriptional level. That said, the level of secreted proteins (as would be expected of SASP components) is perhaps well observed at the transcriptional level as the proteins may be quickly secreted and must be replaced by translation of mRNA.
Conclusion
Here, we have conducted a systematic analysis of all available transcriptomic data for senescent fibroblasts that met pre-specified inclusion criteria and qualitatively modelled temporal protein changes in senescence, including KD interventions.
A total of 12 phenotypic criteria were devised to describe cellular senescence and when a p53 KD or RelA KD was introduced (Table 3), with the model presented here meeting all the criteria. Although this network is not exhaustive of all aspects of cellular senescence, the fact that the model is able to recapitulate different temporal phenotypes found in the literature and in our systematic analyses, supports the strength in the network developed. Dynamic sensitivity analysis was also performed on both DDIS and OIS simulations to determine if proteins species were appropriately sensitive to parameters at different times throughout the senescence process, and it was found that most proteins are appropriately sensitive to direct inputs which induce either senescence or the activation of the Notch switch (Supplementary Figure S1), suggesting that treatment with the same drug but at different doses may result in different outcomes in the transcriptome and therefore at the protein level. In our database, for example, there are nine studies which induce DDIS using etoposide treatment. However, there are three differing doses of etoposide treatment with different treatment regimens depending upon the study design, all of which could lead to changes in the senescence phenotype. Interestingly, this modelling and sensitivity analysis, in addition to the systematic analysis, demonstrate that the temporal profile of a senescent cell is highly sensitive to the stimulus which can result in differing levels of expression.
Additional studies are still required to address how senescence changes over time, particularly at late timepoints. There were multiple variables changed between studies, which likely explains the lack of consistent biomarkers; however, senescence is not a singular defined response, and the senescent phenotype depends on the context of stimulus, cell type, and timepoint among others. As demonstrated with the computational model, the different stimuli for DDIS and OIS results in differing levels of protein changes temporally (particularly in inflammatory SASP components), however there are still common trends between the two types of senescence such as expression of cell cycle inhibitors upon senescence stimulus induction and the SASP becoming active once senescence is established, also observed in the systematic analysis. In conclusion, the results of this systematic analysis suggest that while individual transcripts may not be expressed or repressed with sufficient universality to be used as universal biomarkers of senescence, they do follow predictable profiles depending on the type of senescence and time after induction, which can be modelled computationally. Furthermore, the interplay of different signalling pathways in senescence is a complex temporal process which is yet to be fully understood. Further study should look at cellular senescence as a whole and not just individual pathways disconnected from one another.
The central limitation of this study is its focus on in vitro analyses. While senescence has been extensively studied under these conditions, the relevance of the genotypes and phenotypes of in vitro senescent cells to those found in vivo is still an open question. Particularly how senescence develops and progresses temporally naturally in vivo compared to in vitro. Even aside from the effects of other cell types and tissues that may alter senescent cells, senescence is such a broad term that we do not yet know whether the cells we are observing in vitro are the same types of cell we observe in vivo, and many in vitro biomarkers do not translate to in vivo; for example, the largened, flattened cell morphology observed in vitro is rarely observed in vivo (González-Gualda et al., 2021). Ultimately, any senotherapeutics identified by in vitro analysis will need to be validated in vivo in animal models followed by clinical trials. One successful example of this workflow being implemented is with dasatinib and quercetin (D&Q) which were identified through an in vitro mechanism-based approach (Zhu et al., 2015). D&Q first proved effective at removing in vitro senescent cells, and clinical trials are currently underway investigating D&Q in multiple disease states (Raffaele and Vinciguerra, 2022) including idiopathic pulmonary fibrosis (Justice et al., 2019; Nambiar et al., 2023), Alzheimer’s disease (Gonzales et al., 2023), and diabetic kidney disease. Importantly, preliminary reports in diabetic kidney disease indicate D&Q is successful at eliminating in vivo senescent cells (Hickson et al., 2020; Hickson et al., 2019), demonstrating in vitro analyses can translate to in vivo application.
Another limitation of this study is its methodology of looking for similarities between senescent cells from different cell types, inducers, and conditions, forming a model of the pathways and molecules involved in the senescence process. However, the results of our study and those done previously (Basisty et al., 2020; Casella et al., 2019; Hernandez-Segura et al., 2017; Saul et al., 2022) suggest that senescence is not a static process with universal biomarkers. There is potentially an artificiality in defining all these types of senescence as the same process. However, at least part of the failure to identify universal biomarkers has been the initial focus on biomarkers per se rather than understanding the development of senescence. Even if senescence is the same process under all the conditions we look at here, that does not mean it will have the same transcriptional profile at two different points in time. Thus, even the best biomarkers should only ever identify a senescent cell at a particular stage of development. Hence, we have attempted to create a temporal profile of senescence using both bioinformatic and modelling-based analyses. However, while this has several strengths including the use of multiple studies in a combined analysis, it also has the limitation that it is comparing cells from different conditions and studies across the temporal analysis, and even in the combined dataset late timepoints are still lacking.
Importantly, only data from human fibroblasts have been included in the transcriptomic database and protein behaviour in senescence simulations was guided only from studies which used human fibroblasts. This is important as although there is obvious overlap between humans and animal models, there are also notable differences–for example, mice have longer telomeres than humans, shorter lifespans, and cells which escape senescence more easily (Calado and Dumitriu, 2013). The establishment of a common network across all types of senescence could improve the consistency between experimental analysis, which would hopefully lead to more detailed and reproducible results. The database created in this work is hosted publicly online, with an easy to use public-interface to allow further analysis of these 119 combined datasets and expand on the details discussed here. Furthering our understanding of the intricacies and differences in cellular senescence can only increase our chances of producing life-extending senotherapeutic technologies.
Data availability statement
The datasets presented in this study can be found in online repositories. The names of the repository/repositories and accession number(s) can be found in the article/Supplementary Material.
Author contributions
R-LS: Conceptualization, Formal analysis, Investigation, Methodology, Visualization, Writing–original draft, Writing–review and editing. LP: Conceptualization, Investigation, Methodology, Writing–review and editing. HO’K: Methodology, Writing–review and editing. AM-G: Formal analysis, Investigation, Methodology, Writing–review and editing. LR: Supervision, Writing–review and editing. JW: Conceptualization, Investigation, Methodology, Supervision, Writing–original draft, Writing–review and editing. DS: Conceptualization, Supervision, Writing–original draft, Writing–review and editing.
Funding
The author(s) declare that financial support was received for the research, authorship, and/or publication of this article. This work was funded by NC3Rs (NC/S001050/1) and Novo Nordisk Fonden Denmark (NNF17OC0027812).
Conflict of interest
The authors declare that the research was conducted in the absence of any commercial or financial relationships that could be construed as a potential conflict of interest.
Publisher’s note
All claims expressed in this article are solely those of the authors and do not necessarily represent those of their affiliated organizations, or those of the publisher, the editors and the reviewers. Any product that may be evaluated in this article, or claim that may be made by its manufacturer, is not guaranteed or endorsed by the publisher.
Supplementary material
The Supplementary Material for this article can be found online at: https://www.frontiersin.org/articles/10.3389/fragi.2024.1448543/full#supplementary-material
References
Aarts, M., Georgilis, A., Beniazza, M., Beolchi, P., Banito, A., Carroll, T., et al. (2017). Coupling shRNA screens with single-cell RNA-seq identifies a dual role for mTOR in reprogramming-induced senescence. Genes. Dev. 31 (20), 2085–2098. doi:10.1101/gad.297796.117
Acosta, J. C., Banito, A., Wuestefeld, T., Georgilis, A., Janich, P., Morton, J. P., et al. (2013). A complex secretory program orchestrated by the inflammasome controls paracrine senescence. Nat. Cell. Biol. 15 (8), 978–990. doi:10.1038/ncb2784
Admasu, T. D., Rae, M., and Stolzing, A. (2021). Dissecting primary and secondary senescence to enable new senotherapeutic strategies. Ageing Res. Rev. 70, 101412. doi:10.1016/j.arr.2021.101412
Ahn, J. Y., Schwarz, J. K., Piwnica-Worms, H., and Canman, C. E. (2000). Threonine 68 phosphorylation by ataxia telangiectasia mutated is required for efficient activation of Chk2 in response to ionizing radiation. Cancer Res. 60 (21), 5934–5936.
Aksoy, O., Chicas, A., Zeng, T., Zhao, Z., McCurrach, M., Wang, X., et al. (2012). The atypical E2F family member E2F7 couples the p53 and RB pathways during cellular senescence. Genes. Dev. 26 (14), 1546–1557. doi:10.1101/gad.196238.112
Alcorta, D. A., Xiong, Y., Phelps, D., Hannon, G., Beach, D., and Barrett, J. C. (1996). Involvement of the cyclin-dependent kinase inhibitor p16 (INK4a) in replicative senescence of normal human fibroblasts. Proc. Natl. Acad. Sci. U. S. A. 93 (24), 13742–13747. doi:10.1073/pnas.93.24.13742
Alimonti, A., Nardella, C., Chen, Z., Clohessy, J. G., Carracedo, A., Trotman, L. C., et al. (2010). A novel type of cellular senescence that can be enhanced in mouse models and human tumor xenografts to suppress prostate tumorigenesis. J. Clin. Investig. 120 (3), 681–693. doi:10.1172/jci40535
Alspach, E., Flanagan, K. C., Luo, X., Ruhland, M. K., Huang, H., Pazolli, E., et al. (2014). p38MAPK plays a crucial role in stromal-mediated tumorigenesis. Cancer Discov. 4 (6), 716–729. doi:10.1158/2159-8290.Cd-13-0743
An, Y., Zhu, J., Wang, X., Sun, X., Luo, C., Zhang, Y., et al. (2022). Oridonin delays aging through the AKT signaling pathway. Front. Pharmacol. 13, 888247. doi:10.3389/fphar.2022.888247
Anerillas, C., Herman, A. B., Munk, R., Garrido, A., Lam, K. G., Payea, M. J., et al. (2022a). A BDNF-TrkB autocrine loop enhances senescent cell viability. Nat. Commun. 13 (1), 6228. doi:10.1038/s41467-022-33709-8
Anerillas, C., Herman, A. B., Rossi, M., Munk, R., Lehrmann, E., Martindale, J. L., et al. (2022b). Early SRC activation skews cell fate from apoptosis to senescence. Sci. Adv. 8 (14), eabm0756. doi:10.1126/sciadv.abm0756
Anerillas, C., Mazan-Mamczarz, K., Herman, A. B., Munk, R., Lam, K. G., Calvo-Rubio, M., et al. (2023). The YAP-TEAD complex promotes senescent cell survival by lowering endoplasmic reticulum stress. Nat. Aging 3 (10), 1237–1250. doi:10.1038/s43587-023-00480-4
Avelar, R. A., Ortega, J. G., Tacutu, R., Tyler, E. J., Bennett, D., Binetti, P., et al. (2020). A multidimensional systems biology analysis of cellular senescence in aging and disease. Genome Biol. 21 (1), 91. doi:10.1186/s13059-020-01990-9
Baar, M. P., Brandt, R. M. C., Putavet, D. A., Klein, J. D. D., Derks, K. W. J., Bourgeois, B. R. M., et al. (2017). Targeted apoptosis of senescent cells restores tissue homeostasis in response to chemotoxicity and aging. Cell. 169 (1), 132–147. doi:10.1016/j.cell.2017.02.031
Baker, D. J., Childs, B. G., Durik, M., Wijers, M. E., Sieben, C. J., Zhong, J., et al. (2016). Naturally occurring p16(Ink4a)-positive cells shorten healthy lifespan. Nature 530 (7589), 184–189. doi:10.1038/nature16932
Baker, D. J., Wijshake, T., Tchkonia, T., LeBrasseur, N. K., Childs, B. G., van de Sluis, B., et al. (2011). Clearance of p16Ink4a-positive senescent cells delays ageing-associated disorders. Nature 479 (7372), 232–236. doi:10.1038/nature10600
Barak, Y., Juven, T., Haffner, R., and Oren, M. (1993). mdm2 expression is induced by wild type p53 activity. Embo J. 12 (2), 461–468. doi:10.1002/j.1460-2075.1993.tb05678.x
Barnes, R. P., de Rosa, M., Thosar, S. A., Detwiler, A. C., Roginskaya, V., Van Houten, B., et al. (2022). Telomeric 8-oxo-guanine drives rapid premature senescence in the absence of telomere shortening. Nat. Struct. Mol. Biol. 29 (7), 639–652. doi:10.1038/s41594-022-00790-y
Bartkova, J., Rezaei, N., Liontos, M., Karakaidos, P., Kletsas, D., Issaeva, N., et al. (2006). Oncogene-induced senescence is part of the tumorigenesis barrier imposed by DNA damage checkpoints. Nature 444 (7119), 633–637. doi:10.1038/nature05268
Basisty, N., Kale, A., Jeon, O. H., Kuehnemann, C., Payne, T., Rao, C., et al. (2020). A proteomic atlas of senescence-associated secretomes for aging biomarker development. PLoS Biol. 18 (1), e3000599. doi:10.1371/journal.pbio.3000599
Bauer, D. (1972). Constructing confidence sets using rank statistics. J. Am. Stat. Assoc. 67 (339), 687–690. doi:10.1080/01621459.1972.10481279
Beauséjour, C. M., Krtolica, A., Galimi, F., Narita, M., Lowe, S. W., Yaswen, P., et al. (2003). Reversal of human cellular senescence: roles of the p53 and p16 pathways. Embo J. 22 (16), 4212–4222. doi:10.1093/emboj/cdg417
Benhamed, M., Herbig, U., Ye, T., Dejean, A., and Bischof, O. (2012). Senescence is an endogenous trigger for microRNA-directed transcriptional gene silencing in human cells. Nat. Cell. Biol. 14 (3), 266–275. doi:10.1038/ncb2443
Bodnar, A. G., Ouellette, M., Frolkis, M., Holt, S. E., Chiu, C. P., Morin, G. B., et al. (1998). Extension of life-span by introduction of telomerase into normal human cells. Science 279 (5349), 349–352. doi:10.1126/science.279.5349.349
Borghesan, M., Fafián-Labora, J., Eleftheriadou, O., Carpintero-Fernández, P., Paez-Ribes, M., Vizcay-Barrena, G., et al. (2019). Small extracellular vesicles are key regulators of non-cell autonomous intercellular communication in senescence via the interferon protein IFITM3. Cell. Rep. 27 (13), 3956–3971. doi:10.1016/j.celrep.2019.05.095
Bracken, A. P., Kleine-Kohlbrecher, D., Dietrich, N., Pasini, D., Gargiulo, G., Beekman, C., et al. (2007). The Polycomb group proteins bind throughout the INK4A-ARF locus and are disassociated in senescent cells. Genes. Dev. 21 (5), 525–530. doi:10.1101/gad.415507
Bray, S. J. (2006). Notch signalling: a simple pathway becomes complex. Nat. Rev. Mol. Cell. Biol. 7 (9), 678–689. doi:10.1038/nrm2009
Buj, R., Chen, C. W., Dahl, E. S., Leon, K. E., Kuskovsky, R., Maglakelidze, N., et al. (2019). Suppression of p16 induces mTORC1-mediated nucleotide metabolic reprogramming. Cell. Rep. 28 (8), 1971–1980. doi:10.1016/j.celrep.2019.07.084
Bulavin, D. V., Kovalsky, O., Hollander, M. C., and Fornace, A. J. (2003). Loss of oncogenic H-ras-induced cell cycle arrest and p38 mitogen-activated protein kinase activation by disruption of Gadd45a. Mol. Cell. Biol. 23 (11), 3859–3871. doi:10.1128/MCB.23.11.3859-3871.2003
Calado, R. T., and Dumitriu, B. (2013). Telomere dynamics in mice and humans. Semin. Hematol. 50 (2), 165–174. doi:10.1053/j.seminhematol.2013.03.030
Carvalho, C., L'Hôte, V., Courbeyrette, R., Kratassiouk, G., Pinna, G., Cintrat, J. C., et al. (2019). Glucocorticoids delay RAF-induced senescence promoted by EGR1. J. Cell. Sci. 132 (16), jcs230748. doi:10.1242/jcs.230748
Casella, G., Munk, R., Kim, K. M., Piao, Y., De, S., Abdelmohsen, K., et al. (2019). Transcriptome signature of cellular senescence. Nucleic Acids Res. 47 (21), 11476. doi:10.1093/nar/gkz879
Chan, K. T., Blake, S., Zhu, H., Kang, J., Trigos, A. S., Madhamshettiwar, P. B., et al. (2020). A functional genetic screen defines the AKT-induced senescence signaling network. Cell. Death Differ. 27 (2), 725–741. doi:10.1038/s41418-019-0384-8
Chan, M., Yuan, H., Soifer, I., Maile, T. M., Wang, R. Y., Ireland, A., et al. (2022). Novel insights from a multiomics dissection of the Hayflick limit. Elife 11, e70283. doi:10.7554/eLife.70283
Chan, T. S., Hsu, C. C., Pai, V. C., Liao, W. Y., Huang, S. S., Tan, K. T., et al. (2016). Metronomic chemotherapy prevents therapy-induced stromal activation and induction of tumor-initiating cells. J. Exp. Med. 213 (13), 2967–2988. doi:10.1084/jem.20151665
Chehab, N. H., Malikzay, A., Appel, M., and Halazonetis, T. D. (2000). Chk2/hCds1 functions as a DNA damage checkpoint in G(1) by stabilizing p53. Genes. Dev. 14 (3), 278–288. doi:10.1101/gad.14.3.278
Chen, G., Hitomi, M., Han, J., and Stacey, D. W. (2000). The p38 pathway provides negative feedback for Ras proliferative signaling. J. Biol. Chem. 275 (50), 38973–38980. doi:10.1074/jbc.M002856200
Chicas, A., Wang, X., Zhang, C., McCurrach, M., Zhao, Z., Mert, O., et al. (2010). Dissecting the unique role of the retinoblastoma tumor suppressor during cellular senescence. Cancer Cell. 17 (4), 376–387. doi:10.1016/j.ccr.2010.01.023
Chien, Y., Scuoppo, C., Wang, X., Fang, X., Balgley, B., Bolden, J. E., et al. (2011). Control of the senescence-associated secretory phenotype by NF-κB promotes senescence and enhances chemosensitivity. Genes. Dev. 25 (20), 2125–2136. doi:10.1101/gad.17276711
Childs, B. G., Durik, M., Baker, D. J., and van Deursen, J. M. (2015). Cellular senescence in aging and age-related disease: from mechanisms to therapy. Nat. Med. 21 (12), 1424–1435. doi:10.1038/nm.4000
Cho, H. J., Hwang, J. A., Yang, E. J., Kim, E. C., Kim, J. R., Kim, S. Y., et al. (2022). Nintedanib induces senolytic effect via STAT3 inhibition. Cell. Death Dis. 13 (9), 760. doi:10.1038/s41419-022-05207-8
Choi, K., Medley, J. K., König, M., Stocking, K., Smith, L., Gu, S., et al. (2018). Tellurium: an extensible python-based modeling environment for systems and synthetic biology. Biosystems 171, 74–79. doi:10.1016/j.biosystems.2018.07.006
Collado, M., Gil, J., Efeyan, A., Guerra, C., Schuhmacher, A. J., Barradas, M., et al. (2005). Tumour biology: senescence in premalignant tumours. Nature 436 (7051), 642. doi:10.1038/436642a
Contrepois, K., Coudereau, C., Benayoun, B. A., Schuler, N., Roux, P.-F., Bischof, O., et al. (2017). Histone variant H2A.J accumulates in senescent cells and promotes inflammatory gene expression. Nat. Commun. 8 (1), 14995. doi:10.1038/ncomms14995
Coppé, J. P., Desprez, P. Y., Krtolica, A., and Campisi, J. (2010). The senescence-associated secretory phenotype: the dark side of tumor suppression. Annu. Rev. Pathol. 5, 99–118. doi:10.1146/annurev-pathol-121808-102144
Coppé, J. P., Patil, C. K., Rodier, F., Sun, Y., Muñoz, D. P., Goldstein, J., et al. (2008). Senescence-associated secretory phenotypes reveal cell-nonautonomous functions of oncogenic RAS and the p53 tumor suppressor. PLoS Biol. 6 (12), 2853–2868. doi:10.1371/journal.pbio.0060301
Correia-Melo, C., Marques, F. D., Anderson, R., Hewitt, G., Hewitt, R., Cole, J., et al. (2016). Mitochondria are required for pro-ageing features of the senescent phenotype. EMBO J. 35 (7), 724–742. doi:10.15252/embj.201592862
Criscione, S. W., De Cecco, M., Siranosian, B., Zhang, Y., Kreiling, J. A., Sedivy, J. M., et al. (2016). Reorganization of chromosome architecture in replicative cellular senescence. Sci. Adv. 2 (2), e1500882. doi:10.1126/sciadv.1500882
Davis, S., and Meltzer, P. S. (2007). GEOquery: a bridge between the gene expression Omnibus (GEO) and BioConductor. Bioinformatics 23 (14), 1846–1847. doi:10.1093/bioinformatics/btm254
Debès, C., Papadakis, A., Grönke, S., Karalay, Ö., Tain, L. S., Mizi, A., et al. (2023). Ageing-associated changes in transcriptional elongation influence longevity. Nature 616 (7958), 814–821. doi:10.1038/s41586-023-05922-y
De Cecco, M., Ito, T., Petrashen, A. P., Elias, A. E., Skvir, N. J., Criscione, S. W., et al. (2019). L1 drives IFN in senescent cells and promotes age-associated inflammation. Nature 566 (7742), 73–78. doi:10.1038/s41586-018-0784-9
Demidenko, Z. N., and Blagosklonny, M. V. (2008). Growth stimulation leads to cellular senescence when the cell cycle is blocked. Cell. Cycle 7 (21), 3355–3361. doi:10.4161/cc.7.21.6919
de Sena Brandine, G., and Smith, A. D. (2019). Falco: high-speed FastQC emulation for quality control of sequencing data. F1000Res 8, 1874. doi:10.12688/f1000research.21142.2
Dikovskaya, D., Cole, J. J., Mason, S. M., Nixon, C., Karim, S. A., McGarry, L., et al. (2015). Mitotic stress is an integral part of the oncogene-induced senescence program that promotes multinucleation and cell cycle arrest. Cell. Rep. 12 (9), 1483–1496. doi:10.1016/j.celrep.2015.07.055
Di Micco, R., Fumagalli, M., Cicalese, A., Piccinin, S., Gasparini, P., Luise, C., et al. (2006). Oncogene-induced senescence is a DNA damage response triggered by DNA hyper-replication. Nature 444 (7119), 638–642. doi:10.1038/nature05327
Dou, Z., Ghosh, K., Vizioli, M. G., Zhu, J., Sen, P., Wangensteen, K. J., et al. (2017). Cytoplasmic chromatin triggers inflammation in senescence and cancer. Nature 550 (7676), 402–406. doi:10.1038/nature24050
Edgar, R., Domrachev, M., and Lash, A. E. (2002). Gene Expression Omnibus: NCBI gene expression and hybridization array data repository. Nucleic Acids Res. 30 (1), 207–210. doi:10.1093/nar/30.1.207
Ewels, P., Magnusson, M., Lundin, S., and Käller, M. (2016). MultiQC: summarize analysis results for multiple tools and samples in a single report. Bioinformatics 32 (19), 3047–3048. doi:10.1093/bioinformatics/btw354
Falck, J., Mailand, N., Syljuåsen, R. G., Bartek, J., and Lukas, J. (2001). The ATM-Chk2-Cdc25A checkpoint pathway guards against radioresistant DNA synthesis. Nature 410 (6830), 842–847. doi:10.1038/35071124
Fielder, E., von Zglinicki, T., and Jurk, D. (2017). The DNA damage response in neurons: die by apoptosis or survive in a senescence-like state? J. Alzheimers Dis. 60 (s1), S107-S131–S131. doi:10.3233/JAD-161221
Freund, A., Patil, C. K., and Campisi, J. (2011). p38MAPK is a novel DNA damage response-independent regulator of the senescence-associated secretory phenotype. EMBO J., 30(8), 1536–1548. doi:10.1038/emboj.2011.69
Fullard, N., Wordsworth, J., Welsh, C., Maltman, V., Bascom, C., Tasseff, R., et al. (2024). Cell senescence-independent changes of human skin fibroblasts with age. Cells 13 (8), 659. doi:10.3390/cells13080659
Funahashi, A., Matsuoka, Y., Jouraku, A., Morohashi, M., Kikuchi, N., and Kitano, H. (2008). CellDesigner 3.5: a versatile modeling tool for biochemical networks. Proc. IEEE 96 (8), 1254–1265. doi:10.1109/JPROC.2008.925458
Gautier, L., Cope, L., Bolstad, B. M., and Irizarry, R. A. (2004). affy--analysis of Affymetrix GeneChip data at the probe level. Bioinformatics 20 (3), 307–315. doi:10.1093/bioinformatics/btg405
Georgilis, A., Klotz, S., Hanley, C. J., Herranz, N., Weirich, B., Morancho, B., et al. (2018). PTBP1-Mediated alternative splicing regulates the inflammatory secretome and the pro-tumorigenic effects of senescent cells. Cancer Cell. 34 (1), 85–102. doi:10.1016/j.ccell.2018.06.007
Gonçalves, S., Yin, K., Ito, Y., Chan, A., Olan, I., Gough, S., et al. (2021). COX2 regulates senescence secretome composition and senescence surveillance through PGE. Cell. Rep. 34 (11), 108860. doi:10.1016/j.celrep.2021.108860
Gonzales, M. M., Garbarino, V. R., Kautz, T. F., Palavicini, J. P., Lopez-Cruzan, M., Dehkordi, S. K., et al. (2023). Senolytic therapy in mild Alzheimer's disease: a phase 1 feasibility trial. Nat. Med. 29 (10), 2481–2488. doi:10.1038/s41591-023-02543-w
González-Gualda, E., Baker, A. G., Fruk, L., and Muñoz-Espín, D. (2021). A guide to assessing cellular senescence in vitro and in vivo. FEBS J. 288 (1), 56–80. doi:10.1111/febs.15570
Guerrero, A., Herranz, N., Sun, B., Wagner, V., Gallage, S., Guiho, R., et al. (2019). Cardiac glycosides are broad-spectrum senolytics. Nat. Metab. 1 (11), 1074–1088. doi:10.1038/s42255-019-0122-z
Guerrero, A., Innes, A. J., Roux, P. F., Buisman, S. C., Jung, J., Ortet, L., et al. (2022). 3-deazaadenosine (3DA) alleviates senescence to promote cellular fitness and cell therapy efficiency in mice. Nat. Aging 2, 851–866. doi:10.1038/s43587-022-00279-9
Gulen, M. F., Samson, N., Keller, A., Schwabenland, M., Liu, C., Glück, S., et al. (2023). cGAS-STING drives ageing-related inflammation and neurodegeneration. Nature 620 (7973), 374–380. doi:10.1038/s41586-023-06373-1
Hari, P., Millar, F. R., Tarrats, N., Birch, J., Quintanilla, A., Rink, C. J., et al. (2019). The innate immune sensor Toll-like receptor 2 controls the senescence-associated secretory phenotype. Sci. Adv. 5 (6), eaaw0254. doi:10.1126/sciadv.aaw0254
Hasegawa, T., Oka, T., Son, H. G., Oliver-García, V. S., Azin, M., Eisenhaure, T. M., et al. (2023). Cytotoxic CD4+ T cells eliminate senescent cells by targeting cytomegalovirus antigen. Cell. 186 (7), 1417–1431.e20. doi:10.1016/j.cell.2023.02.033
He, S., and Sharpless, N. E. (2017). Senescence in health and disease. Cell. 169 (6), 1000–1011. doi:10.1016/j.cell.2017.05.015
Hernandez-Segura, A., de Jong, T. V., Melov, S., Guryev, V., Campisi, J., and Demaria, M. (2017). Unmasking transcriptional heterogeneity in senescent cells. Curr. Biol. 27 (17), 2652–2660. doi:10.1016/j.cub.2017.07.033
Herranz, N., Gallage, S., Mellone, M., Wuestefeld, T., Klotz, S., Hanley, C. J., et al. (2015). mTOR regulates MAPKAPK2 translation to control the senescence-associated secretory phenotype. Nat. Cell. Biol. 17 (9), 1205–1217. doi:10.1038/ncb3225
Hickson, L. J., Langhi Prata, L. G. P., Bobart, S. A., Evans, T. K., Giorgadze, N., Hashmi, S. K., et al. (2020). Corrigendum to Senolytics decrease senescent cells in humans: preliminary report from a clinical trial of Dasatinib plus Quercetin in individuals with diabetic kidney disease. EBioMedicine 47, 446–456. doi:10.1016/j.ebiom.2019.12.004
Hickson, L. J., Langhi Prata, L. G. P., Bobart, S. A., Evans, T. K., Giorgadze, N., Hashmi, S. K., et al. (2019). Senolytics decrease senescent cells in humans: preliminary report from a clinical trial of Dasatinib plus Quercetin in individuals with diabetic kidney disease. EBioMedicine 47, 446–456. doi:10.1016/j.ebiom.2019.08.069
Hoare, M., Ito, Y., Kang, T. W., Weekes, M. P., Matheson, N. J., Patten, D. A., et al. (2016). NOTCH1 mediates a switch between two distinct secretome during senescence. Nat. Cell. Biol. 18 (9), 979–992. doi:10.1038/ncb3397
Hoffmann, A., and Baltimore, D. (2006). Circuitry of nuclear factor kappaB signaling. Immunol. Rev. 210, 171–186. doi:10.1111/j.0105-2896.2006.00375.x
Hunziker, A., Jensen, M. H., and Krishna, S. (2010). Stress-specific response of the p53-Mdm2 feedback loop. BMC Syst. Biol. 4, 94. doi:10.1186/1752-0509-4-94
Innes, A. J., Sun, B., Wagner, V., Brookes, S., McHugh, D., Pombo, J., et al. (2021). XPO7 is a tumor suppressor regulating p21CIP1-dependent senescence. Genes. Dev. 35 (5-6), 379–391. doi:10.1101/gad.343269.120
Ito, K., Hirao, A., Arai, F., Takubo, K., Matsuoka, S., Miyamoto, K., et al. (2006). Reactive oxygen species act through p38 MAPK to limit the lifespan of hematopoietic stem cells. Nat. Med. 12 (4), 446–451. doi:10.1038/nm1388
Ito, Y., Hoare, M., and Narita, M. (2017). Spatial and temporal control of senescence. Trends Cell. Biol. 27 (11), 820–832. doi:10.1016/j.tcb.2017.07.004
Iwasa, H., Han, J., and Ishikawa, F. (2003). Mitogen-activated protein kinase p38 defines the common senescence-signalling pathway. Genes. cells. 8 (2), 131–144. doi:10.1046/j.1365-2443.2003.00620.x
Jacobsen, A., Wen, J., Marks, D. S., and Krogh, A. (2010). Signatures of RNA binding proteins globally coupled to effective microRNA target sites. Genome Res. 20 (8), 1010–1019. doi:10.1101/gr.103259.109
Jazayeri, A., Falck, J., Lukas, C., Bartek, J., Smith, G. C., Lukas, J., et al. (2006). ATM- and cell cycle-dependent regulation of ATR in response to DNA double-strand breaks. Nat. Cell. Biol. 8 (1), 37–45. doi:10.1038/ncb1337
Johmura, Y., Shimada, M., Misaki, T., Naiki-Ito, A., Miyoshi, H., Motoyama, N., et al. (2014). Necessary and sufficient role for a mitosis skip in senescence induction. Mol. Cell. 55 (1), 73–84. doi:10.1016/j.molcel.2014.05.003
Jung, S. H., Hwang, H. J., Kang, D., Park, H. A., Lee, H. C., Jeong, D., et al. (2019). mTOR kinase leads to PTEN-loss-induced cellular senescence by phosphorylating p53. Oncogene 38 (10), 1639–1650. doi:10.1038/s41388-018-0521-8
Justice, J. N., Nambiar, A. M., Tchkonia, T., LeBrasseur, N. K., Pascual, R., Hashmi, S. K., et al. (2019). Senolytics in idiopathic pulmonary fibrosis: results from a first-in-human, open-label, pilot study. EBioMedicine 40, 554–563. doi:10.1016/j.ebiom.2018.12.052
Kastan, M. B., Zhan, Q., el-Deiry, W. S., Carrier, F., Jacks, T., Walsh, W. V., et al. (1992). A mammalian cell cycle checkpoint pathway utilizing p53 and GADD45 is defective in ataxia-telangiectasia. Cell. 71 (4), 587–597. doi:10.1016/0092-8674(92)90593-2
Kennedy, A. L., Morton, J. P., Manoharan, I., Nelson, D. M., Jamieson, N. B., Pawlikowski, J. S., et al. (2011). Activation of the PIK3CA/AKT pathway suppresses senescence induced by an activated RAS oncogene to promote tumorigenesis. Mol. Cell. 42 (1), 36–49. doi:10.1016/j.molcel.2011.02.020
Kim, E. C., and Kim, J. R. (2019). Senotherapeutics: emerging strategy for healthy aging and age-related disease. BMB Rep. 52 (1), 47–55. doi:10.5483/BMBRep.2019.52.1.293
Kirschner, K., Samarajiwa, S. A., Cairns, J. M., Menon, S., Pérez-Mancera, P. A., Tomimatsu, K., et al. (2015). Phenotype specific analyses reveal distinct regulatory mechanism for chronically activated p53. PLoS Genet. 11 (3), e1005053. doi:10.1371/journal.pgen.1005053
Kopan, R., and Ilagan, M. X. (2009). The canonical Notch signaling pathway: unfolding the activation mechanism. Cell. 137 (2), 216–233. doi:10.1016/j.cell.2009.03.045
Krizhanovsky, V., Xue, W., Zender, L., Yon, M., Hernando, E., and Lowe, S. W. (2008). Implications of cellular senescence in tissue damage response, tumor suppression, and stem cell biology. Cold Spring Harb. Symp. Quant. Biol. 73, 513–522. doi:10.1101/sqb.2008.73.048
Kuilman, T., and Peeper, D. S. (2009). Senescence-messaging secretome: SMS-ing cellular stress. Nat. Rev. Cancer 9 (2), 81–94. doi:10.1038/nrc2560
Kumari, R., Hummerich, H., Shen, X., Fischer, M., Litovchick, L., Mittnacht, S., et al. (2021). Simultaneous expression of MMB-FOXM1 complex components enables efficient bypass of senescence. Sci. Rep. 11 (1), 21506. doi:10.1038/s41598-021-01012-z
Kumari, R., and Jat, P. (2021). Mechanisms of cellular senescence: cell cycle arrest and senescence associated secretory phenotype. Front. Cell. Dev. Biol. 9, 645593. doi:10.3389/fcell.2021.645593
Kwong, J., Hong, L., Liao, R., Deng, Q., Han, J., and Sun, P. (2009). p38alpha and p38gamma mediate oncogenic ras-induced senescence through differential mechanisms. J. Biol. Chem. 284 (17), 11237–11246. doi:10.1074/jbc.M808327200
Lackner, D. H., Hayashi, M. T., Cesare, A. J., and Karlseder, J. (2014). A genomics approach identifies senescence-specific gene expression regulation. Aging Cell., 13(5), 946–950. doi:10.1111/acel.12234
Lämmermann, I., Terlecki-Zaniewicz, L., Weinmüllner, R., Schosserer, M., Dellago, H., de Matos Branco, A. D., et al. (2018). Blocking negative effects of senescence in human skin fibroblasts with a plant extract. NPJ Aging Mech. Dis. 4, 4. doi:10.1038/s41514-018-0023-5
Lau, L., Porciuncula, A., Yu, A., Iwakura, Y., and David, G. (2019). Uncoupling the senescence-associated secretory phenotype from cell cycle exit via interleukin-1 inactivation unveils its protumorigenic role. Mol. Cell. Biol. 39 (12), doi:10.1128/MCB.00586-18
Lee, J., Basak, J. M., Demehri, S., and Kopan, R. (2007). Bi-compartmental communication contributes to the opposite proliferative behavior of Notch1-deficient hair follicle and epidermal keratinocytes. Development 134 (15), 2795–2806. doi:10.1242/dev.02868
Lee, Y., Kim, J., Kim, M. S., Kwon, Y., Shin, S., Yi, H., et al. (2021). Coordinate regulation of the senescent state by selective autophagy. Dev. Cell. 56 (10), 1512–1525.e7. doi:10.1016/j.devcel.2021.04.008
Lenain, C., de Graaf, C. A., Pagie, L., Visser, N. L., de Haas, M., de Vries, S. S., et al. (2017). Massive reshaping of genome-nuclear lamina interactions during oncogene-induced senescence. Genome Res. 27 (10), 1634–1644. doi:10.1101/gr.225763.117
Leon, K. E., Buj, R., Lesko, E., Dahl, E. S., Chen, C. W., Tangudu, N. K., et al. (2021). DOT1L modulates the senescence-associated secretory phenotype through epigenetic regulation of IL1A. J. Cell. Biol. 220 (8), e202008101. doi:10.1083/jcb.202008101
Liu, P., Li, F., Lin, J., Fukumoto, T., Nacarelli, T., Hao, X., et al. (2021). m6A-independent genome-wide METTL3 and METTL14 redistribution drives the senescence-associated secretory phenotype. Nat. Cell. Biol. 23 (4), 355–365. doi:10.1038/s41556-021-00656-3
Liu, X. L., Ding, J., and Meng, L. H. (2018). Oncogene-induced senescence: a double edged sword in cancer. Acta Pharmacol. Sin. 39 (10), 1553–1558. doi:10.1038/aps.2017.198
Lizardo, D. Y., Lin, Y. L., Gokcumen, O., and Atilla-Gokcumen, G. E. (2017). Regulation of lipids is central to replicative senescence. Mol. Biosyst. 13 (3), 498–509. doi:10.1039/c6mb00842a
Loayza-Puch, F., Drost, J., Rooijers, K., Lopes, R., Elkon, R., and Agami, R. (2013). p53 induces transcriptional and translational programs to suppress cell proliferation and growth. Genome Biol. 14 (4), R32. doi:10.1186/gb-2013-14-4-r32
López-Antona, I., Contreras-Jurado, C., Luque-Martín, L., Carpintero-Leyva, A., González-Méndez, P., and Palmero, I. (2022). Dynamic regulation of myofibroblast phenotype in cellular senescence. Aging Cell. 21 (4), e13580. doi:10.1111/acel.13580
Malkin, D. (1993). p53 and the Li-Fraumeni syndrome. Cancer Genet. Cytogenet 66 (2), 83–92. doi:10.1016/0165-4608(93)90233-c
Mallette, F. A., Gaumont-Leclerc, M. F., and Ferbeyre, G. (2007). The DNA damage signaling pathway is a critical mediator of oncogene-induced senescence. Genes. Dev. 21 (1), 43–48. doi:10.1101/gad.1487307
Mangelinck, A., Coudereau, C., Courbeyrette, R., Ourarhni, K., Hamiche, A., Redon, C., et al. (2020). The H2A.J histone variant contributes to Interferon-Stimulated Gene expression in senescence by its weak interaction with H1 and the derepression of repeated DNA sequences. bioRxiv. doi:10.1101/2020.10.29.361204
Marin, I., Boix, O., Garcia-Garijo, A., Sirois, I., Caballe, A., Zarzuela, E., et al. (2023). Cellular senescence is immunogenic and promotes antitumor immunity. Cancer Discov. 13 (2), 410–431. doi:10.1158/2159-8290.CD-22-0523
Marthandan, S., Baumgart, M., Priebe, S., Groth, M., Schaer, J., Kaether, C., et al. (2016a). Conserved senescence associated genes and pathways in primary human fibroblasts detected by RNA-seq. PLoS One 11 (5), e0154531. doi:10.1371/journal.pone.0154531
Marthandan, S., Menzel, U., Priebe, S., Groth, M., Guthke, R., Platzer, M., et al. (2016b). Conserved genes and pathways in primary human fibroblast strains undergoing replicative and radiation induced senescence. Biol. Res. 49 (1), 34. doi:10.1186/s40659-016-0095-2
Marthandan, S., Priebe, S., Groth, M., Guthke, R., Platzer, M., Hemmerich, P., et al. (2015). Hormetic effect of rotenone in primary human fibroblasts. Immun. Ageing 12, 11. doi:10.1186/s12979-015-0038-8
Marthandan, S., Priebe, S., Hemmerich, P., Klement, K., and Diekmann, S. (2014). Long-term quiescent fibroblast cells transit into senescence. PLoS One 9 (12), e115597. doi:10.1371/journal.pone.0115597
Martin, M. (2011). Cutadapt removes adapter sequences from high-throughput sequencing reads. EMBnet.J. 17 (1), 10. doi:10.14806/ej.17.1.200
Martínez-Zamudio, R. I., Roux, P. F., de Freitas, J. A. N. L., Robinson, L., Doré, G., Sun, B., et al. (2020). AP-1 imprints a reversible transcriptional programme of senescent cells. Nat. Cell. Biol. 22 (7), 842–855. doi:10.1038/s41556-020-0529-5
Martinez-Zubiaurre, I., Fenton, C. G., Taman, H., Pettersen, I., Hellevik, T., and Paulssen, R. H. (2013). Tumorigenic responses of cancer-associated stromal fibroblasts after ablative radiotherapy: a transcriptome-profiling study. J. Cancer Ther. 4 (1), 208–250. doi:10.4236/jct.2013.41031
McHugh, D., Sun, B., Gutierrez-Muñoz, C., Hernández-González, F., Mellone, M., Guiho, R., et al. (2023). COPI vesicle formation and N-myristoylation are targetable vulnerabilities of senescent cells. Nat. Cell. Biol. 25 (12), 1804–1820. doi:10.1038/s41556-023-01287-6
Mellone, M., Hanley, C. J., Thirdborough, S., Mellows, T., Garcia, E., Woo, J., et al. (2016). Induction of fibroblast senescence generates a non-fibrogenic myofibroblast phenotype that differentially impacts on cancer prognosis. Aging (Albany NY) 9 (1), 114–132. doi:10.18632/aging.101127
Michael, D., and Oren, M. (2003). The p53-Mdm2 module and the ubiquitin system. Semin. Cancer Biol. 13 (1), 49–58. doi:10.1016/s1044-579x(02)00099-8
Mijit, M., Caracciolo, V., Melillo, A., Amicarelli, F., and Giordano, A. (2020). Role of p53 in the regulation of cellular senescence. Biomolecules 10 (3), 420. doi:10.3390/biom10030420
Mitra, M., Johnson, E. L., Swamy, V. S., Nersesian, L. E., Corney, D. C., Robinson, D. G., et al. (2018). Alternative polyadenylation factors link cell cycle to migration. Genome Biol. 19 (1), 176. doi:10.1186/s13059-018-1551-9
Montes, M., Lubas, M., Arendrup, F. S., Mentz, B., Rohatgi, N., Tumas, S., et al. (2021). The long non-coding RNA MIR31HG regulates the senescence associated secretory phenotype. Nat. Commun. 12 (1), 2459. doi:10.1038/s41467-021-22746-4
Muniz, L., Deb, M. K., Aguirrebengoa, M., Lazorthes, S., Trouche, D., and Nicolas, E. (2017). Control of gene expression in senescence through transcriptional read-through of convergent protein-coding genes. Cell. Rep. 21 (9), 2433–2446. doi:10.1016/j.celrep.2017.11.006
Muñoz-Espín, D., and Serrano, M. (2014). Cellular senescence: from physiology to pathology. Nat. Rev. Mol. Cell. Biol. 15 (7), 482–496. doi:10.1038/nrm3823
Muto, J., Fukuda, S., Watanabe, K., Dai, X., Tsuda, T., Kiyoi, T., et al. (2023). Highly concentrated trehalose induces prohealing senescence-like state in fibroblasts via CDKN1A/p21. Commun. Biol. 6 (1), 13. doi:10.1038/s42003-022-04408-3
Mylonas, A., and O'Loghlen, A. (2022). Cellular senescence and ageing: mechanisms and interventions. Front. Aging 3, 866718. doi:10.3389/fragi.2022.866718
Nambiar, A., Kellogg, D., Justice, J., Goros, M., Gelfond, J., Pascual, R., et al. (2023). Senolytics dasatinib and quercetin in idiopathic pulmonary fibrosis: results of a phase I, single-blind, single-center, randomized, placebo-controlled pilot trial on feasibility and tolerability. EBioMedicine 90, 104481. doi:10.1016/j.ebiom.2023.104481
Narita, M., Young, A. R., Arakawa, S., Samarajiwa, S. A., Nakashima, T., Yoshida, S., et al. (2011). Spatial coupling of mTOR and autophagy augments secretory phenotypes. Science 332 (6032), 966–970. doi:10.1126/science.1205407
Nayeri Rad, A., Shams, G., Avelar, R. A., Morowvat, M. H., and Ghasemi, Y. (2022). Potential senotherapeutic candidates and their combinations derived from transcriptional connectivity and network measures. Inf. Med. Unlocked, 30. 100920. doi:10.1016/j.imu.2022.100920
Nelson, D. M., Jaber-Hijazi, F., Cole, J. J., Robertson, N. A., Pawlikowski, J. S., Norris, K. T., et al. (2016). Mapping H4K20me3 onto the chromatin landscape of senescent cells indicates a function in control of cell senescence and tumor suppression through preservation of genetic and epigenetic stability. Genome Biol. 17 (1), 158. doi:10.1186/s13059-016-1017-x
Nelson, D. M., McBryan, T., Jeyapalan, J. C., Sedivy, J. M., and Adams, P. D. (2014). A comparison of oncogene-induced senescence and replicative senescence: implications for tumor suppression and aging. Age (Dordr) 36 (3), 9637. doi:10.1007/s11357-014-9637-0
Nelson, G., Kucheryavenko, O., Wordsworth, J., and von Zglinicki, T. (2018). The senescent bystander effect is caused by ROS-activated NF-κB signalling. Mech. Ageing Dev. 170, 30–36. doi:10.1016/j.mad.2017.08.005
Neri, F., Basisty, N., Desprez, P. Y., Campisi, J., and Schilling, B. (2021). Quantitative proteomic analysis of the senescence-associated secretory phenotype by data-independent acquisition. Curr. Protoc. 1 (2), e32. doi:10.1002/cpz1.32
Neyret-Kahn, H., Benhamed, M., Ye, T., Le Gras, S., Cossec, J. C., Lapaquette, P., et al. (2013). Sumoylation at chromatin governs coordinated repression of a transcriptional program essential for cell growth and proliferation. Genome Res. 23 (10), 1563–1579. doi:10.1101/gr.154872.113
Niedernhofer, L. J., and Robbins, P. D. (2018). Senotherapeutics for healthy ageing. Nat. Rev. Drug Discov. 17 (5), 377. doi:10.1038/nrd.2018.44
Oeckinghaus, A., and Ghosh, S. (2009). The NF-kappaB family of transcription factors and its regulation. Cold Spring Harb. Perspect. Biol. 1 (4), a000034. doi:10.1101/cshperspect.a000034
Omer, A., Barrera, M. C., Moran, J. L., Lian, X. J., Di Marco, S., Beausejour, C., et al. (2020). G3BP1 controls the senescence-associated secretome and its impact on cancer progression. Nat. Commun. 11 (1), 4979. doi:10.1038/s41467-020-18734-9
Paluvai, H., Di Giorgio, E., and Brancolini, C. (2018). Unscheduled HDAC4 repressive activity in human fibroblasts triggers TP53-dependent senescence and favors cell transformation. Mol. Oncol. 12 (12), 2165–2181. doi:10.1002/1878-0261.12392
Pantazi, A., Quintanilla, A., Hari, P., Tarrats, N., Parasyraki, E., Dix, F. L., et al. (2019). Inhibition of the 60S ribosome biogenesis GTPase LSG1 causes endoplasmic reticular disruption and cellular senescence. Aging Cell. 18 (4), e12981. doi:10.1111/acel.12981
Papaspyropoulos, A., Hazapis, O., Altulea, A., Polyzou, A., Verginis, P., Evangelou, K., et al. (2023). Decoding of translation-regulating entities reveals heterogeneous translation deficiency patterns in cellular senescence. Aging Cell. 22 (9), e13893. doi:10.1111/acel.13893
Park, J. H., Ryu, S. J., Kim, B. J., Cho, H. J., Park, C. H., Choi, H. J. C., et al. (2021). Disruption of nucleocytoplasmic trafficking as a cellular senescence driver. Exp. Mol. Med. 53 (6), 1092–1108. doi:10.1038/s12276-021-00643-6
Parkinson, H., Kapushesky, M., Shojatalab, M., Abeygunawardena, N., Coulson, R., Farne, A., et al. (2007). ArrayExpress--a public database of microarray experiments and gene expression profiles. Nucleic Acids Res. 35 (Database issue), D747–D750. doi:10.1093/nar/gkl995
Parry, A. J., Hoare, M., Bihary, D., Hänsel-Hertsch, R., Smith, S., Tomimatsu, K., et al. (2018). NOTCH-mediated non-cell autonomous regulation of chromatin structure during senescence. Nat. Commun. 9 (1), 1840. doi:10.1038/s41467-018-04283-9
Patro, R., Duggal, G., Love, M. I., Irizarry, R. A., and Kingsford, C. (2017). Salmon provides fast and bias-aware quantification of transcript expression. Nat. Methods 14 (4), 417–419. doi:10.1038/nmeth.4197
Pazolli, E., Luo, X., Brehm, S., Carbery, K., Chung, J. J., Prior, J. L., et al. (2009). Senescent stromal-derived osteopontin promotes preneoplastic cell growth. Cancer Res. 69 (3), 1230–1239. doi:10.1158/0008-5472.Can-08-2970
Purcell, M., Kruger, A., and Tainsky, M. A. (2014). Gene expression profiling of replicative and induced senescence. Cell. Cycle 13 (24), 3927–3937. doi:10.4161/15384101.2014.973327
Raffaele, M., and Vinciguerra, M. (2022). The costs and benefits of senotherapeutics for human health. Lancet Healthy Longev. 3 (1), e67–e77. doi:10.1016/S2666-7568(21)00300-7
Rai, T. S., Cole, J. J., Nelson, D. M., Dikovskaya, D., Faller, W. J., Vizioli, M. G., et al. (2014). HIRA orchestrates a dynamic chromatin landscape in senescence and is required for suppression of neoplasia. Genes. Dev. 28 (24), 2712–2725. doi:10.1101/gad.247528.114
Rey-Millet, M., Pousse, M., Soithong, C., Ye, J., Mendez-Bermudez, A., and Gilson, E. (2023). Senescence-associated transcriptional derepression in subtelomeres is determined in a chromosome-end-specific manner. Aging Cell. 22 (5), e13804. doi:10.1111/acel.13804
Ritchie, M. E., Phipson, B., Wu, D., Hu, Y., Law, C. W., Shi, W., et al. (2015). Limma powers differential expression analyses for RNA-sequencing and microarray studies. Nucleic Acids Res. 43 (7), e47. doi:10.1093/nar/gkv007
Robles, S. J., and Adami, G. R. (1998). Agents that cause DNA double strand breaks lead to p16INK4a enrichment and the premature senescence of normal fibroblasts. Oncogene 16 (9), 1113–1123. doi:10.1038/sj.onc.1201862
Rossi, M., Anerillas, C., Idda, M. L., Munk, R., Shin, C. H., Donega, S., et al. (2023). Pleiotropic effects of BAFF on the senescence-associated secretome and growth arrest. Elife 12, e84238. doi:10.7554/eLife.84238
Rovillain, E., Mansfield, L., Caetano, C., Alvarez-Fernandez, M., Caballero, O. L., Medema, R. H., et al. (2011). Activation of nuclear factor-kappa B signalling promotes cellular senescence. Oncogene 30 (20), 2356–2366. doi:10.1038/onc.2010.611
Rufini, A., Tucci, P., Celardo, I., and Melino, G. (2013). Senescence and aging: the critical roles of p53. Oncogene 32 (43), 5129–5143. doi:10.1038/onc.2012.640
Sabath, N., Levy-Adam, F., Younis, A., Rozales, K., Meller, A., Hadar, S., et al. (2020). Cellular proteostasis decline in human senescence. Proc. Natl. Acad. Sci. U. S. A. 117 (50), 31902–31913. doi:10.1073/pnas.2018138117
Saccon, T. D., Nagpal, R., Yadav, H., Cavalcante, M. B., Nunes, A. D. C., Schneider, A., et al. (2021). Senolytic combination of dasatinib and quercetin alleviates intestinal senescence and inflammation and modulates the gut microbiome in aged mice. J. Gerontol. A Biol. Sci. Med. Sci. 76 (11), 1895–1905. doi:10.1093/gerona/glab002
Saint-Germain, E., Mignacca, L., Vernier, M., Bobbala, D., Ilangumaran, S., and Ferbeyre, G. (2017). SOCS1 regulates senescence and ferroptosis by modulating the expression of p53 target genes. Aging 9 (10), 2137–2162. doi:10.18632/aging.101306
Saul, D., Kosinsky, R. L., Atkinson, E. J., Doolittle, M. L., Zhang, X., LeBrasseur, N. K., et al. (2022). A new gene set identifies senescent cells and predicts senescence-associated pathways across tissues. Nat. Commun. 13 (1), 4827. doi:10.1038/s41467-022-32552-1
Schade, A. E., Fischer, M., and DeCaprio, J. A. (2019). RB, p130 and p107 differentially repress G1/S and G2/M genes after p53 activation. Nucleic Acids Res. 47 (21), 11197–11208. doi:10.1093/nar/gkz961
Sen, P., Lan, Y., Li, C. Y., Sidoli, S., Donahue, G., Dou, Z., et al. (2019). Histone acetyltransferase p300 induces de novo super-enhancers to drive cellular senescence. Mol. Cell. 73 (4), 684–698. doi:10.1016/j.molcel.2019.01.021
Shah, P. P., Donahue, G., Otte, G. L., Capell, B. C., Nelson, D. M., Cao, K., et al. (2013). Lamin B1 depletion in senescent cells triggers large-scale changes in gene expression and the chromatin landscape. Genes. Dev. 27 (16), 1787–1799. doi:10.1101/gad.223834.113
Skea, D., Fotis, C., Tsolakos, N., Pliaka, V., Verrou, K.-M., and Alexopoulos, L. (2023). Conserved transcriptomic signatures and protein markers in cellular senescence models. Res. Square. doi:10.21203/rs.3.rs-3110821/v1
Slater, L. (2014). PubMed PubReMiner. J. Can. Health Libr. Assoc./J. de l'Association des bibliothèques de la santé du Can. 33 (2), 106–107. doi:10.5596/c2012-014
Spallarossa, P., Altieri, P., Barisione, C., Passalacqua, M., Aloi, C., Fugazza, G., et al. (2010). p38 MAPK and JNK antagonistically control senescence and cytoplasmic p16INK4A expression in doxorubicin-treated endothelial progenitor cells. PLoS One 5 (12), e15583. doi:10.1371/journal.pone.0015583
Stein, G. H., Drullinger, L. F., Soulard, A., and Dulić, V. (1999). Differential roles for cyclin-dependent kinase inhibitors p21 and p16 in the mechanisms of senescence and differentiation in human fibroblasts. Mol. Cell. Biol. 19 (3), 2109–2117. doi:10.1128/mcb.19.3.2109
Sun, P., Yoshizuka, N., New, L., Moser, B. A., Li, Y., Liao, R., et al. (2007). PRAK is essential for ras-induced senescence and tumor suppression. Cell. 128 (2), 295–308. doi:10.1016/j.cell.2006.11.050
Sun, T., Yang, W., Liu, J., and Shen, P. (2011). Modeling the basal dynamics of p53 system. PLoS One 6 (11), e27882. doi:10.1371/journal.pone.0027882
Takebayashi, S., Tanaka, H., Hino, S., Nakatsu, Y., Igata, T., Sakamoto, A., et al. (2015). Retinoblastoma protein promotes oxidative phosphorylation through upregulation of glycolytic genes in oncogene-induced senescent cells. Aging Cell. 14 (4), 689–697. doi:10.1111/acel.12351
Tasdemir, N., Banito, A., Roe, J. S., Alonso-Curbelo, D., Camiolo, M., Tschaharganeh, D. F., et al. (2016). BRD4 connects enhancer remodeling to senescence immune surveillance. Cancer Discov. 6 (6), 612–629. doi:10.1158/2159-8290.Cd-16-0217
Teo, Y. V., Rattanavirotkul, N., Olova, N., Salzano, A., Quintanilla, A., Tarrats, N., et al. (2019). Notch signaling mediates secondary senescence. Cell. Rep. 27 (4), 997–1007. doi:10.1016/j.celrep.2019.03.104
Tordella, L., Khan, S., Hohmeyer, A., Banito, A., Klotz, S., Raguz, S., et al. (2016). SWI/SNF regulates a transcriptional program that induces senescence to prevent liver cancer. Genes. Dev. 30 (19), 2187–2198. doi:10.1101/gad.286112.116
van Deursen, J. M. (2014). The role of senescent cells in ageing. Nature 509 (7501), 439–446. doi:10.1038/nature13193
Victorelli, S., Salmonowicz, H., Chapman, J., Martini, H., Vizioli, M. G., Riley, J. S., et al. (2023). Apoptotic stress causes mtDNA release during senescence and drives the SASP. Nature 622 (7983), 627–636. doi:10.1038/s41586-023-06621-4
Vizioli, M. G., Liu, T., Miller, K. N., Robertson, N. A., Gilroy, K., Lagnado, A. B., et al. (2020). Mitochondria-to-nucleus retrograde signaling drives formation of cytoplasmic chromatin and inflammation in senescence. Genes. Dev. 34 (5-6), 428–445. doi:10.1101/gad.331272.119
Wakita, M., Takahashi, A., Sano, O., Loo, T. M., Imai, Y., Narukawa, M., et al. (2020). A BET family protein degrader provokes sonolysis by targeting NHEJ and autophagy in senescent cells. Nat. Commun. 11 (1), 1935. doi:10.1038/s41467-020-15719-6
Wang, T., Notta, F., Navab, R., Joseph, J., Ibrahimov, E., Xu, J., et al. (2017). Senescent carcinoma-associated fibroblasts upregulate IL8 to enhance prometastatic phenotypes. Mol. Cancer Res. 15 (1), 3–14. doi:10.1158/1541-7786.Mcr-16-0192
Wang, T. W., Johmura, Y., Suzuki, N., Omori, S., Migita, T., Yamaguchi, K., et al. (2022a). Blocking PD-L1-PD-1 improves senescence surveillance and ageing phenotypes. Nature 611 (7935), 358–364. doi:10.1038/s41586-022-05388-4
Wang, Y., Eapen, V., Kournoutis, A., Onorati, A., Li, X., Zhou, X., et al. (2022b). Nuclear autophagy interactome unveils WSTF as a constitutive nuclear inhibitor of inflammation. bioRxiv. doi:10.1101/2022.10.04.510822
Weichhart, T. (2018). mTOR as regulator of lifespan, aging, and cellular senescence: a mini-review. Gerontology 64 (2), 127–134. doi:10.1159/000484629
Wlaschek, M., Maity, P., Makrantonaki, E., and Scharffetter-Kochanek, K. (2021). Connective tissue and fibroblast senescence in skin aging. J. Investig. Dermatol 141 (4S), 985–992. doi:10.1016/j.jid.2020.11.010
Wolyniec, K., Wotton, S., Kilbey, A., Jenkins, A., Terry, A., Peters, G., et al. (2009). RUNX1 and its fusion oncoprotein derivative, RUNX1-ETO, induce senescence-like growth arrest independently of replicative stress. Oncogene 28 (27), 2502–2512. doi:10.1038/onc.2009.101
Wu, T., Hu, E., Xu, S., Chen, M., Guo, P., Dai, Z., et al. (2021). clusterProfiler 4.0: a universal enrichment tool for interpreting omics data. Innov. (Camb) 2 (3), 100141. doi:10.1016/j.xinn.2021.100141
Wynn, T. A., and Ramalingam, T. R. (2012). Mechanisms of fibrosis: therapeutic translation for fibrotic disease. Nat. Med. 18 (7), 1028–1040. doi:10.1038/nm.2807
Xiao, Z., Chen, Z., Gunasekera, A. H., Sowin, T. J., Rosenberg, S. H., Fesik, S., et al. (2003). Chk1 mediates S and G2 arrests through Cdc25A degradation in response to DNA-damaging agents. J. Biol. Chem. 278 (24), 21767–21773. doi:10.1074/jbc.M300229200
Xu, M., Pirtskhalava, T., Farr, J. N., Weigand, B. M., Palmer, A. K., Weivoda, M. M., et al. (2018). Senolytics improve physical function and increase lifespan in old age. Nat. Med. 24 (8), 1246–1256. doi:10.1038/s41591-018-0092-9
Xu, S., Cai, Y., and Wei, Y. (2014). mTOR signaling from cellular senescence to organismal aging. Aging Dis. 5 (4), 263–273. doi:10.14336/AD.2014.0500263
Yang, E. J., Park, J. H., Cho, H. J., Hwang, J. A., Woo, S. H., Park, C. H., et al. (2022). Co-inhibition of ATM and ROCK synergistically improves cell proliferation in replicative senescence by activating FOXM1 and E2F1. Commun. Biol. 5 (1), 702. doi:10.1038/s42003-022-03658-5
Yosef, R., Pilpel, N., Papismadov, N., Gal, H., Ovadya, Y., Vadai, E., et al. (2017). p21 maintains senescent cell viability under persistent DNA damage response by restraining JNK and caspase signaling. EMBO J. 36 (15), 2280–2295. doi:10.15252/embj.201695553
Young, A. R., Narita, M., Ferreira, M., Kirschner, K., Sadaie, M., Darot, J. F., et al. (2009). Autophagy mediates the mitotic senescence transition. Genes. Dev. 23 (7), 798–803. doi:10.1101/gad.519709
Yue, H., Brown, M., Knowles, J., Wang, H., Broomhead, D. S., and Kell, D. B. (2006). Insights into the behaviour of systems biology models from dynamic sensitivity and identifiability analysis: a case study of an NF-kappaB signalling pathway. Mol. Biosyst. 2 (12), 640–649. doi:10.1039/b609442b
Zhang, X., Liu, X., Du, Z., Wei, L., Fang, H., Dong, Q., et al. (2021). The loss of heterochromatin is associated with multiscale three-dimensional genome reorganization and aberrant transcription during cellular senescence. Genome Res. 31 (7), 1121–1135. doi:10.1101/gr.275235.121
Zhu, H., Chan, K. T., Huang, X., Cerra, C., Blake, S., Trigos, A. S., et al. (2022). Cystathionine-β-synthase is essential for AKT-induced senescence and suppresses the development of gastric cancers with PI3K/AKT activation. Elife 11, e71929. doi:10.7554/eLife.71929
Zhu, Y., Tchkonia, T., Pirtskhalava, T., Gower, A. C., Ding, H., Giorgadze, N., et al. (2015). The Achilles' heel of senescent cells: from transcriptome to senolytic drugs. Aging Cell. 14 (4), 644–658. doi:10.1111/acel.12344
Keywords: transcriptomic, big data, computational model, fibroblast, cellular senescence, temporal profile
Citation: Scanlan R-L, Pease L, O’Keefe H, Martinez-Guimera A, Rasmussen L, Wordsworth J and Shanley D (2024) Systematic transcriptomic analysis and temporal modelling of human fibroblast senescence. Front. Aging 5:1448543. doi: 10.3389/fragi.2024.1448543
Received: 13 June 2024; Accepted: 19 August 2024;
Published: 29 August 2024.
Edited by:
Mohamed El-Far, University of Montreal Hospital Centre (CRCHUM), CanadaReviewed by:
Rémi Fromentin, University of Montreal Hospital Centre (CRCHUM), CanadaMehrnoosh Doroudchi, Shiraz University of Medical Sciences, Iran
Copyright © 2024 Scanlan, Pease, O’Keefe, Martinez-Guimera, Rasmussen, Wordsworth and Shanley. This is an open-access article distributed under the terms of the Creative Commons Attribution License (CC BY). The use, distribution or reproduction in other forums is permitted, provided the original author(s) and the copyright owner(s) are credited and that the original publication in this journal is cited, in accordance with accepted academic practice. No use, distribution or reproduction is permitted which does not comply with these terms.
*Correspondence: J. Wordsworth, amFtZXMud29yZHN3b3J0aDJAbmV3Y2FzdGxlLmFjLnVr; D. Shanley, ZGFyeWwuc2hhbmxleUBuZXdjYXN0bGUuYWMudWs=