 Bilcag Akgun1
 Briseida E. Feliciano-Astacio2
 Kara L. Hamilton-Nelson1
 Kyle Scott1
 Joe Rivero1Larry D. Adams1Jose J. Sanchez1Glenies S. Valladares1Sergio Tejada1Parker L. Bussies1Concepcion Silva-Vergara1Vanessa C. Rodriguez1Pedro R. Mena1Katrina Celis1Patrice G. Whitehead1Michael Prough1Christina Kosanovic1
 Derek J. Van Booven1Michael A. Schmidt1
 Heriberto Acosta3
 Anthony J. Griswold1,4
 Clifton L. Dalgard5Katalina F. McInerney6
 Gary W. Beecham1,4
 Michael L. Cuccaro1,4
 Jeffery M. Vance1,4,6
 Margaret A. Pericak-Vance1,4,6†
 Farid Rajabli1,4*†
- 1John P. Hussman Institute for Human Genomics, University of Miami Miller School of Medicine, Miami, FL, United States
- 2Universidad Central del Caribe, Bayamón, PR, United States
- 3Clinica de la Memoria, San Juan, PR, United States
- 4Dr. John T. Macdonald Foundation Department of Human Genetics, University of Miami Miller School of Medicine, Miami, FL, United States
- 5Department of Anatomy, Physiology, and Genetics, Uniformed Services University of the Health Sciences, Bethesda, MD, United States
- 6Department of Neurology, University of Miami Miller School of Medicine, Miami, FL, United States
Introduction: Hispanic/Latino populations are underrepresented in Alzheimer Disease (AD) genetic studies. Puerto Ricans (PR), a three-way admixed (European, African, and Amerindian) population is the second-largest Hispanic group in the continental US. We aimed to conduct a genome-wide association study (GWAS) and comprehensive analyses to identify novel AD susceptibility loci and characterize known AD genetic risk loci in the PR population.
Materials and methods: Our study included Whole Genome Sequencing (WGS) and phenotype data from 648 PR individuals (345 AD, 303 cognitively unimpaired). We used a generalized linear-mixed model adjusting for sex, age, population substructure, and genetic relationship matrix. To infer local ancestry, we merged the dataset with the HGDP/1000G reference panel. Subsequently, we conducted univariate admixture mapping (AM) analysis.
Results: We identified suggestive signals within the SLC38A1 and SCN8A genes on chromosome 12q13. This region overlaps with an area of linkage of AD in previous studies (12q13) in independent data sets further supporting. Univariate African AM analysis identified one suggestive ancestral block (p = 7.2×10⁻⁶) located in the same region. The ancestry-aware approach showed that this region has both European and African ancestral backgrounds and both contributing to the risk in this region. We also replicated 11 different known AD loci -including APOE- identified in mostly European studies, which is likely due to the high European background of the PR population.
Conclusion: PR GWAS and AM analysis identified a suggestive AD risk locus on chromosome 12, which includes the SLC38A1 and SCN8A genes. Our findings demonstrate the importance of designing GWAS and ancestry-aware approaches and including underrepresented populations in genetic studies of AD.
1 Introduction
Alzheimer Disease (AD), the most common type of dementia in older adults worldwide, accounts for an estimated more than 60% of all dementia cases (Alzheimer’s Association, 2024). The prevalence of AD increases with age, affecting more than a third of individuals above the age of 85 (Borenstein and Mortimer, 2016). The etiology of AD is complex with a strong genetic predisposition (Gatz et al., 1997; Gatz et al., 2006). Genome-wide association studies (GWAS) have identified more than 75 loci associated with AD to date (Bellenguez et al., 2022). However, these studies have primarily focused on non-Hispanic White (NHW) populations (Mills and Rahal, 2019; Mills and Rahal, 2020). Research into AD genetics across diverse populations reveals a partial overlap of genetic risk and protective loci among different ancestral groups, while also showing differences in effect sizes and specific genetic variants associated with AD (Cukier et al., 2016; Farrer et al., 1997; Liu et al., 2009; Reitz et al., 2013). Including diverse populations in AD genetic studies is crucial for identifying ancestry-specific loci and generalizing risk and protective loci across ancestral populations (Reitz et al., 2023). Notably, Latino populations are among the least represented in AD genetic studies (Mills and Rahal, 2020), underscoring the necessity of extending AD genetic studies to these populations, particularly given their admixed ancestral makeup. This is essential for a more comprehensive understanding of the genetic architecture of AD and advancing the development of precision medicine.
The diverse and multicultural Puerto Rican (PR) population is the second largest Latino group in the continental US. The estimated AD prevalence among PRs is 12.5%, which is higher compared to the general US population (10.1%) (Feliciano-Astacio et al., 2019). The PR population is three-way admixed with an average of 69% of European (EU), 17% African (AF) and 14% Amerindian (AI) ancestral backgrounds (Feliciano-Astacio et al., 2019). The admixed background in the PR population facilitates the discovery of novel AD loci and allows for the assessment of heterogeneity in the effects of known AD loci across EU, AF and AI ancestral backgrounds. However, genetic studies on PRs for AD have been limited so far.
To address these issues, we performed GWAS, ancestry-aware approaches, and comprehensive analyses to identify novel AD susceptibility loci and characterize known AD genetic risk loci and regions in PR individuals enrolled in AD genetic studies.
2 Materials and methods
2.1 Study participants
The participants were ascertained from seven different regions of Puerto Rico (94%) (Figure 1), and from the continental United States (6%) (Florida, New York, Connecticut, and North Carolina). All ascertainment was coordinated by the University of Miami and the Universidad Central del Caribe.
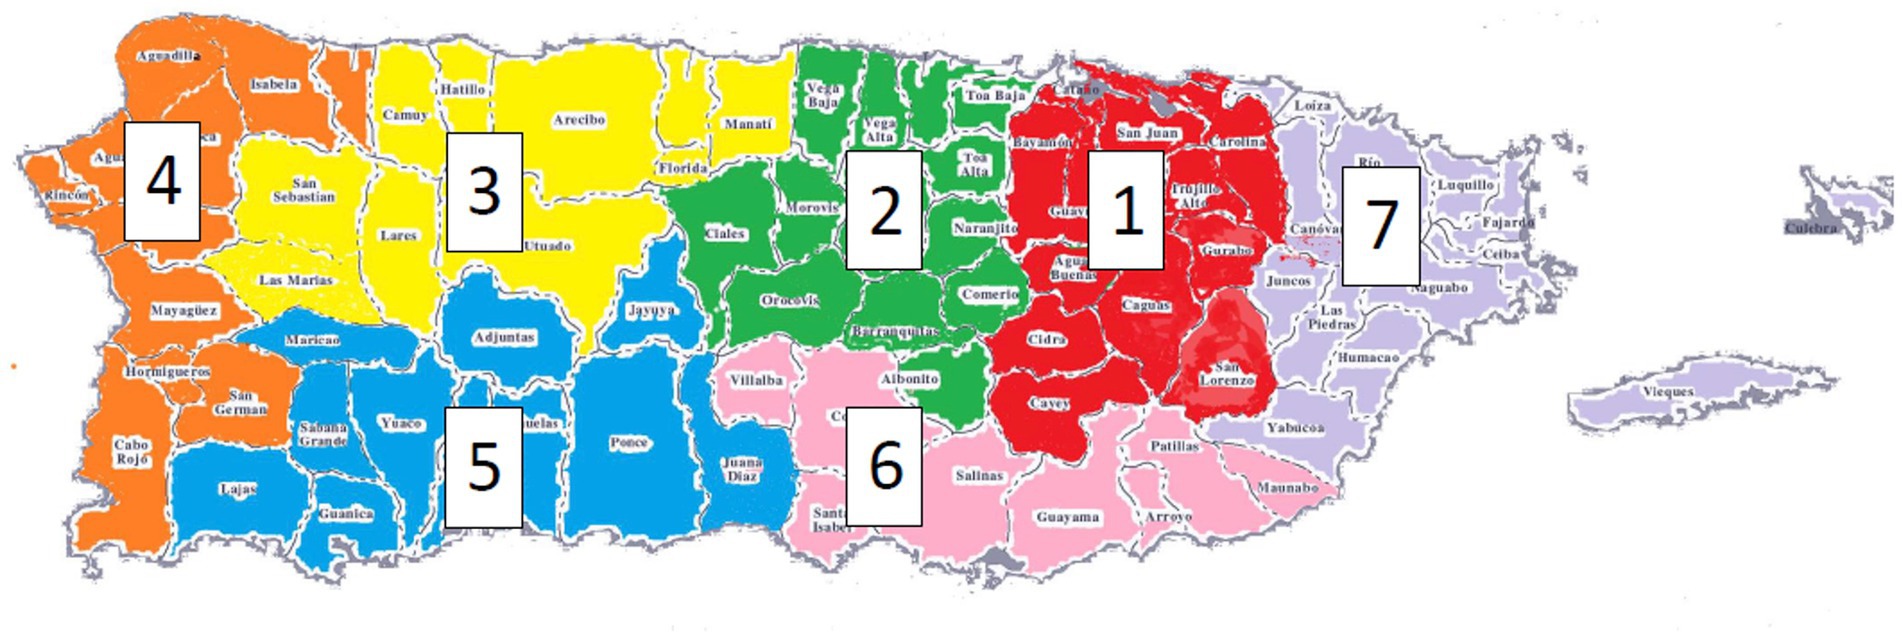
Figure 1. Seven different geographical Puerto Rican health zones defined by Puerto Rico Department of Health (2024) where participants were ascertained.
Informed consent was obtained from all participants, and the study protocols were approved by the University of Miami’s, and the Universidad Central del Caribe’s Institutional Review Boards. All eligible participants underwent an initial screening consisting of a standard clinical interview which included detailed medical and family history as well as a Modified Mini-Mental State Examination (3MS) (Folstein et al., 1975; Teng and Chui, 1987). Individuals who failed the screening were then evaluated with a comprehensive multi-domain cognitive battery which included measures of memory, executive function, language, and visuospatial ability. In addition, these participants were evaluated using functional measures including the Clinical Dementia Rating Scale (CDR). Using all available clinical information, participants were adjudicated by neurologists and neuropsychologists with expertise in neurodegenerative disorders. Clinical research diagnoses were assigned using the National Institute of Aging-Alzheimer’s Association (NIA-AA) criteria for possible and probable AD (McKhann et al., 2011) or the DSM-V criteria for Major Neurocognitive Disorder, Alzheimer’s type (Association AP, 2013). AD Cases were defined as participants who met NIA-AA or DSM-V criteria for AD. In summary, possible and probable AD diagnoses were assigned using the NIA-AA criteria by a clinical adjudication panel after reviewing historical and screening/evaluation test data (Rajabli et al., 2018; Rajabli et al., 2021). Cognitively unimpaired (CU) individuals were defined as participants who were cognitively unimpaired and ≥ 65 years of age at study entry.
2.2 Whole genome sequencing
Whole genome sequencing (WGS) data was generated at the Uniformed Services University of the Health Sciences (USUHS) and the Center for Genome Technology (CGT) at the John P. Hussman Institute for Human Genomics (HIHG) at the University of Miami Miller School of Medicine using coordinated methodology. Briefly, sequencing libraries were created using the TruSeq DNA PCR-Free library preparation kit followed by sequencing to 30X depth on the Illumina NovaSeq 6000 (Illumina, San Francisco, California, United States). The resulting FASTQ files were processed on a high-performance computing cluster maintained by the Frost Institute for Data Science and Computing at the University of Miami. Processing and quality control utilized the Variant Calling Pipeline (VCPA) developed and used for the Alzheimer’s Disease Sequencing Project (Leung et al., 2019) including alignment to GRCh38 using bwa-mem (Li, 2013), duplicates marking and base quality recalibration with multi-sample variant calling and joint genotyping were performed using the GATK HaplotypeCaller (van der Auwera and O’Connor, 2020) across all samples from the study. After quality control, all samples were screened for causal variants of PSEN1, PSEN2 and APP genes, and individuals who were found to be carriers of any causal variant were excluded from the study.
Principal components (PCs) were calculated using the GENESIS R/Bioconductor package (Gogarten et al., 2019). To determine the PCs used for further analyses, we employed logistic regression modelling (AD ~ Sex + Age + PC1:10).
2.3 Association analysis
2.3.1 Single variant analysis
Single variant association analysis was performed using SAIGE (Zhou et al., 2020) on genotypes employing a linear mixed model. We analyzed the data in two separate models; the first model accounted for sex, age, and PCs for population substructure (Model 1), while the second model also included the dosage of the APOE ε4 allele (Model 2). In both models, we included a genetic relationship matrix as a random effect to account for any potential relatedness. The GenABEL package version 1.8–031 was used to estimate genomic inflation (λ). Known AD markers were determined from the AF (Kunkle et al., 2021) and NHW (Bellenguez et al., 2022) GWASs. We evaluated whether these Known AD markers were replicated in our association analysis results for both models based on the p-value threshold of 0.05.
2.3.2 Gene-based analysis
Before the gene-based test, variants were restricted to rare variants excluding all variants with minor allele frequency (MAF) > 0.01. Then, variants were annotated with AnnoVar (Wang et al., 2010) to identify the gene region and the CADD (Kircher et al., 2014) score. As a result of gene region annotation, only intragenic variants (upstream, downstream, exonic and intronic variants) were included in the analysis. A combined test of burden and sequence kernel association test (SKAT-O) (Lee et al., 2012) was performed using the SAIGE-GENE (Zhou et al., 2020) tool. Three different variant sets were assessed: CADD20 set (variants with a CADD score of 20 or higher), CADD10 set (variants with a CADD score of 10 or higher) and CADD0 set (all intragenic variants). All sets were tested twice with two models: a main model (adjusted for sex, age, and first 4 PCs as fixed effects and GRM as a random effect), and an additional APOE ε4 allele dosage adjusted model.
2.4 Pathway analysis
We performed pathway analyses with Multi-marker Analysis of GenoMic Annotation (MAGMA) (de Leeuw et al., 2015) v1.08 using FUMA (Watanabe et al., 2017) v1.5.6, which performs SNP-wise gene analysis. 18977 gene sets obtained from MsigDB (Liberzon et al., 2015; Subramanian et al., 2005) v7.0 were used in the analyses. We analyzed a 35-kb upstream and 10-kb downstream window around each gene.
2.5 Fine-mapping and ancestral aware analysis
2.5.1 Fine mapping and replication analysis
Fine-mapping was performed using CARMA (Yang et al., 2023) with each locus defined as a 1Mb region centered around the index SNP with suggestive significant (p < 1×10⁻⁶) loci. Each locus’ LD matrix was generated based on the individual-level genetic data used in the association analysis. We employed CARMA with default values for all parameters with the maximum number of causal variants assumed in a region set at N = 10. The functional annotation CADD (Kircher et al., 2014) was also provided to CARMA as prior information on the causality of the testing SNPs.
For replication analysis, we used the EFIGA (Estudio Familiar de Influencia Genetica en Alzheimer) (Vardarajan et al., 2014) cohort included in the ADSP R4 dataset. This cohort includes individuals of Caribbean Hispanic descent recruited from the Dominican Republic and New York, comprising both a family-based study with multiple AD individuals and a case–control study of unrelated AD individuals. We selected AD cases and CU controls with ≥65 years of age at study entry from this cohort. PCs were calculated and single variant association testing was performed on index SNPs at suggestive significant loci identified in our PR dataset, employing the same statistical models, tools, and adjustments as in the initial analysis. We then conducted a meta-analysis of these suggestive index variants across the PR and EFIGA datasets using the METASOFT (Han and Eskin, 2011) program with random effects model (RE2).
2.5.2 Global ancestry estimation
The admixture proportion was estimated by using a model-based clustering algorithm implemented in the ADMIXTURE software (Zhou et al., 2011). Supervised ADMIXTURE analysis was performed at K = 3 by including the 3 reference populations (AI, EU, and AF) from combined reference panels of the Human Genome Diversity Project (HGDP) (Fairley et al., 2020) and 1000 Genomes Phase 3 (Delaneau et al., 2014; Auton et al., 2015).
2.5.3 Local ancestry estimation
The local ancestry was assessed by combining the 3 populations (AI, EU, and AF) in combined reference panels of HGDP (Fairley et al., 2020) and 1000 Genomes Phase 3 (Delaneau et al., 2014; Auton et al., 2015) with the PR dataset. The SHAPEIT (Delaneau et al., 2011) tool was used to phase all individuals in the same combined reference panels, and the RFMix Version 2 (Maples et al., 2013) tool with the discriminative modelling approach was used to infer the local ancestry at each locus across the genome. The standard parameters were used with a minimum node size of 5 to perform RFMix analysis.
2.5.4 Admixture mapping
We performed admixture mapping in PR datasets using the GENESIS R/Bioconductor package (Gogarten et al., 2019). First, we encoded copies of local ancestry calls for each ancestry (AF, AI, and EU) as dosage values (0, 1, or 2, number of haplotypes at a locus). Then, to test for an association between AD and local ancestry at a genomic location, we used a logistic mixed model. The model includes local ancestry as the main and the genetic relationship matrix (GRM) as a random effect to adjust for the sample relatedness and was adjusted further for age, sex, and principal components (PC1:4).
2.6 Runs of homozygosity analysis
We calculated ROH in the PR dataset by including the 3 reference populations (AI, EU, and AF) from combined reference panels of the Human Genome Diversity Project (HGDP) (Fairley et al., 2020) and 1000 Genomes Phase 3 (Delaneau et al., 2014; Auton et al., 2015) using the PLINK software. The following parameters were used: -homozy-snp 50, -homozy-kb 300, homozy-density 300, homozyg-gap 1000, -homozyg-window-snp 50, -homozyg-window-het 1, homozyg-window-missing 1, and homozyg-window-threshold 0.05. We plotted the resulting outputs using the ggplot package of the R.
We analyzed the total and average lengths of the ROHs per sample and the total number of ROHs for each sample. Then we evaluated ROHs larger than 1 Mb, 2 Mb, or 3 Mb separately with the global burden analysis. We conducted a global burden analysis among autosomal chromosomes in cases and controls using a one-tailed test with 10,000 permutations for the number of ROHs, the total ROH length and the mean ROH length per individual.
2.7 Polygenic risk score
We constructed PRS on the PR dataset using the effect sizes from summary statistics from the largest NHW GWAS study (Bellenguez et al., 2022). Quality control steps were carried out using standard parameters in the literature (Choi et al., 2020). We removed duplicate and ambiguous SNPs from the summary statistics NHW GWAS with the custom script.
The PRSice-2 (Choi and O'Reilly, 2019) tool was used to generate the PRS. Analyses were performed with standard parameters in accordance with the published PRS tutorial (Choi et al., 2020). We applied LD-clumping using the following parameters: --clump-kb 250 – clump-r2 0.1 –clump p1. We also filtered out variants with minor allele frequency (MAF) was less than 5%. We included only autosomal chromosomes in the analysis. In order to evaluate PRS performance independent of the APOE effect, we first removed the APOE region (2 MB around APOE ε4 SNP) from the data. Then, to adjust the model, we used age, sex, and the first four PCs as covariates.
After each PRS calculation, the PRS performance was assessed by employing the logistic regression model: Covar-only, PRS-only, APOE ε4-only, PRS + APOE ε4, and Full to construct receiver operator curves (ROC).
1. AD ~ Sex + Age + PC1:4 (“ModelCovar-only”)
2. AD ~ PRS (“ModelPRS-only”)
3. AD ~ APOE ε4 (“ModelAPOE ε4-only”)
4. AD ~ PRS + APOE ε4 (“ModelPRS + APOE ε4,”)
5. AD ~ PRS + APOE ε4 + Sex + Age + PC1:4 (“ModelFull”)
We deposited the codes and scripts used in this study to the GitHub repository we created.1
3 Results
3.1 Association analysis
Our study included a total of 648 PR individuals from families (78 AD, 41 cognitively unimpaired) and unrelated individuals (267 AD, 262 cognitively unimpaired) (Table 1). There was no evidence for genomic inflation (model 1: λ = 1.029; model 2: λ = 1.048).
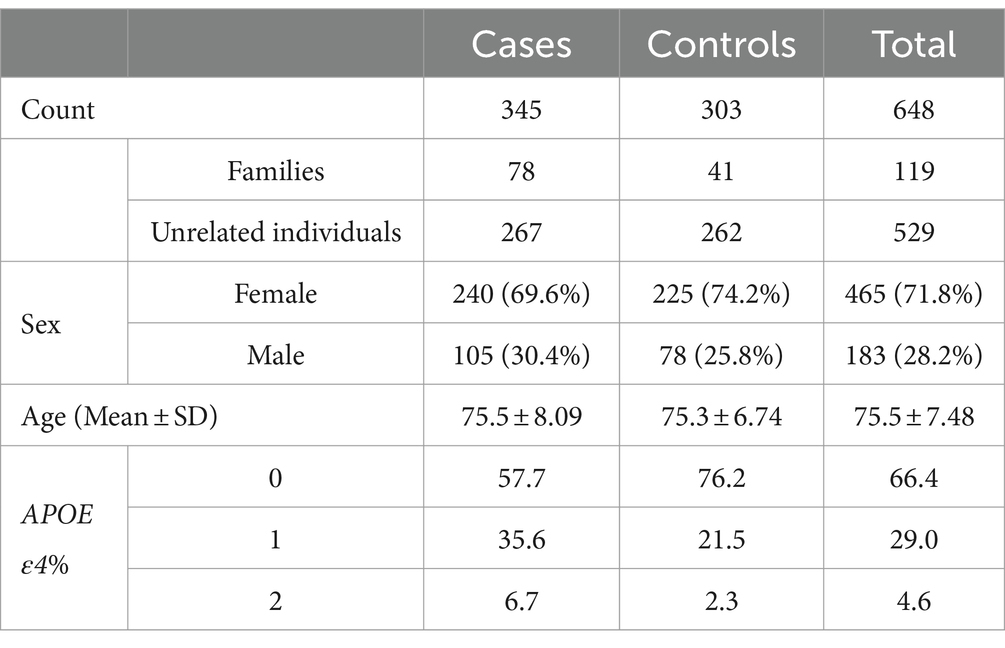
Table 1. Table showing the age, gender, and APOE ε4 dosage distributions of the participants in our study.
Single-variant testing replicated the APOE locus (p = 1.3 × 10⁻⁷) (Table 2; Figure 2). In addition to APOE, we replicated the same signals of ten known-AD loci (p ≤ 0.05): ABCA7, ANK3, CLU, FERMT2, GRN, PRDM7, RASGEF1C, SEC61G, SORL1, and TREM2 (Table 2; Figure 2).
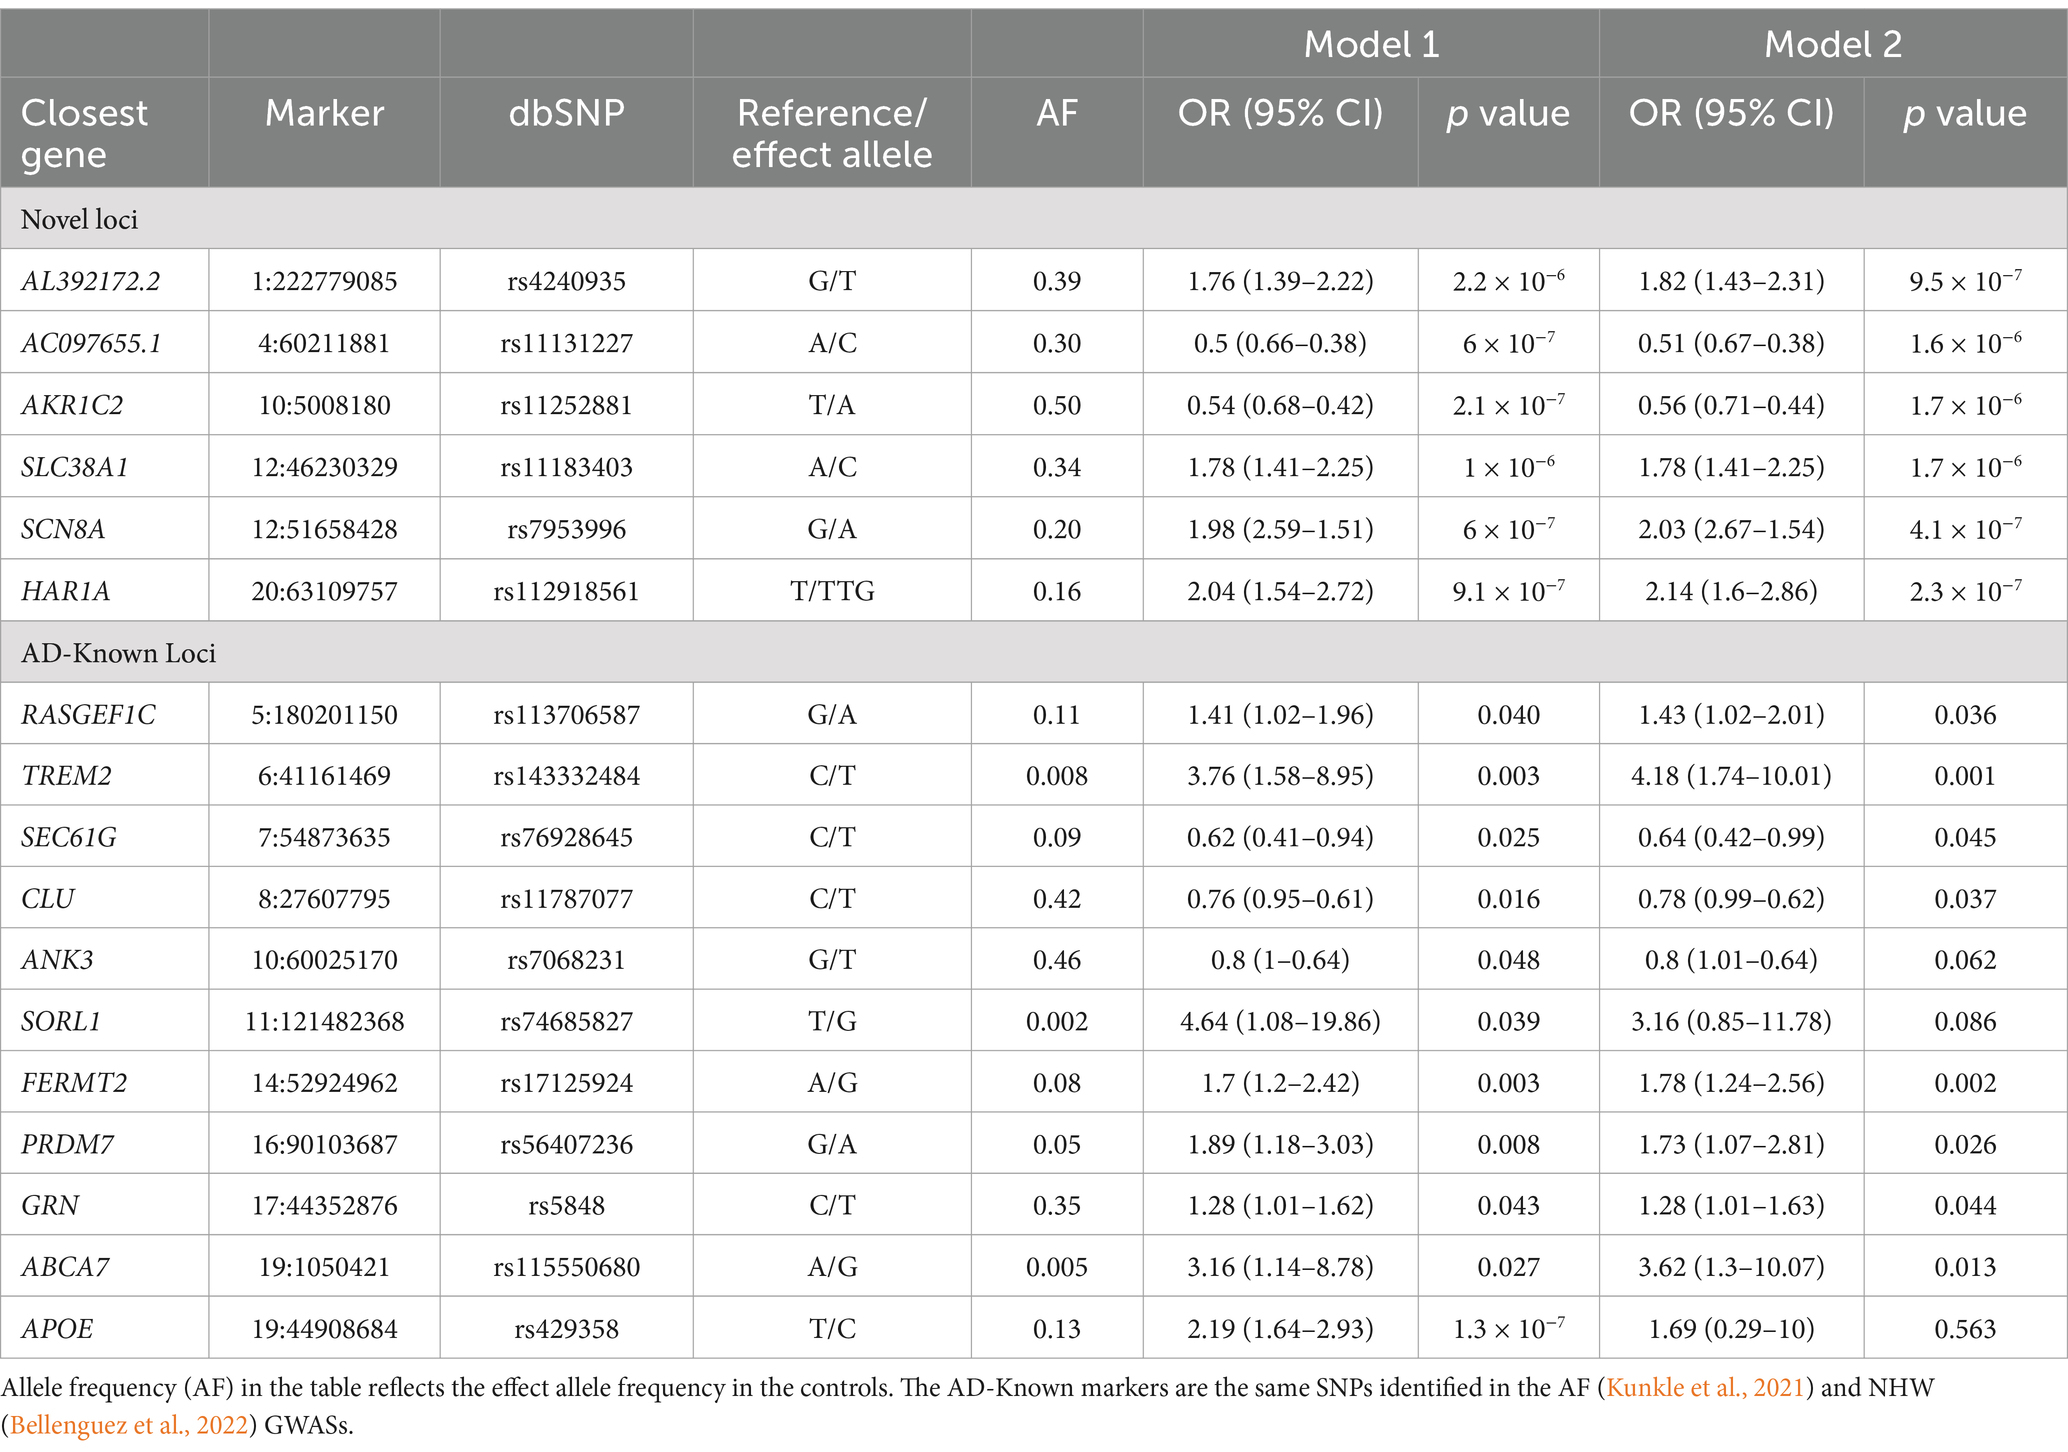
Table 2. Results of single variant analysis.
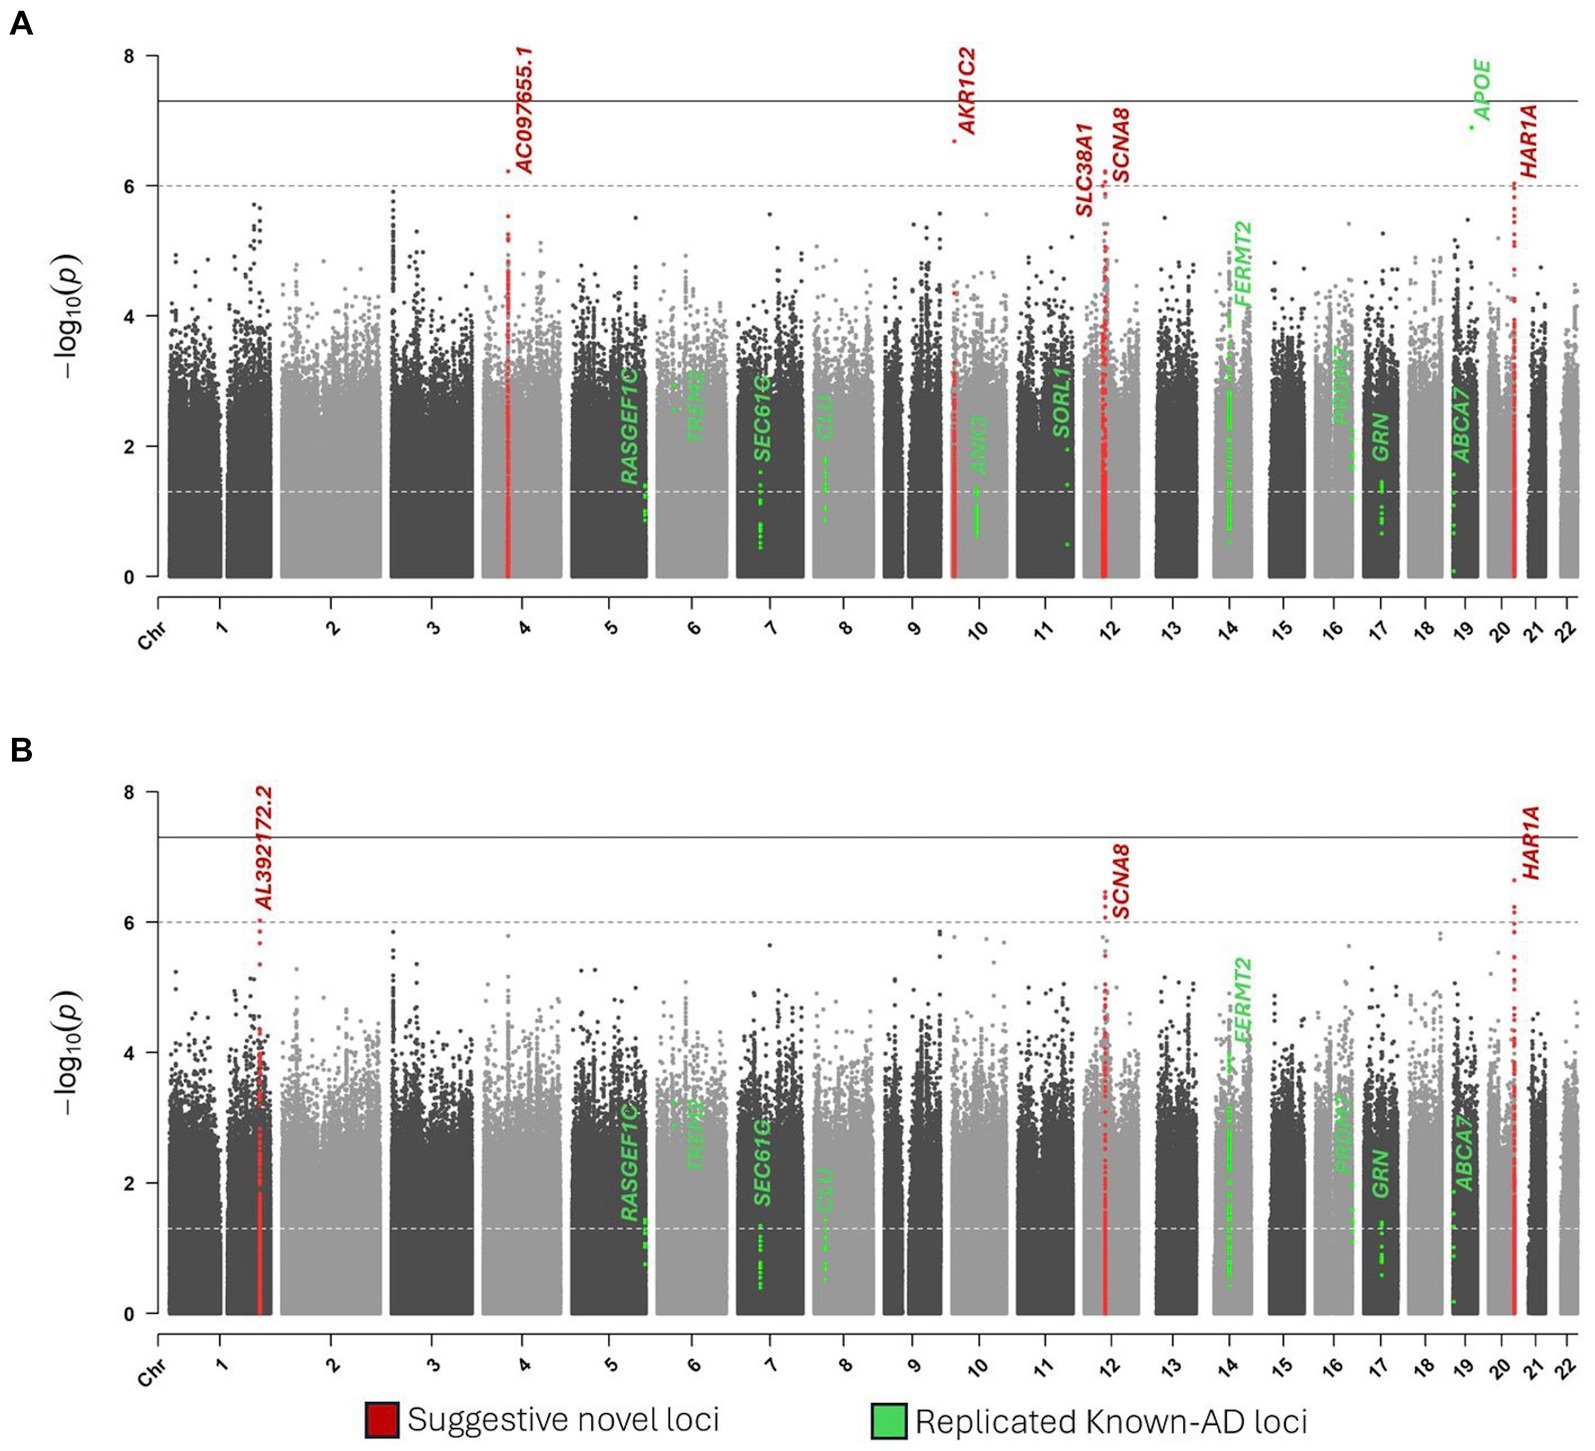
Figure 2. Manhattan plots of single variant analysis. (A) Model 1. (B) Model 2.
Six novel loci reached suggestive significance at p ≤ 1 × 10⁻⁶: AL392172.2 on chromosome 1, AC097655.1 on chromosome 4, AKR1C2 on chromosome 10, SLC38A1 on chromosome 12, SCN8A on chromosome 12, and HAR1A on chromosome 20 (Table 2; Figure 2).
As a result of gene-based testing, there was no gene-wide significant region (Supplementary Table S1).
3.2 Pathway analysis
MAGMA gene-set analysis showed no pathway at Pbon < 0.05 after Bonferroni correction (18977 genes were tested). Three pathways were identified that p < 1 × 10⁻⁴, although these pathways were not significant after Bonferroni correction (Supplementary Table S2).
3.3 Fine mapping and replication analysis
Six novel loci in Models 1 and 2 were fine mapped using CARMA. There was no credible set generated for these regions, although these regions’ index SNPs showed the highest PIPs (Supplementary Table S3). Consequently, these SNPs garnered a larger proportion, if not the entirety, of the PIP for their respective regions with the sum of the PIPs of these regions falling short of generating a credible set.
Replication analysis in an independent Caribbean Hispanic dataset from the EFIGA study (632 AD, 270 cognitively unimpaired) showed significant associations of index SNPs in two loci: SLC38A1 (p = 0.009), and SCN8A (p = 0.049). As a result of the metanalysis of the EFIGA and our PR datasets, the SLC38A1 locus neared genome-wide significance (p = 3×10⁻⁷).
3.4 Admixture mapping
An ancestral block located on chromosomes 12q13.1 (p = 6.3×10⁻⁶, Figure 3) neared genome-wide significance by Univariate African AM analysis. This region also overlapped with the SLC38A1 and SCN8A genes, which reached suggestive significance in the association analysis.
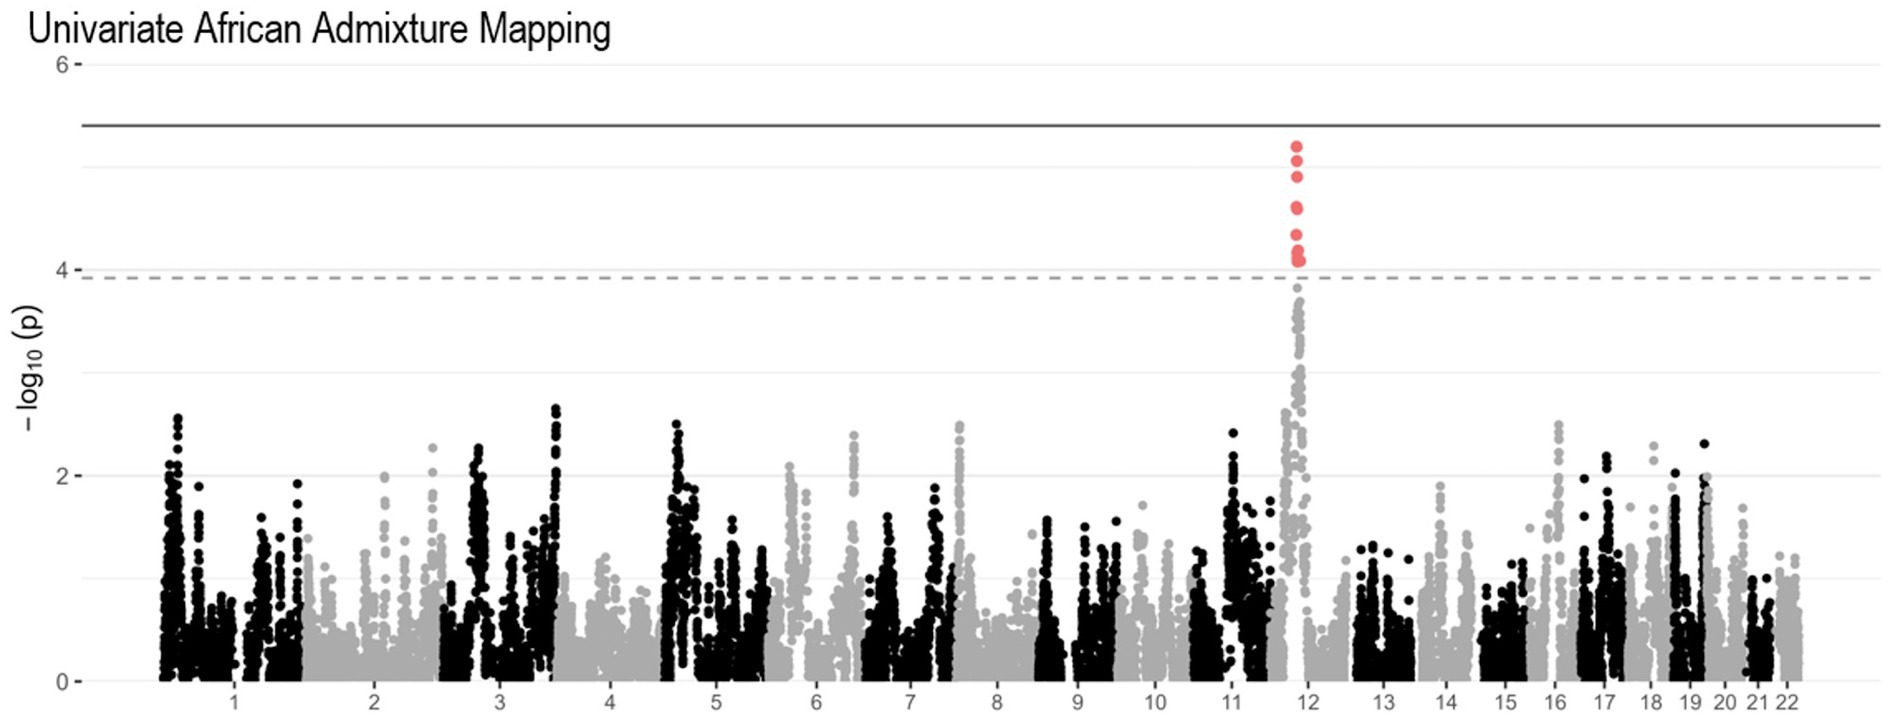
Figure 3. Univariate African AM Manhattan plot of PR dataset. The solid gray horizontal line represents the genome-wide significance threshold calculated in our cohort, and the dashed gray horizontal line represents the genome-wide significance threshold calculated in the previous larger Caribbean Hispanic study (Kizil et al., 2022).
3.5 Global ancestry and ROH analysis
Admixture analysis revealed proportions of 71% EU, 18% AF, and 11% AI in the cohort (Figure 4). Global ancestry distributions according to different health regions (Puerto Rico Department of Health, 2024) in PR showed a slight increase in the AF rate and a decrease in the EU in Zone 7 compared to the others (Supplementary Figure S1A). In addition, it was observed that the ROH length and number distributions of the participants in Zone 7 mostly overlapped with the reference individuals of African origin (Supplementary Figure S1B).
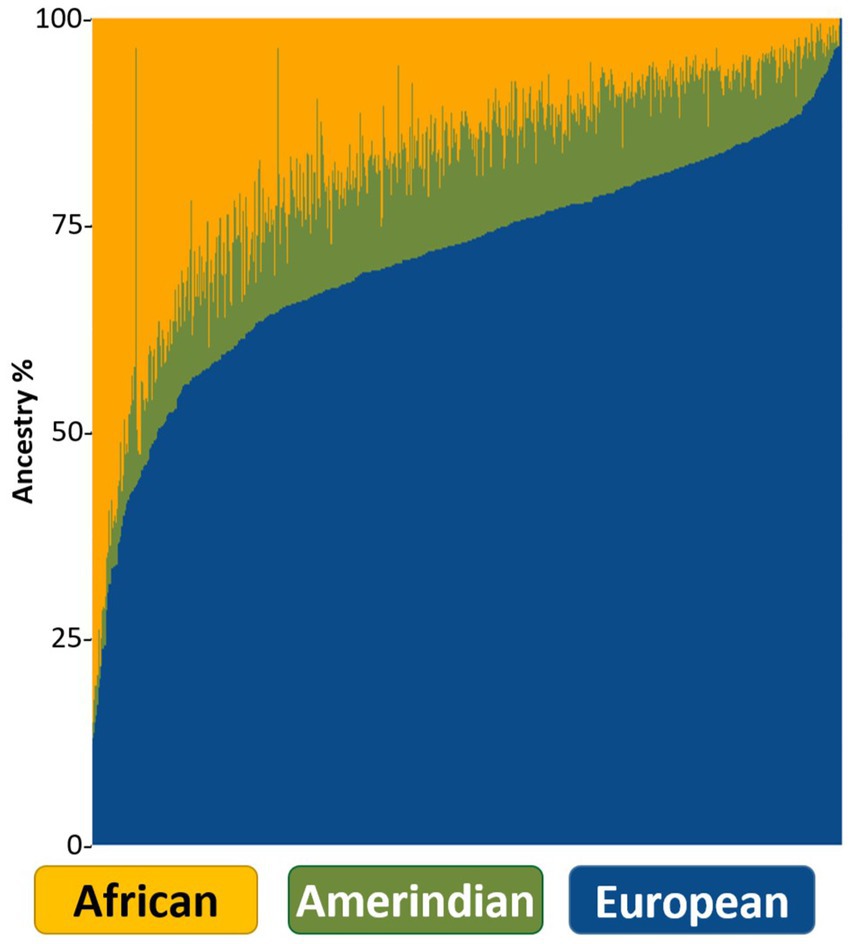
Figure 4. ADMIXTURE bar plot showing each individual as a vertical line and global ancestries in different colors.
Global Burden Analysis showed that the mean size of ROHs larger than 1 MB was significantly higher in cases than in the control group (Supplementary Table S4).
3.6 Polygenic risk score
We calculated a PRS using 99 clumped SNPs (Supplementary Table S5). AUC in the PR dataset was found to be 0.62 in ModelPRS-only and the t-test showed a significant association between PRS and AD (p = 7.9×10⁻⁸) (Figure 5A). In modelAPOE ε4-only and modelPRS + APOE ε4, we achieved an AUC of 0.59 and 0.65, respectively. ModelFull showed an AUC of 0.66 (Figures 5B,C).
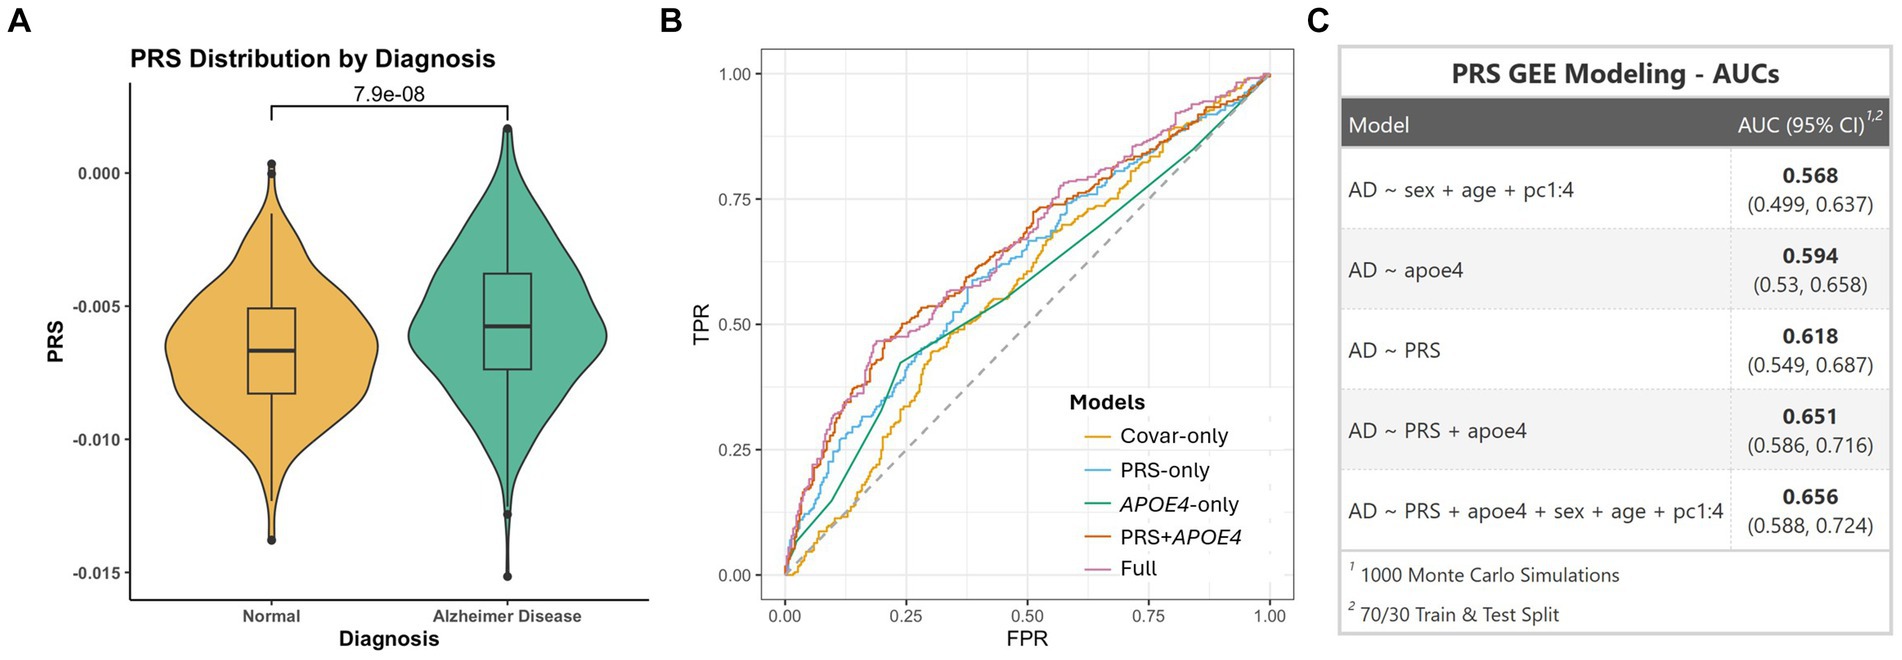
Figure 5. (A) Violin plot showing PRS distribution between AD and cognitively unimpaired individuals. (B) ROC curves showing different models. (C) Table showing AUC values for different models.
4 Discussion
Our GWAS and AM analysis identified a suggestive AD risk locus with two signals within a 5 MB region on chromosome 12: one within the SLC38A1 gene (12q13.11) and the other within the SCN8A gene (12q13.13). We replicated both signals using an independent Caribbean Hispanic dataset from the EFIGA study. This region corresponds to a locus on chromosome 12q13 previously implicated in AD by linkage studies (Rogaeva et al., 1998; Yu et al., 2011; Scott et al., 2000; Pericak-Vance et al., 1997; Beecham et al., 2009). The index marker at 12q13.11, identified in this study, was found to be significant in the AF (Kunkle et al., 2021) (p = 0.004; OR = 1.12) and NHW (Kunkle et al., 2019) (p = 0.04; OR = 1.03) GWAS studies, further supporting these findings. The ancestry approach showed that the index marker has both EU and AF ancestral backgrounds and both contributing to the risk in this region. The SLC38A1 gene is associated with ischemic brain damage (Yamada et al., 2019) and its transcription is affected by amyloid-beta peptide (Buntup et al., 2008). The SCN8A gene is associated with a severe developmental and epileptic encephalopathy (Ohba et al., 2014), cognitive impairment (Wagnon et al., 2017; Trudeau et al., 2006), and has a demonstrated relationship with reduced pathogenesis of AD in a mouse model study (Yuan et al., 2022). Both genes are involved in the biological process of sodium ion transport (GO [Gene Ontology]:0006814) (Aleksander et al., 2023; Ashburner et al., 2000). While the number of participants in this study is modest, the robustness of our findings at this locus is further strengthened by the replication in an independent Caribbean Hispanic cohort, ancestry-aware follow-up analysis, and supporting results from previous GWAS and linkage studies.
We replicated the APOE e4 risk allele and additionally the same markers of the ten known AD loci (Bellenguez et al., 2022; Kunkle et al., 2021) – ABCA7, ANK3, CLU, FERMT2, GRN, PRDM7, RASGEF1C, SEC61G, SORL1, and TREM2. APOE ε4 allele is the major risk factor for AD in almost all populations, but its effect differs among different ancestral populations (Farrer et al., 1997). The ε4 allele has the highest risk in East Asian populations (Liu et al., 2014), followed by Europeans, and a lower risk in AF ancestry populations (Tang et al., 1996; Tang et al., 1998; Sahota et al., 1997; Hendrie et al., 2014). The APOE e4 odds ratio was found to be 2.19 (1.64–2.93) in our study, and although this rate was slightly above that in the recent large-scale African-American GWAS study (OR = 1.93) (Kunkle et al., 2021), it was below that found in European studies. Our result was also consistent with a study investigating the ancestral origin of APOE e4 AD risk in PR and African American populations (Rajabli et al., 2018). Of the 10 other signals replicated by our study, 9 were identified in European studies (Bellenguez et al., 2022) and ABCA7 (rs115550680) was identified in the recent African-American GWAS study (Kunkle et al., 2021). This is likely due to the higher proportion of EU background and the lower proportion of AF background of the PR population.
Global ancestry admixture analysis revealed proportions of 71% EU, 18% AF, and 11% AI in our cohort, which confirmed that PRs were a 3-way admixed population. Upon examining the global ancestry and ROH length/number distributions by zones, we saw that Zone 7 had a higher African ancestry background and a lower European ancestry background than the other zones. Upon closer inspection of the cities in Zone 7, we found out that individuals from Loiza city had African ancestry rates of 58%, which was higher than the cohort average. Loiza is known in PR for the rich African heritage that forms the basis of its identity. The background of this rich African heritage dates back to the African individuals who were brought to work in the sugar plantations established in the region in the 16th century (Perez, 2002).
NHW GWAS (5)-derived PRS showed a good predictive value (AUC of 0.62 in ModelPRS-only) of AD risk in the PR population. Moreover, the AUC value of the PRS + APOE model was found to be higher (0.65). While the results provide a promising prediction value, there is potential to further optimize the PRS calculations for PR to enhance their clinical relevance. The accuracy of PRS improves when modelled using GWAS with a similar ancestral origin (Choi et al., 2020). Nonetheless, the NHW GWAS-based PRS likely showed good predictive results due to the substantial EU ancestral background among PRs. Overall, our results point to the importance of performing population-specific studies to derive PRS calculations that will yield high predictive values that are suitable for clinical use.
The poor generalizability of genetic studies across populations is well-established. To understand the myriad genetic factors that contribute to the development of AD it is important to study diverse populations which are underrepresented in genetic studies. By including diverse populations, not only can we identify factors that contribute to health disparities, but we can also fine-tune our efforts to develop effective treatments for AD. Further, by including underrepresented populations in genetic studies, higher-sensitivity risks can be calculated with methods such as PRS: more importantly, new genetic loci can be discovered, as in our study, and the biological role of known loci in different populations can be understood more clearly. Thus, a more effective approach to the prevention of AD can be achieved by initiating treatments at the preclinical stage (Andrieu et al., 2015), a timing frame when the pathophysiological mechanisms of the disease begin, decades before the clinically detectable symptoms of AD appear (Sperling et al., 2014). Including underrepresented populations such as the PR population, provides an important opportunity to evaluate the role of different ancestral backgrounds in AD, and may pave the way for more accurate prevention, early detection, and intervention of AD in this and other admixed Hispanic populations.
Data availability statement
The datasets presented in this study can be found in online repositories. The names of the repository/repositories and accession number(s) can be found at: https://dss.niagads.org/datasets/ng00067/, NG00067, https://dss.niagads.org/sample-sets/snd10031/, snd10031, https://dss.niagads.org/cohorts/puerto-rican-alzheimers-disease-initiative-pradi/, Puerto Rican Alzheimer’s Disease Initiative (PRADI).
Ethics statement
The studies involving humans were approved by the University of Miami’s, and the Universidad Central del Caribe’s Institutional Review Boards. The studies were conducted in accordance with the local legislation and institutional requirements. The participants provided their written informed consent to participate in this study.
Author contributions
BA: Writing – original draft, Writing – review & editing, Data curation, Formal analysis, Investigation, Methodology, Validation, Visualization. BF-A: Conceptualization, Resources, Supervision, Writing – review & editing. KH-N: Writing – review & editing, Data curation, Formal analysis. KS: Data curation, Formal analysis, Writing – review & editing. JR: Data curation, Formal analysis, Writing – review & editing. LA: Data curation, Writing – review & editing. JS: Data curation, Writing – review & editing. GV: Data curation, Writing – review & editing. ST: Data curation, Writing – review & editing. PB: Data curation, Writing – review & editing. CS-V: Data curation, Writing – review & editing. VR: Data curation, Writing – review & editing. PM: Data curation, Writing – review & editing. KC: Data curation, Writing – review & editing, Funding acquisition. PW: Data curation, Writing – review & editing. MP: Data curation, Writing – review & editing. CK: Formal analysis, Writing – review & editing. DB: Formal analysis, Writing – review & editing. MS: Formal analysis, Writing – review & editing. HA: Data curation, Writing – review & editing. AG: Data curation, Formal analysis, Writing – review & editing. CD: Data curation, Writing – review & editing. KM: Data curation, Writing – review & editing. GB: Methodology, Writing – review & editing, Funding acquisition. MC: Data curation, Writing – review & editing. JV: Resources, Writing – review & editing. MP-V: Conceptualization, Funding acquisition, Investigation, Methodology, Project administration, Resources, Supervision, Validation, Writing – original draft, Writing – review & editing. FR: Writing – original draft, Writing – review & editing, Conceptualization, Formal analysis, Funding acquisition, Investigation, Methodology, Project administration, Supervision, Validation.
Funding
The author(s) declare financial support was received for the research, authorship, and/or publication of this article. This investigation was supported by grants U19AG074865, R01AG070864, RF1AG054074, and U01AG057659 from the NIA of NIH, and the A2018556F grant from the BrightFocus Foundation.
Acknowledgments
We are grateful to all participants and their families for taking part in our study.
Conflict of interest
The authors declare that the research was conducted in the absence of any commercial or financial relationships that could be construed as a potential conflict of interest.
Publisher’s note
All claims expressed in this article are solely those of the authors and do not necessarily represent those of their affiliated organizations, or those of the publisher, the editors and the reviewers. Any product that may be evaluated in this article, or claim that may be made by its manufacturer, is not guaranteed or endorsed by the publisher.
Supplementary material
The Supplementary material for this article can be found online at: https://www.frontiersin.org/articles/10.3389/fnagi.2024.1459796/full#supplementary-material
Footnotes
References
Aleksander, S. A., Balhoff, J., Carbon, S., Cherry, J. M., Drabkin, H. J., Ebert, D., et al. (2023). The gene ontology knowledgebase in 2023. Genetics 224:iyad031. doi: 10.1093/genetics/iyad031
Alzheimer’s Association (2024). 2024 Alzheimer's disease facts and figures. Alzheimers Dement. 20, 3708–3821. doi: 10.1002/alz.13809
Andrieu, S., Coley, N., Lovestone, S., Aisen, P. S., and Vellas, B. (2015). Prevention of sporadic Alzheimer's disease: lessons learned from clinical trials and future directions. Lancet Neurol. 14, 926–944. doi: 10.1016/S1474-4422(15)00153-2
Ashburner, M., Ball, C. A., Blake, J. A., Botstein, D., Butler, H., Cherry, J. M., et al. (2000). Gene ontology: tool for the unification of biology. Nat. Genet. 25, 25–29. doi: 10.1038/75556
Association AP (2013). Diagnostic and statistical manual of Mental disorders: Dsm-5. 5th Edn. Arlington, VA: American Psychiatric Association.
Auton, A., Brooks, L. D., Durbin, R. M., Garrison, E. P., and Kang, H. M.Genomes Project C, et al. (2015). A global reference for human genetic variation. Nature 526, 68–74. doi: 10.1038/nature15393
Beecham, G. W., Martin, E. R., Li, Y. J., Slifer, M. A., Gilbert, J. R., Haines, J. L., et al. (2009). Genome-wide association study implicates a chromosome 12 risk locus for late-onset Alzheimer disease. Am. J. Hum. Genet. 84, 35–43. doi: 10.1016/j.ajhg.2008.12.008
Bellenguez, C., Kucukali, F., Jansen, I. E., Kleineidam, L., Moreno-Grau, S., Amin, N., et al. (2022). New insights into the genetic etiology of Alzheimer's disease and related dementias. Nat. Genet. 54, 412–436. doi: 10.1038/s41588-022-01024-z
Borenstein, A. R., and Mortimer, J. A. (2016). Alzheimer’s disease: life course perspectives on risk reduction. Elsevier Science.
Buntup, D., Skare, O., Solbu, T. T., Chaudhry, F. A., Storm-Mathisen, J., and Thangnipon, W. (2008). Beta-amyloid 25-35 peptide reduces the expression of glutamine transporter Sat1 in cultured cortical neurons. Neurochem. Res. 33, 248–256. doi: 10.1007/s11064-007-9527-2
Choi, S. W., Mak, T. S., and O'Reilly, P. F. (2020). Tutorial: a guide to performing polygenic risk score analyses. Nat. Protoc. 15, 2759–2772. doi: 10.1038/s41596-020-0353-1
Choi, S. W., and O'Reilly, P. F. (2019). Prsice-2: polygenic risk score software for biobank-scale data. Gigascience 8:giz082. doi: 10.1093/gigascience/giz082
Cukier, H. N., Kunkle, B. W., Vardarajan, B. N., Rolati, S., Hamilton-Nelson, K. L., Kohli, M. A., et al. (2016). Abca7 frameshift deletion associated with Alzheimer disease in African Americans. Neurol. Genet. 2:e79. doi: 10.1212/NXG.0000000000000079
de Leeuw, C. A., Mooij, J. M., Heskes, T., and Posthuma, D. (2015). Magma: generalized gene-set analysis of Gwas data. PLoS Comput. Biol. 11:e1004219. doi: 10.1371/journal.pcbi.1004219
Delaneau, O., and Marchini, J.Genomes Project C (2014). Integrating sequence and Array data to create an improved 1000 genomes project haplotype reference panel. Nat. Commun. 5:3934. doi: 10.1038/ncomms4934
Delaneau, O., Marchini, J., and Zagury, J. F. (2011). A linear complexity phasing method for thousands of genomes. Nat. Methods 9, 179–181. doi: 10.1038/nmeth.1785
Fairley, S., Lowy-Gallego, E., Perry, E., and Flicek, P. (2020). The international genome sample resource (Igsr) collection of open human genomic variation resources. Nucleic Acids Res. 48, D941–D947. doi: 10.1093/nar/gkz836
Farrer, L. A., Cupples, L. A., Haines, J. L., Hyman, B., Kukull, W. A., Mayeux, R., et al. (1997). Effects of age, sex, and ethnicity on the association between apolipoprotein E genotype and Alzheimer disease. A Meta-analysis. Apoe and Alzheimer disease Meta analysis consortium. JAMA 278, 1349–1356. doi: 10.1001/jama.1997.03550160069041
Feliciano-Astacio, B. E., Celis, K., Ramos, J., Rajabli, F., Adams, L. D., Rodriguez, A., et al. (2019). The Puerto Rico Alzheimer disease initiative (Pradi): a multisource ascertainment approach. Front. Genet. 10:538. doi: 10.3389/fgene.2019.00538
Folstein, M. F., Folstein, S. E., and McHugh, P. R. (1975). "Mini-Mental State". A practical method for grading the cognitive State of patients for the clinician. J. Psychiatr. Res. 12, 189–198. doi: 10.1016/0022-3956(75)90026-6
Gatz, M., Pedersen, N. L., Berg, S., Johansson, B., Johansson, K., Mortimer, J. A., et al. (1997). Heritability for Alzheimer's disease: the study of dementia in Swedish twins. J. Gerontol. A Biol. Sci. Med. Sci. 52A, M117–M125. doi: 10.1093/gerona/52a.2.m117
Gatz, M., Reynolds, C. A., Fratiglioni, L., Johansson, B., Mortimer, J. A., Berg, S., et al. (2006). Role of genes and environments for explaining Alzheimer disease. Arch. Gen. Psychiatry 63, 168–174. doi: 10.1001/archpsyc.63.2.168
Gogarten, S. M., Sofer, T., Chen, H., Yu, C., Brody, J. A., Thornton, T. A., et al. (2019). Genetic association testing using the Genesis R/Bioconductor package. Bioinformatics 35, 5346–5348. doi: 10.1093/bioinformatics/btz567
Han, B., and Eskin, E. (2011). Random-effects model aimed at discovering associations in Meta-analysis of genome-wide association studies. Am. J. Hum. Genet. 88, 586–598. doi: 10.1016/j.ajhg.2011.04.014
Hendrie, H. C., Murrell, J., Baiyewu, O., Lane, K. A., Purnell, C., Ogunniyi, A., et al. (2014). Apoe Epsilon4 and the risk for Alzheimer disease and cognitive decline in African Americans and Yoruba. Int. Psychogeriatr. 26, 977–985. doi: 10.1017/S1041610214000167
Kircher, M., Witten, D. M., Jain, P., O'Roak, B. J., Cooper, G. M., and Shendure, J. (2014). A general framework for estimating the relative pathogenicity of human genetic variants. Nat. Genet. 46, 310–315. doi: 10.1038/ng.2892
Kizil, C., Sariya, S., Kim, Y. A., Rajabli, F., Martin, E., Reyes-Dumeyer, D., et al. (2022). Admixture mapping of Alzheimer's disease in Caribbean Hispanics identifies a new locus on 22q13.1. Mol. Psychiatry 27, 2813–2820. doi: 10.1038/s41380-022-01526-6
Kunkle, B. W., Grenier-Boley, B., Sims, R., Bis, J. C., Damotte, V., Naj, A. C., et al. (2019). Genetic Meta-analysis of diagnosed Alzheimer's disease identifies new risk loci and implicates Abeta, tau, Immunity and Lipid Processing. Nat. Genet. 51, 414–430. doi: 10.1038/s41588-019-0358-2
Kunkle, B. W., Schmidt, M., Klein, H. U., Naj, A. C., Hamilton-Nelson, K. L., Larson, E. B., et al. (2021). Novel Alzheimer disease risk loci and pathways in African American individuals using the African genome resources panel: a meta-analysis. JAMA Neurol. 78, 102–113. doi: 10.1001/jamaneurol.2020.3536
Lee, S., Emond, M. J., Bamshad, M. J., Barnes, K. C., Rieder, M. J., Nickerson, D. A., et al. (2012). Optimal unified approach for rare-variant association testing with application to Small-sample case-control whole-exome sequencing studies. Am. J. Hum. Genet. 91, 224–237. doi: 10.1016/j.ajhg.2012.06.007
Leung, Y. Y., Valladares, O., Chou, Y. F., Lin, H. J., Kuzma, A. B., Cantwell, L., et al. (2019). Vcpa: genomic variant calling pipeline and data management tool for Alzheimer's disease sequencing project. Bioinformatics 35, 1768–1770. doi: 10.1093/bioinformatics/bty894
Li, H. (2013). Aligning sequence reads, clone sequences and assembly Contigs with Bwa-mem. arXiv [Preprint]. doi: 10.48550/arXiv.1303.3997
Liberzon, A., Birger, C., Thorvaldsdottir, H., Ghandi, M., Mesirov, J. P., and Tamayo, P. (2015). The molecular signatures database (Msigdb) Hallmark gene set collection. Cell. Syst. 1, 417–425. doi: 10.1016/j.cels.2015.12.004
Liu, M., Bian, C., Zhang, J., and Wen, F. (2014). Apolipoprotein E gene polymorphism and Alzheimer's disease in Chinese population: a Meta-analysis. Sci. Rep. 4:4383. doi: 10.1038/srep04383
Liu, F., Ikram, M. A., Janssens, A. C., Schuur, M., de Koning, I., Isaacs, A., et al. (2009). A study of the Sorl1 gene in Alzheimer's disease and cognitive function. J. Alzheimers Dis. 18, 51–64. doi: 10.3233/JAD-2009-1137
Maples, B. K., Gravel, S., Kenny, E. E., and Bustamante, C. D. (2013). Rfmix: a discriminative modeling approach for rapid and robust local-ancestry inference. Am. J. Hum. Genet. 93, 278–288. doi: 10.1016/j.ajhg.2013.06.020
McKhann, G. M., Knopman, D. S., Chertkow, H., Hyman, B. T., Jack, C. R. Jr., Kawas, C. H., et al. (2011). The diagnosis of dementia due to Alzheimer's disease: recommendations from the National Institute on Aging-Alzheimer's Association workgroups on diagnostic guidelines for Alzheimer's disease. Alzheimers Dement. 7, 263–269. doi: 10.1016/j.jalz.2011.03.005
Mills, M. C., and Rahal, C. (2019). A Scientometric review of genome-wide association studies. Commun. Biol. 2:9. doi: 10.1038/s42003-018-0261-x
Mills, M. C., and Rahal, C. (2020). The Gwas diversity monitor tracks diversity by disease in Real time. Nat. Genet. 52, 242–243. doi: 10.1038/s41588-020-0580-y
Ohba, C., Kato, M., Takahashi, S., Lerman-Sagie, T., Lev, D., Terashima, H., et al. (2014). Early onset epileptic encephalopathy caused by De novo Scn8a mutations. Epilepsia 55, 994–1000. doi: 10.1111/epi.12668
Perez, M. A. (2002). The place of abandonment: Geography, race, and *nature in Puerto Rico [Ph.D.]. United States – California: University of California, Berkeley.
Pericak-Vance, M. A., Bass, M. P., Yamaoka, L. H., Gaskell, P. C., Scott, W. K., Terwedow, H. A., et al. (1997). Complete genomic screen in late-onset familial Alzheimer disease. Evidence for a new locus on chromosome 12. JAMA 278, 1237–1241. doi: 10.1001/jama.1997.03550150041033
Puerto Rico Department of Health . (2024). Health regions and direct services. Available at: https://www.salud.pr.gov/CMS/144
Rajabli, F., Feliciano, B. E., Celis, K., Hamilton-Nelson, K. L., Whitehead, P. L., Adams, L. D., et al. (2018). Ancestral origin of Apoe Epsilon4 Alzheimer disease risk in Puerto Rican and African American populations. PLoS Genet. 14:e1007791. doi: 10.1371/journal.pgen.1007791
Rajabli, F., Feliciano-Astacio, B. E., Cukier, H. N., Wang, L., Griswold, A. J., Hamilton-Nelson, K. L., et al. (2021). Linkage of Alzheimer disease families with Puerto Rican ancestry identifies a chromosome 9 locus. Neurobiol. Aging 104, 115.e1–e7. doi: 10.1016/j.neurobiolaging.2021.02.019
Reitz, C., Jun, G., Naj, A., Rajbhandary, R., Vardarajan, B. N., Wang, L. S., et al. (2013). Variants in the Atp-binding cassette transporter (Abca7), apolipoprotein E ϵ4, and the risk of late-onset Alzheimer disease in African Americans. JAMA 309, 1483–1492. doi: 10.1001/jama.2013.2973
Reitz, C., Pericak-Vance, M. A., Foroud, T., and Mayeux, R. (2023). A global view of the genetic basis of Alzheimer disease. Nat. Rev. Neurol. 19, 261–277. doi: 10.1038/s41582-023-00789-z
Rogaeva, E., Premkumar, S., Song, Y., Sorbi, S., Brindle, N., Paterson, A., et al. (1998). Evidence for an Alzheimer disease susceptibility locus on chromosome 12 and for further locus heterogeneity. JAMA 280, 614–618. doi: 10.1001/jama.280.7.614
Sahota, A., Yang, M., Gao, S., Hui, S. L., Baiyewu, O., Gureje, O., et al. (1997). Apolipoprotein E-associated risk for Alzheimer's disease in the African-American population is genotype dependent. Ann. Neurol. 42, 659–661. doi: 10.1002/ana.410420418
Scott, W. K., Grubber, J. M., Conneally, P. M., Small, G. W., Hulette, C. M., Rosenberg, C. K., et al. (2000). Fine mapping of the chromosome 12 late-onset Alzheimer disease locus: potential genetic and phenotypic heterogeneity. Am. J. Hum. Genet. 66, 922–932. doi: 10.1086/302828
Sperling, R., Mormino, E., and Johnson, K. (2014). The evolution of preclinical Alzheimer's disease: implications for prevention trials. Neuron 84, 608–622. doi: 10.1016/j.neuron.2014.10.038
Subramanian, A., Tamayo, P., Mootha, V. K., Mukherjee, S., Ebert, B. L., Gillette, M. A., et al. (2005). Gene set enrichment analysis: a knowledge-based approach for interpreting genome-wide expression profiles. Proc. Natl. Acad. Sci. USA 102, 15545–15550. doi: 10.1073/pnas.0506580102
Tang, M. X., Maestre, G., Tsai, W. Y., Liu, X. H., Feng, L., Chung, W. Y., et al. (1996). Relative risk of Alzheimer disease and age-at-onset distributions, based on Apoe genotypes among elderly African Americans, Caucasians, and Hispanics in new York City. Am. J. Hum. Genet. 58, 574–584
Tang, M. X., Stern, Y., Marder, K., Bell, K., Gurland, B., Lantigua, R., et al. (1998). The Apoe-Epsilon4 allele and the risk of Alzheimer disease among African Americans, whites, and Hispanics. JAMA 279, 751–755. doi: 10.1001/jama.279.10.751
Teng, E. L., and Chui, H. C. (1987). The modified Mini-Mental State (3ms) examination. J. Clin. Psychiatry 48, 314–318.
Trudeau, M. M., Dalton, J. C., Day, J. W., Ranum, L. P., and Meisler, M. H. (2006). Heterozygosity for a protein truncation mutation of Sodium Channel Scn8a in a patient with cerebellar atrophy, Ataxia, and Mental retardation. J. Med. Genet. 43, 527–530. doi: 10.1136/jmg.2005.035667
van der Auwera, G., and O’Connor, B. D. (2020). Genomics in the cloud: Using Docker, Gatk, and Wdl in Terra. O’Reilly media.
Vardarajan, B. N., Faber, K. M., Bird, T. D., Bennett, D. A., Rosenberg, R., Boeve, B. F., et al. (2014). Age-specific incidence rates for dementia and Alzheimer disease in Nia-Load/Ncrad and Efiga families: National Institute on Aging genetics initiative for late-onset Alzheimer disease/National Cell Repository for Alzheimer disease (Nia-Load/Ncrad) and Estudio familiar De Influencia Genetica En Alzheimer (Efiga). JAMA Neurol. 71, 315–323. doi: 10.1001/jamaneurol.2013.5570
Wagnon, J. L., Barker, B. S., Ottolini, M., Park, Y., Volkheimer, A., Valdez, P., et al. (2017). Loss-of-function variants of Scn8a in intellectual disability without seizures. Neurol Genet 3:e170. doi: 10.1212/NXG.0000000000000170
Wang, K., Li, M., and Hakonarson, H. (2010). Annovar: functional annotation of genetic variants from high-throughput sequencing data. Nucleic Acids Res. 38:e164. doi: 10.1093/nar/gkq603
Watanabe, K., Taskesen, E., van Bochoven, A., and Posthuma, D. (2017). Functional mapping and annotation of genetic associations with Fuma. Nat. Commun. 8:1826. doi: 10.1038/s41467-017-01261-5
Yamada, D., Kawabe, K., Tosa, I., Tsukamoto, S., Nakazato, R., Kou, M., et al. (2019). Inhibition of the glutamine transporter Snat1 confers neuroprotection in mice by modulating the Mtor-autophagy system. Commun. Biol. 2:346. doi: 10.1038/s42003-019-0582-4
Yang, Z., Wang, C., Liu, L., Khan, A., Lee, A., Vardarajan, B., et al. (2023). Carma is a new Bayesian model for fine-mapping in genome-wide association Meta-analyses. Nat. Genet. 55, 1057–1065. doi: 10.1038/s41588-023-01392-0
Yu, J. T., Mao, C. X., Zhang, H. W., Zhang, Q., Wu, Z. C., Yu, N. N., et al. (2011). Genetic association of Rs11610206 Snp on chromosome 12q13 with late-onset Alzheimer's disease in a Han Chinese population. Clin. Chim. Acta 412, 148–151. doi: 10.1016/j.cca.2010.09.024
Yuan, D. J., Yang, G., Wu, W., Li, Q. F., Xu, D. E., Ntim, M., et al. (2022). Reducing Nav1.6 expression attenuates the pathogenesis of Alzheimer's disease by suppressing Bace1 transcription. Aging Cell 21:e13593. doi: 10.1111/acel.13593
Zhou, H., Alexander, D., and Lange, K. (2011). A quasi-Newton acceleration for high-dimensional optimization algorithms. Stat. Comput. 21, 261–273. doi: 10.1007/s11222-009-9166-3
Keywords: Alzheimer disease, chromosome 12, genome-wide association study, admixture mapping, Puerto Ricans
Citation: Akgun B, Feliciano-Astacio BE, Hamilton-Nelson KL, Scott K, Rivero J, Adams LD, Sanchez JJ, Valladares GS, Tejada S, Bussies PL, Silva-Vergara C, Rodriguez VC, Mena PR, Celis K, Whitehead PG, Prough M, Kosanovic C, Van Booven DJ, Schmidt MA, Acosta H, Griswold AJ, Dalgard CL, McInerney KF, Beecham GW, Cuccaro ML, Vance JM, Pericak-Vance MA and Rajabli F (2024) Genome-wide association analysis and admixture mapping in a Puerto Rican cohort supports an Alzheimer disease risk locus on chromosome 12. Front. Aging Neurosci. 16:1459796. doi: 10.3389/fnagi.2024.1459796
Edited by:
Emilia Vitale, National Research Council (CNR), ItalyReviewed by:
Richard Sherva, Boston University, United StatesQi Wang, Arizona State University, United States
Copyright © 2024 Akgun, Feliciano-Astacio, Hamilton-Nelson, Scott, Rivero, Adams, Sanchez, Valladares, Tejada, Bussies, Silva-Vergara, Rodriguez, Mena, Celis, Whitehead, Prough, Kosanovic, Van Booven, Schmidt, Acosta, Griswold, Dalgard, McInerney, Beecham, Cuccaro, Vance, Pericak-Vance and Rajabli. This is an open-access article distributed under the terms of the Creative Commons Attribution License (CC BY). The use, distribution or reproduction in other forums is permitted, provided the original author(s) and the copyright owner(s) are credited and that the original publication in this journal is cited, in accordance with accepted academic practice. No use, distribution or reproduction is permitted which does not comply with these terms.
*Correspondence: Farid Rajabli, ZnhyMjEzQG1lZC5taWFtaS5lZHU=
†These authors have contributed equally to this work and share senior authorship