 Jingzhi Yang
 Shuo Wu2†
- 1Institute of Translational Medicine, Shanghai University, Shanghai, China
- 2Neurology Department, Shanghai Baoshan Luodian Hospital, Shanghai, China
- 3Department of Internal Medicine, Shanghai Baoshan Elderly Nursing Hospital, Shanghai, China
- 4School of Medicine, Shanghai University, Shanghai, China
- 5Suzhou Innovation Center of Shanghai University, Suzhou, Jiangsu, China
Introduction: Alzheimer's disease (AD) is a leading cause of dementia, and it has rapidly become an increasingly burdensome and fatal disease in society. Despite medical research advances, accurate recognition of AD remains challenging. Epidemiological evidence suggests that metabolic abnormalities are tied to higher AD risk.
Methods: This study utilized case-control analyses with plasma samples and identified a panel of 27 metabolites using high-resolution mass spectrometry in both the Alzheimer's disease (AD) and cognitively normal (CN) groups. All identified variables were confirmed using MS/MS with detected fragmented ions and public metabolite databases. To understand the expression of amyloid beta proteins in plasma, ELISA assays were performed for both amyloid beta 42 (Aβ42) and amyloid beta 40 (Aβ40).
Results: The levels of plasma metabolites PAGln and L-arginine were found to significantly fluctuate in the peripheral blood of AD patients. In addition, ELISA results showed a significant increase in amyloid beta 42 (Aβ42) in AD patients compared to those who were cognitively normal (CN), while amyloid beta 40 (Aβ40) did not show any significant changes between the groups. Furthermore, positive correlations were observed between Aβ42/Aβ40 and PAGln or L-arginine, suggesting that both metabolites could play a role in the pathology of amyloid beta proteins. Binary regression analysis with these two metabolites resulted in an optimal model of the ROC (AUC = 0.95, p < 0.001) to effectively discriminate between AD and CN.
Discussion: This study highlights the potential of advanced high-resolution mass spectrometry (HRMS) technology for novel plasma metabolite discovery with high stability and sensitivity, thus paving the way for future clinical studies. The results of this study suggest that the combination of PAGln and L-arginine holds significant potential for improving the diagnosis of Alzheimer's disease (AD) in clinical settings. Overall, these findings have important implications for advancing our understanding of AD and developing effective approaches for its future clinical diagnosis.
1. Introduction
Alzheimer's disease (AD) is a form of neurological dementia that is progressive and irreversible; it has a significant negative impact on people's lives, society, and the economy (2021). Numbers of biochemical processes are affected in AD pathologies, which include the breakdown of amyloid precursor proteins, the phosphorylation of tau proteins, oxidative stress, poor energy, mitochondrial dysfunction, inflammation, membrane lipid dysregulation, or disruption of neurotransmitter pathways (de la Monte and Tong, 2014; Procaccini et al., 2016). It is increasingly clear that many neurodegenerative diseases have a pre-symptomatic phase, during which pathological changes accumulate prior to the onset of symptoms (Golde, 2022). Thereof, early diagnosis and therapy during the progression of AD are critical and a rapid pace of development should be adopted (Cummings et al., 2022). Nevertheless, the challenge of obtaining a prompt and accurate diagnosis has hindered the development of therapies for Alzheimer's disease (AD). As reported in a previous study, AD clinical trials are characterized by up to 80% screen failure rates (Aisen et al., 2016). Biomarkers enable the identification of the onset, profile, and severity of neurodegeneration-related brain alterations in particular patients who are in need of diagnosis, prognosis, and usage in clinical trials—as both inclusion and outcome measures—as the fieldwork to treat patients sooner and earlier (Bendlin and Zetterberg, 2022). The National Institute on Aging and Alzheimer's Association (NIA-AA) has proposed a research framework for using A/T/N biomarkers of β amyloid, tau, and neurodegeneration biomarkers to define Alzheimer's disease. These A/T/N biomarkers shall also serve as continuous measures to reflect different cognitive stages (Jack et al., 2018).
Currently, the availability of amyloid beta (A) PET and cerebrospinal fluid (CSF) biomarker tests for amyloid beta peptides, tau, and other neuroproteins (A/T/N classifiers) enables their use to diagnose brain amyloid pathology. However, there is still an unmet need for an accessible, radiation-free, minimally invasive, economical, quick, and analytically validated diagnostic approach to simplify clinical trial enrollment (Jack et al., 2016). Besides, the biochemical and physiological changes in the brain that characterize the illness beyond amyloid and tau deposition are still poorly understood, even though AD is currently characterized based on amyloid-plaque and tau neurofibrillary tangle deposition inside the neocortex (Jack et al., 2018).
Metabolome analysis has emerged as a novel strategy for the development of disease biomarkers in diagnosis, as well as for monitoring the progression of the disease with its underlying pathophysiology (Trivedi et al., 2017). The metabolome is a collection of small molecules that is produced by metabolic processes, arranged in biochemical pathways. It is impacted by various internal and external variables, including genetics (Holmes et al., 2008). It has been indicated that metabolomics appears to be of uttermost relevance in AD as several metabolic changes, such as higher insulin and insulin resistance levels, are associated with an increased risk of AD (Schrijvers et al., 2010). Thus, metabolites are now crucial diagnostic indicators of dementia before memory loss, defining its presence or absence.
As the plasma metabolome interacts and exchanges molecules with every organ and tissue, including the brain, it reflects various physiological and pathological changes. This makes it a promising avenue for identifying biomarkers for a range of disorders. Furthermore, interorgan communication is an important and conserved mechanism that maintains body homeostasis. Dysregulation of the systemic homeostatic system would result in metabolic and neurological disorders (Vogt and Bruning, 2013; Deleidi et al., 2015). Moreover, plasma is a bodily fluid that is simple to obtain and causes minimal discomfort to patients, which allows for the collection from large cohorts and repeated sampling (Lawton, 2008). Therefore, it is worth studying the systemic changes in blood metabolite levels associated with AD.
Analytical techniques have significantly improved, with high-resolution mass spectrometry (HRMS) instruments being readily available for determining the majority of chemical compounds (Niedzwiecki et al., 2020). Apart from determining the accurate properties of these metabolites, collective quantification is of great importance for metabolism study (Koek et al., 2011). The most popular mass spectrometers for UHPLC-HRMS are Orbitrap (OT) or TOF-based systems, as they enable the best MS data acquisition. However, according to instrument investigation, the resolution of a UHPLC-coupled OT instrument has been sacrificed in favor of achieving greater separation with higher acquisition rates (Kaufmann, 2018; de Souza et al., 2021). Furthermore, in line with our previous research on the discovery of AD urine metabolites, the OT systems for molecule detection displayed impressive stability performance (Zhang et al., 2022). Moreover, recent research that employs powerful bioinformatic techniques and high-throughput measurements of hundreds of metabolites has thoroughly documented the molecular alterations and disease-related pathways (Chandler et al., 2016; Sales et al., 2017; Uppal et al., 2017; Zhuang et al., 2021).
We performed a metabolomic analysis of the plasma of patients with AD and CN using high-resolution mass spectrometry (HRMS) from these viewpoints. Our current investigation supports the application of metabolomics analysis as a discrimination test between AD and CN, which may provide new insight for future clinical diagnosis.
2. Methods
2.1. Participant ascertainment and ethics approval
During the visits to the Shanghai Baoshan Senior Care Home, Baoshan District, No. 5425 Gonghe New Road, individuals between 60 and 80 years of age were recruited as participants, and a wide range of biospecimens and health indicators were collected. Standard cognitive screening, which includes medical history assessment, cognitive examination, and blood sampling, was conducted for all patients with Alzheimer's disease (AD). Regular biomedical indicators were obtained for cognitively normal (CN) individuals. The ethics committee of Shanghai Baoshan Luodian Hospital approved this study prior to the acquisition of clinical and genetic participants' data (Approval number: LDYY-KY-2020-04). The study was performed in accordance with the ethical standards laid down in the 1964 Declaration of Helsinki and its later amendments.
2.2. ADAS-Cog assessment and participants' grouping
All study participants were fully informed of this research work, and written informed consent was obtained from all participants. The Alzheimer's Disease Assessment Scale—Cognitive (ADAS-Cog) Subscale test is a widely used cognitive test in research studies and clinical trials (Kueper et al., 2018; Zhang et al., 2022) and, therefore, was administered to evaluate the participants' recognition ability before the wet-lab experiments. Scores on the ADAS-Cog test range from 0 to 75, with a score above 18 indicating recognition impairment and leading to enrollment in the AD group. Conversely, a score below 18 indicates normal recognition ability and leads to enrollment in the CN group.
2.3. Plasma samples collection
Briefly, blood was collected in the morning, following an overnight fast of at least 8 h. EDTA blood tubes were used for plasma collection, which were then centrifuged at a speed of 3,000 g for 15 min at room temperature. The resulting supernatant was transferred and aliquoted into polypropylene tubes of 0.5 mL and stored at −80°C until further use. Quality control (QC) plasma was prepared by pooling an equal amount of individual plasma samples and was utilized to assess downstream sample preparation and MS measurements' stability.
2.4. Plasma protein biomarkers quantification
Plasma contents of total tau, APOE, amyloid beta-peptide 1-40, and amyloid beta-peptide 1-42 were measured using commercial ELISA kits according to the manufacturer's instructions (Total Tau, KHB0041, Invitrogen; APOE, ELH-ApoE4-1, RayBiotech; Amyloid beta 1-40, RE59781, IBL, and Amyloid beta 1-42, KHB3544, Thermo Fisher Scientific). Briefly, standard assays for detecting radioimmunoprecipitation assay-soluble samples were applied to the ELISA plates. After washing, a biotin-conjugated detection antibody was applied. Then, the positive reaction was enhanced with streptavidin–horseradish peroxidase and colored by 3,3′,5,5′-tetramethylbenzidine. The absorbance at 450 nm was applied, and the concentrations of four different proteins were calculated from the standard curves. All measurements were carried out in one round of experiments, and the results were read on a microplate photometer (MultiskanTM FC, Thermo Fisher).
2.5. HRMS on untargeted metabolomics
The aliquoted frozen plasma sample was thawed and centrifuged at 14,000 g for 5 min. A measure of 300 microliters of methanol was added to 100 μL aliquot of plasma samples, vortexed for 5 min, and centrifuged at 14,000 g for another 5 min. The supernatant was transferred into a plastic tube, evaporated to dryness under a stream of nitrogen at 40°C, and reconstituted in 100 μL of acetonitrile, which contains 5 μg/mL 2-Chloro-L-phenylalanine (Sigma-Aldrich). A 5.0-μL aliquot of the reconstituted solution was injected into the UPLC MS system for online data acquisition. The same sample preparation steps were applied for QC samples. The plasma metabolites were separated on a Waters HPLC Column (XSelect HSS T3, 2.1 X 100 mm, 2.5 μm, MA, USA) that equilibrated at 37°C. The mobile phase consisted of 0.1% formic acid in water (A) as the aqueous phase and 0.1% formic acid in acetonitrile as the organic phase. The gradient elution (min, B) was set as 20 min: 0.0–2.0, 5%; 2.0–6.0, 50%; 6.0–15.0, 95%; 15.0–18.0, 95%; and 18.0–20.0, 5%. The eluent flow rate was set to 0.3 mL/min.
Sample extracts were analyzed using UPLC interfaced with the high-resolution MS system of Orbitrap (Dionex Ultimate 3000, Q-Exactive Plus, Thermo Scientific) in the positive electrospray ionization (ESI+) mode. The mass range was set to m/z 65–975. For the MS scan, the MS resolution was set to 35,000 with the automatic gain control (AGC) target set to 1 × 10⁶ and the maximum ions injection time was set to 100 ms. For the MSMS scan, the MS resolution was set to 17,500 with the automatic gain control (AGC) target set to 1 × 10⁵, and the maximum ion injection time was set to 50 ms. The stepped normalized collision energy (NCE) consisted of 20%, 25%, and 30% for ion fragmentation, and the isolation window was narrowed to 1.0 m/z for improving the MS feature identification. MS injection order followed the previous batch sequence setting (Zhang et al., 2022). In brief, QC samples were placed at the beginning, in between the samples, and at the end of the whole batch to examine the stability of the MS method.
2.6. Database search, data cleaning, and evaluation
The MS data underwent processing using Thermo Compound Discover 3.1 (Thermo Scientific, USA). An “Untargeted metabolomics workflow” was used to extract MS features and identify the nature of the compounds. In brief, MS raw files including QCs, ADs, and CNs were introduced into the data study. A specific sample type was selected for each of the individual raw data. The custom “Workflow Tree” was optimized according to the HRMS settings. Databases of mzCloud and mzVault were selected for compound identification. Then, the analysis was submitted to the job queue and resulted in a list with compound features, MS intensities, retention time (RT), MSMS spectrum, and so on. According to the database search results, MS features with more than 20% missing values were removed as these signals' quality was deemed uncertain for further validation and quantification. Also, those calculated MS intensities of lower than 10,000 were not included as their plasma levels were too low to be quantified with this method. To evaluate the stability of this untargeted approach, the intensities of selected metabolites and the internal standard (2-Chloro-L-phenylalanine) in all QC samples were analyzed.
2.7. Metabolome-wide association study
Metabolome-wide association study (MWAS) was conducted with Simca-P 14.1 software (Umetrics, Umea, Sweden) (Wheelock and Wheelock, 2013). Data of normalized LC/MS peak areas were imported for multivariate analysis. Principal component analysis (PCA), partial least-squares discriminant analysis (PLS-DA), and orthogonal partial least-squares discriminant analysis (OPLS-DA) were performed separately for model development. The quality of the model was tested by cross-validation and permutation (Szymańska et al., 2012) and evaluated by the values of R2X, R2Y, and Q2. By default, the model was run through seven rounds of cross-validation to establish the optimal number of principal components to minimize overfitting and the fact that both Q2 and R2 were near to 1, which shows that the model is excellent (Liang et al., 2011).
2.8. Metabolic pathway analysis
A metabolic pathway may be conceived of as a group of metabolites that arise from various regions of the metabolome and cooperate to control the processes of AD. Moreover, we looked at regulatory signatures related to the AD disease process using network extraction approaches. Thus, the Mummichog analysis was carried out using MetaboAnalyst (version 5.0). To identify m/z characteristics with a statistical significance of p < 0.05, Student's t-test analysis was performed. Features of m/z with calculated significance were then matched to the metabolic models of Kyoto Encyclopedia of Genes and Genomes (KEGG). Following validation of the m/z features that were mapped onto the metabolite networks, statistically significant values were reported. We took advantage of that technique to present further data on potential metabolic variations between AD and CN.
2.9. Metabolites MS/MS validation and semi-quantification
Metabolite annotation and identification were performed using both spectra of MS and MS/MS, which were further validated with the HMDB (https://hmdb.ca/) and PubChem (https://pubchem.ncbi.nlm.nih.gov/) databases. The MS and MS/MS fragments were all examined in each of the individual MS spectra. Discriminatory features that were associated with the significantly enriched pathways and a p < 0.05 were selected for semi-quantitation analysis. The semi-quantification was performed by calculating the relative responses (Rel. Res) of each metabolite, and the equation is listed as follows:
Further, the calculated relative responses were used to investigate the statistical differences between the AD and CN groups.
2.10. Statistical analysis
Continuous variables were compared using Student's t-test or the Mann–Whitney U-test. The area under the receiver operating characteristic curve [ROC (AUC)] was calculated to perform the discrimination power of the potential biomarkers for AD. Differential expression with metabolites and proteins between the AD and CN groups was demonstrated as boxplots. The correlation analysis was conducted between AD metabolites and protein biomarkers. Analyses were performed using GraphPad Prism (version 9.0.0, San Diego, USA). A p < 0.05 was considered statistically significant.
3. Results
3.1. Demographics characteristics of participants
Based on the results of the Alzheimer's Disease Assessment Scale—Cognitive (ADAS-Cog) Subscale, 29 participants scored between 53 and 75 and were classified as belonging to the Alzheimer's disease (AD) group, with an average score of 72.65 ± 5.56. Additionally, 29 participants scored between 0 and 16.5 and were included in the cognitively normal (CN) group, with an average score of 6.48 ± 6.45. Among the study participants, 63.3% of females were in the AD group, while 58.6% were in the CN group. Although the average education year was longer in the CN group (6y ± 3) than in the AD group (4y ± 2), there was no significant difference between the two groups. The average ages of the AD and CN groups were 69.0 years ± 3.60 and 72.1 years ± 7.1, respectively, with no significant difference in the age distribution between the two groups (Table 1).
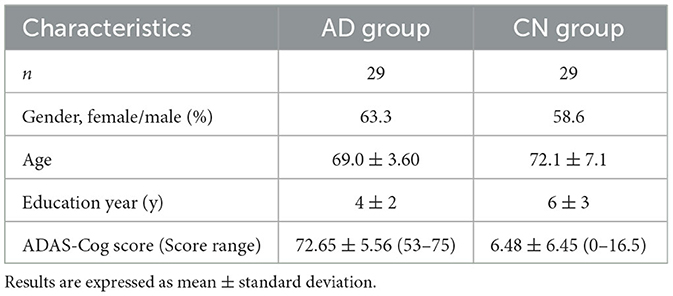
Table 1. Demographic characteristics of the AD and CN groups.
3.2. AD protein biomarkers measurements
The biomarkers for AD protein, such as Amyloid beta 1-42 (Aβ42), Amyloid beta 1-40 (Aβ40), t-tau, and APOE, were measured in both the AD and CN groups, and the Aβ42/Aβ40 ratio was calculated. The plasma concentration of Aβ42 was noted to increase while the plasma concentrations of t-tau and APOE were observed to decrease significantly (p < 0.0001) in individuals with AD as compared to those without (CN). However, no significant difference was found in Aβ40 levels between the AD and CN groups. These observations are tabulated in Table 2 and are depicted as comparative boxplots in Supplementary Figure 1.
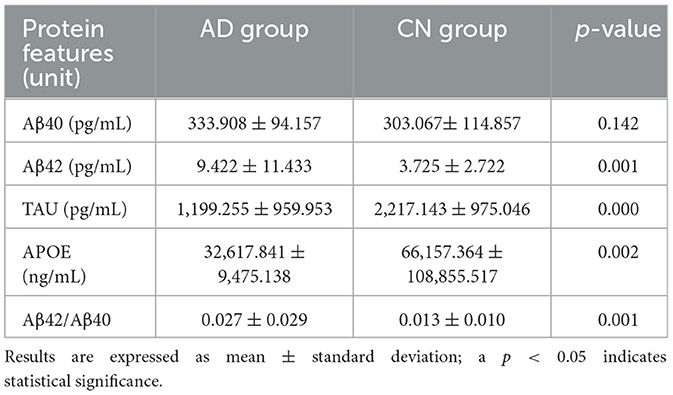
Table 2. Plasma protein feature measurements by ELISA.
3.3. MWAS results
Using a high-resolution MS platform for the purpose of metabolome profiling, 612 distinct m/z characteristics with projected formulas or chemical names were acquired, where only those characteristics with an average batch determination rate of 80% or above were considered for further study (data are shown in Supplementary Table 1). Subsequently, a selection of the relative intensities was made, where those with CV% values <30% were chosen as criteria for further investigation, ultimately narrowing the list of chemicals down to 42. The databases of HMDB and PubChem were then utilized to validate the compound resources and MSMS fragmentation. This process resulted in the formation of a final endogenous compound list of 27 metabolites for the investigation of metabolite expression in both AD and CN groups (Table 3). The CV% of QC results was analyzed to ensure a convincing result in downstream analysis. As a result, the MS areas of nine QC samples were calculated for 27 metabolites and one internal standard, where the maximum value of the CV% is 23.1% for arachidonic acid and the minimum value of the CV% is 3.9% for 2-Chloro-L-phenylalanine. On average, the CV% value of the 28 compounds is 9.7%, indicating the MS measurement has good stability (refer to Table 4). Additionally, a plot of the average signal intensities and their standard deviations of 28 compounds are depicted in Figure 1.
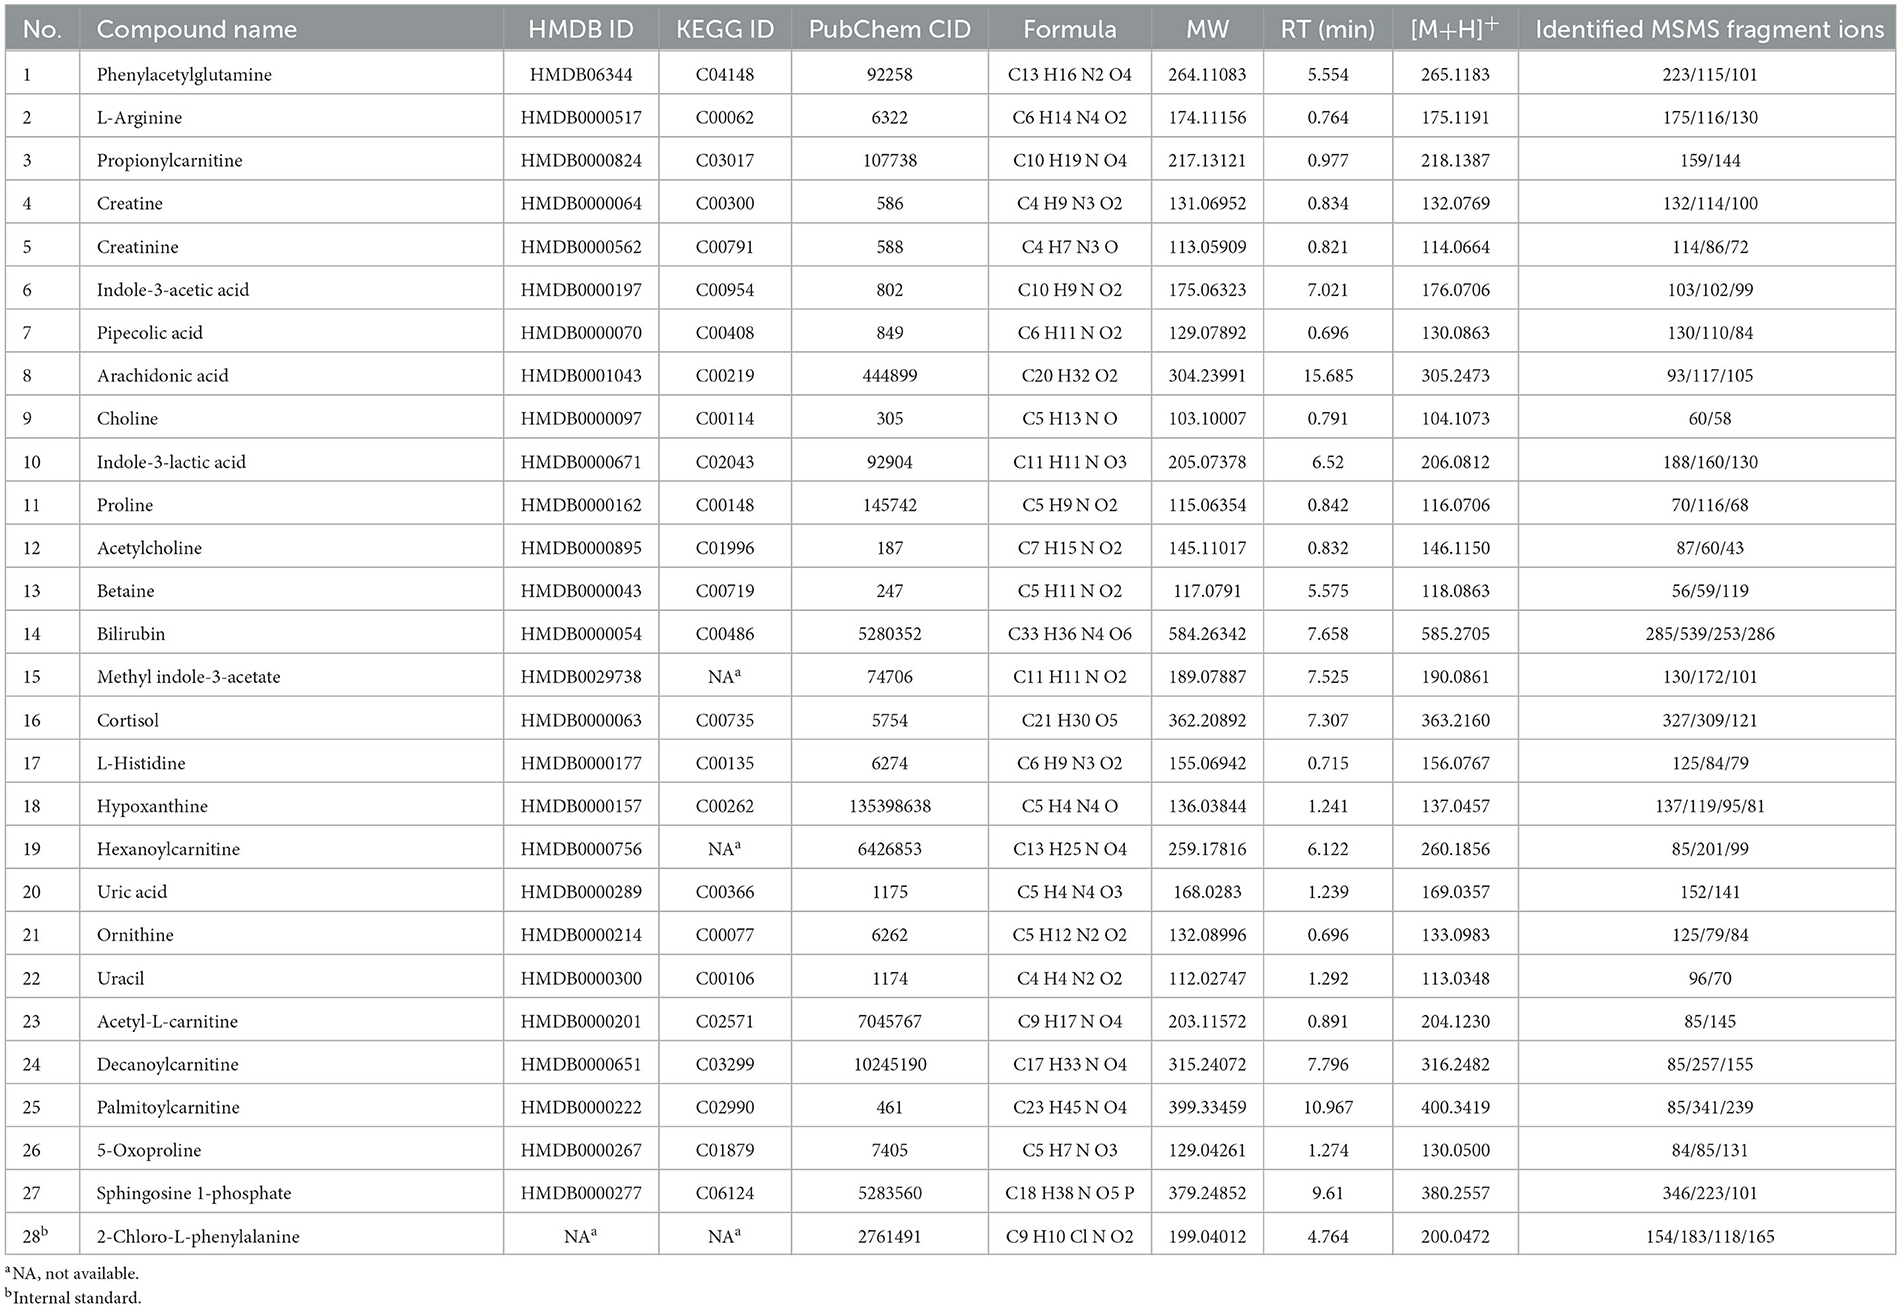
Table 3. Mass spectrometric characteristics of plasma metabolites and internal standard.

Table 4. Mass spectrometric signal intensities of 28 compounds in quality control (QC) samples across the analytical batch.
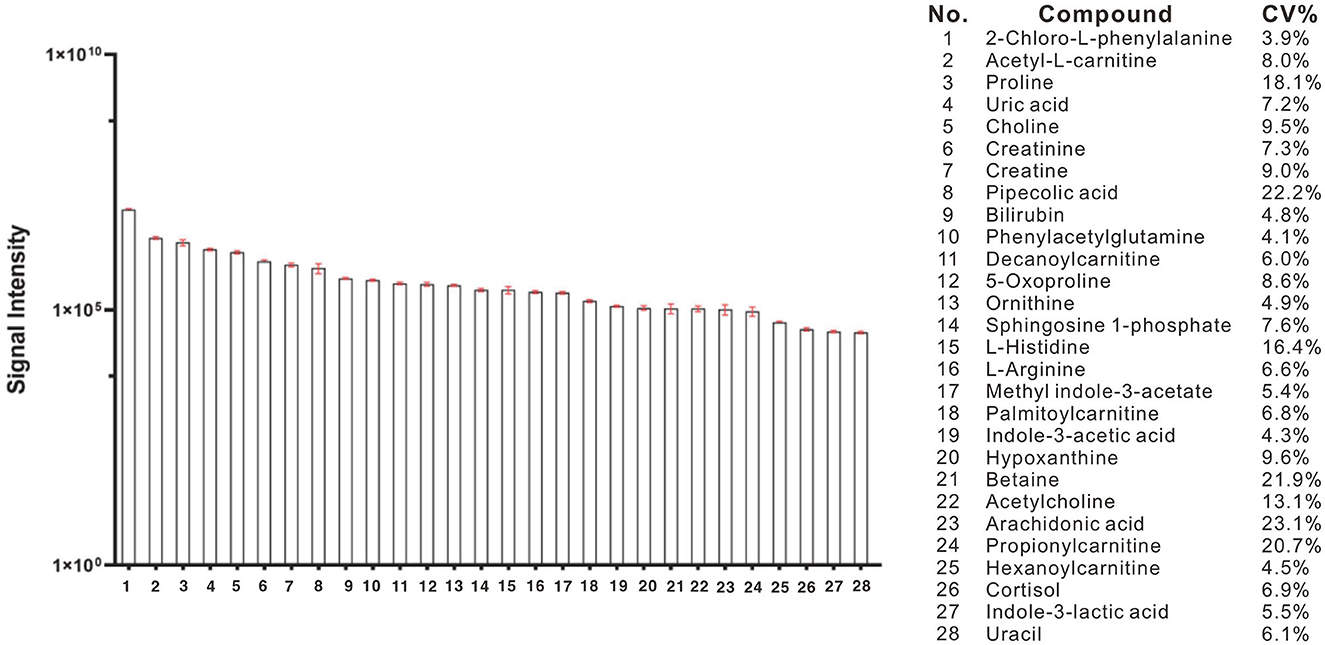
Figure 1. Bar column of average intensities and standard deviations of 28 compounds, including 27 metabolites and an internal standard of 2-Chloro-L-phenylalanine in all QC samples across the entire MS-analytical batches.
3.4. Discrimination model evaluation
A principal component analysis (PCA) model was conducted with identified metabolites. The PCA (R2X = 0.331 Q2 = 0.081) scores plot showed an approximate separation between the AD and CN groups (Figure 2A), indicating a tendency of inter-group clustering. Additionally, the partial least-squares discriminant analysis (PLS-DA) model (R2X = 0.289, R2Y = 0.477, Q2 = 0.342) and orthogonal partial least-squares discriminant analysis (OPLS-DA) model (R2X = 0.297, R2Y = 0.456, Q2 = 0.35) were performed to compare the AD and CN groups. The corresponding score plots depicted in Figures 2B, C revealed a noticeable disjunction between the two groups. Moreover, a three-dimensional (3D) plot of the OPLS-DA model (Figure 2D) displayed a distinct separation between the AD and CN groups. These outcomes indicate plasma metabolic variations in AD patients.
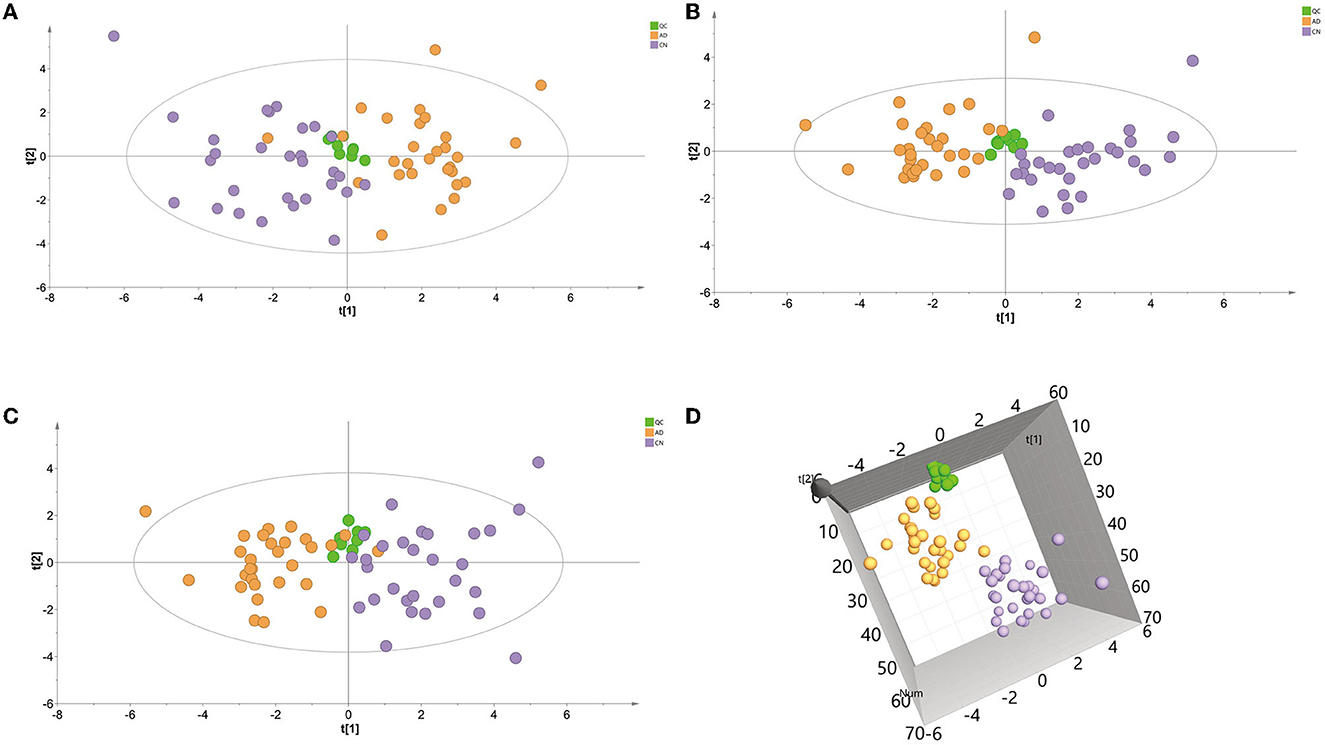
Figure 2. Multivariate data analysis of plasma samples in the ESI-positive mode. (A) Principal components analysis (PCA) score plot of the QC, AD, and CN groups. (B) Partial least-squares discriminant analysis (PLS-DA) score plot of the QC, AD, and CN groups. (C) Orthogonal partial least-squares discriminant analysis (OPLS-DA) score plot of the QC, AD, and CN groups. (D) A three-dimensional plot of the OPLS-DA model.
3.5. Pathway analysis
The impact pathway was analyzed using MetaboAnalyst 5.0 (http://www.metaboanalyst.ca/). The results indicated that 27 endogenous metabolites were of close relevance to five biological pathways presenting statistical significance, which included the following: (1) arginine and proline metabolism, (2) glycine, serine, and threonine metabolism, (3) arginine biosynthesis, (4) aminoacyle-tRNA biosynthesis, and (5) beta-alanine metabolism. The p-values obtained for these metabolites were as follows: 0.0009, 0.0068, 0.0119, 0.0191, and 0.0260, respectively. The KEGG pathway produced a bubble plot, which is shown in Figure 3A, while the metabolic features' enrichment result is displayed in Figure 3B. All pathways and their related metabolites are summarized in Table 5.
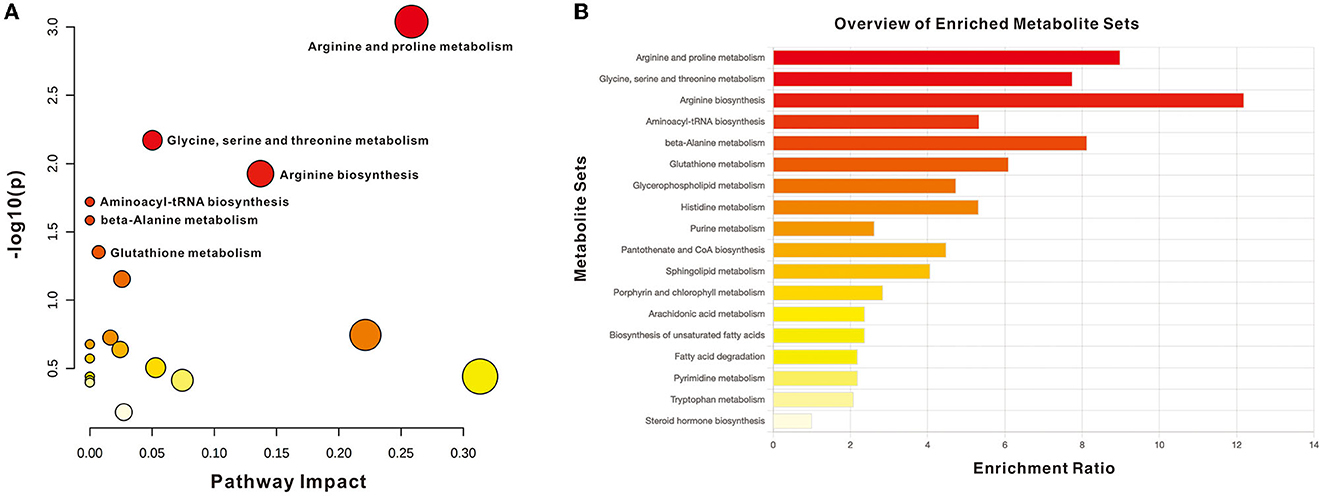
Figure 3. Summary of pathway analysis with MetaboAnalyst. (A) Pathway impact with significance (p < 0.05): arginine and proline metabolism, glycine, serine, and threonine metabolism, arginine biosynthesis, Aminoacyle-tRNA biosynthesis, and beta-alanine metabolism. (B) Metabolite sets enrichment overview.
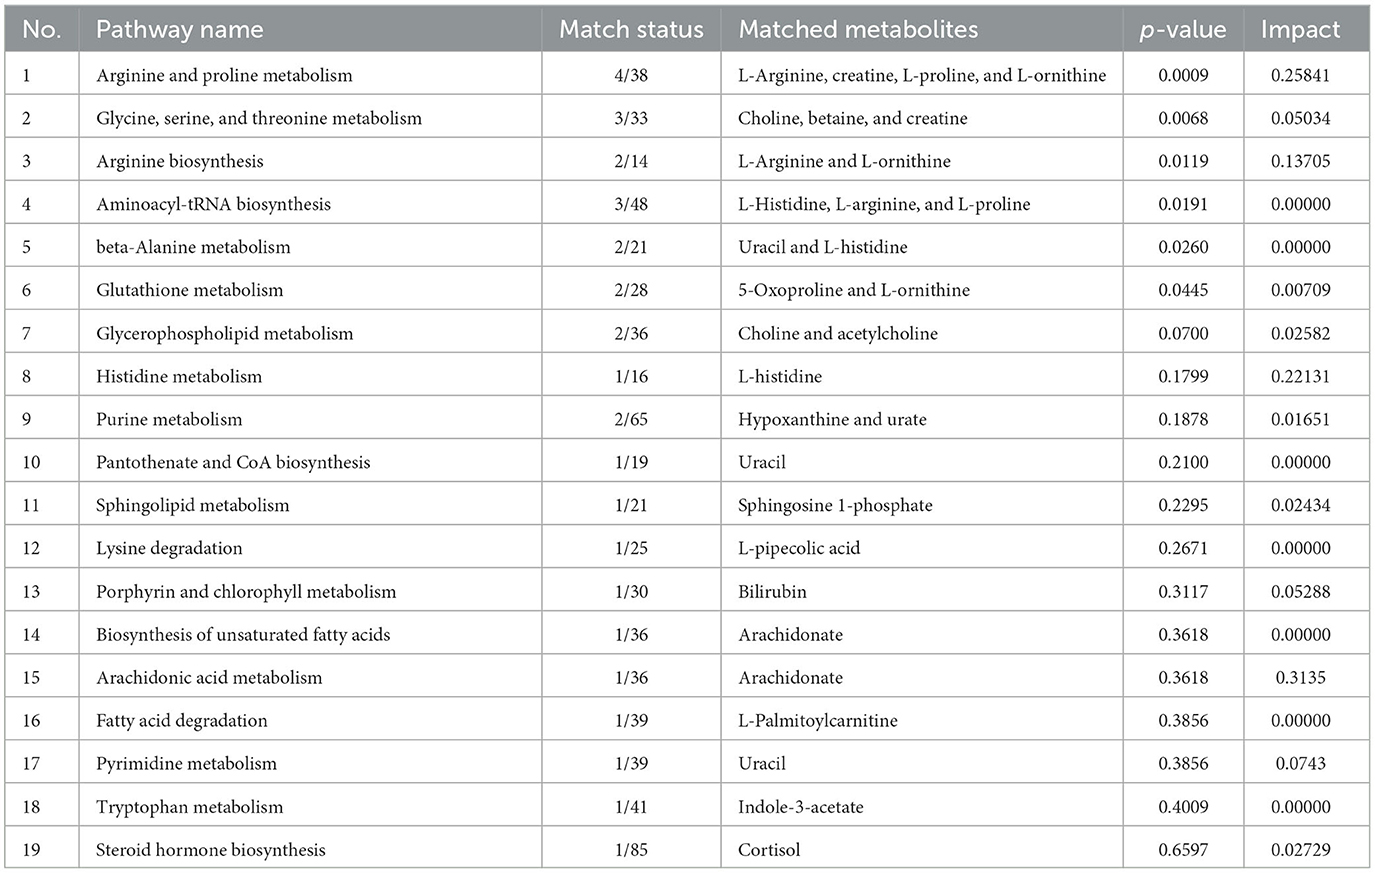
Table 5. KEGG-enriched molecular pathway with identified metabolites.
3.6. Potential plasma metabolic biomarkers of the AD and CN groups
Within the selected 27 endogenous metabolites, 14 compounds exhibited different regulation trends between the AD and CN groups. Specifically, phenylacetylglutamine and L-arginine were upregulated in the AD group compared with the CN group; acetyl-L-carnitine, sphingosine 1-phosphate, palmitoylcarnitine, 5-oxoproline, uracil, uric acid, hypoxanthine, L-histidine, decanoylcarnitine, ornithine, betaine, and cortisol exhibited downregulation in the AD group compared with the CN group. The expressions of metabolites that were upregulated and downregulated are presented as boxplots in Figure 4. However, the remaining 13 components showed no significant change between the AD and CN groups, and corresponding boxplots are included in Supplementary Figure 2.
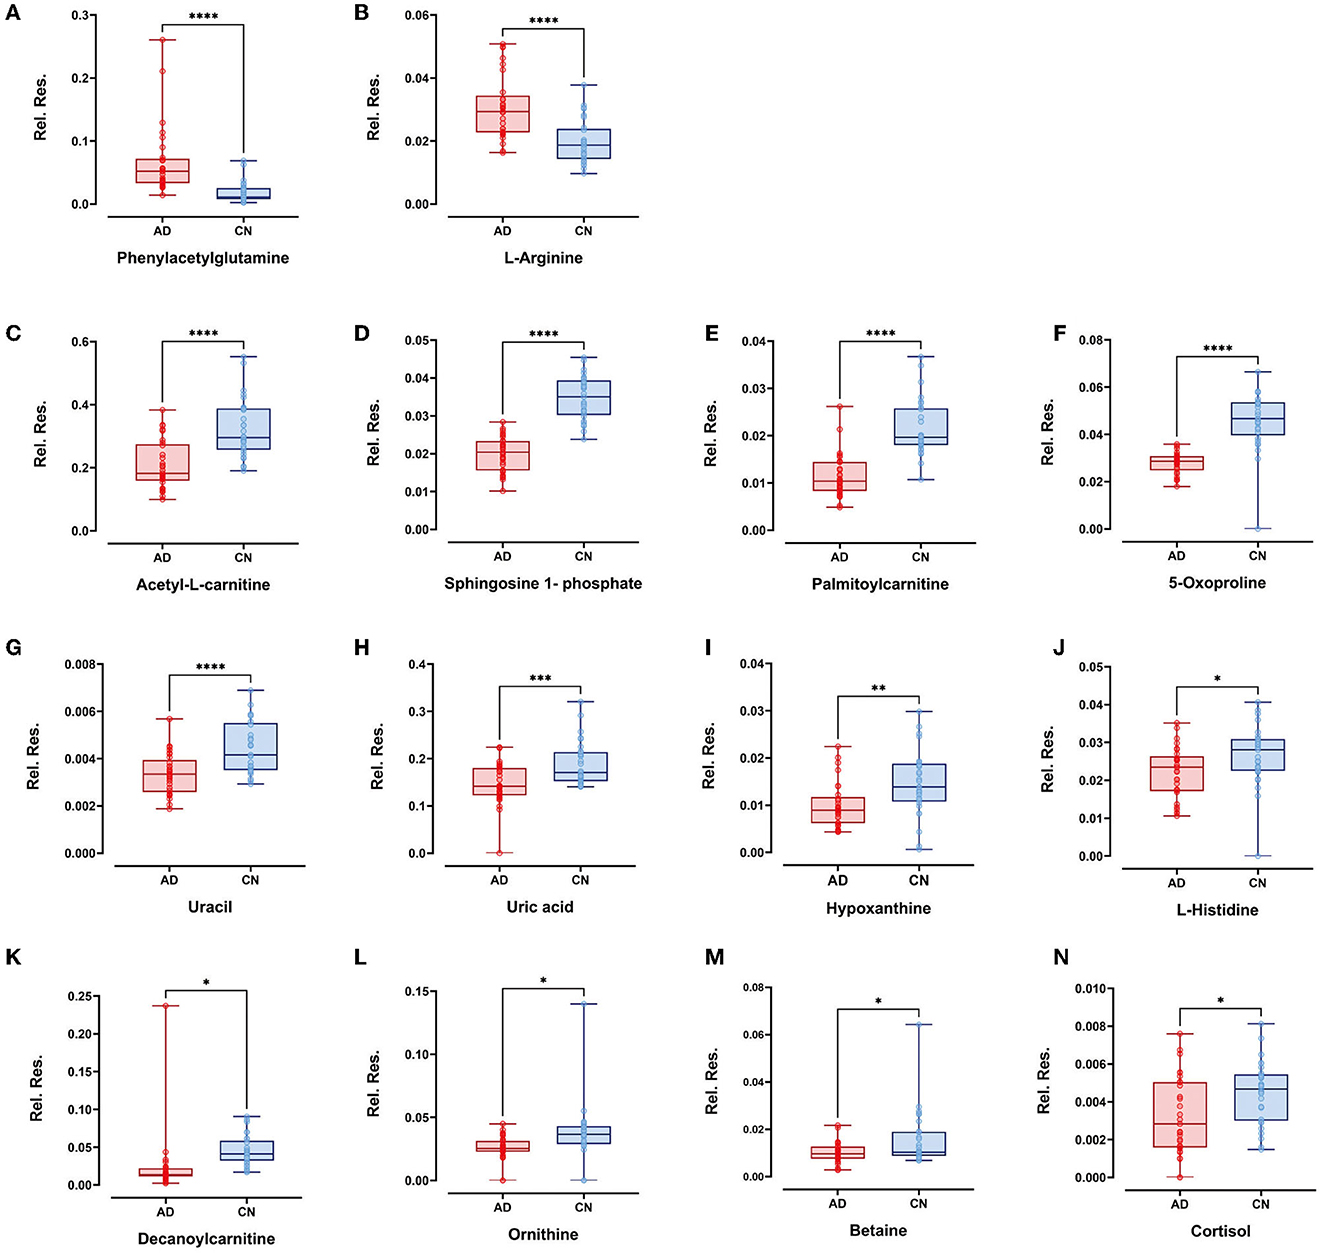
Figure 4. Boxplots showed upregulated plasma metabolites of (A) phenylacetylglutamine and (B) L-arginine (p < 0.0001). Boxplots showed downregulated plasma metabolites of (C) acetyl-L-carnitine, (D) sphingosine-1-phosphate, (E) palmitoylcarnitine, (F) 5-oxoproline, (G) uracil (p < 0.0001), (H) uric acid (p < 0.001); (I) hypoxanthine (p < 0.01); (J) L-histidine, (K) decanoylcarnitine, (L) ornithine, (M) betaine, and (N) cortisol (p < 0.05). Plots show data points from the minimum value to the maximum value for each group. Light pink dots represent AD patients, sky blue dots represent CN individuals, and dots were vertically aligned on the boxes for each group.
3.7. Discrimination and correlation analysis with plasma biomarkers
The AUCs were utilized in this study to evaluate the diagnostic potential of various biomarkers. A value between 0 and 1 for the AUCs indicated the level of diagnostic accuracy ranging from no to great discrimination. The AUC values >0.8 were identified for phenylacetylglutamine (PAGln) and L-arginine, with AUC (PAGln) = 0.91 (95% confidence interval CI, 0.84, 0.99) and AUC (L-arginine) = 0.83 (95% confidence interval CI, 0.73, 0.93). To enhance the discrimination power of the model, a binary logistic regression was used with PAGln and L-arginine, which resulted in a model with an AUC of ROC of 0.95 (95% confidence interval CI, 0.90, 1.00). Figure 5A illustrates the ROC curves of the potential metabolic biomarkers. In addition, ROC analysis was performed to compare the discrimination ability between potential proteins and MS-discovered metabolites using Aβ42 and the ratio of Aβ42/Aβ40, respectively, with AUC (Aβ42) = 0.76 (95% confidence interval CI, 0.64, 0.89) and AUC (Aβ42/Aβ40) = 0.70 (95% confidence interval CI, 0.56, 0.83). Furthermore, the ROC curves of potential protein biomarkers are shown in Figure 5B. Pearson analysis indicated a positive correlation between Aβ42/Aβ40 and either PAGln or L-Arg. For Aβ42/Aβ40 and PAGln, r = 0.5396, p < 0.0001, while for Aβ42/Aβ40 and L-Arg, r = 0.3240, p < 0.05. Both correlation analyses indicated a statistically significant relationship between novel metabolites and the classical protein ratio (Figure 6).
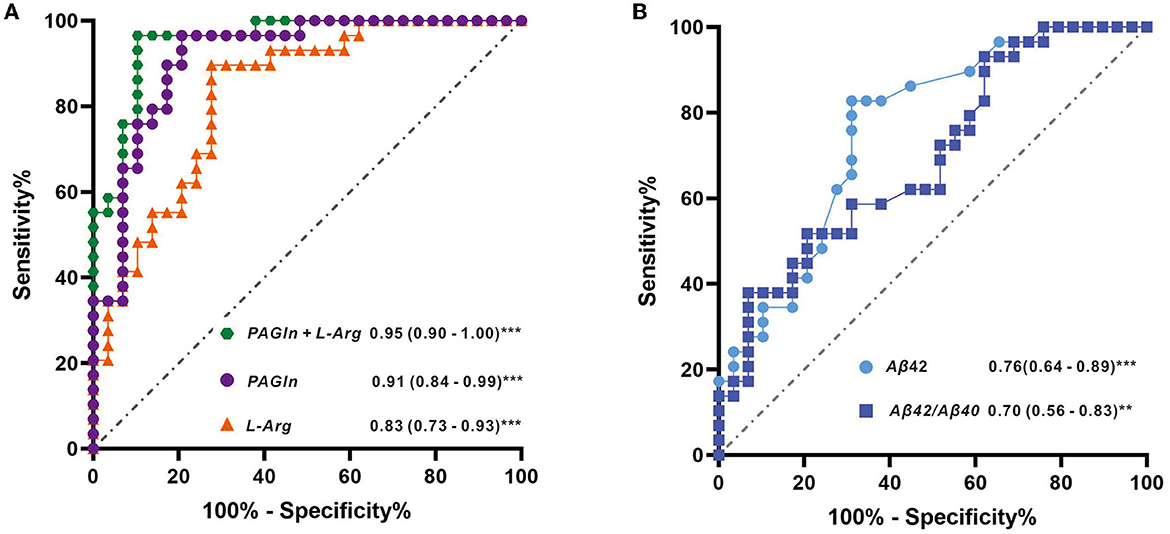
Figure 5. (A) ROC curves with metabolite features of L-arginine, PAGIn, and binary logistic regression of two metabolites (PAGIn + L-Arg) and (B) ROC curves with protein features of Aβ42 and the ratio of Aβ42/Aβ40.
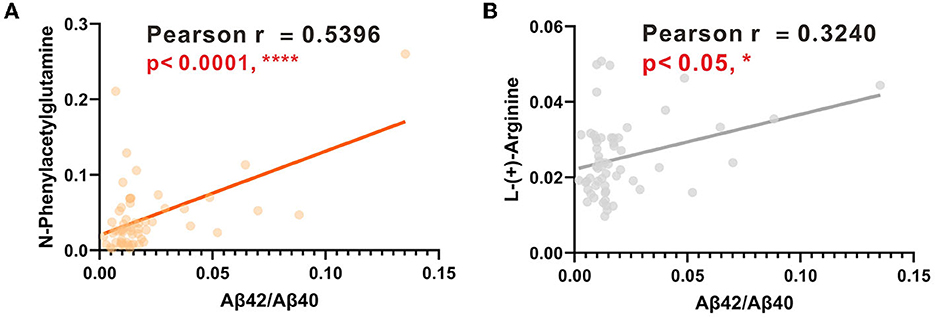
Figure 6. (A) Linear regression analysis between PAGIn and Aβ42/Aβ40. (B) Linear regression analysis between L-Arg and Aβ42/Aβ40.
4. Discussion
There is an unmet demand for an examination that is simple, less intrusive, and affordable in the clinical diagnosis of AD. Untargeted metabolomics presents enormous potential in the exploration of new molecules implicated in the pathogenesis of AD. Using high-resolution mass spectrometry, we found that AD was closely linked to increased plasma levels of phenylacetylglutamine (PAGIn) and L-arginine (L-Arg). Furthermore, the AD group showed lower levels of metabolites of fatty acyls, sphingolipids, and steroids, in addition to other organic acids.
PAGIn, a gut microbiota-derived metabolite, which is derived from the essential amino acid phenylalanine, has been extensively studied as a toxin in chronic kidney disease and adverse cardiovascular events (Aronov et al., 2011; Poesen et al., 2016; Nemet et al., 2020; Yu et al., 2021). Emerging evidence have demonstrated that gut microbiota dysbiosis is functionally connected to brain immune dysfunctions (Sampson and Mazmanian, 2015). Also, the increased permeability of the gut and blood–brain barrier induced by microbiota dysbiosis may mediate or affect AD pathogenesis or other neurodegenerative disorders (Jiang et al., 2017). A metabolic profiling study on Parkinson's disease (PD) using a mass spectrometry-based approach found that PAGIn was significantly elevated in the PD group as compared to the healthy controls, and its metabolic disturbances suggested that proteolytic metabolism was highly activated in PD (Shao et al., 2021). Nevertheless, limited findings have shown the dysregulation of plasma PAGIn in AD. This is our first observation documenting that plasma PAGIn is significantly elevated in AD patients, presenting an excellent discriminating power as a potential metabolite biomarker. Studies suggest that stochastic AD is associated with atherosclerosis, redox stress, inflammatory processes, and/or abnormal neurotransmitter and glucose metabolism in the brain (Yi et al., 2009). Thus, it is probable that PAGIn is involved in one or more pathophysiological processes, as previously stated. However, the underlying causes of PAGIn in Alzheimer's disease still require clarification.
L-Arg is a semi-essential amino acid that can be metabolized to form numerous bioactive molecules. Its involvement in AD is largely based on scattered information from a single pathway (Malinski, 2007). In a study examining arginine metabolism, researchers investigated three areas of the human brain: the superior frontal gyrus (SFG), the hippocampus (HPC), and the cerebellum (CE) in AD patients. They found that L-Arg was significantly elevated in the SFG area of AD patients, while L-ornithine (a product of arginase) showed a dramatic reduction in all three areas in AD (Liu et al., 2014). Interestingly, these findings were consistent with our results in the plasma metabolite investigation. The box plots illustrated that L-Arg was significantly elevated in the AD group, while its byproduct, L-ornithine, notably decreased in the AD group (Figures 4A, L). Furthermore, research has indicated that L-Arg has several direct and indirect effects on human vasculature, suggesting that it may play a crucial role in the pathogenesis of both atherosclerosis and AD. For instance, L-Arg has been found to be involved in diverse physiological and pathological processes, including neurotransmission (Chen and Chang, 2002), neurogenesis and neuroplasticity (Marcinkowska et al., 2022), cellular redox metabolism and redox stress (Perry et al., 2002; Tonnies and Trushina, 2017), inflammation (Wijnands et al., 2015), and regulation of cerebral blood flow (Matsuda et al., 2007).
In our previous study utilizing AD urine samples, an increase in potential diagnostic metabolites of uric acid, creatine, and choline was observed in the AD group as compared to the CN group. Conversely, in plasma samples, while uric acid displayed a decreasing trend, both creatine and choline indicated no significant differences between the two groups (Zhang et al., 2022). The variability in the concentration of biomarkers in body fluids is due to the kidney's crucial role in reabsorbing certain substances from urine back into the bloodstream. Recent research also demonstrated a correlation between blood biomarker concentration with urinary biomarkers (Ho et al., 2015; Kukova et al., 2019). It appears that these metabolites undergo dynamic fluctuations during certain stages of Alzheimer's disease.
Besides, different biomarkers may denote the progression of Alzheimer's disease (Teunissen et al., 2022).
In addition, we investigated the AD biomarkers of Aβ40, Aβ42, APOE4, and TAU in blood to find their association with reported results (Rachakonda et al., 2004; Niedzwiecki et al., 2020; Thijssen et al., 2022). It has been suggested that the plasma ratio of Aβ42/Aβ40 is often used to discriminate amyloid PET positive and negative individuals across the clinical AD continuum (De Meyer et al., 2020; Verberk et al., 2020). In a case–control study, researchers used the ratio of Aβ42/Aβ40 in the discrimination test and acquired a good AUC(ROC), which is above 0.8 (Thijssen et al., 2022). Based on our ELISA results, we performed the discrimination test of ROC with Aβ42 and the Aβ42/Aβ40, which resulted in AUC (Aβ42) as 0.76 and AUC (Aβ42/Aβ40) as 0.70, and this was kept in line with reported cases.
Human APOE is a glycoprotein that is highly expressed in stressed neurons, astrocytes, microglia, vascular mural cells, and choroid plexus cells. It has been suggested that low plasma levels of APOE are linked to an elevated risk of developing future Alzheimer's disease and all forms of dementia in the general population (Rasmussen et al., 2015). Also, lower plasma concentrations of APOE were supported by the finding that APOE levels are negatively correlated with Aβ levels in multiple brain regions when analyzed in non-demented individuals (Shinohara et al., 2013). In this study, AD patients held lower APOE levels as compared to the CN participants, which presented a similar trend with reported cases.
Research suggested that Tau protein lost its ability to bind to microtubules, and therefore, its normal role of keeping the well-organized cytoskeleton is no longer effective (Kolarova et al., 2012). One prospective study indicated that high plasma Tau was found in patients with AD dementia compared with cognitively normal individuals and patients with MCI (Mattsson et al., 2016). However, another study revealed a significant decrease in plasma levels of total tau among individuals with MCI compared with cognitively normal controls, with a further highly significant reduction in AD patients compared with both MCI and normal controls (Sparks et al., 2012).
In our study, we observed a decrease in plasma t-tau levels in the AD group, which differs from the trends observed in other research groups (Mattsson et al., 2016; Shen, 2020). Another study that tested the alteration of plasma tau in AD found that plasma tau partly reflects AD pathology, but there is a considerable overlap with normal aging, especially in individuals without dementia (Mattsson et al., 2016). Recent studies suggested that elevated levels of tau in the blood are not specific to AD, which could also be found in other neuron degeneration conditions, such as Parkinson's disease, frontotemporal dementia, or amyotrophic lateral sclerosis (ALS) (Neumann et al., 2006; Boeve et al., 2022; Pan et al., 2022). Thus, future studies should test longitudinal plasma tau measurements in AD.
Nevertheless, the exciting and rapid developments in plasma-based assays hold promise for prescreening in research (reducing the need for, and associated costs with, lumbar punctures and PET scans), once properly validated, which would fulfill the diagnostic purposes in clinical practice. In this study, we employed the high-resolution mass spectrometer to screen the plasma metabolites, with the optimized and stabilized LCMS method, and we were able to determine hundreds of features that enable us to perform the discovery study. We found that both PAGIn and L-Arg showed pretty good discriminate power in separating AD patients from CN individuals, which exerted their underlying possibilities in clinical diagnosis. In addition, the combination group of PAGIn and L-Arg enhanced the diagnostic power from ROC (AUC) 0.91 to ROC (AUC) 0.95, thus improving the accuracy in AD discrimination with this test.
Epidemiological studies in different populations showed an independent relationship between the development of dementia and the incidence of cardiovascular diseases (CVD), implying the presence of shared biological processes (Cortes-Canteli and Iadecola, 2020; Stakos et al., 2020). Our results indicate that both plasma PAGIn and L-arginine are significant in separating Alzheimer's disease (AD) from cognitively normal individuals. However, limited investigations suggest that PAGIn and L-arginine are associated with AD but not CVD in plasma investigation. It is interesting to observe that, using mass spectrometry in one measurement, PAGIn and L-arginine were found to be significantly elevated in AD.
Besides, we introduced the discrimination analysis with Aβ42 and Aβ42/Aβ40. The best ROC of the protein biomarker is Aβ42 with an AUC of 0.76, which was in line with the literature. Moreover, protein–metabolite interactions are of importance in cellular procedure, since these compounds could serve as co-factors for proteins to mediate protein function. This has not been investigated in our previous studies on Alzheimer's disease. It is interesting to note the positive correlations between Aβ42/Aβ40 with PAGIn or L-Arg with statistical significance. This suggests that PAGIn and L-Arg hold great promise in the diagnosis of Alzheimer's disease. These findings should be further validated in future tests using clinical specimens.
However, our study has some limitations. First, it is restricted by the lack of access to pathology reports and APOE genotype information, which impacts the scope of clinical parameters that can be included in this article. In future research, MRI could be used to visualize decreased gray matter (GM) volume in AD patients or a positron emission tomography (PET) scan could be conducted to detect amyloid deposition in AD patients, as these methods are considered the “gold standard” for assessing AD states in clinical settings, and would support the diagnosis of metabolite biomarker studies. Second, the observational nature of the study design means that the causal links between two metabolites (PAGln and L-Arg) and AD cannot be established. Instead, a functional metabolomics technique must be used to uncover the underlying pathways. Third, our study was conducted at a single location and had a biased patient selection; the sample size was also small, which means that further validation at other research centers and larger sample sizes are required. Finally, absolute quantitation analysis of differential metabolites was not performed due to a limited plasma sample, which should be done in future cohort studies to validate the findings.
5. Conclusion
In conclusion, our study showed that AD patients had an altered peripheral metabolism as compared to cognitively normal participants. We demonstrated the added advantage of examining metabolic expression signatures and constructing a comprehensive picture of metabolic change by examining categorization and regulatory signatures. Not only could studying additional signatures highlight potential predictive and regulatory indicators but could also uncover essential features that may have been overlooked when only investigating expression signatures. Particularly, PAGIn and L-Arg have been identified as potential essential features in metabolic alteration and showed an excellent discrimination ability in AD diagnosis. Our study also highlights a significant association between the AD protein ratio of Aβ42/Aβ40 and PAGIn or L-Arg. These findings indicate that protein biomarkers correlated with metabolites can strengthen AD diagnosis. Future studies will be required to corroborate these results and to clarify the specific roles of these metabolites in AD metabolic change.
Data availability statement
The data presented in the study are deposited in the MetaboLights public database. This data can be found here: https://www.ebi.ac.uk/metabolights/editor/study/MTBLS8045/.
Ethics statement
The studies involving human participants were reviewed and approved by the Ethics Committee of Shanghai Baoshan Luodian Hospital (Approval number: LDYY-KY-2020-04). The patients/participants provided their written informed consent to participate in this study.
Author contributions
XD and QZ contributed to the conception of this article. JiY performed the experiment and wrote the manuscript. SW performed the data collection and data analysis. JuY interpreted data for the work and joined in constructive discussions. All authors have read and agreed to the published version of the manuscript.
Funding
This work was supported by grants from the Science and Technology Innovation Special Fund (19-E-29) and the Science and Technology Committee of Shanghai Baoshan District.
Acknowledgments
We are grateful for the scientific discussion with colleagues from the Neurology Department and Clinical Research Center of Shanghai Baoshan Luodian Hospital. We would like to thank Xinru Liu for the collection of clinical documents and Junjie Chen for the plasma sample handling. We appreciate Shanghai Yunxiang Medical Technology Co., Ltd. (Shanghai, China) for providing a high-resolution mass spectrometer for metabolomics analysis.
Conflict of interest
The authors declare that the research was conducted in the absence of any commercial or financial relationships that could be construed as a potential conflict of interest.
Publisher's note
All claims expressed in this article are solely those of the authors and do not necessarily represent those of their affiliated organizations, or those of the publisher, the editors and the reviewers. Any product that may be evaluated in this article, or claim that may be made by its manufacturer, is not guaranteed or endorsed by the publisher.
Supplementary material
The Supplementary Material for this article can be found online at: https://www.frontiersin.org/articles/10.3389/fnagi.2023.1189659/full#supplementary-material
References
(2021). 2021 Alzheimer's disease facts and figures. Alzheimers. Dement. 17, 327–406. doi: 10.1002/alz.12328
Aisen, P., Touchon, J., Andrieu, S., Boada, M., Doody, R., Nosheny, R. L., et al. (2016). Registries and cohorts to accelerate early phase Alzheimer's trials. A report from the E.U./U.S. clinical trials in Alzheimer's disease task force. J. Prev. Alzheimers Dis. 3, 68–74. doi: 10.14283/jpad.2016.97
Aronov, P. A., Luo, F. G., Plummer, N. S., Quan, Z., Holmes, S., Hostetter, T. H., et al. (2011). Colonic contribution to uremic solutes. J. Am. Soc. Nephrol. 22, 1769–1776. doi: 10.1681/ASN.2010121220
Bendlin, B. B., and Zetterberg, H. (2022), The iterative process of fluid biomarker development validation in Alzheimer's disease. Alzheimers Dement (Amst) 14, e12341. doi: 10.1002/dad2.12341
Boeve, B. F., Boxer, A. L., Kumfor, F., Pijnenburg, Y., and Rohrer, J. D. (2022). Advances and controversies in frontotemporal dementia: diagnosis, biomarkers, and therapeutic considerations. Lancet Neurol. 21, 258–272. doi: 10.1016/S1474-4422(21)00341-0
Chandler, J. D., Hu, X., Ko, E-J., Park, S., Lee, Y-T., Orr, M., et al. (2016). Metabolic pathways of lung inflammation revealed by high-resolution metabolomics (HRM) of H1N1 influenza virus infection in mice. Am. J. Physiol. Regul. Integr. Comp. Physiol. 311, R906–R916. doi: 10.1152/ajpregu.00298.2016
Chen, K. K., and Chang, L. (2002). Involvement of L-arginine/nitric oxide pathway at the paraventricular nucleus of hypothalamus in central neural regulation of penile erection in the rat. Int. J. Impot. Res. 14, 139–145. doi: 10.1038/sj.ijir.3900825
Cortes-Canteli, M., and Iadecola, C. (2020). Alzheimer's disease and vascular aging: JACC focus seminar. J. Am. Coll. Cardiol. 75, 942–951. doi: 10.1016/j.jacc.2019.10.062
Cummings, J., Lee, G., Nahead, P., Kambar, M., Zhong, K., Fonseca, J., et al. (2022). Alzheimer's disease drug development pipeline: 2022 Alzheimers Dement (N Y) 8, e12295. doi: 10.1002/trc2.12295
de la Monte, S. M., and Tong, M. (2014). Brain metabolic dysfunction at the core of Alzheimer's disease. Biochem. Pharmacol. 88, 548–559. doi: 10.1016/j.bcp.2013.12.012
De Meyer, S., Schaeverbeke, J. M., Verberk, I. M. W., Gille, B., De Schaepdryver, M., Luckett, E. S., et al. (2020). Comparison of ELISA- and SIMOA-based quantification of plasma Abeta ratios for early detection of cerebral amyloidosis. Alzheimers. Res. Ther. 12, 162. doi: 10.1186/s13195-020-00728-w
de Souza, L. P., Alseekh, S., Scossa, F., and Fernie, A. R. (2021). Ultra-high-performance liquid chromatography high-resolution mass spectrometry variants for metabolomics research. Nat. Methods 18, 733–746. doi: 10.1038/s41592-021-01116-4
Deleidi, M., Jaggle, M., and Rubino, G. (2015). Immune aging, dysmetabolism, and inflammation in neurological diseases. Front. Neurosci. 9, 172. doi: 10.3389/fnins.2015.00172
Golde, T. E. (2022). Alzheimer's disease - the journey of a healthy brain into organ failure. Mol. Neurodegener. 17, 18. doi: 10.1186/s13024-022-00523-1
Ho, J., Tangri, N., Komenda, P., Kaushal, A., Sood, M., Brar, R., et al. (2015). Urinary, plasma, and serum biomarkers' utility for predicting acute kidney injury associated with cardiac surgery in adults: a meta-analysis. Am. J. Kidney Dis. 66, 993–1005. doi: 10.1053/j.ajkd.2015.06.018
Holmes, E., Wilson, I. D., and Nicholson, J. K. (2008). Metabolic phenotyping in health and disease. Cell. 134, 714–717. doi: 10.1016/j.cell.2008.08.026
Jack, C. R. J., Bennett, D. A., Blennow, K., Carrillo, M. C., Dunn, B., Haeberlein, S. B., et al. (2018). NIA-AA research framework: toward a biological definition of Alzheimer's disease. Alzheimers. Dement. 14, 535–562. doi: 10.1016/j.jalz.2018.02.018
Jack, C. R. J., Bennett, D. A., Blennow, K., Carrillo, M. C., Feldman, H. H., Frisoni, G. B., et al. (2016). A/T/N: An unbiased descriptive classification scheme for Alzheimer disease biomarkers. Neurology. 87, 539–547. doi: 10.1212/WNL.0000000000002923
Jiang, C., Li, G., Huang, P., Liu, Z., and Zhao, B. (2017). The Gut Microbiota and Alzheimer's Disease. J. Alzheimers. Dis. 58, 1–15. doi: 10.3233/JAD-161141
Kaufmann, A. (2018). Analytical performance of the various acquisition modes in Orbitrap MS and MS/MS. J. Mass Spectrom. 53, 725–738. doi: 10.1002/jms.4195
Koek, M. M., Jellema, R. H., van der Greef, J., Tas, A. C., and Hankemeier, T. (2011). Quantitative metabolomics based on gas chromatography mass spectrometry: status and perspectives. Metabolomics. 7, 307–328. doi: 10.1007/s11306-010-0254-3
Kolarova, M., García-Sierra, F., Bartos, A., Ricny, J., and Ripova, D. (2012). Structure and pathology of tau protein in Alzheimer disease. Int. J. Alzheimers. Dis. 2012, 731526. doi: 10.1155/2012/731526
Kueper, J. K., Speechley, M., and Montero-Odasso, M. (2018). The Alzheimer's Disease Assessment Scale-Cognitive Subscale (ADAS-Cog): Modifications and Responsiveness in Pre-Dementia Populations. A Narrative Review. J. Alzheimers. Dis. 63, 423–444. doi: 10.3233/JAD-170991
Kukova, L. Z., Mansour, S. G., Coca, S. G., de Fontnouvelle, C. A., Thiessen-Philbrook, H. R., Shlipak, M. G., et al. (2019). Comparison of urine and plasma biomarker concentrations measured by aptamer-based versus immunoassay methods in cardiac surgery patients. J. Appl. Lab Med 4, 331–342. doi: 10.1373/jalm.2018.028621
Lawton, K. A, Berger, A, Mitchell, M, Milgram, K. E, Evans, A. M, and Guo, L. (2008). Analysis of the adult human plasma metabolome. Pharmacogenomics. 9, 383–397. doi: 10.2217/14622416.9.4.383
Liang, X., Chen, X., Liang, Q., Zhang, H., Hu, P., Wang, Y., et al. (2011). Metabonomic study of Chinese medicine Shuanglong formula as an effective treatment for myocardial infarction in rats. J. Proteome Res. 10, 790–799. doi: 10.1021/pr1009299
Liu, P., Fleete, M. S., Jing, Y., Collie, N. D., Curtis, M. A., Waldvogel, H. J., et al. (2014). Altered arginine metabolism in Alzheimer's disease brains. Neurobiol. Aging 35, 1992–2003. doi: 10.1016/j.neurobiolaging.2014.03.013
Malinski, T. (2007). Nitric oxide and nitroxidative stress in Alzheimer's disease. J. Alzheimers. Dis. 11, 207–218. doi: 10.3233/JAD-2007-11208
Marcinkowska, A. B., Biancardi, V. C., and Winklewski, P. J. (2022). Arginine-vasopressin, synaptic plasticity and brain networks. Curr. Neuropharmacol. 20, 2292–2302. doi: 10.2174/1570159X20666220222143532
Matsuda, H., Mizumura, S., Nagao, T., Ota, T., Iizuka, T., Nemoto, K., et al. (2007). An easy Z-score imaging system for discrimination between very early Alzheimer's disease and controls using brain perfusion SPECT in a multicentre study. Nucl. Med. Commun. 28, 199–205. doi: 10.1097/MNM.0b013e328013eb8b
Mattsson, N., Zatterberg, H., Janelize, S., Insel, P., Anderson, U., Stomrud, E., et al. (2016). Plasma tau in Alzheimer disease. Neurology 87, 1827–1835. doi: 10.1212/WNL.0000000000003246
Nemet, I., Saha, P. P., Gupta, N., Zhu, W., Romano, K. A., Skye, S. M., et al. (2020). A Cardiovascular Disease-Linked Gut Microbial Metabolite Acts via Adrenergic Receptors. Cell, 180, 862–877. e22. doi: 10.1016/j.cell.2020.02.016
Neumann, M., Sampathu, D. M., Kwong, L. K., Truax, A. C., Micsenyi, M. C., Chou, T. T., et al. (2006). Ubiquitinated TDP-43 in frontotemporal lobar degeneration and amyotrophic lateral sclerosis. Science. 314, 130–133. doi: 10.1126/science.1134108
Niedzwiecki, M. M., Walker, D. I., Howell, J. C., Watts, K. D., Jones, D. P., Miller, G. W., et al. (2020). High-resolution metabolomic profiling of Alzheimer's disease in plasma. Ann Clin Transl Neurol 7, 36–45. doi: 10.1002/acn3.50956
Pan, L., Li, C., Meng, L., Tian, L., He, M., Yuan, X., et al. (2022). Tau accelerates alpha-synuclein aggregation and spreading in Parkinson's disease. Brain 145, 3454–3471. doi: 10.1093/brain/awac171
Perry, G., Taddeo, M. A., Nunomura, A., Zhu, X., Zenteno-Savin, T., Drew, K. L., et al. (2002). Comparative biology and pathology of oxidative stress in Alzheimer and other neurodegenerative diseases: beyond damage and response. Comp. Biochem. Physiol. C. Toxicol. Pharmacol. 133, 507–513. doi: 10.1016/S1532-0456(02)00119-9
Poesen, R., Claes, K., Evenepoel, P., de Loor, H., Augustijns, P., Kuypers, D., et al. (2016). Microbiota-Derived Phenylacetylglutamine Associates with Overall Mortality and Cardiovascular Disease in Patients with CKD. J. Am. Soc. Nephrol. 27, 3479–3487. doi: 10.1681/ASN.2015121302
Procaccini, C., Santopaolo, M., Faicchia, D., Colamatteo, A., Formisano, L., de Candia, P., et al. (2016). Role of metabolism in neurodegenerative disorders. Metab. Clin. Exp. 65, 1376–1390. doi: 10.1016/j.metabol.2016.05.018
Rachakonda, V., Pan, T. H., and Le, W. D. (2004). Biomarkers of neurodegenerative disorders: how good are they? Cell Res. 14, 347–358. doi: 10.1038/sj.cr.7290235
Rasmussen, K. L., Tybjaerg-Hansen, A., Nordestgaard, B. G., and Frikke-Schmidt, R. (2015). Plasma levels of apolipoprotein E and risk of dementia in the general population. Ann. Neurol. 77, 301–311. doi: 10.1002/ana.24326
Sales, S., Knittelfelder, O., and Shevchenko, A. (2017). Lipidomics of Human Blood Plasma by High-Resolution Shotgun Mass Spectrometry. Methods Mol. Biol. 1619, 203–212. doi: 10.1007/978-1-4939-7057-5_16
Sampson, T. R., and Mazmanian, S. K. (2015). Control of brain development, function, and behavior by the microbiome. Cell Host Microbe 17, 565–576. doi: 10.1016/j.chom.2015.04.011
Schrijvers, E. M. C., Witteman, J. C. M., Sijbrands, E. J. G., Hofman, A., Koudstaal, P. J., and Breteler, M. M. B. (2010). Insulin metabolism and the risk of Alzheimer disease: the Rotterdam Study. Neurology 75, 1982–1987. doi: 10.1212/WNL.0b013e3181ffe4f6
Shao, Y., Li, T., Liu, Z., Wang, X., Xu, X., Li, S., et al. (2021). Comprehensive metabolic profiling of Parkinson's disease by liquid chromatography-mass spectrometry. Mol. Neurodegener. 16, 4. doi: 10.1186/s13024-021-00425-8
Shen, X. N. (2020). Plasma amyloid, tau, and neurodegeneration biomarker profiles predict Alzheimer's disease pathology and clinical progression in older adults without dementia. Alzheimers Dement (Amst). 12, e12104. doi: 10.1002/dad2.12104
Shinohara, M., Petersen, R. C., Dickson, D. W., and Bu, G. (2013). Brain regional correlation of amyloid-beta with synapses and apolipoprotein E in non-demented individuals: potential mechanisms underlying regional vulnerability to amyloid-beta accumulation. Acta Neuropathol. 125, 535–547. doi: 10.1007/s00401-013-1086-9
Sparks, D. L., Kryscio, R. J., Sabbagh, M. N., Ziolkowski, C., Lin, Y., Sparks, L. M., et al. (2012). Tau is reduced in AD plasma and validation of employed ELISA methods. Am. J. Neurodegener. Dis. 1, 99–106.
Stakos, D. A., Stamatelopoulos, K, Bampatsias, D., Sachse, M., Zormpas, E., Vlachogiannis, N. I., et al. (2020). The Alzheimer's disease amyloid-beta hypothesis in cardiovascular aging and disease: JACC focus seminar. J. Am. Coll. Cardiol. 75, 952–967. doi: 10.1016/j.jacc.2019.12.033
Szymańska, E., Saccenti, E., Smilde, A. K., and Westerhuis, J. A. (2012). Double-check: validation of diagnostic statistics for PLS-DA models in metabolomics studies. Metabolomics 8, 3–16. doi: 10.1007/s11306-011-0330-3
Teunissen, C. E., Verberk, I. M. W., Thijssen, E. H., Vermunt, L., Hansson, O., Zetterberg, H., et al. (2022). Blood-based biomarkers for Alzheimer's disease: towards clinical implementation. Lancet Neurol. 21, 66–77. doi: 10.1016/S1474-4422(21)00361-6
Thijssen, E. H., Verberk, I. M. W., Kindermans, J., Abramian, A., Vanbrabant, J., Ball, A. J., et al. (2022). Differential diagnostic performance of a panel of plasma biomarkers for different types of dementia. Alzheimers Dement (Amst) 14, e12285. doi: 10.1002/dad2.12285
Tonnies, E., and Trushina, E. (2017). Oxidative stress, synaptic dysfunction, and alzheimer's disease. J. Alzheimers. Dis. 57, 1105–1121. doi: 10.3233/JAD-161088
Trivedi, D. K., Hollywood, K. A., and Goodacre, R. (2017). Metabolomics for the masses: the future of metabolomics in a personalized world. New Horiz. Transl. Med. 3, 294–305. doi: 10.1016/j.nhtm.2017.06.001
Uppal, K., Salinas, J. L., Monteiro, W. M., Val, F., Cordy, R. J., Liu, K., et al. (2017). Plasma metabolomics reveals membrane lipids, aspartate/asparagine and nucleotide metabolism pathway differences associated with chloroquine resistance in Plasmodium vivax malaria. PLoS ONE. 12, e0182819. doi: 10.1371/journal.pone.0182819
Verberk, I. M. W., Thijssen, E., Koelewijn, J., Mauroo, K., Vanbrabant, J., de Wilde, A., et al. (2020). Combination of plasma amyloid beta(1-42/1-40) and glial fibrillary acidic protein strongly associates with cerebral amyloid pathology. Alzheimers. Res. Ther. 12, 118. doi: 10.1186/s13195-020-00682-7
Vogt, M. C., and Bruning, J. C. (2013). CNS insulin signaling in the control of energy homeostasis and glucose metabolism - from embryo to old age. Trends Endocrinol. Metab. 24, 76–84. doi: 10.1016/j.tem.2012.11.004
Wheelock, A. M., and Wheelock, C. E. (2013). Trials and tribulations of 'omics data analysis: assessing quality of SIMCA-based multivariate models using examples from pulmonary medicine. Mol. Biosyst. 9, 2589–2596. doi: 10.1039/c3mb70194h
Wijnands, K. A. P., Castermans, T. M. R., Hommen, M. P. J., Meesters, D. M., and Poeze, M. (2015). Arginine and citrulline and the immune response in sepsis. Nutrients 7, 1426–1463. doi: 10.3390/nu7031426
Yi, J., Horkey, L. L., Friedlich, A. L., Shi, Y., Rogers, J., and Huang, S. (2009). L-arginine and Alzheimer's disease. Int. J. Clin. Exp. Pathol. 2, 211–238. Available online at: https://e-century.us/files/ijcep/2/3/IJCEP808005.pdf
Yu, F., Li, X., Feng, X., Wei, M., Luo, Y., Zhao, T., et al. (2021). Phenylacetylglutamine, a Novel Biomarker in Acute Ischemic Stroke. Front Cardiovasc Med 8, 798765. doi: 10.3389/fcvm.2021.798765
Zhang, Q., Wu, S., Liu, X., Yang, J., Dong, X., Zhou, Y., et al. (2022). An observation study of urinary biomarker exploratory in Alzheimer's disease using high-resolution mass spectrometry. Biomed. Chromatogr. 36, e5421. doi: 10.1002/bmc.5421
Keywords: Alzheimer's disease, neurodegenerative biomarkers, human plasma, high-resolution mass spectrometry, clinical diagnosis
Citation: Yang J, Wu S, Yang J, Zhang Q and Dong X (2023) Amyloid beta-correlated plasma metabolite dysregulation in Alzheimer's disease: an untargeted metabolism exploration using high-resolution mass spectrometry toward future clinical diagnosis. Front. Aging Neurosci. 15:1189659. doi: 10.3389/fnagi.2023.1189659
Received: 19 March 2023; Accepted: 30 May 2023;
Published: 29 June 2023.
Edited by:
Woon-Man Kung, Chinese Culture University, TaiwanReviewed by:
Gajanan Sathe, Institute of Bioinformatics (IOB), IndiaSreelakshmi K. Sreenivasamurthy, Boston Children's Hospital and Harvard Medical School, United States
Copyright © 2023 Yang, Wu, Yang, Zhang and Dong. This is an open-access article distributed under the terms of the Creative Commons Attribution License (CC BY). The use, distribution or reproduction in other forums is permitted, provided the original author(s) and the copyright owner(s) are credited and that the original publication in this journal is cited, in accordance with accepted academic practice. No use, distribution or reproduction is permitted which does not comply with these terms.
*Correspondence: Xin Dong, ZG9uZ3hpbkBzaHUuZWR1LmNu; Qun Zhang, emhhbmdxdW4xMTIwQHNpbmEuY29t
†These authors have contributed equally to this work and share first authorship