 Xin-Wen Li
 Ting-Ting Duan
 Jin-Yu Chu1,2
 Shi-Yao Pan
 Yan Zeng
 Fei-Fei Hu
95% of researchers rate our articles as excellent or good
Learn more about the work of our research integrity team to safeguard the quality of each article we publish.
Find out more
DATA REPORT article
Front. Aging Neurosci. , 12 May 2023
Sec. Alzheimer's Disease and Related Dementias
Volume 15 - 2023 | https://doi.org/10.3389/fnagi.2023.1157792
This article is part of the Research Topic Gene Expression: Epigenetic and Transcriptional Regulation in Neurodegenerative Diseases and Ageing View all 9 articles
Alzheimer's disease (AD), a severe neurodegenerative disorder, is the most common type of dementia, affecting 57.4 million patients worldwide in 2019 and will reach 152.8 million by 2050 (GBD 2019 Dementia Forecasting Collaborators, 2022). However, there is currently no effective treatment for AD (Gao et al., 2016). Part of the reason is the lacking understanding of the high cellular heterogeneity in AD brains, which is closely associated with the onset, progression, and pathological process of AD (Lau et al., 2020). Single-cell RNA sequencing (scRNA-seq) is extremely effective in interpreting the cellular heterogeneity of AD (Habib et al., 2020). Advances in scRNA-seq technologies in the past decade have generated a large amount of AD scRNA-seq data, but studies integrated these multi-source data are rare, which greatly limited non-bioinformatics users' access to such public data. Therefore, it is essential to establish a database that collects AD scRNA-seq data.
Here, we collected 17 AD or mild cognitive impairment (MCI) scRNA-seq projects from the Gene Expression Omnibus (GEO) and the Synapse databases, covering 21 data-sets with 359 samples, 10 brain regions, 16 major brain cell types, and 1,564,825 cells to explore cellular heterogeneity, cell communication, and cell trajectory in brain tissues with AD/MCI pathology. The results were integrated into a database named SCAD-Brain (scRNA-seq analysis for AD Brain, https://www.bioinform.cn/SCAD/). The users can access, reuse, and analyze the data by visiting the website, to perform cell marker analysis, gene expression analysis, pathway enrichment analysis, cell communication analysis, and cell trajectory analysis for multiple brain regions from patients with AD/MCI and AD mouse models. SCAD-Brain provides a user-friendly platform to explore and visualize scRNA-seq data of AD brain, assist in experiments design, verify hypotheses, and especially investigate the cellular heterogeneity of AD brain.
Raw data of AD brain scRNA-seq from the GEO database and Synapse database were collected in October 2021. For data collection through the GEO database, medical subject headings of AD and scRNA-seq were collected from the MeSH database to build a search formula: [(Alzheimer Dementia) OR (Alzheimer Dementias) OR (Dementia, Alzheimer) OR (Alzheimer's Disease) OR (Dementia, Senile) OR (Senile Dementia) OR (Dementia, Alzheimer Type) OR (Alzheimer Type Dementia) OR [Alzheimer Type Dementia (ATD)] OR [Dementia, Alzheimer-Type (ATD)] OR [Dementia, Alzheimer-Type (ATD)] OR(Alzheimer Type Senile Dementia) OR (Primary Senile Degenerative Dementia) OR (Dementia, Primary Senile Degenerative) OR (Alzheimer Sclerosis) OR (Sclerosis, Alzheimer) OR (Alzheimer Syndrome) OR (Alzheimer's Diseases) OR (Alzheimer Diseases) OR (Alzheimers Diseases) OR (Senile Dementia, Alzheimer Type) OR (Acute Confusional Senile Dementia) OR (Senile Dementia, Acute Confusional) OR (Dementia, Presenile) OR (Presenile Dementia) OR (Alzheimer Disease, Late Onset) OR (Late Onset Alzheimer Disease) OR (Alzheimer's Disease, Focal Onset) OR (Focal Onset Alzheimer's Disease) OR [Familial Alzheimer Disease (FAD)] OR [Alzheimer Disease, Familial (FAD)] OR [Familial Alzheimer Diseases (FAD)] OR (Alzheimer Disease, Early Onset) OR (Early Onset Alzheimer Disease) OR (Presenile Alzheimer Dementia) AND [(single cell) OR (single-cell) OR (single-nucleus) OR (single nucleus)], to search datasets on the GEO database. For data collection through the Synapse database, AD scRNA-seq data were collected from the AD Knowledge Portal, which is a repository for multi-omic data on Alzheimer's disease and aging. The information of each sample was manually confirmed according to the metadata and the related published studies. Irrelevant samples (e.g., non-AD or ambiguous disease or AD with genes knocked out) were discarded. After the above procedures, a total of 21 data-sets with 359 samples were collected from public data portals. Raw scRNA-seq data were downloaded from the GEO database and unpacked through the SRA Toolkit (version 2.11.1). The synapseclient and synapseutils python packages were used to download raw scRNA-seq data from the Synapse database.
The AD brain scRNA-seq data projects we included in this study are: SRP290191 (Huang et al., 2021), SRP238096 (Sierksma et al., 2020), SRP190819 (Otero-Garcia et al., 2022), SRP254025 (Leng et al., 2021), SRP298630 (Yang et al., 2022), SRP243446 (Habib et al., 2020), SRP252065(Alsema et al., 2020), SRP282056 (Lau et al., 2020), SRP282467 (Xu et al., 2021), SRP124513 (Mathys et al., 2017), SRP305673(Safaiyan et al., 2021), syn18485175 (Mathys et al., 2019), syn24168322, syn16780177, syn12514624, syn21670836, and syn23763501. There are seven mice studies. The SRP290191 and SRP238096 projects explored the response of the microglia system to amyloid-β in pooled cortices (5xFAD, also known as APP/PS1 mice model) and hippocampus (APPswe/PSEN1L166P and THY-Tau22 mice models), respectively. The SRP243446 project focuses on the disease-associated astrocytes population in the 5xFAD mice model. The SRP282467 project elucidated single cell expression of hippocampal tissues from the J20 AD mouse model. The SRP124513 and SRP305673 projects focus on microglia function in AD mice hippocampus (CK-p25, of severe neurodegeneration which develops AD-like pathology in an inducible and temporally predictable manner) and white/gray matter (Trem2KO mouse), respectively. The syn23763501 project performed scRNA-seq for the whole brain of the 5xFAD mouse model. There are ten human studies. The SRP190819 project demonstrates the cell-type-specific responses to neurofibrillary tangles susceptibility in AD prefrontal cortex. The SRP254025 project focuses on selectively vulnerable neurons in AD caudal entorhinal cortex and the superior frontal gyrus. The SRP298630 project concentrates on the vasculature system in the AD hippocampus and superior frontal cortex. The SRP252065 project focuses on microglial subpopulations in AD superior parietal lobe. The SRP282056 project focuses on angiogenic endothelial cells and neuroprotective glia in AD prefrontal cortex. The syn24168322, syn16780177, syn12514624, syn18485175, and syn21670836 projects provide scRNA-seq data from the dorsolateral prefrontal cortex. The 17 data projects were additionally separated into 21 datasets according to species and brain tissues: SRP243446H_Hippocampus_mice, SRP243446C_Prefrontalcortex_mice, syn21670836_DorsolateralPrefrontalCortex_human, syn24168322_DorsolateralPrefrontalCortex_human, syn18485175_DorsolateralPrefrontalCortex_human, syn23763501_WholeBrain_mice, syn16780177_DorsolateralPrefrontalCortex_human, syn12514624_DorsolateralPrefrontalCortex_human, SRP124513_Hippocampus_mice, SRP190819_PrefrontalCortex_human, SRP238096APP_Hippocampus_mice, SRP238096TAU_Hippocampus_mice, SRP252065_SuperiorParietallLobe_human, SRP254025C_CaudalEntorhinalCortex_human, SRP254025G_SuperiorFrontalGyrus_human, SRP282056_PrefrotnalCortex_human, SRP282467_Hippocampus_mice, SRP290191_PooledvCortices_mice, SRP298630H_Hippocampus_human, SRP298630S_superiorFrontalCortex_human, SRP305673_WhiteGreyMatter_mice.
For 10x single cell data, CellRanger software (v.6.1.2) (10x Genomics) was used to obtain gene counts by aligning reads to reference genomes (the hg38/GRCh38 for human and mm10/GRCm38 for mouse). Samples with less than 300 cells detected were excluded. For Smart-seq2 single cell data, the Trimmomatic (Bolger et al., 2014) (version 0.39) with default parameters was used to remove adapter sequence and reads trimming, the FastQC (version v0.11.9) was used for quality control (QC), the Hisat2 v2.2.1 (Kim et al., 2019) was employed to align clean reads to mouse reference genome GRCm38, the samtools v0.11.5 (Danecek et al., 2021), and the FeatureCount (Liao et al., 2014) were used to obtain the scRNA expression matrix.
Seurat (Stuart et al., 2019) (version 4.1.0) R package was used to analyze the single cell expression matrix. In detail, quality control of cells was conducted: (1) The percentage of transcripts that map to mitochondrial genes in each cell was calculated; (2) The cells that with >5% mitochondrial genes expressed were discarded; (3) The cells that expressed 200–2,500 genes were remained. Then, cell-level normalization was performed for gene expression by the NormalizeData function in the Seurat R package with default parameters. Highly variable features (HVGs) were identified based on mean gene expression and gene expression variance. Principle component analysis (PCA) and uniform manifold approximation and projection for dimension reduction (UMAP) were accomplished based on HVGs to reduce dimension. After that, clusters of cells were identified by a shared nearest neighbor (SNN) modularity optimization based original Louvain algorithm. Then, cell type clusters were annotated by cross-checking the specifically expressed genes of each cell type, pre-existing cell annotations from published studies, and known cell markers from the CellMarker databases (Zhang et al., 2019).
The clusterProfiler (Wu et al., 2021) R package was implemented to conduct the Kyoto Encyclopedia of Genes and Genomes (KEGG) (Kanehisa and Goto, 2000) and Gene Ontology (GO) (Gene Ontology Consortium, 2015) enrichment analysis. The GO enrichment analysis includes three pathway types: cellular component (CC), biology pathway (BP), and molecular function (MF). The Wilcoxon rank sum test was utilized to calculate differentially expressed genes (DEGs) between AD and normal groups. The CellChat (Jin et al., 2021) R package was utilized for cell communication analysis. The Monocle (Qiu et al., 2017) R package was utilized for cell trajectory analysis. Detailed methods are shown on the help page of the SCAD-Brain web site.
R/Shiny was applied to construct the user interface and backend of SCAD-Brain. MongoDB database was utilized to store SCAD-Brain data. R packages like DT (Xie et al., 2023), ggplot2 (Wickham, 2016), dplyr, and tidyr were adopted to actualize the data process and data visualization on the web server.
The 17 scRNA-Seq projects we collected cover 21 datasets, two species (human and mouse), 359 samples, 10 brain regions (pooled cortices, hippocampal, prefrontal cortex, caudal entorhinal cortex, superior frontal gyrus, superior frontal cortex, superior parietal lobe, white matter, gray matter, dorsolateral prefrontal cortex), 16 major cell types (oligodendrocyte, astrocyte, microglial, oligodendrocyte precursor cell, endothelial, neuron, T and NK cell, monocyte, B cell, proliferating cell, pericyte, smooth muscle cell, fibroblast, ependymal), and 1,564,825 cells (Figure 1A). Among the 21 datasets (see method part: Contents of data projects), 12 are human studies and nine are mice studies (5xFAD, J20, or APPswe/PSEN1L166P mouse model). Among the 359 samples, 227 are from the human brain and 132 are from mice brains. At present, the hippocampal, dorsolateral prefrontal cortex, and prefrontal cortex are the brain regions that get the most attention in AD research. Additionally, among all scRNA-Seq data in our study, microglial, oligodendrocyte, neuron, and astrocyte cell types have the largest amount of cells.
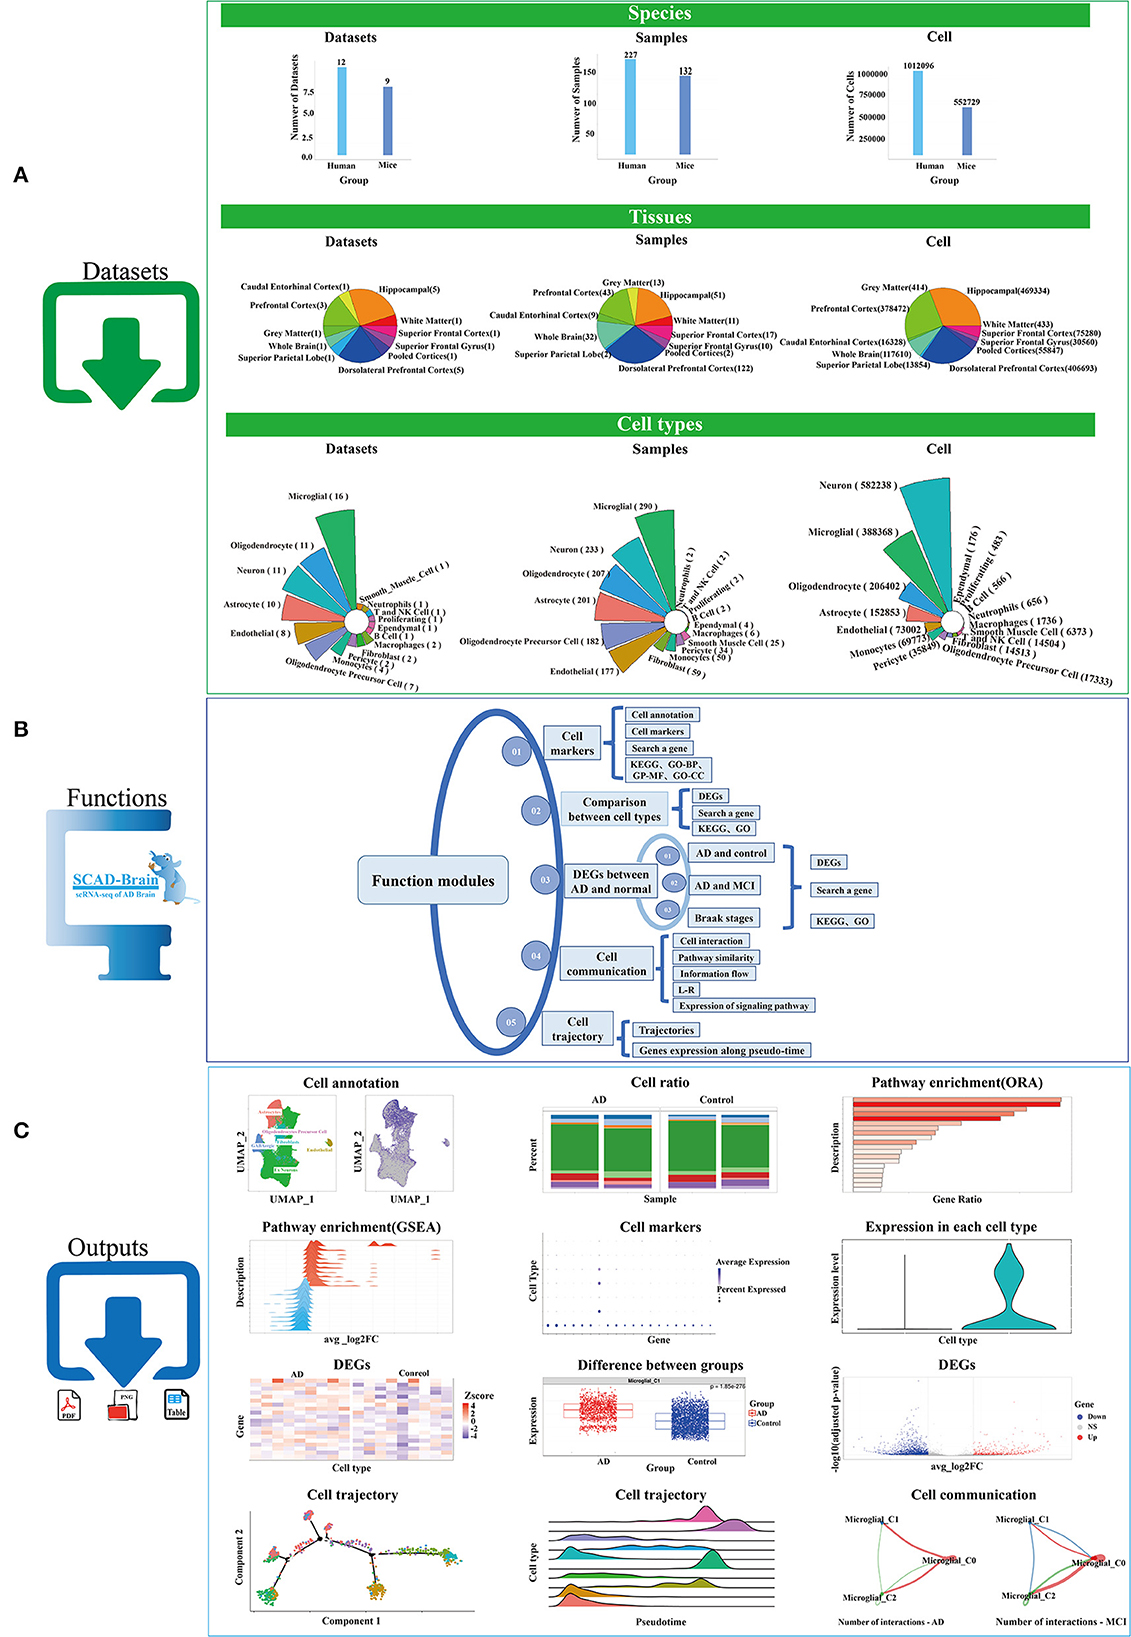
Figure 1. Work flow of SCAD-Brain. (A) Statistics of datasets that used in our study. (B) Functional modules provided by the SCAD-Brain web site. (C) Representative outputs of the SCAD-Brain.
SCAD-Brain provides a flexible web-based service for the analysis and visualization of collected scRNA-seq data sets from human and mice brains with AD pathology. SCAD-Brain provides four functional analysis types (Figure 1B), including “Cell marker”, “Comparison between cell types”, “DEGs between AD and normal”, “Cell communication”, and “Cell trajectory”. The typical outputs are shown in Figure 1C. Detailed descriptions are shown below.
The “Cell markers” module conducts cell marker investigation and pathway enrichment analysis, including four panels: (1) The “Cell annotation” panel provides cell type annotation for all samples and cell type composition for each sample; (2) The “Cell markers” panel summarizes marker genes for each cell type; (3) The “Search a gene” panel presents the gene expression in each cell type; (4) The “KEGG”, “GO-BP”, “GO-CC”, and “GO-MF” panels provide KEGG and GO pathway enrichment for cell markers.
The “Comparison between cell types” module calculates DEGs between any two cell types, including three panels: (1) The “DEG” panel performs differential expression analysis between two selected cell types; (2) The “Search a gene” panel visualizes the distribution of gene expression in the two selected cell types; (3) The “KEGG” and “GO” panels perform pathway enrichment analysis for DEGs using the Gene Set Enrichment Analysis (GSEA) method, based on the KEGG and GO databases, respectively.
The “DEGs between AD and normal” module includes three submodules: “AD and control”, “AD and MCI”, and “Braak stages”. Each submodule has three panels: (1) The “DEGs” panel computes the DEGs between groups; (2) The “Search a gene” panel presents the gene expression in each cell type between groups. (3) The “KEGG” and “GO” panels perform pathway enrichment analysis of DEGs using the GSEA method, based on KEGG and GO databases, respectively.
The “Cell communication” module analyzes ligand-receptor (L-R) interactions among cell types, including five panels: (1) The “Cell interaction” panel summarizes the number and strength of interactions among cell types; (2) The “Functional and structural” panel identifies structurally and functionally similar pathway signals; (3) The “Information flow” panel analyzes the strength of outgoing and incoming signals of each cell type; (4) The “L-R” panel summarizes the communication probabilities of ligand-receptor pairs among cell types; (5) The “Expression of signaling pathway” panel analyzed the expression of genes in enriched signaling pathway between AD and control.
The “Cell trajectory” module performs cell differentiation and development trajectory analysis, including two panels: (1) The “Trajectories” panel displays cell trajectories by cell type, cell state, and pseudo-time; (2) The “Gene expression along pseudo-time” panel calculates the gene expression variation according to pseudo-time.
As far as we know, there are three databases providing analysis and visualization of scRNA-seq data from AD brain tissues, the TACA (Zhou et al., 2022), the SC2Disease (Zhao et al., 2021), and the scREAD (Jiang et al., 2020). The TACA database was designed to perform various differential expression comparisons to identify cell type-specific gene expression alterations, cell-cell interactions, and drug screening. The SC2Disease database aims to provide a comprehensive and accurate resource of gene expression profiles in various cell types for 22 diseases. However, the data provided by SC2Disease for AD only includes one data set from one brain region (prefrontal cortex). On the other hand, scREAD, a database designed to perform scRNA-seq data analysis for AD that covers multiple brain regions, is currently unavailable due to maintenance issues.
Compared to TACA, SC2Disease, and scREAD, SCAD-Brain covers 10 brain regions and 14 major cell types of AD and adds the following two unique features: (1) comparison between two cell types; (2) cell trajectory analysis. Importantly, although some functions provided by SCAD-Brain are overlapped with these databases, SCAD-Brain provides richer visualization formats. All advancements of SCAD-Brain compared with TACA, SC2Disease, and scREAD are summarized in Table 1.
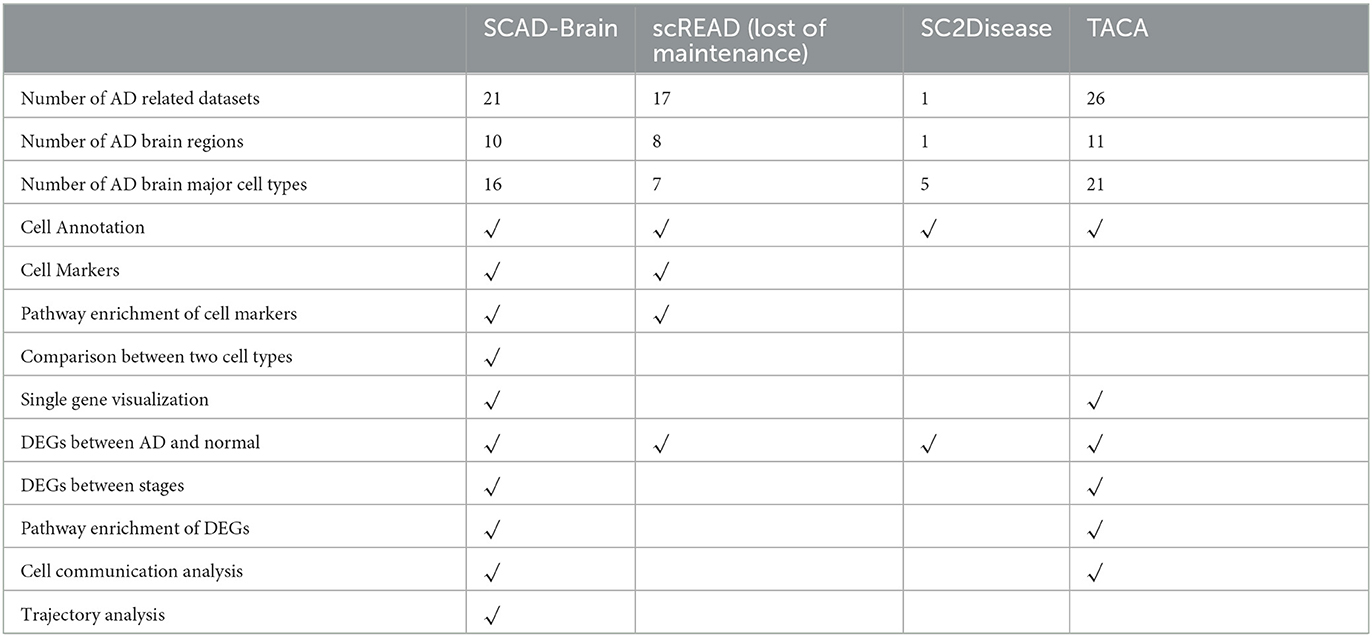
Table 1. Comparisons among SCAD-Brain, SC2Disease, scREAD, and TACA.
We collected and analyzed scRNA-Seq datasets of 10 brain regions from human and mouse models with AD pathology. Additionally, we introduced SCAD-Brain, a database to perform cell marker analysis, GSEA, gene expression comparison between cell types, differential expression analysis between AD and normal or between stages, and cell communication analysis, based on the AD scRNA-seq data we collected. SCAD-Brain is a powerful platform and resource to explore and visualize the cellular heterogeneity of AD brain at single-cell resolution, assist in experimental design and hypothesis testing, and allow users to unravel biological pathways, cell interactions, cell trajectories, and DEGs underlying neurodegeneration in specific cell populations. We will energetically maintain SCAD-Brain and update it with new data and methods.
The original contributions presented in the study are included in the article/supplementary material, further inquiries can be directed to the corresponding authors.
X-WL, T-TD, and J-YC: study design, data collection, web construction, data interpretation and writing for review and editing, and conceptualization. S-YP: data collection and web construction. YZ: study design, writing for review and editing, and conceptualization. F-FH: study design, funding, writing for review and editing, and conceptualization. All authors agree to be accountable for the content of the work and worked collectively to develop the protocols and methods described in this article.
This study was supported by STI2030-Major Projects (2022ZD0211600) and Research Start-up Foundation of Wuhan University of Science and Technology.
We thank the Synapse Database, GEO Database, the researchers for providing the scRNA-seq data, and the support by High-Performance Computing Center of Wuhan University of Science and Technology.
The authors declare that the research was conducted in the absence of any commercial or financial relationships that could be construed as a potential conflict of interest.
All claims expressed in this article are solely those of the authors and do not necessarily represent those of their affiliated organizations, or those of the publisher, the editors and the reviewers. Any product that may be evaluated in this article, or claim that may be made by its manufacturer, is not guaranteed or endorsed by the publisher.
Alsema, A. M., Jiang, Q., Kracht, L., Gerrits, E., Dubbelaar, M. L., Miedema, A., et al. (2020). Profiling microglia from Alzheimer's disease donors and non-demented elderly in acute human postmortem cortical tissue. Front. Mol. Neurosci. 13, 134. doi: 10.3389/fnmol.2020.00134
Bolger, A. M., Lohse, M., and Usadel, B. (2014). Trimmomatic: a flexible trimmer for Illumina sequence data. Bioinformatics 30, 2114–2120. doi: 10.1093/bioinformatics/btu170
Danecek, P., Bonfield, J. K., Liddle, J., Marshall, J., Ohan, V., Pollard, M. O., et al. (2021). Twelve years of SAMtools and BCFtools. Gigascience 10, giab008. doi: 10.1093/gigascience/giab008
Gao, L.-B., Yu, X.-F., Chen, Q., and Zhou, D. (2016). Alzheimer's Disease therapeutics: current and future therapies. Minerva Med. 107, 108–113.
GBD 2019 Dementia Forecasting Collaborators (2022). Estimation of the global prevalence of dementia in 2019 and forecasted prevalence in 2050: an analysis for the Global Burden of Disease Study 2019. Lancet Public Health 7, e105–e125. doi: 10.1016/S2468-2667(21)00249-8
Gene Ontology Consortium (2015). Gene Ontology Consortium: going forward. Nucleic Acids Res. 43, D1049–1056. doi: 10.1093/nar/gku1179
Habib, N., McCabe, C., Medina, S., Varshavsky, M., Kitsberg, D., Dvir-Szternfeld, R., et al. (2020). Disease-associated astrocytes in Alzheimer's disease and aging. Nat. Neurosci. 23, 701–706. doi: 10.1038/s41593-020-0624-8
Huang, Y., Happonen, K. E., Burrola, P. G., O'Connor, C., Hah, N., Huang, L., et al. (2021). Microglia use TAM receptors to detect and engulf amyloid β plaques. Nat. Immunol. 22, 586–594. doi: 10.1038/s41590-021-00913-5
Jiang, J., Wang, C., Qi, R., Fu, H., and Ma, Q. (2020). scREAD: A Single-Cell RNA-seq database for Alzheimer's disease. iScience 23, 101769. doi: 10.1016/j.isci.2020.101769
Jin, S., Guerrero-Juarez, C. F., Zhang, L., Chang, I., Ramos, R., Kuan, C.-H., et al. (2021). Inference and analysis of cell-cell communication using CellChat. Nat. Commun. 12, 1088. doi: 10.1038/s41467-021-21246-9
Kanehisa, M., and Goto, S. (2000). KEGG: kyoto encyclopedia of genes and genomes. Nucleic Acids Res. 28, 27–30. doi: 10.1093/nar/28.1.27
Kim, D., Paggi, J. M., Park, C., Bennett, C., and Salzberg, S. L. (2019). Graph-based genome alignment and genotyping with HISAT2 and HISAT-genotype. Nat. Biotechnol. 37, 907–915. doi: 10.1038/s41587-019-0201-4
Lau, S.-F., Cao, H., Fu, A. K. Y., and Ip, N. Y. (2020). Single-nucleus transcriptome analysis reveals dysregulation of angiogenic endothelial cells and neuroprotective glia in Alzheimer's disease. Proc. Natl. Acad. Sci. USA. 117, 25800–25809. doi: 10.1073/pnas.2008762117
Leng, K., Li, E., Eser, R., Piergies, A., Sit, R., Tan, M., et al. (2021). Molecular characterization of selectively vulnerable neurons in Alzheimer's disease. Nat. Neurosci. 24, 276–287. doi: 10.1038/s41593-020-00764-7
Liao, Y., Smyth, G. K., and Shi, W. (2014). featureCounts: an efficient general purpose program for assigning sequence reads to genomic features. Bioinformatics 30, 923–930. doi: 10.1093/bioinformatics/btt656
Mathys, H., Adaikkan, C., Gao, F., Young, J. Z., Manet, E., Hemberg, M., et al. (2017). Temporal tracking of microglia activation in neurodegeneration at single-cell resolution. Cell Rep. 21, 366–380. doi: 10.1016/j.celrep.2017.09.039
Mathys, H., Davila-Velderrain, J., Peng, Z., Gao, F., Mohammadi, S., Young, J. Z., et al. (2019). Single-cell transcriptomic analysis of Alzheimer's disease. Nature 570, 332–337. doi: 10.1038/s41586-019-1195-2
Otero-Garcia, M., Mahajani, S. U., Wakhloo, D., Tang, W., Xue, Y. -Q., Morabito, S., et al. (2022). Molecular signatures underlying neurofibrillary tangle susceptibility in Alzheimer's disease. Neuron 110, 2929–2948.e8. doi: 10.1016/j.neuron.2022.06.021
Qiu, X., Mao, Q., Tang, Y., Wang, L., Chawla, R., Pliner, H. A., et al. (2017). Reversed graph embedding resolves complex single-cell trajectories. Nat. Methods 14, 979–982. doi: 10.1038/nmeth.4402
Safaiyan, S., Besson-Girard, S., Kaya, T., Cantuti-Castelvetri, L., Liu, L., Ji, H., et al. (2021). White matter aging drives microglial diversity. Neuron 109 1100–1117.e10. doi: 10.1016/j.neuron.2021.01.027
Sierksma, A., Lu, A., Mancuso, R., Fattorelli, N., Thrupp, N., Salta, E., et al. (2020). Novel Alzheimer risk genes determine the microglia response to amyloid-β but not to TAU pathology. EMBO Mol. Med. 12, e10606. doi: 10.15252/emmm.201910606
Stuart, T., Butler, A., Hoffman, P., Hafemeister, C., Papalexi, E., Mauck, W. M., et al. (2019). Comprehensive integration of single-cell data. Cell 177, 1888–1902.e21. doi: 10.1016/j.cell.2019.05.031
Wickham, H. (2016). Positioning. In: Wickham, H, editor. ggplot2: Elegant Graphics for Data Analysis Use R!. Cham: Springer International Publishing. p. 147–168.
Wu, T., Hu, E., Xu, S., Chen, M., Guo, P., Dai, Z., et al. (2021). clusterProfiler 4.0: A universal enrichment tool for interpreting omics data. Innovation 2, 100141. doi: 10.1016/j.xinn.2021.100141
Xie, Y., Cheng, J., Tan, X., Allaire, J. J., Girlich, M., Ellis, G. F., et al. (2023). DT: A Wrapper of the JavaScript Library “DataTables.” Available online at: https://CRAN.R-project.org/package=DT (accessed January 31, 2023).
Xu, P., Chang, J. C., Zhou, X., Wang, W., Bamkole, M., Wong, E., et al. (2021). GSAP regulates lipid homeostasis and mitochondrial function associated with Alzheimer's disease. J. Exp. Med. 218, e20202446. doi: 10.1084/jem.20202446
Yang, A. C., Vest, R. T., Kern, F., Lee, D. P., Agam, M., Maat, C. A., et al. (2022). A human brain vascular atlas reveals diverse mediators of Alzheimer's risk. Nature 603, 885–892. doi: 10.1038/s41586-021-04369-3
Zhang, X., Lan, Y., Xu, J., Quan, F., Zhao, E., Deng, C., et al. (2019). CellMarker: a manually curated resource of cell markers in human and mouse. Nucleic Acids Res. 47, D721–D728. doi: 10.1093/nar/gky900
Zhao, T., Lyu, S., Lu, G., Juan, L., Zeng, X., Wei, Z., et al. (2021). SC2disease: a manually curated database of single-cell transcriptome for human diseases. Nucleic Acids Res. 49, D1413–D1419. doi: 10.1093/nar/gkaa838
Keywords: Alzheimer's disease, cellular heterogeneity, single cell, RNA-seq, web server
Citation: Li X-W, Duan T-T, Chu J-Y, Pan S-Y, Zeng Y and Hu F-F (2023) SCAD-Brain: a public database of single cell RNA-seq data in human and mouse brains with Alzheimer's disease. Front. Aging Neurosci. 15:1157792. doi: 10.3389/fnagi.2023.1157792
Received: 03 February 2023; Accepted: 24 April 2023;
Published: 12 May 2023.
Edited by:
Vijaykumar Muley, National Autonomous University of Mexico, MexicoReviewed by:
Teng Liu, Taizhou University, ChinaCopyright © 2023 Li, Duan, Chu, Pan, Zeng and Hu. This is an open-access article distributed under the terms of the Creative Commons Attribution License (CC BY). The use, distribution or reproduction in other forums is permitted, provided the original author(s) and the copyright owner(s) are credited and that the original publication in this journal is cited, in accordance with accepted academic practice. No use, distribution or reproduction is permitted which does not comply with these terms.
*Correspondence: Fei-Fei Hu, aHVmZWlmZWlAd3VzdC5lZHUuY24=; Yan Zeng, emVuZ3lhbjY4QHd1c3QuZWR1LmNu
†These authors have contributed equally to this work
Disclaimer: All claims expressed in this article are solely those of the authors and do not necessarily represent those of their affiliated organizations, or those of the publisher, the editors and the reviewers. Any product that may be evaluated in this article or claim that may be made by its manufacturer is not guaranteed or endorsed by the publisher.
Research integrity at Frontiers
Learn more about the work of our research integrity team to safeguard the quality of each article we publish.