
95% of researchers rate our articles as excellent or good
Learn more about the work of our research integrity team to safeguard the quality of each article we publish.
Find out more
ORIGINAL RESEARCH article
Front. Aging Neurosci. , 30 September 2022
Sec. Alzheimer's Disease and Related Dementias
Volume 14 - 2022 | https://doi.org/10.3389/fnagi.2022.998051
 Yawen Sun1†
 Ying Hu1†
 Yage Qiu1
 Yuyao Zhang2Changhao Jiang2Peiwen Lu3,4Qun Xu3,4,5Yuting Shi6
 Hongjiang Wei6*
 Yan Zhou1*
Purpose: The aim of this study was to investigate alterations in white matter lesions (WMLs) and normal-appearing white matter (NAWM) with small vessel disease (SVD) over 1–2 years using quantitative susceptibility mapping (QSM) and free-water (FW) mapping.
Methods: Fifty-one SVD patients underwent MRI brain scans and neuropsychological testing both at baseline and follow-up. The main approach for treating these patients is the management of risk factors. Quantitative susceptibility (QS), fractional anisotropy (FA), mean diffusivity (MD), FW, FW-corrected FA (FAT), and FW-corrected MD (MDT) maps within WMLs and NAWM were generated. Furthermore, the JHU-ICBM-DTI label atlas was used as an anatomic guide, and the measurements of the segmented NAWMs were calculated. The average regional values were extracted, and a paired t-test was used to analyze the longitudinal change. Partial correlations were used to assess the relationship between the MRI indices changes (e.g., ΔQSfollowup − baseline/QSbaseline) and the cognitive function changes (e.g., ΔMoCAfollowup − baseline/MoCAbaseline).
Results: After SVD risk factor control, no gradual cognitive decline occurred during 1–2 years. However, we still found that the QS values (index of demyelination) increased in the NAWM at follow-up, especially in the NAWM part of the left superior frontal blade (SF), left occipital blade, right uncinate fasciculus, and right corticospinal tract (CST). FW (index of neuroinflammation/edema) analysis revealed that the follow-up group differed from the baseline group in the NAWM part of the right CST and inferior frontal blade (IF). Decreased FAT (index of axonal loss) was observed in the NAWM part of the right SF and IF at follow-up. In addition, the FAT changes in the NAWM part of the right IF were associated with overall cognitive performance changes. In contrast, no significant differences were found in the WMLs.
Conclusion: The NAWM was still in the progressive injury process over time, while WMLs remained relatively stable, which supports the notion that SVD is a chronic progressive disease. The process of axonal loss in the NAWM part of the prefrontal lobe might be a biomarker of cognitive changes in the evolution of SVD.
Small vessel disease (SVD) is a common accompaniment of aging. It refers to a syndrome of clinical and MRI findings that are thought to result from pathologies in perforating cerebral arterioles, capillaries, and likely venules (Shi and Wardlaw, 2016). SVD can be accelerated and potentiated by different vascular risk factors (Caruso et al., 2019; Moretti and Caruso, 2020). Cognitive impairment problems are frequently seen in SVD. SVD progresses to subcortical vascular dementia (SVaD) and contributes to 45% of dementia cases (Gorelick et al., 2011). The diagnosis of SVD has heavily relied on non-invasive MRI findings since it is challenging to visualize SVD pathologies in vivo. White matter lesions (WMLs) on MRI are considered the hallmark of SVD and have become a significant contributor to cognitive dysfunction (Wardlaw et al., 2013; Shi and Wardlaw, 2016). However, SVD brain damage is not confined to visible lesions. It is a dynamic and whole-brain disease (Shi and Wardlaw, 2016). More sensitive MRI methods indicate that microstructural alterations occur in the surrounding normal-appearing white matter (NAWM), which worsens as WMLs increase (Maniega et al., 2015; Munoz Maniega et al., 2017). Thus, finding potential microstructural changes in NAWM for early diagnosis before the onset of clinical deterioration is an urgent matter.
The pathophysiological mechanisms underlying the development from NAWM to WMLs in SVD remain poorly understood. The underlying pathology of WMLs primarily reflects demyelination, axonal loss, edema, and inflammation (Craggs et al., 2014; Prins and Scheltens, 2015; Rosenberg, 2017). However, pathological studies mainly and inevitably describe late-stage disease, which provides limited insights into the dynamic evolution of tissue changes. Cerebrospinal fluid biomarkers can also provide a more precise measurement of SVD (Paolini Paoletti et al., 2021; Moretti and Caruso, 2022). For example, myelin lipid sulfatide and myelin basic protein may reflect demyelination and remyelination processes. The neurofilament light chain, a marker of axonal damage, was found to increase early in SVD (Paolini Paoletti et al., 2021). However, noninvasive tests would have to be widely performed. To this end, advanced MRI techniques have been used in the in vivo assessment of brain tissue and have been shown to reflect the histopathological and functional substrates in WMLs and the NAWM (Promjunyakul et al., 2018; Wong et al., 2019; Konieczny et al., 2021). Previous diffusion tensor imaging (DTI) studies have shown that the development of focal WMLs is preceded by diffuse alterations to the microstructure of the surrounding NAWM (Maillard et al., 2011; de Groot et al., 2013). Diffusion-related changes in the tissue microstructure in NAWM are reflective of progressive damage before the appearance of WMLs, which have significant impact on the rate of cognitive decline (Vemuri et al., 2021). Longitudinal studies have shown that structural integrity changes in the NAWM at baseline are associated WML expansion over time, with decreased fractional anisotropy (FA) and increased mean diffusivity (MD) (Promjunyakul et al., 2018; van Leijsen et al., 2018). At the histopathologic level, the DTI measures (FA and MD) were associated with axonal and myelin density of water matter in SVD (van Veluw et al., 2019). However, vasogenic edema associated with neuroinflammation cannot be measured or differentiated from axon/myelin injury by DTI, limiting its clinical applications. In addition, diffusion measures within brain tissues can be affected by partial volume effects due to edema and cerebrospinal fluid (Alexander et al., 2007; Metzler-Baddeley et al., 2012). When voxels contain free water, diffusion measures can be biased toward a pattern of high MD and reduced FA.
Free-water (FW) mapping is a novel DTI analysis technique obtained from a bi-tensor model. It was developed to explicitly estimate the fractional volume of freely diffusing water molecules within the voxel (Pasternak et al., 2009; Metzler-Baddeley et al., 2012). It can provide more microstructural information because it can separate the diffusion properties of water in brain tissue from those of FW. It enables differentiation between alterations in the tissues themselves as measured by FW-corrected DTI indices and extracellular FW changes, such as neuroinflammation, as measured by the fractional volume of FW (Pasternak et al., 2009; Andica et al., 2019). This technique can provide novel evidence to distinguish between axonal injury and neuroinflammation in the white matter (Wang et al., 2011), which may provide a better understanding of the progression of SVD. Furthermore, quantitative susceptibility mapping (QSM) can be used to quantify myelin levels and thereby demyelination in tissue at the voxel scale, as the magnetic properties of myelin are vastly different from those of axons. The myelin sheath is the predominant source of susceptibility contrast in the white matter, mainly because of its diamagnetic property (Cao et al., 2014; Wang et al., 2019). Thus, QSM could be more sensitive and specific to the demyelination process than diffusion metrics (Liu et al., 2011; Cao et al., 2014). Therefore, QSM together with FW mapping has great potential to provide noninvasive biomarkers for demyelination, neuroinflammation, and axonal injury coexisting in SVD.
In the present longitudinal study, we performed a multiparametric evaluation using QSM and FW mapping in SVD focusing on white matter at baseline and follow-up (two time points with a 1–2-year period). The main approach for treating these SVD patients is the management of risk factors and healthy lifestyle behaviors. Currently, prevention is particularly important when there is no effective treatment for cognitive decline in SVD. Common risk factors, such as diabetes mellitus, hypertension, hyperlipidemia, and cigarette smoking, contribute to SVD changes through the build-up of atherosclerotic plaque, lipohyalinosis, arteriolosclerosis, and fibrinoid necrosis (Raman et al., 2016). We hypothesized that QSM and FW mapping could provide complementary information about the white matter of SVD patients. We compared quantitative susceptibility (QS) values and FW values and examined the effect of FW correction on FA and MD changes in WMLs and NAWMs. The comparisons were performed on two levels: a global white matter analysis and an atlas-based region of interest (ROI) analysis. We performed ROI analysis to investigate the alterations in specific white matter tracts, which may contribute to explaining the relationship with cognitive function. Finally, we explored the association between these MRI indices and cognitive function.
All SVD patients were recruited from among patients who were admitted to the Neurology Department of Ren Ji Hospital. Each patient underwent a standard baseline evaluation, including neurological examination, complete sociodemographic and clinical data, including vascular risk factors, neuropsychological tests, and multimodal brain MRI examination. In brief, the recruitment and inclusion criteria were as follows: (1) age between 50 and 85 years old; (2) education over 6 years; (3) at least 1 month after clinical stroke accident; (4) presence of ≥ 1 subcortical lacunar infarct(s) and WMLs on MRI; and (5) a modified Rankin score ≤ 3 points. Exclusion criteria were as follows: (1) severe systemic or other diseases that may cause cognitive dysfunction; (2) cortical and/or cortico–subcortical non-lacunar infarcts; (3) WMLs due to other specific causes; (4) cardioembolic or large-vessel diseases; (5) severe brain atrophy; (6) intracranial space-occupying lesions; (7) microbleeds or hemorrhage; (8) severe depression (17-item Hamilton Depression Rating Scale score ≥ 24); (9) other major central neurological or psychiatric disorders; and (10) severe claustrophobia or contraindications to MRI examination. All the patients were right-handed.
The follow-up neuropsychological tests and brain MRI scans were performed 1–2 years later. Finally, altogether, 51 SVD patients with DTI, QSM, and structural MRI scans and neuropsychological assessments both at baseline and at follow-up were included in this study. No patient suffered a transient ischemic attack or a stroke between baseline and follow-up.
A standardized battery of multidomain cognitive tests was performed within a week after MRI examination by a trained neuropsychologist. The MoCA and Mini-Mental State Examination (MMSE) were used to assess overall cognitive performance. In addition, the following tests were used to evaluate four key cognitive domains: (1) attention and executive function: Trail-Making Tests A and B (TMT-A, TMT-B), Stroop color-word test C (Stroop C-T), and category Verbal Fluency Test (VFT); (2) memory function: Rey Auditory Verbal Learning Test of short- and long-delay free recall (AVLT-short, AVLT-long); (3) language function: Boston naming test (30 items) (BNT); and (4) visuospatial function: Rey-Osterrieth Complex Figure Test (copy) (Rey-O copy).
MRI scanning was conducted at baseline and follow-up both on a 3.0 T MRI scanner (GE Signa HDxt, USA) equipped with an eight-channel phased array head coil at Ren Ji Hospital. No major hardware or software upgrades to the MRI system occurred during the duration of this study. Restraining foam pads were used to reduce head motion, and earplugs were used to reduce scanner noise. QSM images with whole-brain coverage were acquired using a standard flow-compensated three-dimensional spoiled gradient recalled (3D-SPGR) sequence with the following parameters: TE1/ΔTE/TE16 = 3.2/2.42/39.5 ms, TR = 42.5 ms, FA = 12°, bandwidth = 62.5 kHz, FOV = 220 × 220 mm2, matrix = 256 × 256, slices = 66, slice thickness = 2 mm, and spatial resolution = 0.86 × 0.86 × 1 mm3. DTI images were acquired using a spin-echo single-shot echo-planar pulse sequence with the following parameters: TE = 89.8 ms, TR = 17,000 ms, FOV = 256 × 256 mm2, matrix = 128 × 128, gap = 0, slices = 66, slice thickness = 2 mm, 20 diffusion-weighted scans with a b-value of 1,000 s/mm2, and b0 = 0. Sagittal T1-weighted (T1w) images were acquired with a 3D-SPGR sequence with the following parameters: TE = 1.7 ms, TR = 5.5 ms, TI = 450 ms, FA = 15°, FOV = 256 × 256 mm2, matrix = 256 × 256, gap = 0, slices = 155, and slice thickness = 1.0 mm. The parameters used to obtain axial T2-fluid attenuated inversion recovery sequence (FLAIR) were as follows: TE = 150 ms, TR = 9,075 ms, TI = 2,250 ms, FOV = 256 × 256 mm2, matrix = 256 × 256, slices = 66, and slice thickness = 2 mm.
QSM images were reconstructed from GRE phase data using the STISuite toolbox (https://people.eecs.berkeley.edu/~chunlei.liu/software.html). The details of QSM processing have been presented in previous studies (Wei et al., 2015, 2017). Briefly, the 3D phase image from the complex GRE data was first unwrapped using the Laplacian-based method (Schofield and Zhu, 2003). The tissue phase was estimated from the unwrapped image by removing the background phase using variable-kernel sophisticated harmonic artifact reduction for phase data (V_SHARP) (Wu et al., 2012). Finally, a two-step field-to-source method called streaking reduction in QSM (STAR-QSM) (Wei et al., 2015) was used for dipole inversion to calculate the magnetic susceptibility.
All diffusion MRI data from 64 different axial, sagittal, and coronal directions were visually checked. Moreover, all datasets were free from severe artifacts such as gross geometric distortion, signal dropout, or bulk motion. Diffusion MRI data were then corrected for susceptibility-induced geometric distortions, eddy current distortions, and intervolume subject motion. Single-tensor FA and MD maps were generated using the DTIFIT tool implemented in FMRIB Software Library version 5.0.9 (FSL; Oxford Center for Functional MRI of the Brain, Oxford, UK; www.fmrib.ox.ac.uk/fsl). Moreover, FW maps were calculated by fitting a bi-tensor model based on the diffusion measurements (Ofori et al., 2015a,b; Burciu et al., 2017). The bi-tensor model predicts the signal attenuation of the water molecules contributed by intracellular and extracellular water. FW mostly occupies the extracellular space. The FW maps reflect the volume fraction of FW content within each voxel. The generated FW maps include FW, FA, FW-corrected FA (FAT), MD, and FW-corrected MD (MDT) maps.
Figure 1 illustrates the pipeline of registration and generation of labels. First, we used the T1w image as the intermedium to register the multimodal images into the same space. For each individual, the magnitude image was registered to the T1w image using SyN registration. The generated deformation field was then used to register the QSM image to the T1w image. Similarly, the B0 image was registered to the T1w image using SyN registration, and then, the deformation field was applied to register the FW, FA, FAT, MD, and MDT images to the T1w image. Second, we registered the individual T1w images to the MNI standard space using SyN registration, and the inverse deformation field was applied to register ICBM-DTI-81 labels from the MNI standard space to the individual T1w space.
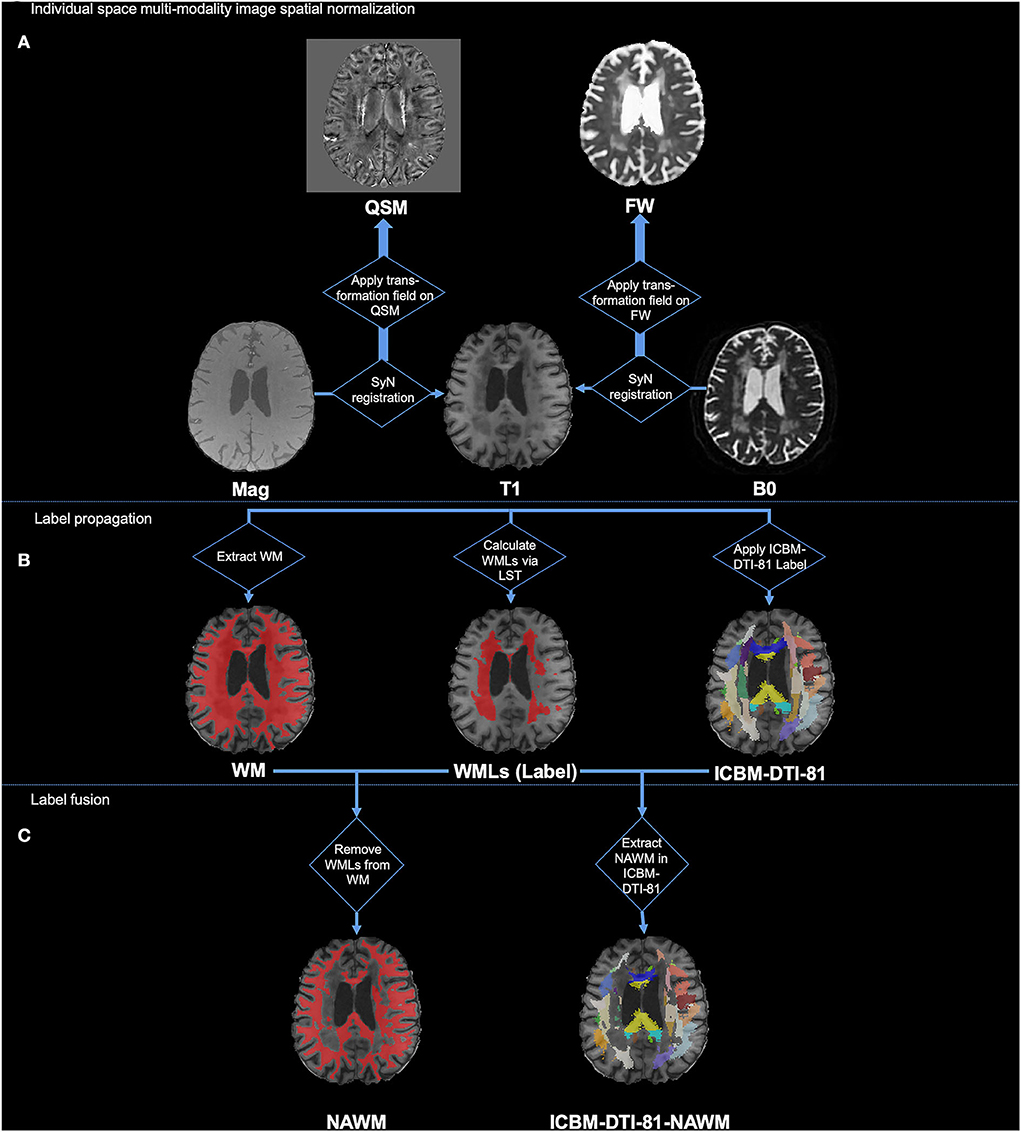
Figure 1. Illustration of processing pipeline of image registration and generation of labels. (A) Individual space multi-modality image spatial normalization; (B) Label propagation; (C) Label fusion.
After the registration of the multimodal images and sets of labels, we then used them to generate the WMLs label, NAWM label, and ICBM-DTI-81-NAWM labels. Specifically, the ICBM-DTI-81-NAWM labels were the WMLs removed from white matter fiber bundle parcellation, as shown in Figure 1C label fusion part. First, the segment of the white matter mask was generated from the individual T1w image by FAST in FSL (Zhang et al., 2001; Jenkinson et al., 2012). Second, the T1w image and the FLAIR image of each individual were used to delineate the WMLs (WMLs ROI in Figure 1B) in T1w space using the LST's lesion growth algorithm (Schmidt et al., 2012). We gave it the “WMLs” label. Afterward, we removed the WMLs ROI from the white matter mask and provided this fused mask with the “NAWM” label. In addition, we assessed the quality of the automatic labeling of WMLs and NAWM. By intersecting the NAWM mask and the ICBM-DTI-81 labels, we finally generated the ICBM-DTI-81-NAWM labels, which indicated the NAWM part in each of the white matter tracts. Finally, values in each ROI of T1w, QSM, and FW maps (e.g., mean, volume) of the WML label, NAWM label, and ICBM-DTI-81-NAWM labels were calculated for further statistical analysis.
All statistical analyses were performed using SPSS (IBM SPSS Statistics v23.0; IBM Co., Armonk, NY, USA) and MATLAB R2012b (MathWorks, Natick, MA, USA). A paired t-test was used to analyze the longitudinal changes, and the evaluated aspects included the mean values and volumes of WMLs, NAWM, and the NAWM part in each of the white matter tracts. Comparisons between the baseline and follow-up clinical scores were also performed with a paired t-test. The average regional values were extracted to perform partial correlation analyses to assess whether cognitive function was associated with the white matter regions exhibiting significant differences in MRI indices. Delta values were calculated as the degree of change between the follow-up and baseline (e.g., ΔQSfollowup − baseline/QSbaseline). Associations between longitudinal MRI indices changes (e.g., ΔQSfollowup − baseline/QSbaseline) and cognitive function changes (e.g., ΔMoCAfollowup − baseline/MoCAbaseline) were explored using partial correlation analysis, with patient age, gender, years of education, and mean follow-up time as covariates. P < 0.05 was considered statistically significant in this study (without multiple comparison correction as an explorative study).
Table 1 shows baseline demographic characteristics, risk factors, and cognitive test score differences between baseline and follow-up. Fifty-one SVD patients were included in this study, with a mean age of 64.69 ± 6.53 years, and 43 SVD patients were male (84.31%). There were no significant differences in MMSE, MoCA, TMT-A, Stroop C-T, VFT, AVLT-short, AVLT-long, BNT, or Rey-O copy scores between baseline and follow-up (all p > 0.05). However, the follow-up group had a lower TMT-B score than the baseline group (baseline: 188.98 ± 76.37 s; follow-up:174.16 ± 70.44 s; p = 0.024). For the TMT-B, the lower score reveals executive function improvement. In our study, the TMT-B scores at baseline and follow-up were both within the normal range (the deficient score should be >273 s). The mean follow-up time was 1.19 ± 0.42 years (from 0.84 to 2.40 years).
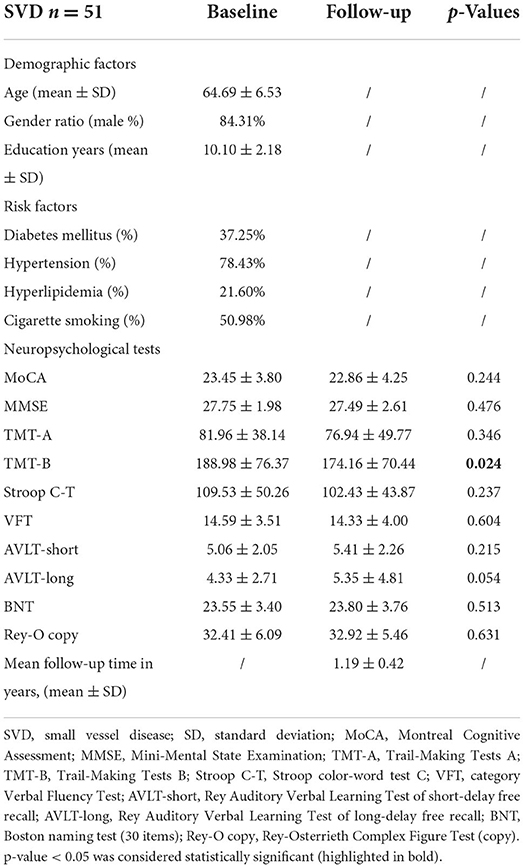
Table 1. Demographic and clinical characteristics of the participants.
The comparisons between baseline and follow-up in WMLs and NAWM regions are summarized in Table 2 and Figure 2. Over 1–2 years, no significant difference was found in QS, FA, MD, FW, FAT, or MDT values or in the volumes between baseline and follow-up in the WMLs region (all p > 0.05). However, a significant difference in QS values was found in NAWM. The mean QS values increased significantly at follow-up (baseline: −0.876 ± 0.534 ppb; follow-up: −0.748 ± 0.574 ppb; p = 0.029). No differences in the other MRI indices outlined above were found when comparing baseline and follow-up for NAWM.

Table 2. Baseline and follow-up MRI indices in WMLs and NAWM in SVD.
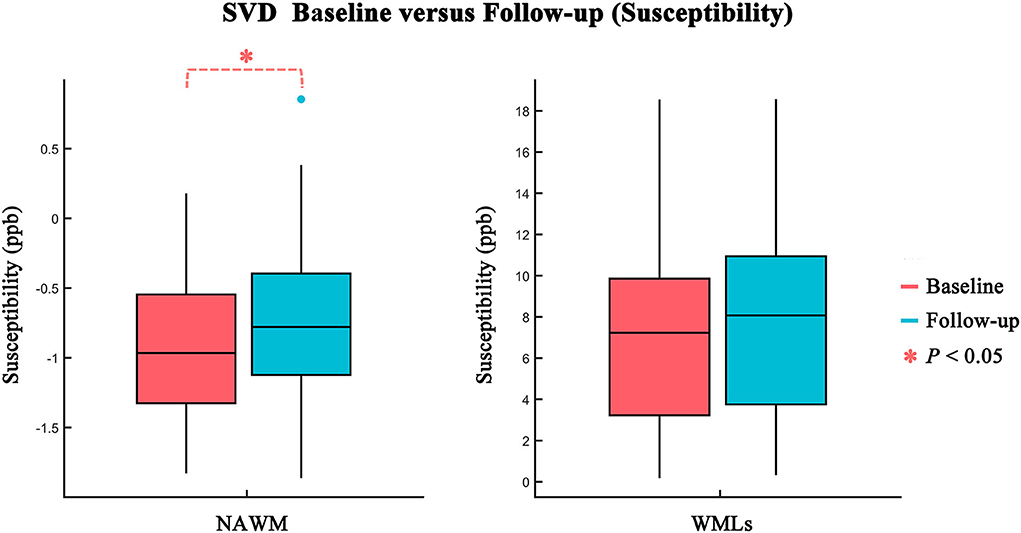
Figure 2. Comparison of susceptibility values between baseline (red) and follow-up (blue) in NAWM and WMLs. Statistically significant difference is delineated by red dashed bracket.
Figure 3 and Table 3 show the atlas-based analysis results for QS values, volume, DTI (FA and MD), and FW imaging indices (FW, FAT, and MDT) between baseline and follow-up. Among the NAWM parts of the white matter tracts, the left superior frontal blade (baseline: −3.454 ± 2.148 ppb; follow-up: −2.861 ± 2.004 ppb; p = 0.041), left occipital blade (baseline: −4.411 ± 2.518 ppb; follow-up: −3.800 ± 2.455 ppb; p = 0.022), right uncinate fasciculus (baseline: −6.481 ± 6.720 ppb; follow-up: −4.265 ± 7.267 ppb; p = 0.033), and right corticospinal tract (baseline: −7.134 ± 4.388 ppb; follow-up: −5.623 ± 4.549 ppb; p = 0.044) demonstrated significantly higher QS values at follow-up than at baseline. The results of FW analysis revealed that SVD patients at follow-up had higher FW in the NAWM part of the right corticospinal tract (baseline: 0.302±0.015; follow-up: 0.307 ± 0.013; p = 0.029) and lower FW in the NAWM part of the right inferior frontal blade (baseline: 0.310 ± 0.010; follow-up: 0.307±0.009; p = 0.021). The right inferior frontal blade demonstrated significantly decreased FA (baseline: 0.372 ± 0.028; follow-up: 0.367 ± 0.027; p = 0.027) and FAT (baseline: 0.498 ± 0.041; follow-up: 0.488 ± 0.042; p = 0.009) at follow-up compared to baseline. Moreover, the SVD patients had decreased FAT in the right superior frontal blade (baseline: 0.510 ± 0.042; follow-up: 0.503 ± 0.041; p = 0.011) at follow-up. No significant differences in MD, MDT, or volume were found in this longitudinal study.
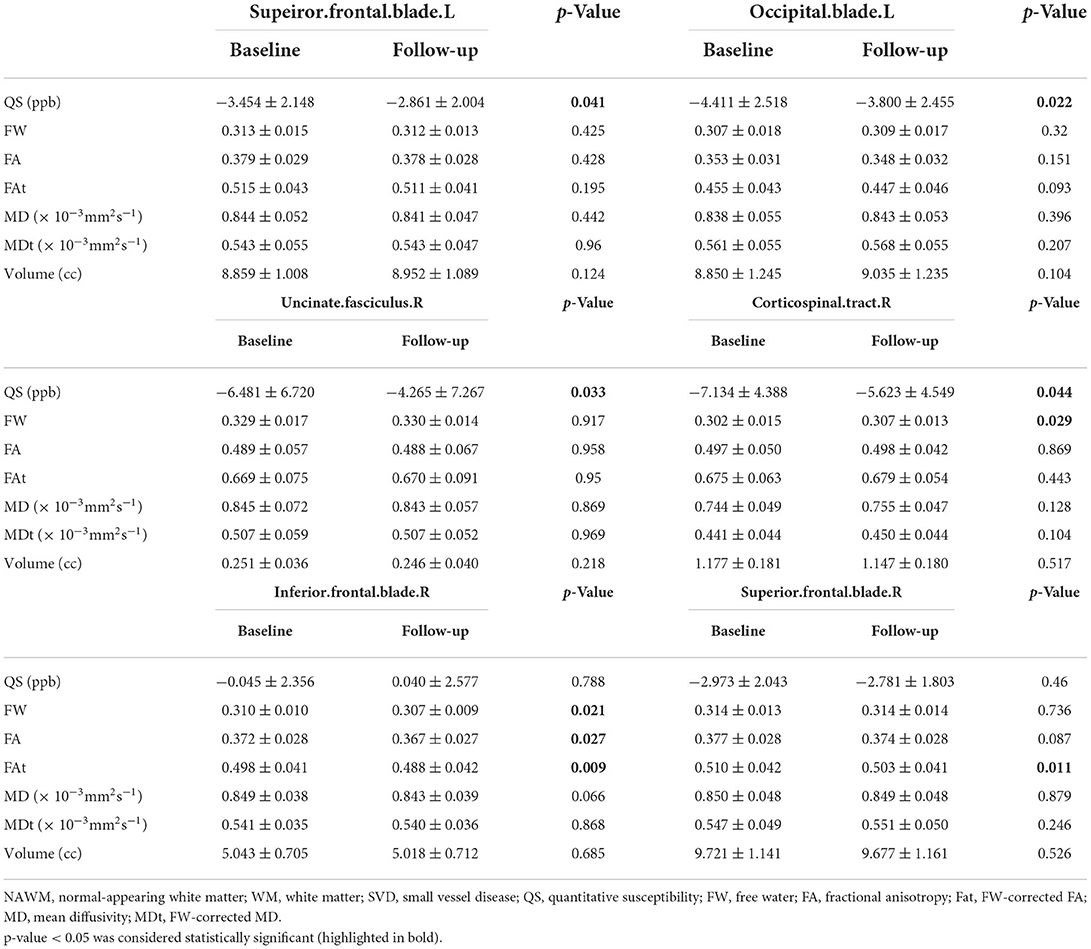
Table 3. Baseline and follow-up MRI indices in the NAWM part in each of the WM tracts in SVD.
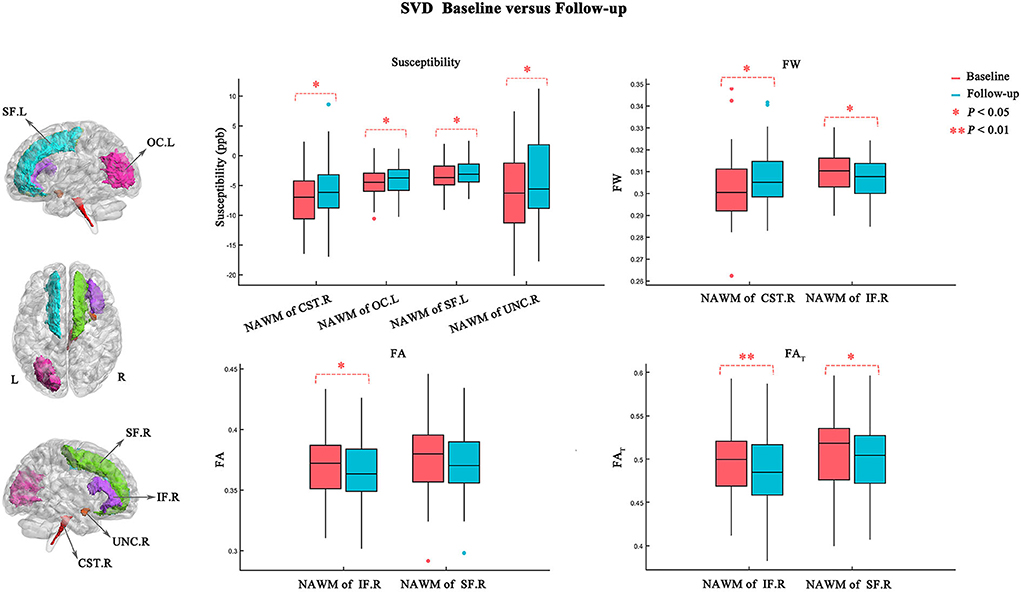
Figure 3. Atlas-based analysis results for susceptibility, FW, FA, and FAT values between baseline (red) and follow-up (blue). Statistically significant difference is delineated by red dashed bracket.
The degree of the FAT changes (ΔFATfollowup − baseline/ FATbaseline) in the NAWM part of the right inferior frontal blade was positively correlated with both MoCA score changes (ΔMoCAfollowup − baseline/MoCAbaseline) (p = 0.012, r = 0.365; Figure 4A) and MMSE score changes (ΔMMSEfollowup − baseline/MMSEbaseline) (p = 0.034, r = 0.309; Figure 4B), which represent overall cognitive performance. However, no significant correlations were identified between other MRI indices and neuropsychological tests.
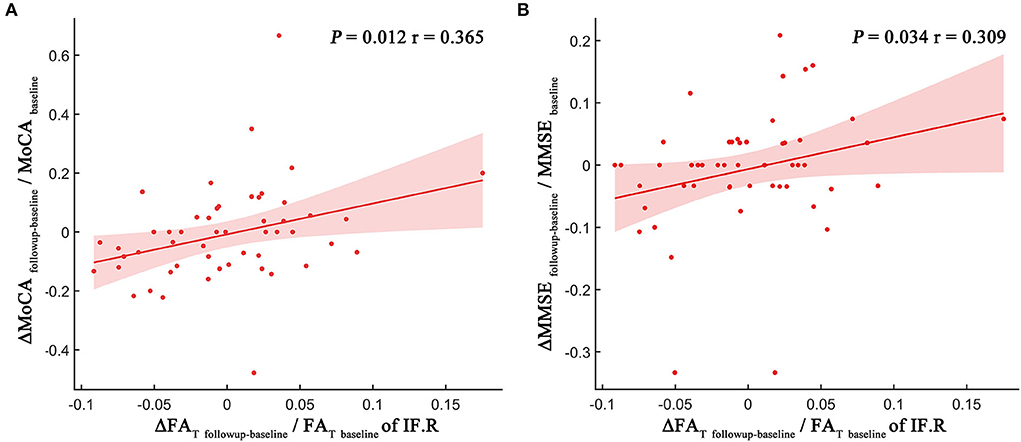
Figure 4. Scatter plot illustrating the relationship between longitudinal MRI indices changes and MoCA score changes (A) and MMSE score changes (B). The dots represent the adjusted values after controlling age, gender, years of education, and mean follow-up time.
The current study explored the WMLs and NAWM alterations in patients with SVD using QSM and FW images. Although there is no evidence for cognitive decline over 1–2 years in SVD, the change in QSM and FW indices is detectable in NAWM. First, there was a trend toward increased QS in the NAWM (especially in the NAWM part of the left superior frontal blade, left occipital blade, right uncinate fasciculus, and right corticospinal tract) at follow-up, which usually results from demyelination. Second, the FW values in the follow-up group differed significantly from the baseline group in the NAWM part of the right corticospinal tract and inferior frontal blade, which indicated neuroinflammation and edema changes. Third, decreased FAT was observed in the NAWM part of the right superior frontal blade and inferior frontal blade at follow-up, whereas decreased FA was observed only in the NAWM part of the right inferior frontal blade. The FW-corrected DTI indices may be able to derive more precise estimations of axonal loss compared with the DTI indices. In contrast, there was no significant difference in these MRI indices between baseline and follow-up in the WMLs over 1–2 years. We further found that the FAT changes in the NAWM part of the right inferior frontal blade were associated with overall cognitive performance changes, which indicated that axonal loss in the prefrontal lobe might be a biomarker of cognitive function. Overall, this longitudinal study in SVD has shown that changes in QSM and FW indices are detectable in NAWM over a 1–2-year follow-up period, which illustrated that NAWM was still in the progressive injury process. Our study supported that SVD is a chronic progressive disease.
WMLs are the typical signs of SVD and are usually symmetrically and bilaterally distributed in the white matter. They appear hyperintense to the brain on T2/FLAIR sequences and can be patchy or confluent depending on their stage of development and severity. The neuropathologic substrate of WMLs is a combination of demyelination, inflammation, edema, and loss of axons. Previous studies on WMLs change in SVD were mostly about progression. Both population-based and hospital-based studies have shown that WML volume increases over time (mean follow-up duration: 0.8–11 years) (van Leijsen et al., 2017). More recently, a decrease in WML volume has also been reported (Cho et al., 2015; Ramirez et al., 2016; Al-Janabi et al., 2019), challenging the assumption of a continuous progressive nature of SVD markers. They speculated that the change could be not only to permanent myelin loss or axonal damage but also to shifts in water content. WML regression may represent a longitudinal reduction in neuroinflammatory and edema changes associated with SVD (Wardlaw et al., 2015). In addition, a stable group of WMLs has also been identified in some studies (Ramirez et al., 2016; Al-Janabi et al., 2019). In sum, the WML change in SVD over time should be considered a dynamic and variable process. Our data show that there were no significant differences in WML volume between baseline and follow-up over 1–2 years, as well as no significant differences in FW values (index of neuroinflammation/edema), QS values (index of demyelination), and FW-corrected DTI indices (index of axonal loss). This implies that at least in this longitudinal study, the WMLs in SVD patients remained relatively stable. Thus, we also explored the changes within the NAWM in SVD over the years.
The neuropathologic changes in white matter spread widely, rather than being confined to visible WMLs. The demyelination, axonal loss, edema, and inflammation radiate into NAWM, indicating that the underlying pathology is a diffuse process affecting much of the white matter and that visible WMLs are probably only the “tip of the iceberg” (Wardlaw et al., 2015). Our results demonstrated that the NAWM changes might be more dynamic than previously thought. First, our work supported QSM as a sensitive technique that can specifically measure demyelination in NAWM. SVD is thought to result from chronic and progressive hypoperfusion affected by abnormal cerebral arterioles and capillaries. Tissue hypoxia plays a potential pathogenic role in the development of WMLs. Previous studies have found that hypoperfusion always precedes NAWM changes (Promjunyakul et al., 2016; Wu et al., 2019). Indeed, the cells which are most vulnerable to hypoxic damage in NAWM, including oligodendrocytes (oligodendrocytes form myelin and support axons by supplying energy), die first, resulting in demyelination in SVD (Martinez Sosa and Smith, 2017). QSM has been developed to derive voxel-based magnetic susceptibility. Myelin is the dominant source of susceptibility contrast in white matter. It has been shown that QSM may be more sensitive and specific to the demyelination/remyelination process than DTI metrics (Liu et al., 2011; Wang et al., 2019). In this study, we found increased QS values in the NAWM to be widespread over 1–2 years, which should result from demyelination. We speculated that loss of oligodendrocytes during chronic and progressive hypoperfusion might contribute to demyelination in NAWM and that NAWM in SVD is still in the progressive injury process over the years.
Blood–brain barrier permeability increases with age, and this process appears to be accelerated in SVD (Farrall and Wardlaw, 2009). Several studies have suggested that blood–brain barrier leakage may be positively associated with WMLs (Huisa et al., 2015; Kerkhofs et al., 2021). Blood–brain barrier leakage is apparent in NAWM and worsens with proximity to the WMLs. Blood–brain barrier leakage might play an early role in subsequent microstructural white matter degeneration as part of the pathophysiology of SVD (Kerkhofs et al., 2021). Dysfunction of the blood–brain barrier might have several adverse effects: The leakage of fluids, proteins, and other plasma constituents into the perivascular tissues might increase interstitial fluid (edema) and neuroinflammation (Wardlaw et al., 2019). A recent hypothesis suggested that SVD patients show leakage of toxic plasma components through an impaired blood–brain barrier and cause secondary inflammation and injury to axons and myelin (Wardlaw et al., 2003). In the past, in vivo MRI has thus far lacked the specificity to demonstrate neuroinflammation/edema within the NAWM. Currently, FW mapping can address these effects. Our results from FW analysis demonstrated the neuroinflammation/edema alterations in the NAWM part of the corticospinal tract and inferior frontal blade in SVD. This finding indicated that the NAWM might include areas of tissue neuroinflammation/edema, and neuroinflammation/edema might progress or regress over time. The regression in tissue neuroinflammation/edema at a later stage could then lead to reduced WML volume. This might be the reason why WMLs regress in SVD over time. In addition, a recent study using neurite orientation dispersion and density imaging demonstrated that increased FW was the strongest predictor of cognitive function in participants in the Mayo Clinic Study of Aging (Raghavan et al., 2021). However, no significant correlations were identified in our SVD study. Future work should be undertaken to widely validate and compare FW outcomes in a larger patient cohort.
In the present study, we also found decreased FAT in the NAWM part of the right superior frontal blade and inferior frontal blade at follow-up, which is consistent with previous DTI studies (de Laat et al., 2011; Liu et al., 2020). Previous studies demonstrated that the FAT was able to derive more precise estimations of localized white matter damage compared with the DTI indices. The explanation could be that partialling out FW eliminates the influence of water on white matter tracts, thereby increasing the specificity of FW imaging indices (Pasternak et al., 2009; Oestreich et al., 2017; Andica et al., 2019). Moreover, reduced FAT usually results from axonal loss or damage that is permanent. Thus, we speculated that the NAWM of the prefrontal lobe might have suffered permanent and irreversible damage over 1–2 years in SVD. Specifically, our study also found both decreased FW and decreased FAT in the NAWM part of the right inferior frontal blade over time, which might support that neuroinflammation/edema may precede axonal damage in the NAWM/WMLs of patients with SVD. Furthermore, the degree of FAT changes in the prefrontal lobe has been linked to MoCA and MMSE score changes on tests of cognitive function. The impact of white matter damage on cognition is likely to depend not only on their total load but also on their location. Previous studies have pointed out that the prefrontal lobe plays an important role in cognitive control (Miller and Cohen, 2001). In particular, the inferior frontal blade is thought to exert a key role in the executive control of attention (Yin et al., 2013). Several meaningful studies have suggested that the main cognitive impairment is attention/executive function in SVD across multiple domains of cognition (Prins et al., 2005; Liang et al., 2021). Our results showed that white matter damage in the right inferior frontal blade, an important part of the executive/attention system, may lead to the progression of cognitive impairment, consistent with previous studies. Thus, the FAT could derive precise estimations of axonal loss, which was considered permanent and irreversible. We speculated that axonal loss in the NAWM part of the prefrontal lobe might be crucial for the pathophysiology of SVD-related cognitive impairment.
This study has several limitations. First, although SVD is a common brain disease and our group has collected neuroimaging data on SVD for many years, only a few patients were willing to take part in the follow-up study. Thus, only 51 SVD patients with complete MRI scans and neuropsychological assessments both at baseline and at follow-up were included in this study. Given the small sample size, only tentative conclusions can be drawn. In addition, our study lacks a control group. The presence of a control group would be important to draw deeper conclusions. Second, the manifestations of WMLs are complex, and we were unable to determine the precise mechanisms underlying these changes using in vivo MRI. Third, our study described the change in SVD markers over time using neuroimaging at only two time points, and the follow-up period was short. More time points will be needed to describe the dynamic changes. Future studies should examine longitudinal changes in a larger patient cohort over a longer time period. Fourth, multiple comparison correction was not applied because we were performing an exploratory analysis. Fifth, our study focused on the white matter of SVD. Future research will explore the differences in gray matter atrophy between baseline and follow-up and associations with other SVD markers.
In the present study, we determined that NAWM was still in the progressive injury process over 1–2 years, while WMLs remained relatively stable. QSM and FW mapping can be considered specific and sensitive tools for the monitoring of complex pathologies such as demyelination, neuroinflammation/edema, and axon loss in SVD. Furthermore, the process of axonal loss in the NAWM part of the prefrontal lobe, which is considered permanent and irreversible, might be a biomarker for the pathophysiological mechanism of cognitive decline in the evolution of SVD. Our results supported that SVD is a chronic progressive disease. We hope the early identification of pathological characteristics with advanced MR imaging can provide an opportunity to forestall progression before the emergence of symptoms in SVD. More effective therapies are urgently needed in future.
The raw data supporting the conclusions of this article will be made available by the authors, without undue reservation.
The studies involving human participants were reviewed and approved by the Research Ethics Committee of the Ren Ji Hospital, School of Medicine, Shanghai Jiao Tong University. The patients/participants provided their written informed consent to participate in this study.
YSu, YQ, and YH performed the MR examination. YSu, CJ, and YSh performed the image analysis. YSu and YH performed the statistical analysis. QX and PL performed neuropsychological tests. YZho and HW participated in the study design. YZho and YZha reviewed the manuscript. YSu was a major contributor in writing the manuscript. All authors read and approved the final manuscript and contributed to the discussion of the manuscript.
This work was supported by the National Natural Science Foundation of China (Grant Nos. 81901693, 82171885, and 82001457), Shanghai Rising Stars of Medical Talent Youth Development Program, Youth Medical Talents-Medical Imaging Practitioner Program (Grant No. SHWRS(2020)_087), Shanghai Science and Technology Committee Project (Natural Science Funding: Grant No. 20ZR1433200), Shanghai Science and Technology Committee Project (Explorer Project Funding: Grant No. 21TS1400700), and Medical Engineering Cross Research Foundation of Shanghai Jiao Tong University (Grant No. YG2017QN47).
The authors declare that the research was conducted in the absence of any commercial or financial relationships that could be construed as a potential conflict of interest.
All claims expressed in this article are solely those of the authors and do not necessarily represent those of their affiliated organizations, or those of the publisher, the editors and the reviewers. Any product that may be evaluated in this article, or claim that may be made by its manufacturer, is not guaranteed or endorsed by the publisher.
Alexander, A. L., Lee, J. E., Lazar, M., and Field, A. S. (2007). Diffusion tensor imaging of the brain. Neurotherapeutics 4, 316–329. doi: 10.1016/j.nurt.2007.05.011
Al-Janabi, O. M., Bauer, C. E., Goldstein, L. B., Murphy, R. R., Bahrani, A. A., Smith, C. D., et al. (2019). White matter hyperintensity regression: comparison of brain atrophy and cognitive profiles with progression and stable Groups. Brain Sci. 9, 170. doi: 10.3390/brainsci9070170
Andica, C., Kamagata, K., Hatano, T., Saito, A., Uchida, W., Ogawa, T., et al. (2019). Free-water imaging in white and gray matter in Parkinson's disease. Cells 8, 839. doi: 10.3390/cells8080839
Burciu, R. G., Ofori, E., Archer, D. B., Wu, S. S., Pasternak, O., McFarland, N. R., et al. (2017). Progression marker of Parkinson's disease: a 4-year multi-site imaging study. Brain 140, 2183–2192. doi: 10.1093/brain/awx146
Cao, W., Li, W., Han, H., O'Leary-Moore, S. K., Sulik, K. K., Allan Johnson, G., et al. (2014). Prenatal alcohol exposure reduces magnetic susceptibility contrast and anisotropy in the white matter of mouse brains. Neuroimage 102, 748–755. doi: 10.1016/j.neuroimage.2014.08.035
Caruso, P., Signori, R., and Moretti, R. (2019). Small vessel disease to subcortical dementia: a dynamic model, which interfaces aging, cholinergic dysregulation and the neurovascular unit. Vasc. Health Risk Manag. 15, 259–281. doi: 10.2147/VHRM.S190470
Cho, A. H., Kim, H. R., Kim, W., and Yang, D. W. (2015). White matter hyperintensity in ischemic stroke patients: it may regress over time. J. Stroke 17, 60–66. doi: 10.5853/jos.2015.17.1.60
Craggs, L. J., Yamamoto, Y., Deramecourt, V., and Kalaria, R. N. (2014). Microvascular pathology and morphometrics of sporadic and hereditary small vessel diseases of the brain. Brain Pathol. 24, 495–509. doi: 10.1111/bpa.12177
de Groot, M., Verhaaren, B. F., de Boer, R., Klein, S., Hofman, A., van der Lugt, A., et al. (2013). Changes in normal-appearing white matter precede development of white matter lesions. Stroke 44, 1037–1042. doi: 10.1161/STROKEAHA.112.680223
de Laat, K. F., Tuladhar, A. M., van Norden, A. G., Norris, D. G., Zwiers, M. P., and de Leeuw, F. E. (2011). Loss of white matter integrity is associated with gait disorders in cerebral small vessel disease. Brain 134, 73–83. doi: 10.1093/brain/awq343
Farrall, A. J., and Wardlaw, J. M. (2009). Blood-brain barrier: ageing and microvascular disease–systematic review and meta-analysis. Neurobiol. Aging 30, 337–352. doi: 10.1016/j.neurobiolaging.2007.07.015
Gorelick, P. B., Scuteri, A., Black, S. E., Decarli, C., Greenberg, S. M., Iadecola, C., et al. (2011). Vascular contributions to cognitive impairment and dementia: a statement for healthcare professionals from the American heart association/American stroke association. Stroke 42, 2672–2713. doi: 10.1161/STR.0b013e3182299496
Huisa, B. N., Caprihan, A., Thompson, J., Prestopnik, J., Qualls, C. R., and Rosenberg, G. A. (2015). Long-term blood-brain barrier permeability changes in binswanger disease. Stroke 46, 2413–2418. doi: 10.1161/STROKEAHA.115.009589
Jenkinson, M., Beckmann, C. F., Behrens, T. E., Woolrich, M. W., and Smith, S. M. (2012). FSL. Neuroimage 62, 782–790. doi: 10.1016/j.neuroimage.2011.09.015
Kerkhofs, D., Wong, S. M., Zhang, E., Staals, J., Jansen, J. F. A., van Oostenbrugge, R. J., et al. (2021). Baseline blood-brain barrier leakage and longitudinal microstructural tissue damage in the periphery of white matter hyperintensities. Neurology 96, e2192–e2200. doi: 10.1212/WNL.0000000000011783
Konieczny, M. J., Dewenter, A., Ter Telgte, A., Gesierich, B., Wiegertjes, K., Finsterwalder, S., et al. (2021). Multi-shell diffusion MRI models for white matter characterization in cerebral small vessel disease. Neurology 96, e698–e708. doi: 10.1212/WNL.0000000000011213
Liang, Z., Wu, L., Gong, S., and Liu, X. (2021). The cognitive dysfunction related to Alzheimer disease or cerebral small vessel disease: what's the differences. Medicine 100, e26967. doi: 10.1097/MD.0000000000026967
Liu, C., Li, W., Johnson, G. A., and Wu, B. (2011). High-field (9.4 T) MRI of brain dysmyelination by quantitative mapping of magnetic susceptibility. Neuroimage 56, 930–938. doi: 10.1016/j.neuroimage.2011.02.024
Liu, C., Shi, L., Zhu, W., Yang, S., Sun, P., Qin, Y., et al. (2020). Fiber connectivity density in cerebral small-vessel disease patients with mild cognitive impairment and cerebral small-vessel disease patients with normal cognition. Front. Neurosci. 14, 83. doi: 10.3389/fnins.2020.00083
Maillard, P., Fletcher, E., Harvey, D., Carmichael, O., Reed, B., Mungas, D., et al. (2011). White matter hyperintensity penumbra. Stroke 42, 1917–1922. doi: 10.1161/STROKEAHA.110.609768
Maniega, S. M., Valdes Hernandez, M. C., Clayden, J. D., Royle, N. A., Murray, C., Morris, Z., et al. (2015). White matter hyperintensities and normal-appearing white matter integrity in the aging brain. Neurobiol. Aging 36, 909–918. doi: 10.1016/j.neurobiolaging.2014.07.048
Martinez Sosa, S., and Smith, K. J. (2017). Understanding a role for hypoxia in lesion formation and location in the deep and periventricular white matter in small vessel disease and multiple sclerosis. Clin. Sci. 131, 2503–2524. doi: 10.1042/CS20170981
Metzler-Baddeley, C., O'Sullivan, M. J., Bells, S., Pasternak, O., and Jones, D. K. (2012). How and how not to correct for CSF-contamination in diffusion MRI. Neuroimage 59, 1394–1403. doi: 10.1016/j.neuroimage.2011.08.043
Miller, E. K., and Cohen, J. D. (2001). An integrative theory of prefrontal cortex function. Annu. Rev. Neurosci. 24, 167–202. doi: 10.1146/annurev.neuro.24.1.167
Moretti, R., and Caruso, P. (2020). Small vessel disease-related dementia: an invalid neurovascular coupling? 21, 1095. Int. J. Mol. Sci. doi: 10.3390/ijms21031095
Moretti, R., and Caruso, P. (2022). Small vessel disease: ancient description, novel biomarkers. Int. J. Mol. Sci. 23, 3508. doi: 10.3390/ijms23073508
Munoz Maniega, S., Chappell, F. M., Valdes Hernandez, M. C., Armitage, P. A., Makin, S. D., Heye, A. K., et al. (2017). Integrity of normal-appearing white matter: influence of age, visible lesion burden and hypertension in patients with small-vessel disease. J. Cereb. Blood Flow Metab. 37, 644–656. doi: 10.1177/0271678X16635657
Oestreich, L. K. L., Lyall, A. E., Pasternak, O., Kikinis, Z., Newell, D. T., Savadjiev, P., et al. (2017). Characterizing white matter changes in chronic schizophrenia: a free-water imaging multi-site study. Schizophr. Res. 189, 153–161. doi: 10.1016/j.schres.2017.02.006
Ofori, E., Pasternak, O., Planetta, P. J., Burciu, R., Snyder, A., Febo, M., et al. (2015a). Increased free water in the substantia nigra of Parkinson's disease: a single-site and multi-site study. Neurobiol. Aging 36, 1097–1104. doi: 10.1016/j.neurobiolaging.2014.10.029
Ofori, E., Pasternak, O., Planetta, P. J., Li, H., Burciu, R. G., Snyder, A. F., et al. (2015b). Longitudinal changes in free-water within the substantia nigra of Parkinson's disease. Brain 138, 2322–2331. doi: 10.1093/brain/awv136
Paolini Paoletti, F., Simoni, S., Parnetti, L., and Gaetani, L. (2021). The contribution of small vessel disease to neurodegeneration: focus on Alzheimer's disease, Parkinson's disease and multiple sclerosis. Int. J. Mol. Sci. 22, 4958. doi: 10.3390/ijms22094958
Pasternak, O., Sochen, N., Gur, Y., Intrator, N., and Assaf, Y. (2009). Free water elimination and mapping from diffusion MRI. Magn. Reson. Med. 62, 717–730. doi: 10.1002/mrm.22055
Prins, N. D., and Scheltens, P. (2015). White matter hyperintensities, cognitive impairment and dementia: an update. Nat. Rev. Neurol. 11, 157–165. doi: 10.1038/nrneurol.2015.10
Prins, N. D., van Dijk, E. J., den Heijer, T., Vermeer, S. E., Jolles, J., Koudstaal, P. J., et al. (2005). Cerebral small-vessel disease and decline in information processing speed, executive function and memory. Brain 128, 2034–2041. doi: 10.1093/brain/awh553
Promjunyakul, N. O., Dodge, H. H., Lahna, D., Boespflug, E. L., Kaye, J. A., Rooney, W. D., et al. (2018). Baseline NAWM structural integrity and CBF predict periventricular WMH expansion over time. Neurology 90, e2119–e2126. doi: 10.1212/WNL.0000000000005684
Promjunyakul, N. O., Lahna, D. L., Kaye, J. A., Dodge, H. H., Erten-Lyons, D., Rooney, W. D., et al. (2016). Comparison of cerebral blood flow and structural penumbras in relation to white matter hyperintensities: a multi-modal magnetic resonance imaging study. J. Cereb. Blood Flow Metab. 36, 1528–1536. doi: 10.1177/0271678X16651268
Raghavan, S., Reid, R. I., Przybelski, S. A., Lesnick, T. G., Graff-Radford, J., Schwarz, C. G., et al. (2021). Diffusion models reveal white matter microstructural changes with ageing, pathology and cognition. Brain Commun. 3, fcab106. doi: 10.1093/braincomms/fcab106
Raman, M. R., Kantarci, K., Murray, M. E., Jack, C. R. Jr., and Vemuri, P. (2016). Imaging markers of cerebrovascular pathologies: Pathophysiology, clinical presentation, and risk factors. Alzheimers Dement 5, 5–14. doi: 10.1016/j.dadm.2016.12.006
Ramirez, J., McNeely, A. A., Berezuk, C., Gao, F., and Black, S. E. (2016). Dynamic progression of white matter hyperintensities in Alzheimer's disease and normal aging: results from the sunnybrook dementia study. Front. Aging Neurosci. 8, 62. doi: 10.3389/fnagi.2016.00062
Rosenberg, G. A. (2017). Extracellular matrix inflammation in vascular cognitive impairment and dementia. Clin. Sci. 131, 425–437. doi: 10.1042/CS20160604
Schmidt, P., Gaser, C., Arsic, M., Buck, D., Förschler, A., Berthele, A., et al. (2012). An automated tool for detection of FLAIR-hyperintense white-matter lesions in multiple sclerosis. Neuroimage 59, 3774–3783. doi: 10.1016/j.neuroimage.2011.11.032
Schofield, M. A., and Zhu, Y. (2003). Fast phase unwrapping algorithm for interferometric applications. Opt. Lett. 28, 1194–1196. doi: 10.1364/OL.28.001194
Shi, Y., and Wardlaw, J. M. (2016). Update on cerebral small vessel disease: a dynamic whole-brain disease. Stroke Vasc. Neurol. 1, 83–92. doi: 10.1136/svn-2016-000035
van Leijsen, E. M. C., Bergkamp, M. I., van Uden, I. W. M., Ghafoorian, M., van der Holst, H. M., Norris, D. G., et al. (2018). Progression of white matter hyperintensities preceded by heterogeneous decline of microstructural integrity. Stroke 49, 1386–1393. doi: 10.1161/STROKEAHA.118.020980
van Leijsen, E. M. C., de Leeuw, F. E., and Tuladhar, A. M. (2017). Disease progression and regression in sporadic small vessel disease-insights from neuroimaging. Clin. Sci. 131, 1191–1206. doi: 10.1042/CS20160384
van Veluw, S. J., Reijmer, Y. D., van der Kouwe, A. J., Charidimou, A., Riley, G. A., Leemans, A., et al. (2019). Histopathology of diffusion imaging abnormalities in cerebral amyloid angiopathy. Neurology 92, e933–e943. doi: 10.1212/WNL.0000000000007005
Vemuri, P., Graff-Radford, J., Lesnick, T. G., Przybelski, S. A., Reid, R. I., Reddy, A. L., et al. (2021). White matter abnormalities are key components of cerebrovascular disease impacting cognitive decline. Brain Commun. 3, fcab076. doi: 10.1093/braincomms/fcab076
Wang, N., Zhuang, J., Wei, H., Dibb, R., Qi, Y., and Liu, C. (2019). Probing demyelination and remyelination of the cuprizone mouse model using multimodality MRI. J. Magn. Reson. Imaging 50, 1852–1865. doi: 10.1002/jmri.26758
Wang, Y., Wang, Q., Haldar, J. P., Yeh, F. C., Xie, M., Sun, P., et al. (2011). Quantification of increased cellularity during inflammatory demyelination. Brain 134, 3590–3601. doi: 10.1093/brain/awr307
Wardlaw, J. M., Sandercock, P. A., Dennis, M. S., and Starr, J. (2003). Is breakdown of the blood-brain barrier responsible for lacunar stroke, leukoaraiosis, and dementia? Stroke 34, 806–812. doi: 10.1161/01.STR.0000058480.77236.B3
Wardlaw, J. M., Smith, C., and Dichgans, M. (2019). Small vessel disease: mechanisms and clinical implications. Lancet Neurol. 18, 684–696. doi: 10.1016/S1474-4422(19)30079-1
Wardlaw, J. M., Smith, E. E., Biessels, G. J., Cordonnier, C., Fazekas, F., Frayne, R., et al. (2013). Neuroimaging standards for research into small vessel disease and its contribution to ageing and neurodegeneration. Lancet Neurol. 12, 822–838. doi: 10.1016/S1474-4422(13)70124-8
Wardlaw, J. M., Valdés Hernández, M. C., and Muñoz-Maniega, S. (2015). What are white matter hyperintensities made of? Relevance to vascular cognitive impairment. J. Am. Heart Assoc. 4, 001140. doi: 10.1161/JAHA.114.001140
Wei, H., Dibb, R., Zhou, Y., Sun, Y., Xu, J., Wang, N., et al. (2015). Streaking artifact reduction for quantitative susceptibility mapping of sources with large dynamic range. NMR Biomed. 28, 1294–1303. doi: 10.1002/nbm.3383
Wei, H., Zhang, Y., Gibbs, E., Chen, N. K., Wang, N., and Liu, C. (2017). Joint 2D and 3D phase processing for quantitative susceptibility mapping: application to 2D echo-planar imaging. NMR Biomed. 30. doi: 10.1002/nbm.3501
Wong, S. M., Jansen, J. F. A., Zhang, C. E., Hoff, E. I., Staals, J., van Oostenbrugge, R. J., et al. (2019). Blood-brain barrier impairment and hypoperfusion are linked in cerebral small vessel disease. Neurology 92, e1669–e1677. doi: 10.1212/WNL.0000000000007263
Wu, B., Li, W., Guidon, A., and Liu, C. (2012). Whole brain susceptibility mapping using compressed sensing. Magn. Reson. Med. 67, 137–147. doi: 10.1002/mrm.23000
Wu, X., Ge, X., Du, J., Wang, Y., Sun, Y., Han, X., et al. (2019). Characterizing the penumbras of white matter hyperintensities and their associations with cognitive function in patients with subcortical vascular mild cognitive impairment. Front. Neurol. 10, 348. doi: 10.3389/fneur.2019.00348
Yin, X., Han, Y., Ge, H., Xu, W., Huang, R., Zhang, D., et al. (2013). Inferior frontal white matter asymmetry correlates with executive control of attention. Hum. Brain Mapp. 34, 796–813. doi: 10.1002/hbm.21477
Keywords: small vessel disease, quantitative susceptibility mapping, free-water mapping, white matter lesions, normal-appearing white matter
Citation: Sun Y, Hu Y, Qiu Y, Zhang Y, Jiang C, Lu P, Xu Q, Shi Y, Wei H and Zhou Y (2022) Characterization of white matter over 1–2 years in small vessel disease using MR-based quantitative susceptibility mapping and free-water mapping. Front. Aging Neurosci. 14:998051. doi: 10.3389/fnagi.2022.998051
Received: 19 July 2022; Accepted: 07 September 2022;
Published: 30 September 2022.
Edited by:
Tatjana Rundek, University of Miami, United StatesReviewed by:
Irene Sintini, Mayo Clinic, United StatesCopyright © 2022 Sun, Hu, Qiu, Zhang, Jiang, Lu, Xu, Shi, Wei and Zhou. This is an open-access article distributed under the terms of the Creative Commons Attribution License (CC BY). The use, distribution or reproduction in other forums is permitted, provided the original author(s) and the copyright owner(s) are credited and that the original publication in this journal is cited, in accordance with accepted academic practice. No use, distribution or reproduction is permitted which does not comply with these terms.
*Correspondence: Yan Zhou, Y2xhcmUxNDc1QGhvdG1haWwuY29t; Hongjiang Wei, aG9uZ2ppYW5nLndlaUBzanR1LmVkdS5jbg==
†These authors have contributed equally to this work
Disclaimer: All claims expressed in this article are solely those of the authors and do not necessarily represent those of their affiliated organizations, or those of the publisher, the editors and the reviewers. Any product that may be evaluated in this article or claim that may be made by its manufacturer is not guaranteed or endorsed by the publisher.
Research integrity at Frontiers
Learn more about the work of our research integrity team to safeguard the quality of each article we publish.