 Yongsheng Xie
 Chunyan Gao5†
 Jianjun Wu
94% of researchers rate our articles as excellent or good
Learn more about the work of our research integrity team to safeguard the quality of each article we publish.
Find out more
ORIGINAL RESEARCH article
Front. Aging Neurosci., 05 January 2023
Sec. Neurocognitive Aging and Behavior
Volume 14 - 2022 | https://doi.org/10.3389/fnagi.2022.990913
This article is part of the Research TopicFunctional and Structural Brain Network Construction, Representation and ApplicationView all 47 articles
Background: The levodopa challenge test (LCT) has been routinely used in Parkinson disease (PD) evaluation and predicts the outcome of deep brain stimulation (DBS). Guidelines recommend that patients with an improvement in Unified Parkinson’s Disease Rating Scale (UPDRS)-III score > 33% in the LCT receive DBS treatment. However, LCT results are affected by many factors, and only provide information on the immediate effectiveness of dopamine. The aim of the present study was to investigate the relationship between LCT outcome and brain imaging features of PD patients to determine whether the latter can be used to identify candidates for DBS.
Methods: A total of 38 PD patients were enrolled in the study. Based on improvement in UPDRS-III score in the LCT, patients were divided into low improvement (PD-LCT-L) and high improvement (PD-LCT-H) groups. Each patient’s neural network was reconstructed based on T1-weighted magnetic resonance imaging data using the Jensen–Shannon divergence similarity estimation method. The network was established with the multiple kernel support vector machine technique. We analyzed differences in individual morphologic brain networks and their global and local metrics to determine whether there were differences in the connectomes of PD-LCT-L and PD-LCT-H groups.
Results: The 2 groups were similar in terms of demographic and clinical characteristics. Mean ± SD levodopa responsiveness was 26.52% ± 3.47% in the PD-LCT-L group (N = 13) and 58.66% ± 4.09% in the PD-LCT-H group (N = 25). There were no significant differences between groups in global and local metrics. There were 43 consensus connections that were affected in both groups; in PD-LCT-L patients, most of these connections were decreased whereas those related to the dorsolateral superior frontal gyrus and left cuneus were significantly increased.
Conclusion: Morphologic brain network assessment is a valuable method for predicting levodopa responsiveness in PD patients, which can facilitate the selection of candidates for DBS.
Parkinson disease (PD) is the second most common neurodegenerative motor disorder and affects more than 6 million people worldwide (Feigin et al., 2019). It is characterized by the degeneration of dopaminergic neurons and pathologic formation of Louis corpuscles, leading to motor symptoms such as tremor, muscle stunting, movement retardation, and posture imbalance as well as non-motor manifestations such as sleep, olfactory, cognitive, and mental disorders and autonomic dysfunction (Poewe et al., 2017). According to epidemiologic studies conducted in Europe and the United States, the prevalence rate of PD is 1% in people over the age of 60 years and > 4% in people over the age of 80 years, with the rates expected to rise over the next few decades (Balestrino and Schapira, 2020). The diagnosis of PD is mainly made and the severity determined through clinical examination and follow-up (Tolosa et al., 2021). In China, the treatment approach for PD is long-term, multidisciplinary integrated therapy (Chen S. et al., 2016).
Deep brain stimulation (DBS), especially closed-loop or adaptive DBS, is an essential aspect of PD treatment (Habets et al., 2018). Patients undergo brain imaging including magnetic resonance imaging (MRI) and positron emission tomography–computed tomography (PET-CT) before DBS is performed. The levodopa challenge test (LCT) is also widely recommended before the procedure (Saranza and Lang, 2021). A 30% or 33% improvement in Unified Parkinson’s Disease Rating Scale (UPDRS)-III score in the LCT has been set as a threshold for selecting candidates for DBS (Defer et al., 1999); however, it is unclear how this can predict the effectiveness of the DBS operation. It was reported that patients with a motor symptom improvement rate of <30% in the L-dopa impact test responded well to DBS (Zheng et al., 2021); and at our center, DBS was effective in some patients with <33% improvement in the LCT. As the LCT does not fully reflect brain function, it is important to establish other methods for predicting the response of PD patients to DBS.
Neuroimaging studies have revealed structural and functional alterations in multiple brain networks in PD (Ji et al., 2018). For example, changes in the brain network observed by 18F-fluorodeoxyglucose (FDG)-PET/CT can be used for PD diagnosis and treatment selection for patients (Li et al., 2021a) Voxel-based morphometry (VBM) is a relatively new approach for analyzing MRI data that has objective and quantitative advantages (Lenka et al., 2015). The aim of this study was to determine whether morphologic brain network changes observed by MRI and VBM in patients with PD are associated with LCT results, and can thus be used to identify patients who are likely to respond well to DBS.
A total of 38 patients diagnosed with idiopathic PD according to International Parkinson and Movement Disorder Society diagnostic criteria were retrospectively enrolled in the study. All patients underwent implantation surgery for DBS at Huashan Hospital, Fudan University from January 2020 to December 2021. Patients with a history of head trauma, stroke, intracranial tumor, hydrocephalus, and psychiatric illness were excluded. Medical records were thoroughly reviewed to collect detailed information. Written, informed consent was provided by each patient or their legal guardians. The study was approved by the Institutional Review Board of Huashan Hospital and Medical Ethics Committee of Huashan Hospital, Fudan University, Shanghai, China. The procedures used in this study adhered to the tenets of the Declaration of Helsinki.
The LCT was administered to patients by experienced neurologists at Huashan Hospital. To induce the “off” medication state, dopamine receptor agonists were stopped 72 h before the test, followed by levedopa and other dopaminergic medications 12 h before the test. After the first evaluation of UPDRS-III score as the “off” baseline, 10 mg domperidone was administered orally, followed by a dose of 150% of the standard first morning levodopa equivalent dose 30 min later. UPDRS-III score was assessed every 30 min until 4 h after levodopa intake. The lowest score was recorded as the peak “on” value. Levodopa responsiveness (LR) was calculated as follows: % LR = (“off” UPDRS-III score − peak “on” UPDRS-III score) / “off” UPDRS-III score × 100%. During the test, patients’ heart rate and blood pressure were monitored and any adverse events were recorded.
MRI was performed on an 3 T Ingenia scanner (Koninklijke Philips N.V., Amsterdam, The Netherlands). Structural 3D T1-weighted images were acquired with the following parameters: axial section thickness, 1.0 mm; no gap; repetition time, 6,900 ms; echo time, 2.9 ms; field of view, 240 × 224 mm × 170 mm; matrix size, 240 × 240 × 170; voxel size, 1 × 1 × 1 mm3; and signal-to-noise ratio (SNR), 1.004. Imaging data were preprocessed using the Computational Anatomy Toolbox (CAT12; http://www.neuro.uni-jena.de/cat/) from Statistical Parametric Mapping 12 (SPM12; http://www.fil.ion.ucl.ac.uk/spm/software/spm12/). Gray matter (GM) was segmented with default parameters and spatially normalized to the Montreal Neurological Institute space, followed by nonlinear modulation to compensate for potential bias. After these steps, a GM volume map was obtained for each subject (a voxel size of 1.5 × 1.5 × 1.5 mm). Spatial smoothing (Gaussian kernel with 6-mm full width at half maximum) was further applied to enhance the SNR of the GM volume map of each patient (voxel size of 1.5 × 1.5 × 1.5 mm). The cerebral cortex was divided into 90 regions (45 per cerebellar hemisphere) based on automatic anatomical labeling (AAL) (Tzourio-Mazoyer et al., 2002).
Early-stage PD with cognitive impairment can be predicted based on topologically convergent and divergent GM networks (Suo et al., 2021a). The distribution divergence-based method has been used in morphologic brain network investigations including in PD (Yoo et al., 2017; Fiorenzato et al., 2019; Yang et al., 2021). Specifically, Kullback–Leibler (KL) divergence (Suo et al., 2021b) was applied to construct the network according to the following formula:
where P and Q represent probability density functions (PDFs) of voxel intensities from a pair of regions of interest (ROIs). We applied the JSSE to construct individual mathematical relationships for any 2 ROIs to achieve a more accurate and symmetric estimate of morphologic brain connectivity. Based on the ROI parcellation from the AAL atlas, a 90 × 90 region correlation matrix was generated for each patient and the intensity of the ROI was extracted to estimate the corresponding PDF. Morphologic connections were derived as the JS divergence (relative entropy) using the following equation:
where are the KL divergence. The JS divergence was used as a measure of morphologic connectivity to generate the adjacency matrix.
Global and local graph metrics of the morphologic brain network were determined by graph theoretical network analysis (Bullmore and Sporns, 2009) to evaluate individual connectivity patterns. Global graph metrics included clustering coefficient (Cp), small world (σ), global efficiency (Eglobal), local efficiency (Elocal), characteristic path length (Lp), normalized clustering coefficient (γ), normalized characteristic path length (λ), and modularity score (Termenon et al., 2016) and also assortativity, and nodal graph metrics included degree centrality (DC), nodal efficiency (Ne), betweenness centrality (BC), shortest path length, and nodal clustering coefficient (Xu et al., 2020).In this study, synchronization had been adopt. Before calculating the sum of the corresponding node attribute values under the sparse threshold, we compared the network size of different sparse thresholds (0.02–0.5 in steps of 0.01). We then applied the sum of the values of each node as an attribute to train the classifier so that only one value corresponded to a graphical measure.
In order to more accurately predict levodopa responsiveness, connection weight, global metrics, and nodal metrics were combined with the multikernel support vector machine (MK-SVM) technique (Xu et al., 2021). In a case with n training samples with connection values and graph metrics,, , and represented the connection weight, global metrics, and nodal metrics, respectively, of the ith sample. With as the corresponding label, the following problem was solved:
where represents the transform from the original space in mth data to the Represent Hilbert Kernel Space (RHKS), is the hyperplane in RHKS, and is the corresponding combined weight of the mth attribute. The dual form of MK-SVM is represented as follows:
where is the kernel matrix of the mth data. After training the model, we tested the new sample: x. The kernel between the new test sample and ith training sample in the mth modality was defined as .
The predictive level based on MK-SVM was formulated using the following equation.
To evaluate the gain in predictive performance of the combined information (ie, connection and global and nodal graph metrics in addition to LCT results), we employed the most commonly used and simplest linear kernel according to the following equation.
To determine whether there were differences between the 2 groups, the strictest nested leave-one-out cross-validation (CV) (Li et al., 2017) was used in the construction of connections by combining the information from connection weights and global and nodal graph metrics.
All data processing and classification procedures used in the study are shown in Figure 1.
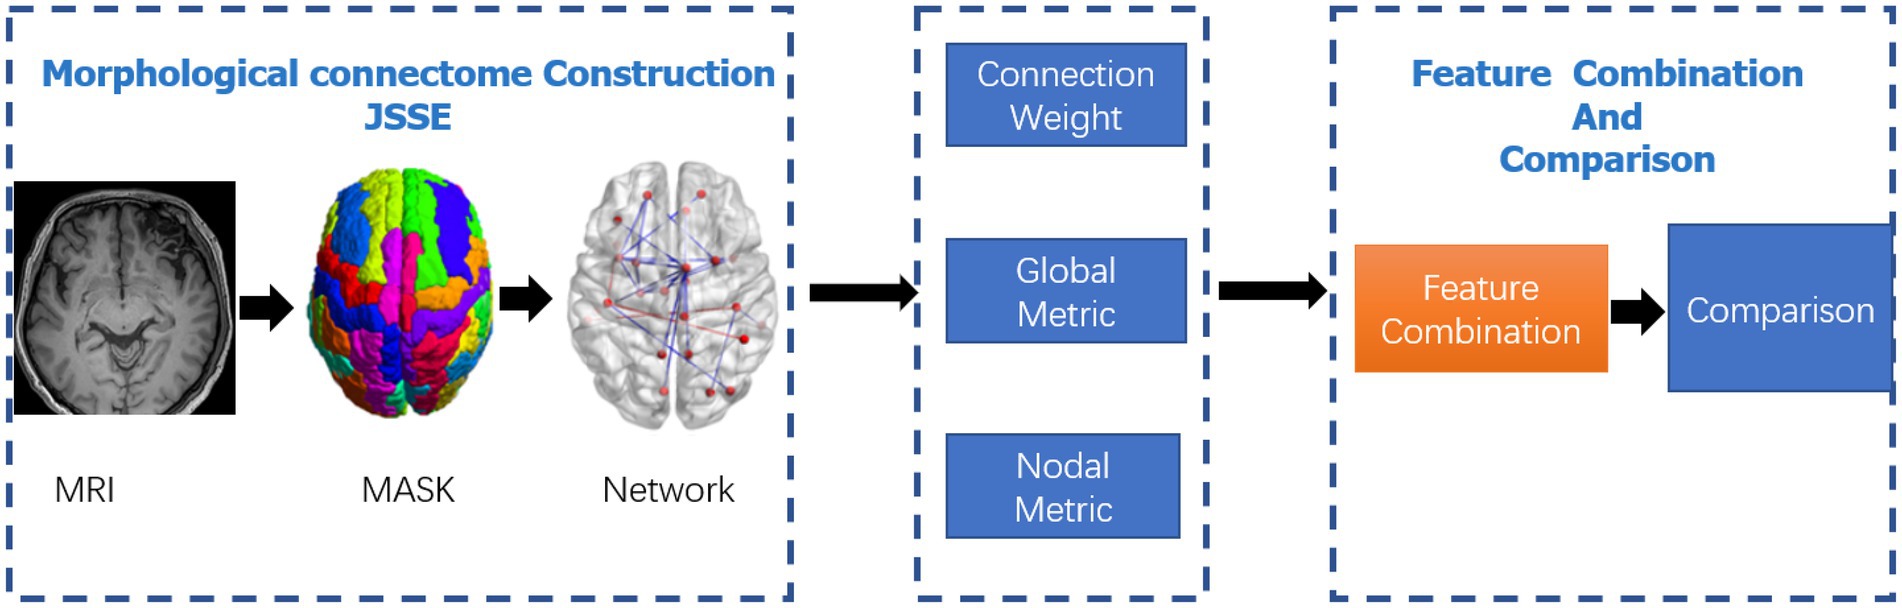
Figure 1. Data-processing and classification procedures adopted in the study. The JSSE was chosen to construct the morphological network. Then, the nodal and global graph metrics were computed. In the end,the MK-SVM was adopted to combine these information for comparison.
The demographic and clinical characteristics of the study population are shown in Table 1. Age, education, and sex distribution were similar between the 2 groups. According to the results of the LCT, patients were divided into PD-LCT-L (UPDRS-III score improvement rate ≤ 33%) and PD-LCT-H (UPDRS-III score improvement rate > 33%).
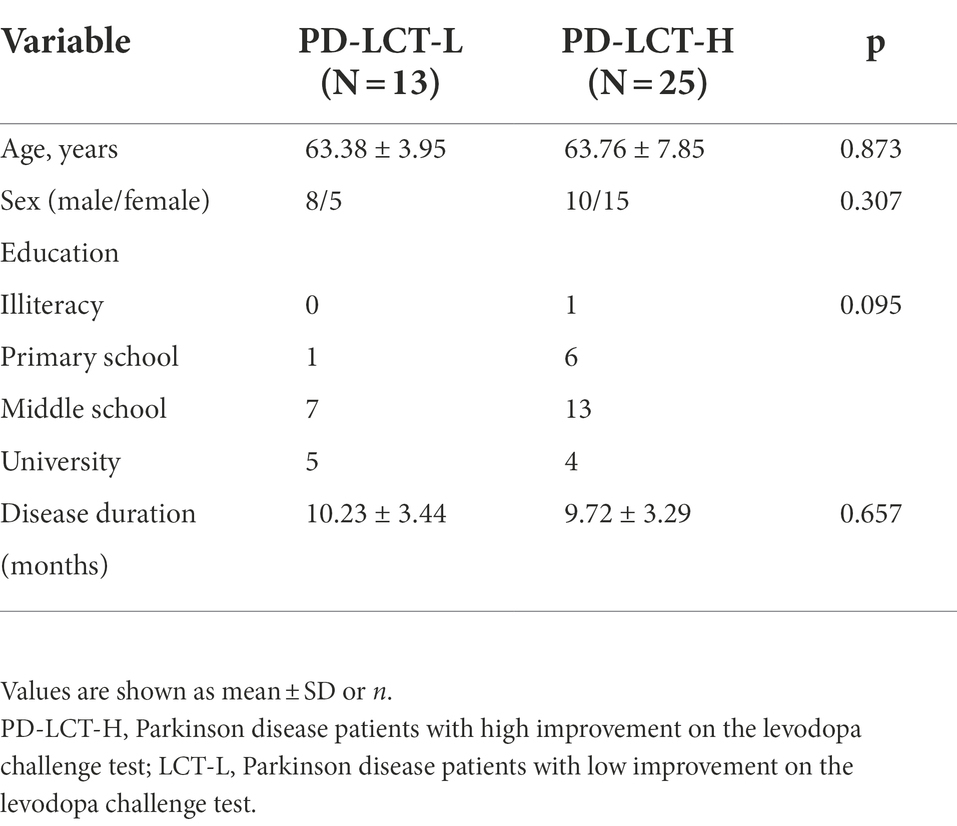
Table 1. Demographic and clinical characteristics of the study population.
The global graph metrics of the PD-LCT-L and PD-LCT-H groups are shown in Table 2. Compared with the PD-LCT-H group, hierarchy (Hr) was increased whereas assortativity, Cp, Eglobal, Elocal, Lp, modularity score, synchronization, and were decreased in the PD-LCT-L group. However, the differences were not statistically significant ().
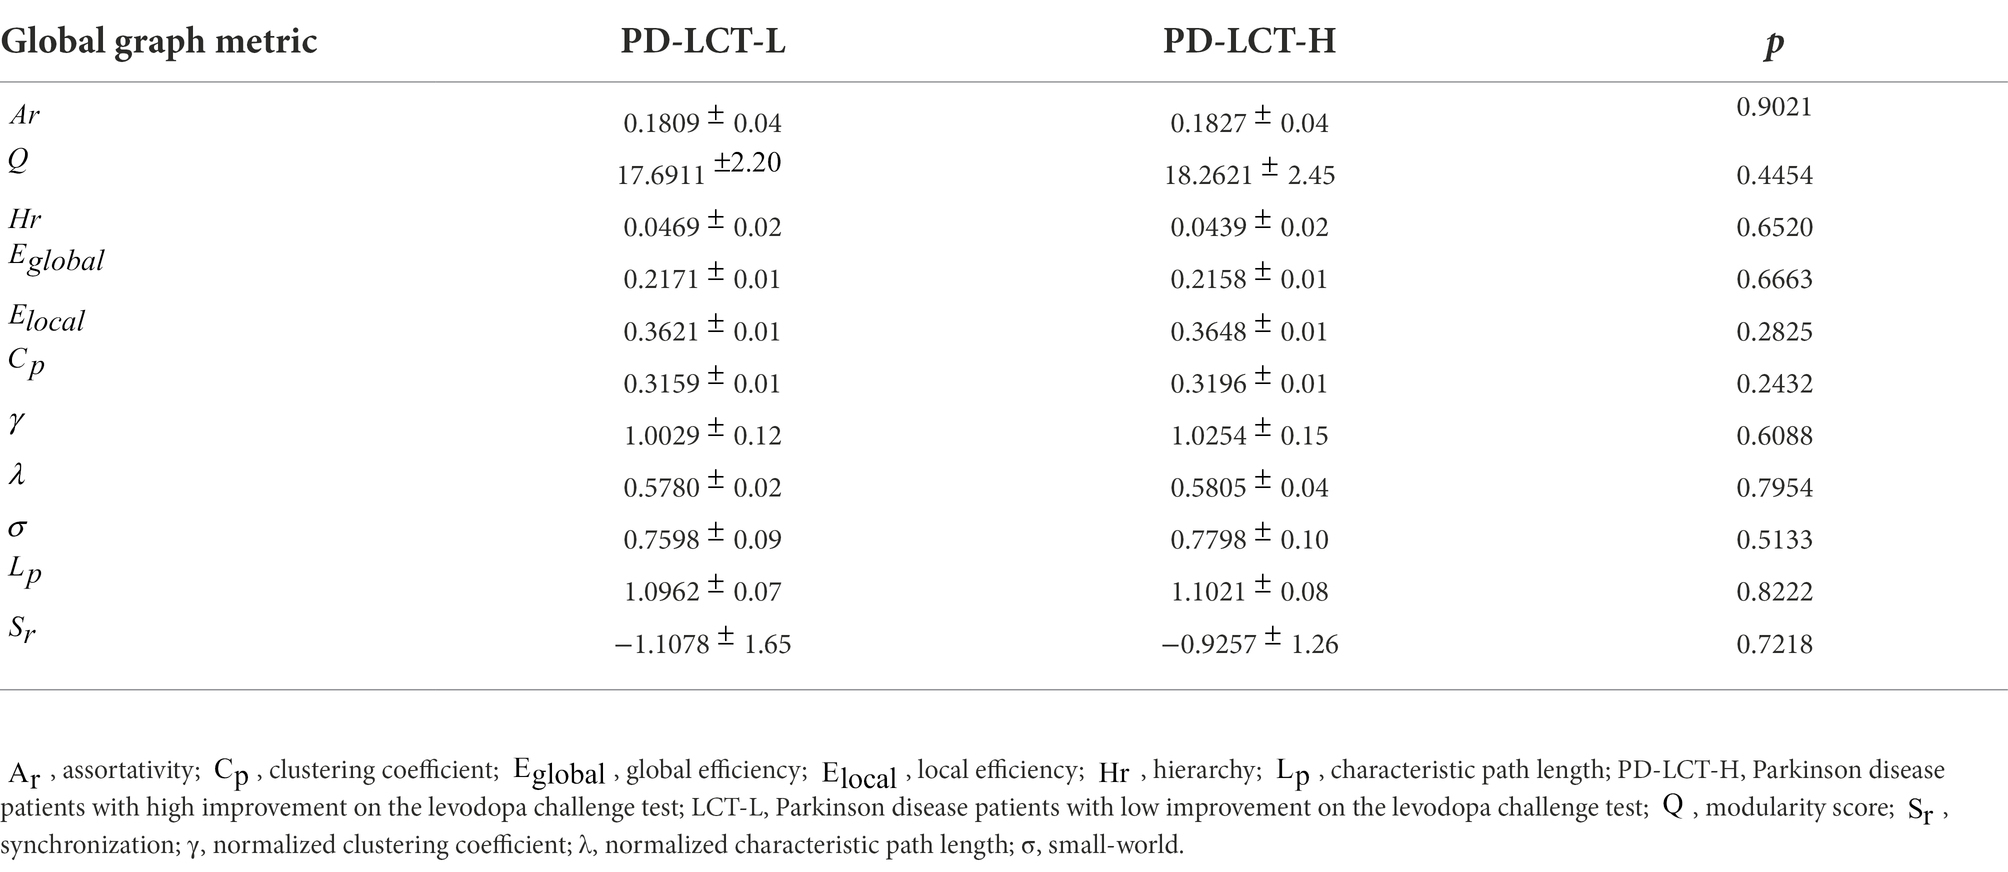
Table 2. Global and local graph metrics of the brain connectome.
As mentioned above, we selected consensus connections with in each inner CV loop. As the selected connections in each loop could differ, we recorded all selected features during the entire training process—i.e., consensus connections. Specifically, we selected significant consensus connections with in each loop for a total of 43 (Table 3). Most of these were decreased in PD-LCT-L patients, except for those in the frontal and temporal lobe regions, which were increased. Significant consensus connections in the thalamus and putamen differed significantly between the 2 groups.
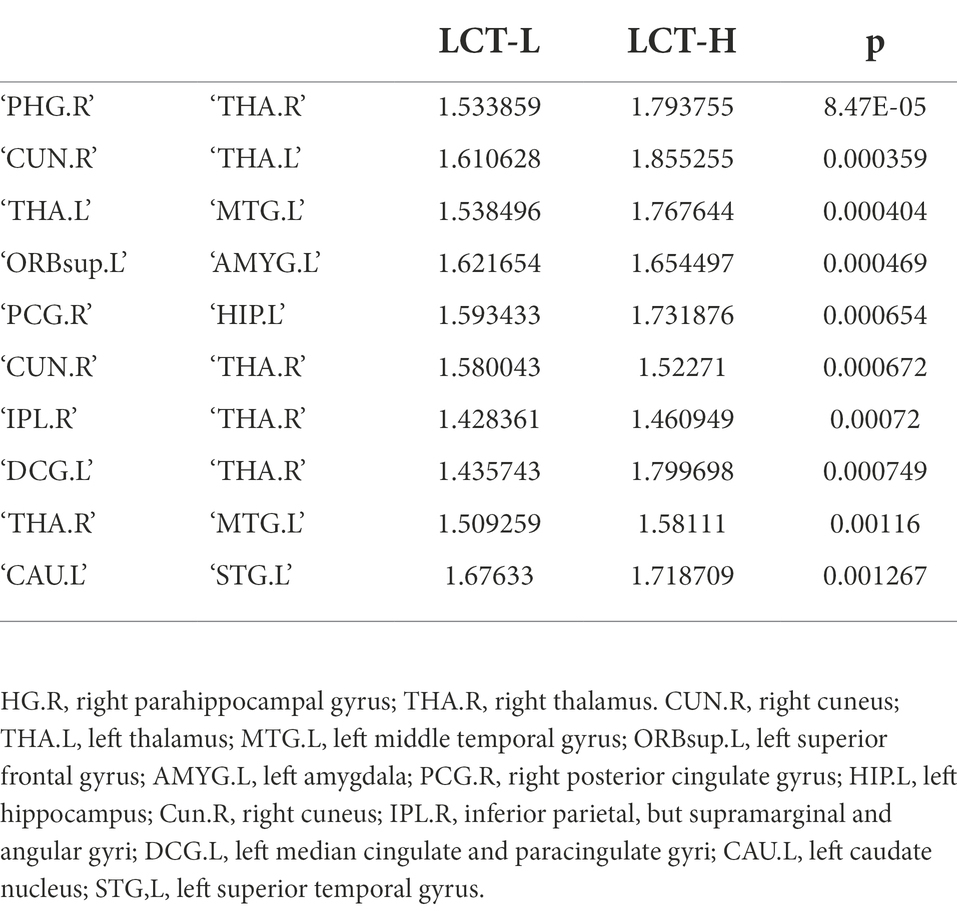
Table 3. Consensus connections.
We visualized the mean degree of each node in the PD-LCT-L and PD-LCT-H groups to compare the degree distribution of the estimated brain connectomes. Specifically, there were 6 significant nodes with the average degree in the PD-LCT-L and PD-LCT-H groups (Table 4). Nodes with a standard deviation degree higher than the mean of the degree of all nodes were identified as degree hub nodes. A comparison of hub nodes between 2 groups in the same modal network revealed that most overlapped. There were also several hub nodes that corresponded to specific groups.
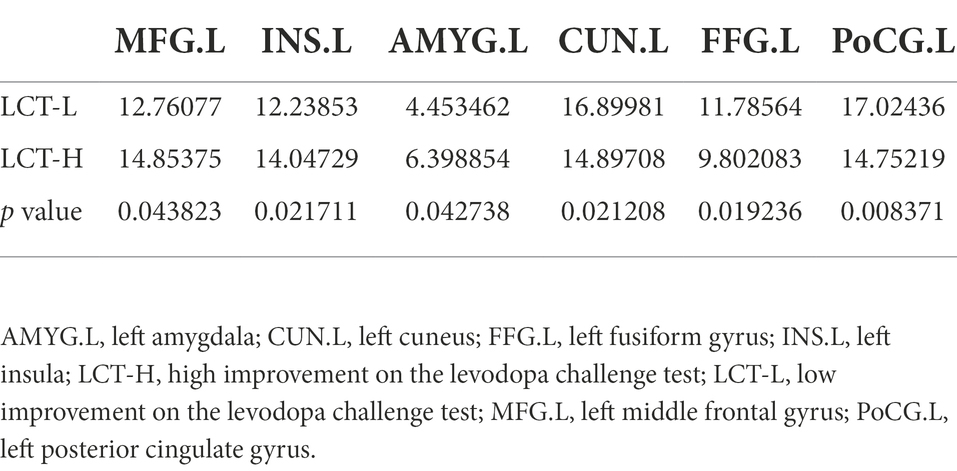
Table 4. Six significant nodes with average degree.
To investigate the BC of the estimated morphologic brain connectome, 5 significant nodes with average betweenness in the PD-LCT-L and PD-LCT-H groups were examined (Table 5). The betweenness of left anterior cingulate cortex, left amygdala, left temporal pole of the superior temporal gyrus, and right parahippocampal gyrus tended to decrease in the PD-LCT-L group compared with the PD-LCT-H group, whereas that of the left precuneus tended to increase.
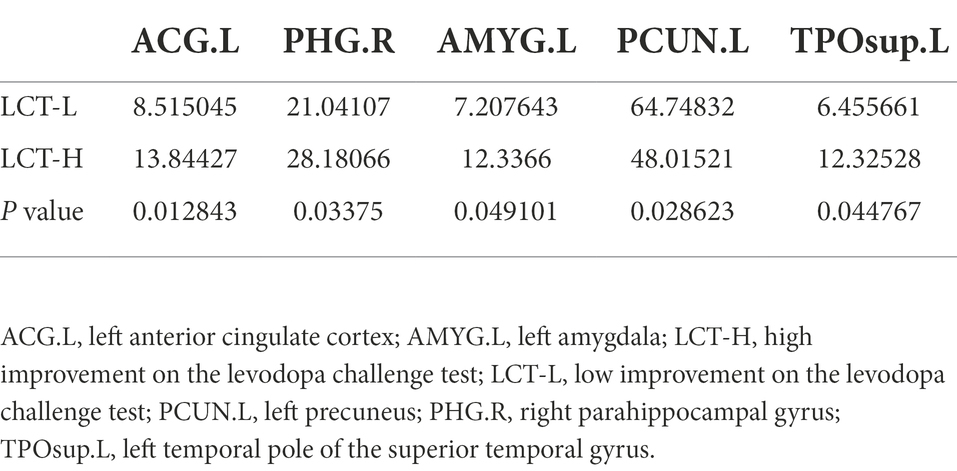
Table 5. Betweenness centrality.
The Ne values of 4 significant nodes in the PD-LCT-L and PD-LCT-H groups are listed in Table 6. The Ne of the left middle frontal gyrus, left insula, and right thalamus showed a decreasing tendency in the PD-LCT-L group, whereas the Ne of the left precuneus showed the opposite trend. Meanwhile, NLe of the right pallidum and left thalamus tended to decrease whereas both Ne and NLe of the left fusiform gyrus increased in the PD-LCT-L group compared with the PD-LCT-R group.
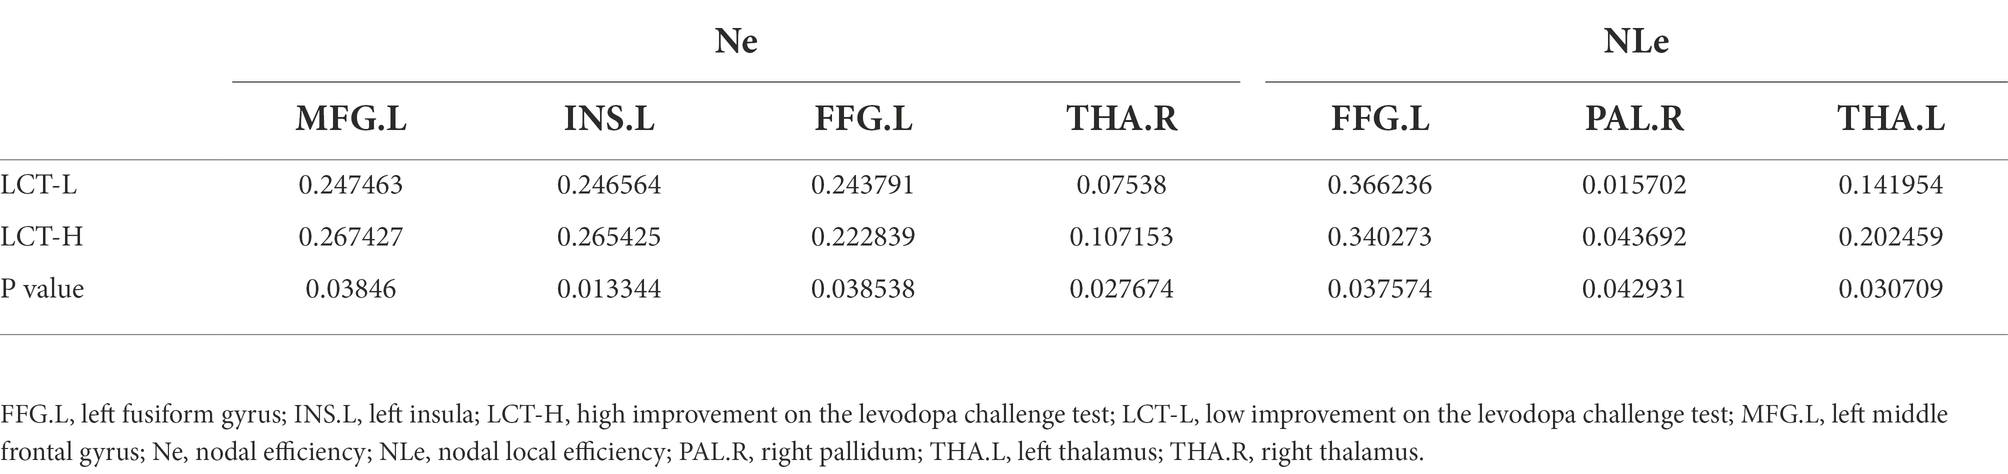
Table 6. Nodal efficiency and nodal local efficiency.
We evaluated the classification performance of the combined information and proposed JSSE method based on accuracy, sensitivity, and specificity, which were calculated with the following equations:
where is true positive (ie, number of positive subjects correctly classified in the identification task); FP is false positive (number of negative subjects that were incorrectly classified in the identification task); and TN and FN are the number of true negative and false negative subjects, respectively (see Table 7).
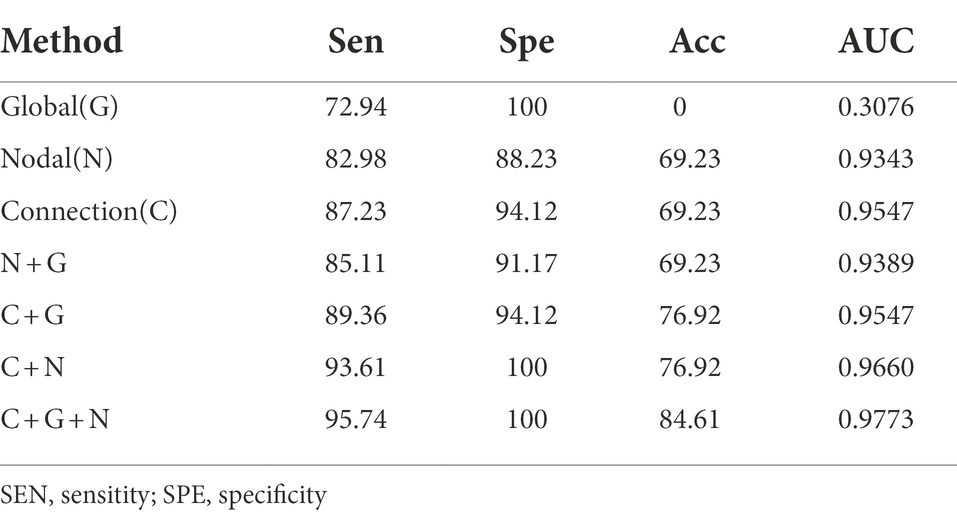
Table 7. Classification performance corresponding to different methods.
To validate the combined information results, we also determined the single-kernel SVM classification based on connection and global and nodal metrics. The receiver operating characteristic curve showed that the performance of the combined information results were superior to that of the global metric (Figure 2). However, the combination of connection, global metrics, and nodal metrics did not outperform the results obtained using all 4 measurements (ie, including the LCT results).
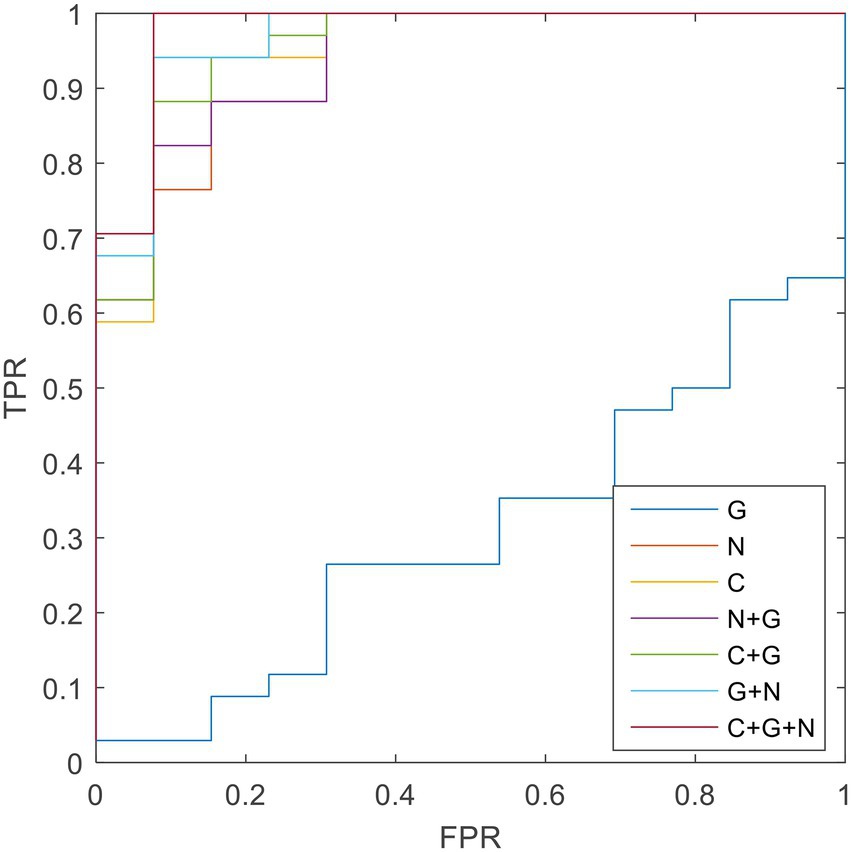
Figure 2. The ROC results of different methods.
The diagnosis of PD is mainly symptom-based. The heterogeneity of clinical presentation and disease course in PD reflects a complex pathogenesis and can determine the most effective treatment. Stratifying PD patients can facilitate the selection of individually tailored treatment strategies. This study investigated whether morphologic brain networks identified by MRI and analyzed by JSSE can predict the response to DBS in PD patients stratified according to improvement rates in the LCT. The results showed that while there were no significant differences in global graph metrics, the 2 groups differed with respect to DC, BC, Ne, NLe, NCp, and NLp. Thus, combining morphologic brain network characteristics and LCT results can provide detailed information regarding disease state in individual PD patients. Moreover, JSSE applied to T1-weighted MRI data can reveal inter-individual differences in brain connectivity that can inform treatment selection for patients with PD.
LCT is a valuable tool for identifying the optimal treatment for PD and is required prior to DBS. However, the test has certain limitations. First, there is no absolute standard for the results. An LR of 30% was proposed based on a placebo effect observed in one-third of patients, but a value of 33% was set in the Core Assessment Program for Intracerebral Transplantations and Core Assessment Program for Surgical Interventional Therapies in Parkinson’s Disease preoperative protocols (Defer et al., 1999); the latter value had moderately high sensitivity and a specificity of 70% for chronic levodopa, with a positive predictive value of 92.3% and negative predictive value of 32.1% (Schade et al., 2017). Second, LCT results can set certain expectations for operators, follow-up regulators, and patients (Lang and Widner, 2002). However, LCT results may be biased by the patient’s long-term oral drug use as well as psychological and other factors (Anderson and Nutt, 2011). Third, higher-than-usual doses of drug can cause gastrointestinal symptoms, but abrupt discontinuation of dopaminergic drugs can lead to neuroleptic malignant syndrome-like events in PD patients (Ikebe et al., 2003). Other factors such as oral drug dose and test time can also affect the results. For these reasons, most neurosurgeons base their assessment of the patient’s condition and the choice of treatment strategy on other modalities in addition to the LCT (Schade et al., 2017). In this study, the LCT was typically administered early in the morning when the patient was in a fasting state, and a dose of 150% of the standard morning levodopa dose was used. Improvement in motor scores compared with the “off” state was evaluated every 30 min for 4 h. Several patients complained of gastrointestinal symptoms and dizziness.
High-resolution (3.0 T or 7.0 T) MRI can provide information on pathologic changes in the brain of PD patients (Sclocco et al., 2018). Previous brain network-related studies in PD patients have mainly focused on diagnosis; analyzing the relationship between GM network topology and the GM network determined from imaging data and disease severity can provide greater resolution for early diagnosis (Suo et al., 2021b). PD patients have higher Eglobal and Elocal than normal subjects, which are unrelated to their clinical features (Zhang et al., 2015). In studies investigating PD-associated patterns in metabolic brain networks, relatively overactive areas were considered as the source of PD brain network dysfunction (Lin et al., 2008). Some studies on the efficacy of DBS surgery found that structural and functional connectivities were independent predictors of clinical improvement (Horn et al., 2017). However, there have been no studies on the correlation between dopamine impact tests and brain networks. Our results confirm that the morphologic brain network of PD patients with different LCT test results have certain differences that warrant closer examination in future studies.
All patients enrolled in our study were diagnosed with PD by at least 1 neurologist and 1 neurosurgeon. T1-weighted MRI data were acquired before subthalamic nucleus DBS surgery. The graph theory was applied to examine individual morphologic brain networks. Both groups of patients exhibited small-world properties for global and local graph metrics of the brain connectome, and the groups did not differ in terms of nodes and global graph metrics, consistent with previous research (Jia et al., 2015). This suggests that information transmission efficiency in the whole brain was reduced in the early stage of PD disease and remained relatively stable with disease progression. We also found that the connectivity of many brain areas was weaker in the PD-LCT-L group than in the PD-LCT-H group, especially in the temporal lobe, limbic system, and thalamus, reflecting damage to these areas associated with low improvement in the LCT. Connection between the thalamus and cuneus were also altered in the PD-LCT-L group, which has been reported in patients suffering from both PD and cognitive impairment (Li et al., 2020). A correlation has been observed between atrophy of thalamic neurons, reduced thalamic volume, and cognitive function (Chen F. X. et al., 2016). As a key hub of the default mode network, the precuneus is involved in many advanced cognitive functions; impaired connections in the precuneus reflected a decline in the cognitive level of patients in the PD-LCT-L group. Among indicators of complex network operation, the cluster coefficient measures the degree of collectivization of the network, node degree describes centrality in the network, and Eglobal and Elocal represent the network’s global and local transmission capacities, respectively (He and Evans, 2010).
Compared with the PD-LCT-H group, the PD-LCT-L group showed increased connectivity in a few areas of the frontal and temporal lobes, and the cluster coefficients of the dorsolateral superior frontal gyrus and DC, Ne, and NLe of the left fusiform gyrus were increased; moreover, the DC of the left cuneus and left postcentral gyrus and BC of the precuneus were also increased. These brain regions are all related to cognition and movement.From the Figure 3, we observed that the brain areas with increased connectivity in the PD-LCT-L group tended to be on the left side rather than on the right, and the left fusiform gyrus connectome showed a compensatory increase in connectivity. In terms of consensus connections, the right parahippocampal gyrus–right thalamus network was the most prominent. As the main cortical input to the hippocampus, this pathway plays an important role in cognition and emotion, which explains the anxiety and depression observed in patients with poor drug control (Zhang et al., 2019). Another important pathway for consensus connections identified in our study was the orbitofrontal cortex–amygdala and Heschl’s gyrus. The orbitofrontal cortex is essential for processing visual, spatial, and emotional information (Rolls, 2019). We found that this brain area was closely linked to the parietal occipital lobe and was also a central node in the morphologic brain network. Heschl’s gyrus is located in the primary auditory cortex, occupying Brodmann areas 41 and 42; it is the first cortical structure to process incoming auditory information (Abdul-Kareem and Sluming, 2008). We observed significant differences in mood, anxiety, and depression between PD-LCT-L and PD-LCT-H patients; the connection networks related to motor disorders validated in our study may provide insight into the pathophysiology of certain emotional disorders and their relationship to clinical symptoms in PD. We also found that the connection between the thalamus and putamen differed between the 2 groups, with fewer connections in the PD-LCT-L group; this was previously shown to be related to the degree of cognitive dysfunction and tremor severity in some patients with PD (Halliday, 2009; Li et al., 2021b, 2022). Taken together, these findings provide an anatomic basis for evaluating the clinical symptoms of PD as well as potential imaging biomarkers for diagnosis.
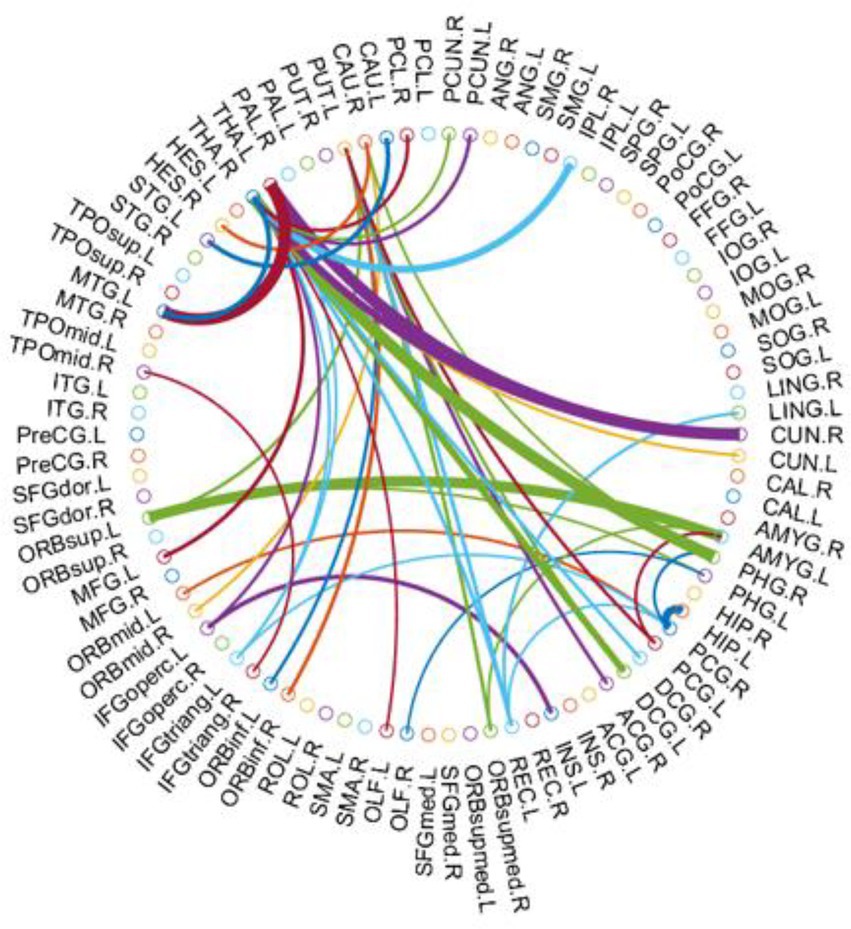
Figure 3. The most consensus connections mapped on the International Consortium for Brain Mapping (ICBM) 152 template using the BrainNet Viewer software package http://nitrc.org/projects/bnv/ and circularGraph, shared by Paul Kassebaumb http://www.mathworks.com/matlabcentral/fileexchange/48576-circulargraph. The connectivity matrices of the fully connected network of PD-LCT -L compared to PD-LCT-H are shown. The 43 most significant connections were retained.
There were several limitation to this study.We havenot adopt multiple comparison correction analysis, such as Bonferroni correction, false discovery rate correction, and we will promote in the future work. Additionally, the data were analyzed retrospectively and could not be stratified according to different PD clinical symptoms. A control cohort would be explored in future investigations.
The results of this study show that JSSE based on MRI data can be used in conjunction with LCT results to identify candidates for DBS among patients with PD. Our findings also provide new insight into abnormalities in the morphologic brain network in PD that can inform individualized treatment decisions.
The original contributions presented in the study are included in the article/supplementary material, further inquiries can be directed to the corresponding authors.
The studies involving human participants were reviewed and approved by the Institutional Review Board of Huashan Hospital. The patients/participants provided their written informed consent to participate in this study.
Written informed consent was obtained from the individual(s) for the publication of any potentially identifiable images or data included in this article.
All authors contributed to study conception and design. YX, CG, and BW were performed the material preparation and data collection and analysis and drafted the manuscript. JW and LL commented on previous versions of the manuscript. All authors read and approved the final manuscript.
This study was sponsored by the Shanghai Municipal Science and Technology Major Project (no. 2018ZDZX01); National Natural Science Foundation of China (no. 82001202 to BW); and Shanghai Municipal Commission of Health and Family Planning Science and Research Subjects (no. 202140464).
The authors thank the staff at the Department of Neurosurgery, Huashan Hospital, Shanghai Medical College, Fudan University, Shanghai, for their advice during this study; and ITK-SNAP (www.itksnap.org) for making the software analysis tools freely available.
The authors declare that the research was conducted in the absence of any commercial or financial relationships that could be construed as a potential conflict of interest.
All claims expressed in this article are solely those of the authors and do not necessarily represent those of their affiliated organizations, or those of the publisher, the editors and the reviewers. Any product that may be evaluated in this article, or claim that may be made by its manufacturer, is not guaranteed or endorsed by the publisher.
AAL, automated anatomical labeling; BC, betweenness centrality; Cp, clustering coefficient; DBS, deep brain stimulation; DC, degree centrality; Eglobal, global efficiency; Elocal, local efficiency; FN, false negative; FP, false positive; JSSE, Jensen–Shannon divergence similarity estimation; KL, Kullback–Leibler; LCT, levodopa challenge test; Lp, characteristic path length; MK-SVM, multiple kernel support vector machine; MRI, magnetic resonance imaging; PD, Parkinson disease; PDF, probability density function; PET, positron emission tomography; RHKS, reproducing Hilbert kernel space; ROI, region of interest; TN, true negative; TP, true positive; UPDRS, United Parkinson’s Disease Rating Scale; γ, normalized clustering coefficient; λ, normalized characteristic path length; σ, small-world.
Abdul-Kareem, I. A., and Sluming, V. (2008). Heschl gyrus and its included primary auditory cortex: structural MRI studies in healthy and diseased subjects. J. Magn. Reson. Imaging 28, 287–299. doi: 10.1002/jmri.21445
Anderson, E., and Nutt, J. (2011). The long-duration response to levodopa: phenomenology, potential mechanisms and clinical implications. Parkinsonism Relat. Disord. 17, 587–592. doi: 10.1016/j.parkreldis.2011.03.014
Balestrino, R., and Schapira, A. H. V. (2020). Parkinson disease. Eur. J. Neurol. 27, 27–42. doi: 10.1111/ene.14108
Bullmore, E., and Sporns, O. (2009). Complex brain networks: graph theoretical analysis of structural and functional systems. Nat. Rev. Neurosci. 10, 186–198. doi: 10.1038/nrn2575
Chen, S., Chan, P., Sun, S., Chen, H., Zhang, B., Le, W., et al. (2016). The recommendations of Chinese Parkinson's disease and movement disorder society consensus on therapeutic management of Parkinson's disease. Transl Neurodegener 5:12. doi: 10.1186/s40035-016-0059-z
Chen, F. X., Kang, D. Z., Chen, F. Y., Liu, Y., Wu, G., Li, X., et al. (2016). Gray matter atrophy associated with mild cognitive impairment in Parkinson's disease. Neurosci. Lett. 617, 160–165. doi: 10.1016/j.neulet.2015.12.055
Defer, G. L., Widner, H., Marié, R. M., Rémy, P., and Levivier, M. (1999). Core assessment program for surgical interventional therapies in Parkinson's disease (CAPSIT-PD). Mov. Disord. 14, 572–584. doi: 10.1002/1531-8257(199907)14:4<572::AID-MDS1005>3.0.CO;2-C
Feigin, V. L., Nichols, E., Alam, T., Bannick, M. S., Beghi, E., Blake, N., et al. (2019). Global, regional, and national burden of neurological disorders, 1990–2016: a systematic analysis for the global burden of disease study 2016. The Lancet Neurology 18, 459–480. doi: 10.1016/S1474-4422(18)30499-X
Fiorenzato, E., Strafella, A. P., Kim, J., Schifano, R., Weis, L., Antonini, A., et al. (2019). Dynamic functional connectivity changes associated with dementia in Parkinson's disease. Brain 142, 2860–2872. doi: 10.1093/brain/awz192
Habets, J. G. V., Heijmans, M., Kuijf, M. L., Janssen, M. L. F., Temel, Y., and Kubben, P. L. (2018). An update on adaptive deep brain stimulation in Parkinson's disease. Mov. Disord. 33, 1834–1843. doi: 10.1002/mds.115
Halliday, G. M. (2009). Thalamic changes in Parkinson’s disease. Parkinsonism and Related Disorders 15, S152–S155. doi: 10.1016/S1353-8020(09)70804-1
He, Y., and Evans, A. (2010). Graph theoretical modeling of brain connectivity. Curr. Opin. Neurol. 23, 341–350. doi: 10.1097/WCO.0b013e32833aa567
Horn, A., Reich, M., Vorwerk, J., Li, N., Wenzel, G., Fang, Q., et al. (2017). Connectivity predicts deep brain stimulation outcome in Parkinson disease. Ann. Neurol. 82, 67–78. doi: 10.1002/ana.24974
Ikebe, S.-I., Harada, T., Hashimoto, T., Kanazawa, I., Kuno, S., Mizuno, Y., et al. (2003). Prevention and treatment of malignant syndrome in Parkinson's disease: a consensus statement of the malignant syndrome research group. Parkinsonism Relat. Disord. 9, 47–49. doi: 10.1016/S1353-8020(02)00123-2
Ji, G. J., Hu, P., Liu, T. T., Li, Y., Chen, X., Zhu, C., et al. (2018). Functional connectivity of the Corticobasal ganglia-Thalamocortical network in Parkinson disease: A systematic review and meta-analysis with cross-validation. Radiology 287, 973–982. doi: 10.1148/radiol.2018172183
Jia, X., Liang, P., Li, Y., Shi, L., Wang, D., and Li, K. (2015). Longitudinal study of gray matter changes in Parkinson disease. AJNR Am. J. Neuroradiol. 36, 2219–2226. doi: 10.3174/ajnr.A4447
Lang, A. E., and Widner, H. (2002). Deep brain stimulation for Parkinson's disease: patient selection and evaluation. Mov. Disord. 17, S94–S101. doi: 10.1002/mds.10149
Lenka, A., Jhunjhunwala, K. R., Saini, J., and Pal, P. K. (2015). Structural and functional neuroimaging in patients with Parkinson's disease and visual hallucinations: A critical review. Parkinsonism Relat. Disord. 21, 683–691. doi: 10.1016/j.parkreldis.2015.04.005
Li, W. K., Chen, Y. C., Xu, X. W., Wang, X., and Gao, X. (2022). Human-guided functional connectivity network estimation for chronic tinnitus identification: a modularity view. IEEE J. Biomed. Health Inform., 26, 4849–4858. doi: 10.1109/JBHI.2022.3190277
Li, M. G., He, J. F., Liu, X. Y., Wang, Z. F., Lou, X., and Ma, L. (2020). Structural and functional thalamic changes in Parkinson's disease with mild cognitive impairment. J. Magn. Reson. Imaging 52, 1207–1215. doi: 10.1002/jmri.27195
Li, W., Tang, Y., Wang, Z., Hu, S., and Gao, X. (2021a). The reconfiguration pattern of individual brain metabolic connectome for Parkinson's disease identification. arxiv. doi: 10.48550/arXiv.2105.02811
Li, W., Wang, Z., Zhang, L., Qiao, L., and Shen, D. (2017). Remodeling pearson’s correlation for functional brain network estimation and autism spectrum disorder identification. Front. Neuroinform. 11:55. doi: 10.3389/fninf.2017.00055
Li, W., Xu, X., Wang, Z., Peng, L., Wang, P., and Gao, X. (2021b). Multiple connection pattern combination from single-mode data for mild cognitive impairment identification. Front. Cell Dev. Biol. 9:782727. doi: 10.3389/fcell.2021.782727
Lin, T. P., Carbon, M., Tang, C., Mogilner, A. Y., Sterio, D., Beric, A., et al. (2008). Metabolic correlates of subthalamic nucleus activity in Parkinson's disease. Brain 131, 1373–1380. doi: 10.1093/brain/awn031
Poewe, W., Seppi, K., Tanner, C. M., Halliday, G. M., Brundin, P., Volkmann, J., et al. (2017). Parkinson disease. Nat. Rev. Dis. Primers 3:17013. doi: 10.1038/nrdp.2017.13
Rolls, E. T. (2019). The orbitofrontal cortex and emotion in health and disease, including depression. Neuropsychologia 128, 14–43. doi: 10.1016/j.neuropsychologia.2017.09.021
Saranza, G., and Lang, A. E. (2021). Levodopa challenge test: indications, protocol, and guide. J. Neurol. 268, 3135–3143. doi: 10.1007/s00415-020-09810-7
Schade, S., Sixel-Doring, F., Ebentheuer, J., Schulz, X., Trenkwalder, C., and Mollenhauer, B. (2017). Acute levodopa challenge test in patients with de novo Parkinson's disease: data from the DeNoPa cohort. Mov. Disord. Clin. Pract. 4, 755–762. doi: 10.1002/mdc3.12511
Sclocco, R., Beissner, F., Bianciardi, M., Polimeni, J. R., and Napadow, V. (2018). Challenges and opportunities for brainstem neuroimaging with ultrahigh field MRI. NeuroImage 168, 412–426. doi: 10.1016/j.neuroimage.2017.02.052
Suo, X., Lei, D., Li, N., Li, W., Kemp, G. J., Sweeney, J. A., et al. (2021b). Disrupted morphological grey matter networks in early-stage Parkinson's disease. Brain Struct. Funct. 226, 1389–1403. doi: 10.1007/s00429-020-02200-9
Suo, X., Lei, D., Li, N., Li, J., Peng, J., Li, W., et al. (2021a). Topologically convergent and divergent morphological gray matter networks in early-stage Parkinson's disease with and without mild cognitive impairment. Hum. Brain Mapp. 42, 5101–5112. doi: 10.1002/hbm.25606
Termenon, M., Jaillard, A., Delon-Martin, C., and Achard, S. (2016). Reliability of graph analysis of resting state fMRI using test-retest dataset from the human connectome project. NeuroImage 142, 172–187. doi: 10.1016/j.neuroimage.2016.05.062
Tolosa, E., Garrido, A., Scholz, S. W., and Poewe, W. (2021). Challenges in the diagnosis of Parkinson's disease. The Lancet Neurology 20, 385–397. doi: 10.1016/S1474-4422(21)00030-2
Tzourio-Mazoyer, N., Landeau, B., Papathanassiou, D., Crivello, F., Etard, O., et al. (2002). Automated anatomical labeling of activations in SPM using a macroscopic anatomical Parcellation of the MNI MRI single-subject brain. NeuroImage 15, 273–289. doi: 10.1006/nimg.2001.0978
Xu, X., Li, W., Mei, J., Tao, M., Wang, X., Zhao, Q., et al. (2020). Feature selection and combination of information in the functional brain connectome for discrimination of mild cognitive impairment and analyses of altered brain patterns. Front. Aging Neurosci. 12:28. doi: 10.3389/fnagi.2020.00028
Xu, X., Wang, T., Li, W., Li, H., Xu, B., Zhang, M., et al. (2021). Morphological, structural, and functional networks highlight the role of the cortical-subcortical circuit in individuals with subjective cognitive decline. Front. Aging Neurosci. 13:688113. doi: 10.3389/fnagi.2021.688113
Yang, Q., Nanivadekar, S., Taylor, P. A., Dou, Z., Lungu, C. I., and Horovitz, S. G. (2021). Executive function network's white matter alterations relate to Parkinson's disease motor phenotype. Neurosci. Lett. 741:135486. doi: 10.1016/j.neulet.2020.135486
Yoo, K., Lee, P., Chung, M. K., Sohn, W. S., Chung, S. J., Na, D. L., et al. (2017). Degree-based statistic and center persistency for brain connectivity analysis. Hum. Brain Mapp. 38, 165–181. doi: 10.1002/hbm.23352
Zhang, H., Qiu, Y., Luo, Y., Xu, P., Li, Z., Zhu, W., et al. (2019). The relationship of anxious and depressive symptoms in Parkinson's disease with voxel-based neuroanatomical and functional connectivity measures. J. Affect. Disord. 245, 580–588. doi: 10.1016/j.jad.2018.10.364
Zhang, D., Wang, J., Liu, X., Chen, J., and Liu, B. (2015). Aberrant brain network efficiency in Parkinson's disease patients with tremor: A multi-modality study. Front. Aging Neurosci. 7:169. doi: 10.3389/fnagi.2015.00169
Keywords: Parkinson disease, deep brain stimulation, Levodopa challenge test, morphologic brain network, connectome
Citation: Xie Y, Gao C, Wu B, Peng L, Wu J and Lang L (2023) Morphologic brain network predicts levodopa responsiveness in Parkinson disease. Front. Aging Neurosci. 14:990913. doi: 10.3389/fnagi.2022.990913
Edited by:
Zhengxia Wang, Hainan University, ChinaReviewed by:
Jiayue Cai, University of British Columbia, CanadaCopyright © 2023 Xie, Gao, Wu, Peng, Wu and Lang. This is an open-access article distributed under the terms of the Creative Commons Attribution License (CC BY). The use, distribution or reproduction in other forums is permitted, provided the original author(s) and the copyright owner(s) are credited and that the original publication in this journal is cited, in accordance with accepted academic practice. No use, distribution or reproduction is permitted which does not comply with these terms.
*Correspondence: Liqin Lang, bGFuZ2xxMTIxMkAxNjMuY29t
†These authors have contributed equally to this work
Disclaimer: All claims expressed in this article are solely those of the authors and do not necessarily represent those of their affiliated organizations, or those of the publisher, the editors and the reviewers. Any product that may be evaluated in this article or claim that may be made by its manufacturer is not guaranteed or endorsed by the publisher.
Research integrity at Frontiers
Learn more about the work of our research integrity team to safeguard the quality of each article we publish.