
95% of researchers rate our articles as excellent or good
Learn more about the work of our research integrity team to safeguard the quality of each article we publish.
Find out more
ORIGINAL RESEARCH article
Front. Aging Neurosci. , 07 September 2022
Sec. Alzheimer's Disease and Related Dementias
Volume 14 - 2022 | https://doi.org/10.3389/fnagi.2022.948470
 Lidia Glodzik1*
 Henry Rusinek2
 Tracy Butler1
 Yi Li1
 Pippa Storey2Elizabeth Sweeney3Ricardo S. Osorio4
 Adrienne Biskaduros1Emily Tanzi1
 Patrick Harvey1Christopher Woldstad1Thomas Maloney1
 Mony J. de Leon1
Background and objectives: Obesity is a risk factor for cognitive decline. Probable mechanisms involve inflammation and cerebrovascular dysfunction, leading to diminished cerebral blood flow (CBF) and cerebrovascular reactivity (CVR). The hippocampus, crucially involved in memory processing and thus relevant to many types of dementia, poses a challenge in studies of perfusion and CVR, due to its location, small size, and complex shape. We examined the relationships between body mass index (BMI) and hippocampal resting CBF and CVR to carbon dioxide (CVRCO2) in a group of cognitively normal middle-aged and older adults.
Methods: Our study was a retrospective analysis of prospectively collected data. Subjects were enrolled for studies assessing the role of hippocampal hemodynamics as a biomarker for AD among cognitively healthy elderly individuals (age > 50). Participants without cognitive impairment, stroke, and active substance abuse were recruited between January 2008 and November 2017 at the NYU Grossman School of Medicine, former Center for Brain Health. All subjects underwent medical, psychiatric, and neurological assessments, blood tests, and MRI examinations. To estimate CVR, we increased their carbon dioxide levels using a rebreathing protocol. Relationships between BMI and brain measures were tested using linear regression.
Results: Our group (n = 331) consisted of 60.4% women (age 68.8 ± 7.5 years; education 16.8 ± 2.2 years) and 39.6% men (age 70.4 ± 6.4 years; education 16.9 ± 2.4 years). Approximately 22% of them (n = 73) were obese. BMI was inversely associated with CVRCO2 (β = −0.12, unstandardized B = −0.06, 95% CI −0.11, −0.004). A similar relationship was observed after excluding subjects with diabetes and insulin resistance (β = −0.15, unstandardized B = −0.08, 95% CI −0.16, −0.000). In the entire group, BMI was more strongly related to hippocampal CVRCO2 in women (β = −0.20, unstandardized B = −0.08, 95% CI −0.13, −0.02).
Discussion: These findings lend support to the notion that obesity is a risk factor for hippocampal hemodynamic impairment and suggest targeting obesity as an important prevention strategy. Prospective studies assessing the effects of weight loss on brain hemodynamic measures and inflammation are warranted.
Over the past 2 decades, the prevalence of obesity in the United States has increased from 30 to over 40% (CDC, 2022). It is a recognized risk factor for cognitive decline and Alzheimer’s disease (AD)(Whitmer et al., 2005; Nguyen et al., 2014; Alford et al., 2018; Singh-Manoux et al., 2018); however, the mechanisms for this association are not fully explained.
Excessive body weight facilitates endothelial dysfunction and atherosclerosis through increased lipid storage (Rocha and Libby, 2009) and chronic low-grade inflammation (MacEneaney et al., 2010; Lumeng and Saltiel, 2011). Under normal physiological conditions, vasodilation (and vasoconstriction) is regulated by the secretion of factors derived, among others, from endothelial cells (Shepherd and Katusić, 1991). Endothelial impairment contributes to increased cerebrovascular resistance, diminished cerebral blood flow (CBF) (Coucha et al., 2018), and reduced cerebrovascular reactivity (CVR) (Wenzel et al., 2020).
Animal models of obesity showed that increased body weight is associated with the increased cerebrovascular myogenic tone (Osmond et al., 2009), impaired neurovascular coupling, and endothelium-dependent relaxation (Li et al., 2013), as well as alterations in wall structure and lumen of cerebral vessels (Osmond et al., 2009). All these factors are important determinants of cerebral vasodilation.
An important type of CVR, denoted CVRCO2, is the brain blood vessel response to changing levels of carbon dioxide (CO2). This important regulatory mechanism increases CBF in response to rising CO2 level, which thus increases H+ and constricts vessels when CO2 decreases. CVRCO2, and especially hypercapnic challenge, is considered a valuable marker of vascular health (Liu et al., 2019). CVRCO2 assessment has a diagnostic value in many vascular conditions, revealing diminished reserve, which otherwise would have not been detected with baseline CBF (Liu et al., 2019). Similarly, CVRCO2 evaluation is conducted in the context of dementia and cognitive impairment with the premise that functional abnormalities will be found earlier than the structural ones. Indeed, impaired CVRCO2 coincides with and predicts cognitive decline (Wolters et al., 2016; Alwatban et al., 2019; van der Thiel et al., 2019). Although there are ample bodies of literature showing relationships between CVRCO2 impairment and cognitive status (Glodzik et al., 2013; Wolters et al., 2016; Alwatban et al., 2019; van der Thiel et al., 2019; Kim et al., 2021), studies are mostly focused on global or regional neocortical metrics.
Hippocampal pathology is one of the earliest signs of AD (Glodzik-Sobanska et al., 2005) and is implicated in memory impairment; however, the structure itself is a challenging target for CVRCO2 studies due to technical difficulties related to its small size and location near vessels. The vascular network supplying the hippocampus differs from the architecture of cortical vessels. Hippocampal vasculature exhibits a relatively small number of cross-capillary connectors (anastomoses) and collateral vessels. As a result, the hippocampus has long been suspected of being highly vulnerable, having limited ability to cope with hypoperfusion (Ravens et al., 1968; Duvernoy, 2005). It may be even more susceptible in states of higher demand, such as those occurring during different types of physiological challenges. Less is known regarding how obesity affects hippocampal CVRCO2. In this study, we hypothesized that higher body mass index would be associated with worse vasoreactivity to CO2 in the hippocampus, consistent with (1) its vulnerability to hypoperfusion, (2) its central role in dementia pathology, and (3) known associations between BMI and dementia. Since both diabetes (Last et al., 2007) and insulin resistance (Frosch et al., 2017), linked to a higher BMI, are associated with impaired gray matter CVRCO2, to evaluate whether high body mass alone is related to altered CVRCO2, we also examined whether the relationships can be detected in subjects without diabetes and insulin resistance.
Women are at a greater risk of both dementia (Seshadri et al., 1997) and obesity (Chooi et al., 2019). Moreover, obesity (Whitmer et al., 2005) and measures of fat deposition (Ma et al., 2020) are more strongly associated with dementia in women than in men. Finally, hemodynamic response to CO2 challenge differs between sexes, with some authors showing greater vasoreactivity in women than in men (Kastrup et al., 1997; Minhas et al., 2018). Since it remains unknown whether excessive body weight affects CVRCO2 differently based on sex, we assessed BMI—CVRCO2 association separately in men and women.
The study was a retrospective analysis of prospectively collected data. Subjects described in this report were enrolled for studies assessing the role of hippocampal hemodynamics as an early biomarker for ADs and cognitive decline among cognitively healthy elderly. They were prospectively recruited between January 2008 and November 2017 at the NYU Grossman School of Medicine, the former Center for Brain Health. Those who responded to the advertisement were either themselves interested in research participation and/or were the family members of cognitively impaired patients. All individuals signed Institutional Review Board-approved consent forms. Figure 1 presents exclusion criteria and participant flow: we reported on the final sample of 331 cognitively healthy subjects with CVRCO2 imaging. Participants diagnosed with probable dementia, mild cognitive impairment, and subjects with stroke and active substance abuse were excluded. Clinical diagnosis was based on a physician-administered interview, including ratings on the Brief Cognitive Rating Scale, the Global Deterioration Scale (Reisberg et al., 1993), and the Clinical Dementia Rating (Morris, 1993). Different data from this group were described previously (Glodzik et al., 2019).
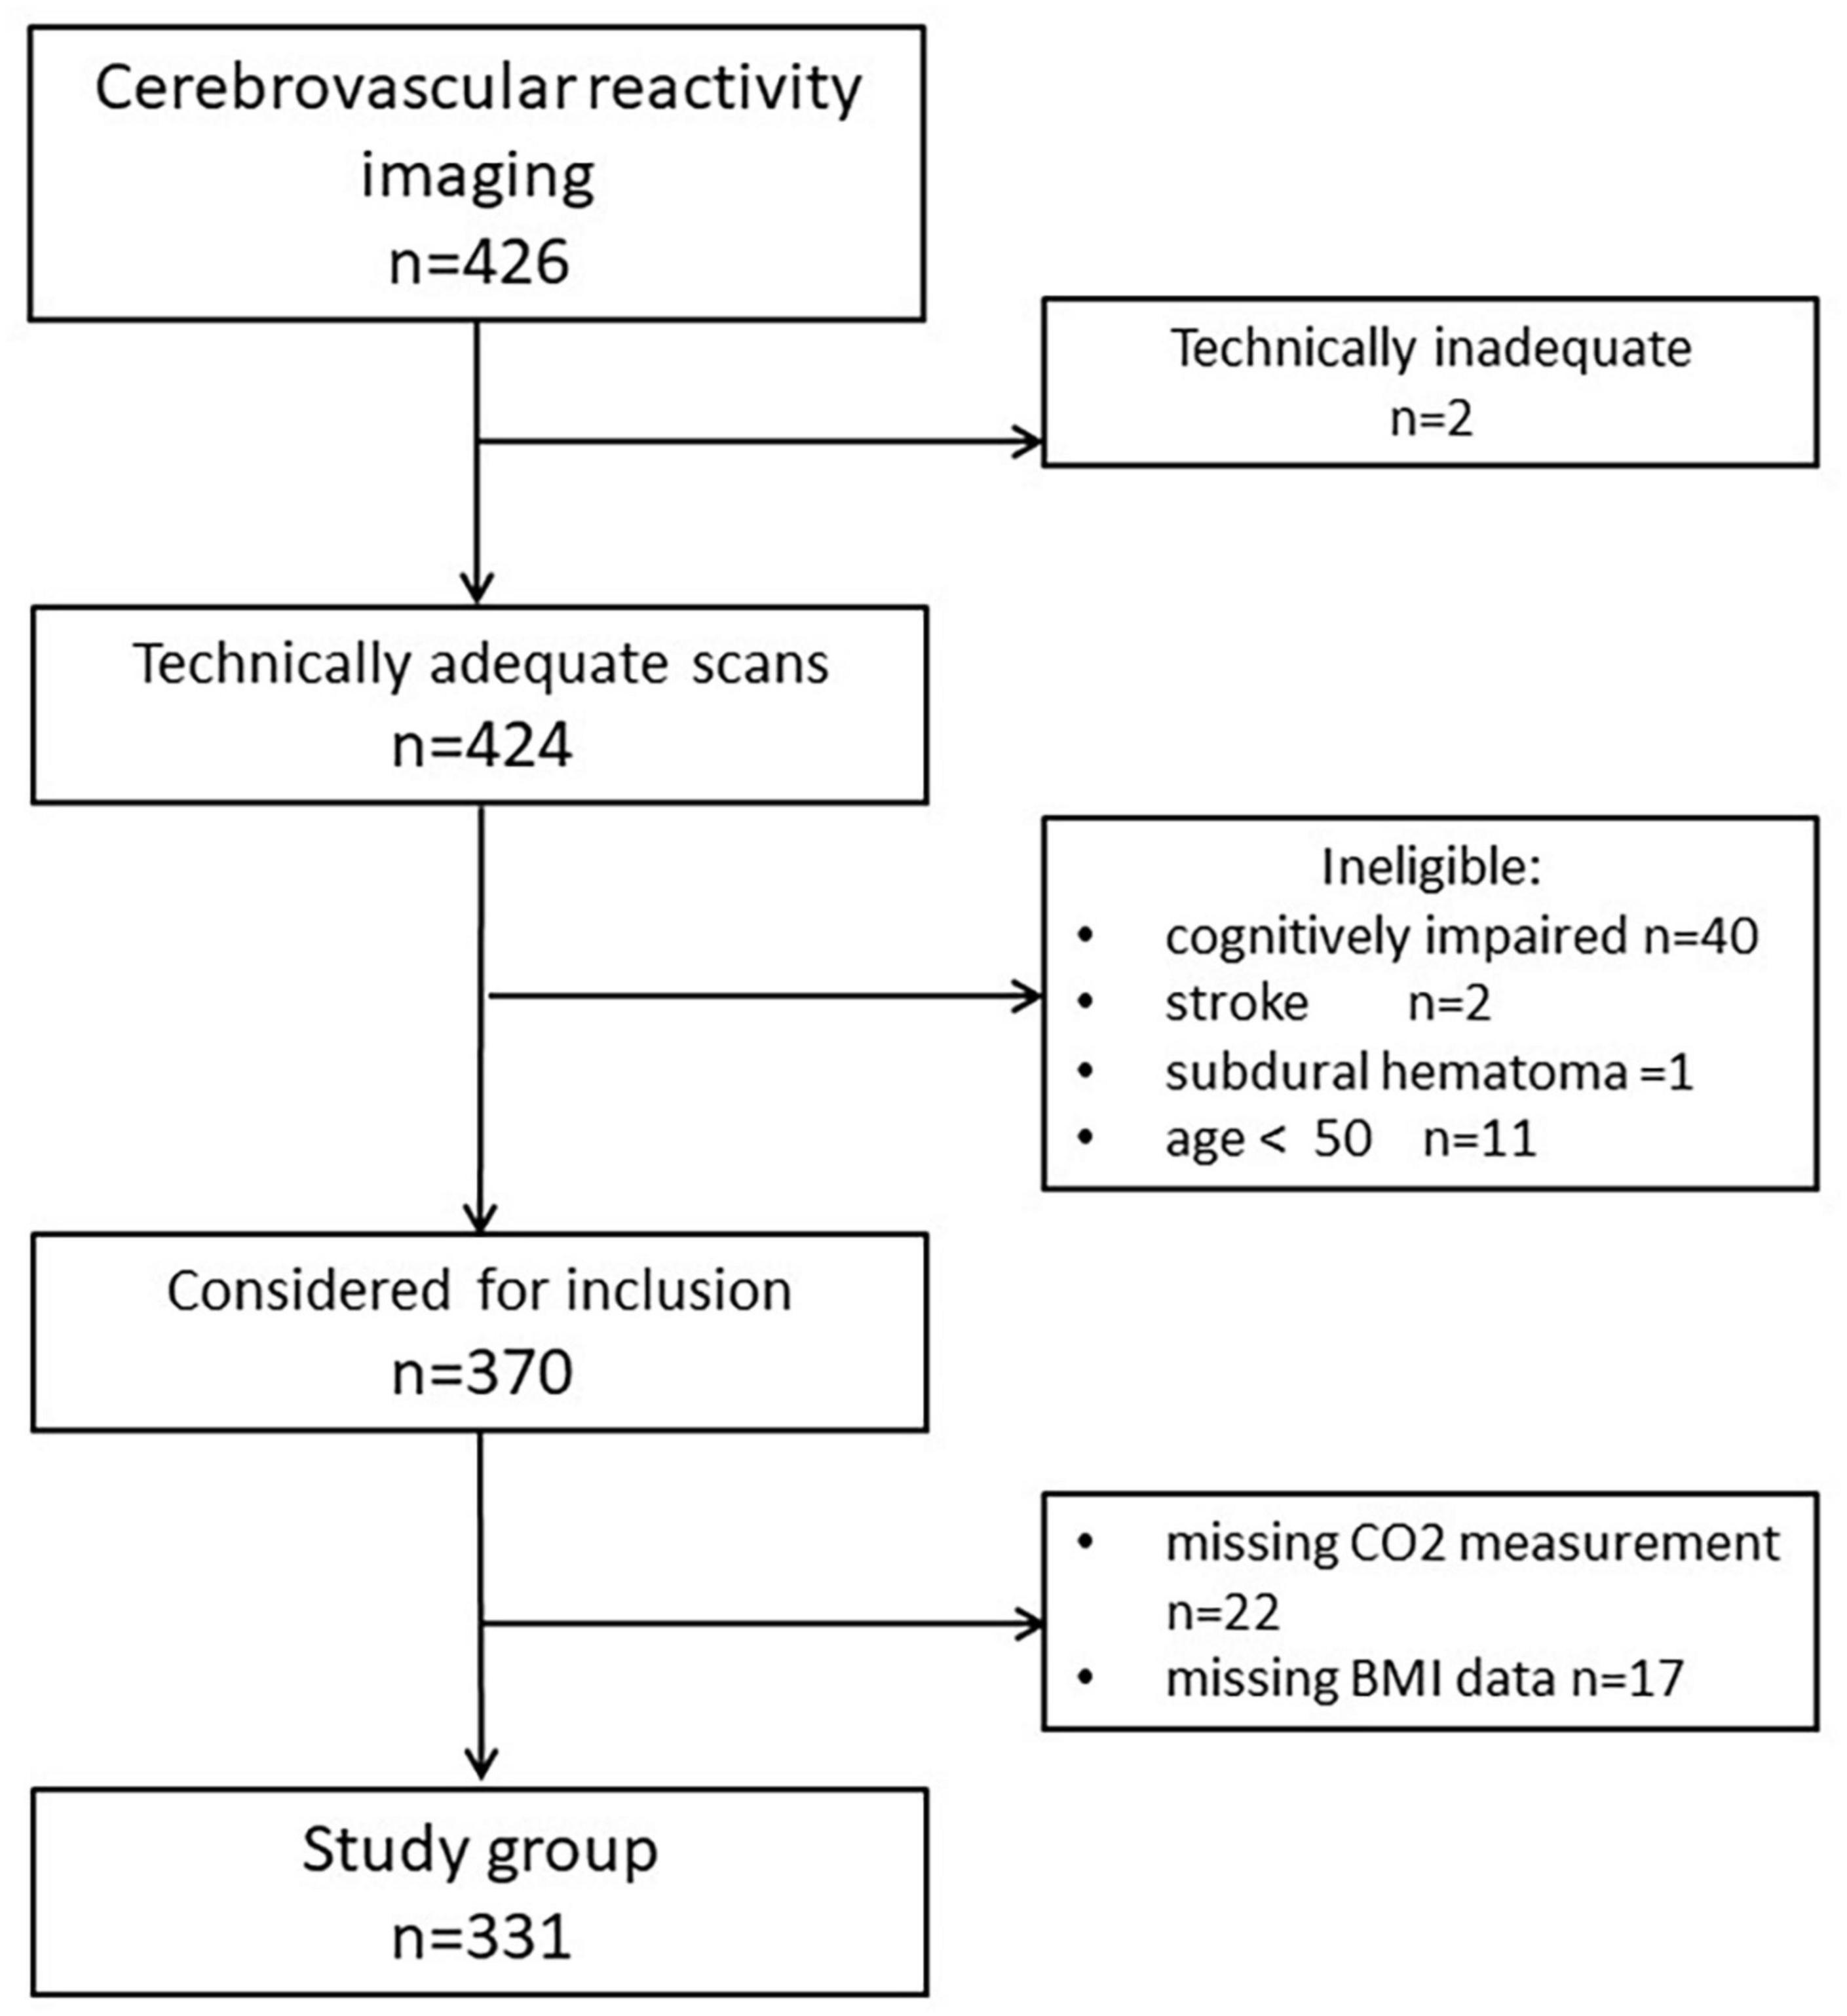
Figure 1. A flowchart describing the final study sample.
All subjects underwent medical, psychiatric, and neurological assessments, blood tests, ECG, and MRI examinations. Blood samples taken in a fasting state were examined for complete blood count, liver function tests, and metabolic and lipid panels. Since the studies contributing participant data to the center did not have perfectly uniform lab acquisition, only a subgroup of subjects had their plasma insulin (n = 280) assessed.
Body mass index (BMI) was calculated as weight/height2 [kilograms]/[meters]2. Obesity was defined based on Center for Disease Control and Prevention definition as BMI ≥ 30. Obesity or lack of thereof was not a criterion for recruitment into studies conducted at our center. Diabetes mellitus was established based on medical history, usage of glucose-lowering medication, or fasting glucose plasma level ≥ 126 mg/dl (American Diabetes Association., 2020).
QUICKI (Quantitative insulin sensitivity check index) (Katz et al., 2000) was calculated as:
1/(Log10 (fasting insulin) + Log10 (fasting glucose)).
Insulin resistance (IR) was defined as QUICKI ≤ 0.35.
Blood pressure was taken in a sitting position, after 5 min of rest (Muntner et al., 1979). It was measured on the left upper arm using a sphygmomanometer. Medication: The use of antihypertensive medications and statin drugs was recorded and used as yes/no categorical variables. Hypertension (HTN) was defined as current antihypertensive treatment or BP ≥ 140/90 mmHg (Chobonian et al., 2003).
All magnetic resonance (MR) imaging scans were performed on the state-of-the-art 3T Prisma system (Siemens, Erlangen, Germany) equipped with a fast gradient system (rise time 200 T/m/s, peak strength 80 mT/m), a parallel transmit array, a zoomed image field-of-view selection, and enhanced parallel-receive array hardware. The imaging protocol consisted of sagittal T1-weighted Magnetization Prepared Rapid Acquisition Gradient Echo (MP-RAGE) [repetition time (TR) = 2,250 ms, echo time (TE) = 2.7 ms, inversion time (TI) = 900 ms, flip angle (FA) = 8°, slice thickness: 1.0 mm, field of view (FOV) = 200 mm],
Fluid Attenuation Inversion Recovery (FLAIR) (TR/TE/TI 9000/99/2,500 ms; FA 130°, slice thickness: 3.3 mm, FOV 220 mm), and locally developed high-resolution perfusion arterial spin labeling (ASL) sequence based on True-fisp balanced steady-state free precession (bSSFP) readout (TI = 1.2 s, FA = 50°, bandwidth = 977 Hz/pixel, 30 × 19.7 cm field of view, slice thickness of 6 mm and in-plane resolution 1.2 × 1.2 mm); (Glodzik et al., 2019).
It takes about 2.5 s to collect a tag/untag pair. We acquired one series of 24 tag/untag repetitions (48 images) during the baseline condition of 1 min. After initiating the rebreathing challenge that was continuously monitored with the capnograph, the second series (also 1 min) of alternating tag/untag images was acquired. The technical details are described in Supplementary material.
Gray matter (GM) and intracranial volumes (ICVs) were estimated using Statistical Parametric Mapping (SPM, version 8) with “New-Segment” extension (Ashburner and Friston, 2000). To match hemodynamic data, structural analyses were also focused on the hippocampus. Left and right hippocampal volumes were obtained with FreeSurfer version 6.0. (Fischl et al., 2002); they were presented as ratios to the ICV.
To optimize hippocampal sampling, ASL was acquired using an oblique slice passing through the left and right hippocampi and the middle temporal gyrus (Glodzik et al., 2019). The hippocampal, cortical, and white matter (WM) regions of interest (ROIs) could be segmented with high accuracy directly on high-resolution ASL images (Figure 2). The WM region was used to calibrate slice profile error arising from the different inversion profiles of water in static tissues by the global and slice-selective inversion pulses. Thus, no CBF for WM was calculated. CBF was calculated in the left and right hippocampi and the cortex. Right and left hippocampal CBF data were averaged to create a mean referred to as “hippocampal CBF.” The cortical ROI encompassed the temporal, parietal, and, in some cases, also occipital cortices on the same axial slice that included both hippocampi. Additional information about ASL processing and sampling is presented in Supplementary material.
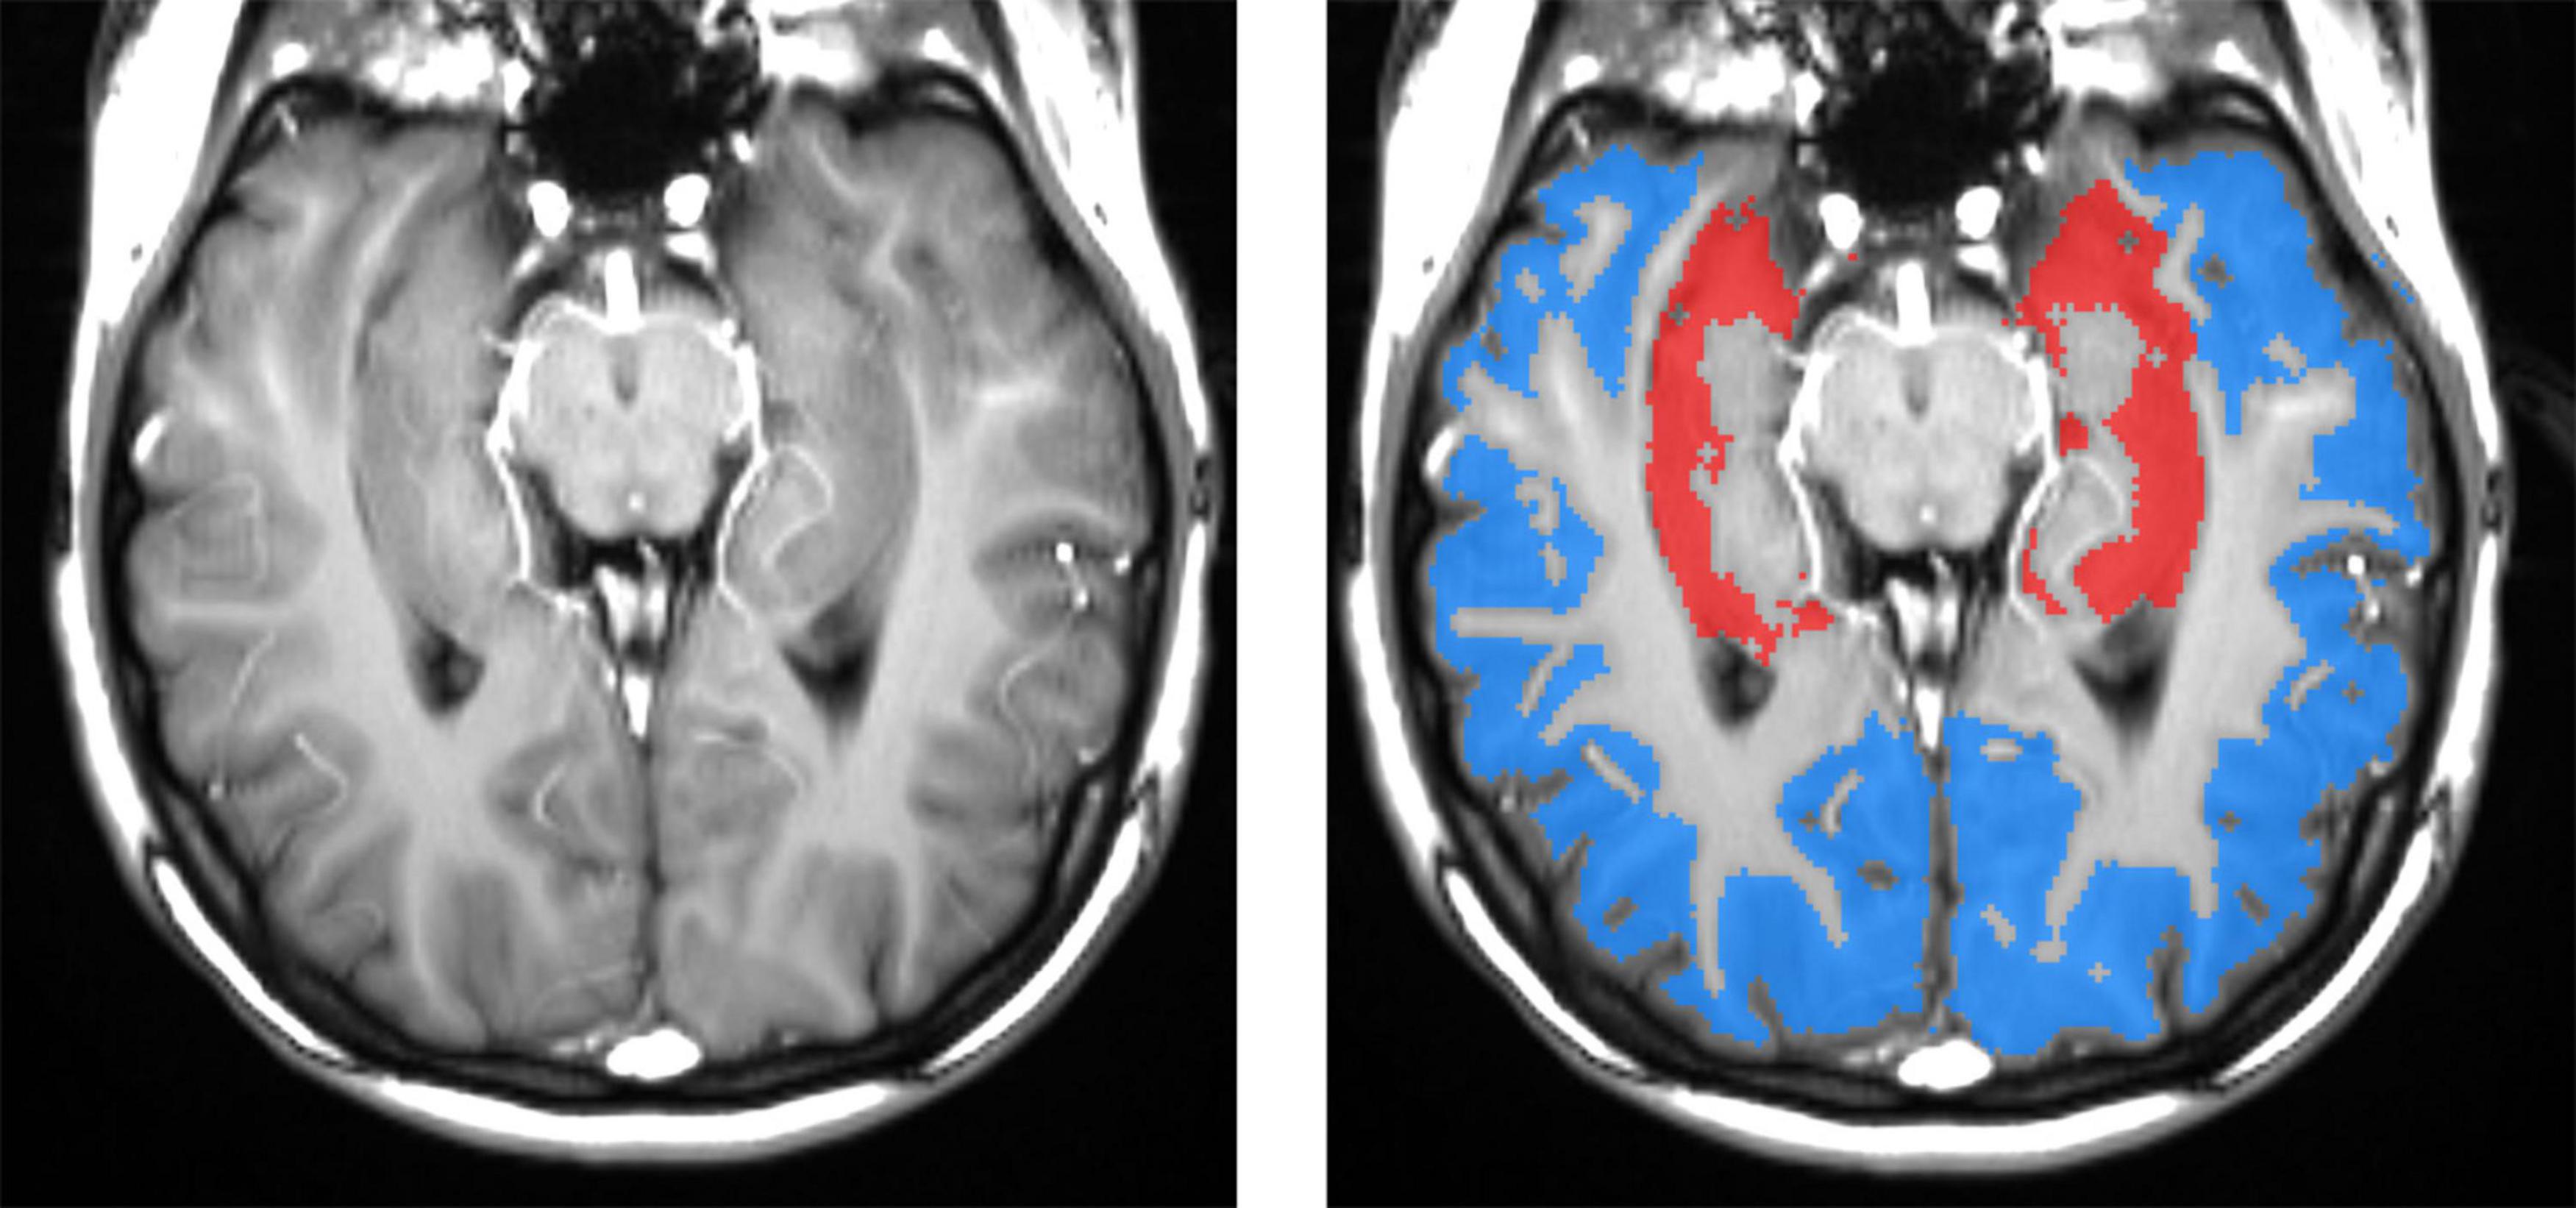
Figure 2. Left panel: spatial resolution and tissue contrast on a tagged (labeled) oblique balanced steady-state free precession image through the main body of the hippocampus. The right panel shows segmented masks for hippocampal (red) and cortical (blue) gray matters. High-resolution ASL enables an accurate definition of hippocampal gray matter, which is important because gray matter CBF is two to three times greater than that in the white matter. Including a variable fraction of white matter would contaminate results with significant errors. The cortical ROI encompasses mostly the temporal and parietal and, in some cases, also occipital cortices on the same axial slice that included both hippocampi.
To estimate CVR, the CO2 level was increased using a rebreathing protocol (Rusinek et al., 2011). Subjects were asked to breathe through a mouthpiece and a respiratory tube. The rebreathing apparatus included a standard gas-anesthesia tube of 35 mm diameter and a custom-adjusted length. The subject’s nose was clamped to force inspiration of partially exhaled air. Oxygen saturation, heart rate, respiratory rate, and CO2 content in the expired air were monitored during image acquisition using a Medrad Veris system. Two consecutive acquisitions were performed at Baseline, where the subject breathed using only a mouthpiece, and at Challenge, where the participant had to breathe through a mouthpiece and a respiratory tube. This procedure is known to elicit mild hypercapnia (Glodzik et al., 2011). Indeed, the rebreathing challenge corresponded to a reliable end-tidal CO2 increase of 6 mmHg (refer to the “Results” section). We stopped breathing through a tube if oxygen saturation fell below 92% for more than 15 s or CO2 increased by more than 15 mmHg. The termination point was not standardized. Participants were not asked to hyperventilate. A subset of 129 subjects repeated the rebreathing examination through a tube on a different occasion. There was no difference in average CO2 change during the first and second rebreathing events. The ICC was moderate at a value equal to 0.5.
The CVRCO2 response to an increase in blood CO2 was calculated as a slope of the presumed linear relationship between CBF and end-tidal CO2:
CVRCO2 = ((CBFchallange – CBFbaseline)/CBFbaseline)*100)/Δ CO2.
where CBFchallange indicates CBF calculated during the session when subjects breathed through a respiratory tube and CBFbaseline indicates CBF calculated during the imaging session without the tube. The units of CBF were ml/100 g/min. Δ CO2 indicates the difference in end-tidal CO2 between two conditions. For hippocampi, baseline and challenge CBF represent an average over left and right.
Categorical variables were compared with χ2-tests. T-test, paired t-test, or analysis of covariance (ANCOVA) was used to compare group means for continuous variables. When appropriate, we used non-parametric Mann-Whitney U-test or ranked ANCOVA. Correlations were evaluated using Pearson or Spearmen coefficients.
MRI data were acquired over the span of 9 years using a 3T magnet system that underwent hardware and software upgrades. We detected the inter-epoch variability in CBF, CVRCO2, and volume measurements. To avoid this fixed bias, the perfusion values were z-scored, recentered, and rescaled as previously described (Glodzik et al., 2019). In a similar way, we z-scored both GM and hippocampal volumes and CVRCO2 values separately by epoch and re-centered and rescaled them.
Finally, the average increase in CBF in response to 1 mmHg increase in carbon dioxide approximates 4 (Grüne et al., 2015) to over 6% (Coverdale et al., 2014). Thus, we excluded all subjects with CVRCO2 exceeding 10% on both high and low tails, as these outlier values were deemed to result from measurement error. This left 298 subjects for the analysis of both hippocampi and 325 subjects for the analysis of the cortex. Included and excluded subjects did not differ in age, sex, hypertension, or BMI.
Since this cutoff value may be considered too arbitrary, we repeated our CVRCO2 analyses after excluding subjects with values exceeding ± 2SD outside the mean. The results are presented in Supplementary material.
To compare resting and challenge the levels of vital parameters (within-subject factor) between obese and non-obese subjects or between men and women (between-subjects factor), we used the general linear model (GLM) repeated measures analysis.
The relationships between CVRCO2, CBF, brain volumes, and BMI were first examined using a linear regression model, in which brain metric was a dependent variable and BMI was used as a sole predictor. Whenever BMI was found to be significant in a model, it was further adjusted for age, sex, hypertension, and BMI-sex interaction. If the BMI-sex interaction was not found to be significant at a 0.10 level of significance, it was removed in a finalized model. If it was significant, we carried out additional analyses stratified by sex. Normality assumptions were checked for each model, and when necessary, analyses were repeated on ranked-transformed variables.
We presented here the F-value for the regression models, as well as unstandardized (B) and standardized (β) coefficients for individual predictors, and the corresponding p-values. Analyses were conducted in the entire group and repeated for subgroups of subjects without diabetes and for those without diabetes or IR.
Statistical significance was defined as a p-value < 0.05. SPSS (version 25, SPSS, Inc., Chicago, IL, United States) software was used for all analyses. Due to a large number of tests conducted, we used the Benjamini-Hochberg procedure to control the false discovery rate, which was set at 15%. The p-value < 0.05 was considered significant (for details, refer to Supplementary Table 6).
Our group of 331 subjects consisted of 60.4% women (age 68.8 ± 7.5 years; education 16.8 ± 2.2 years) and 39.6% men (age 70.4 ± 6.4 years; education 16.9 ± 2.4 years). Approximately 22% of them (n = 73) were obese. Clinical, demographic, and imaging characteristics of the study group are provided in Table 1, stratified by obesity status, in Supplementary Table 1, stratified by sex, and in Supplementary Table 1A, stratified by sex and obesity status.

Table 1. Baseline characteristics of the study group (n = 331), by obese status.
A comparison of physiologic readings between baseline and rebreathing challenge for the entire group showed that CO2 in the end-tidal air increased by 6.08 ± (standard deviation) 3.9 mmHg, heart rate (HR) increased by 0.34 ± 3.5 beats per minute, respiratory rate (RR) decreased by 0.51 ± 2.7 breaths per minute, and oxygen saturation (SatO2) decreased by 0.44 ± 1.5%. The paired t-test revealed that all differences, except HR, were significant. GLM repeated measures analysis with obesity status as a between-subjects factor showed that changes in the above physiological parameters in response to rebreathing did not differ between subjects who are obese and non-obese (Table 1).
Hippocampal CBF was higher than the cortical one (t-test p < 0.001). Similarly, the hippocampus had higher CVRCO2 than the cortex (p = 0.03).
In the following sections, we presented relationships between BMI and brain measures (volume, CBF, CVR) for the hippocampus and the cortex separately. Within each region, we performed analyses in the entire group and then in subgroups of participants without diabetes and those without both diabetes and insulin resistance.
Subjects who are obese had significantly lower hippocampal CVRCO2 (Table 1). In univariate analyses, BMI was associated with CVRCO2 [model’s F(1,297) = 4.5, p = 0.04] but not with hippocampal CBF or volume. In the fully adjusted model [F(5,297) = 2.3, p = 0.04], BMI-sex interaction was significant (Table 2). Further analyses stratified by sex showed that BMI was significantly associated with hippocampal CVRCO2 only in women [model’s F(3,184) = 4.89, p = 0.003]. The higher the BMI, the lower the CVRCO2 (Table 2 and Figure 3).
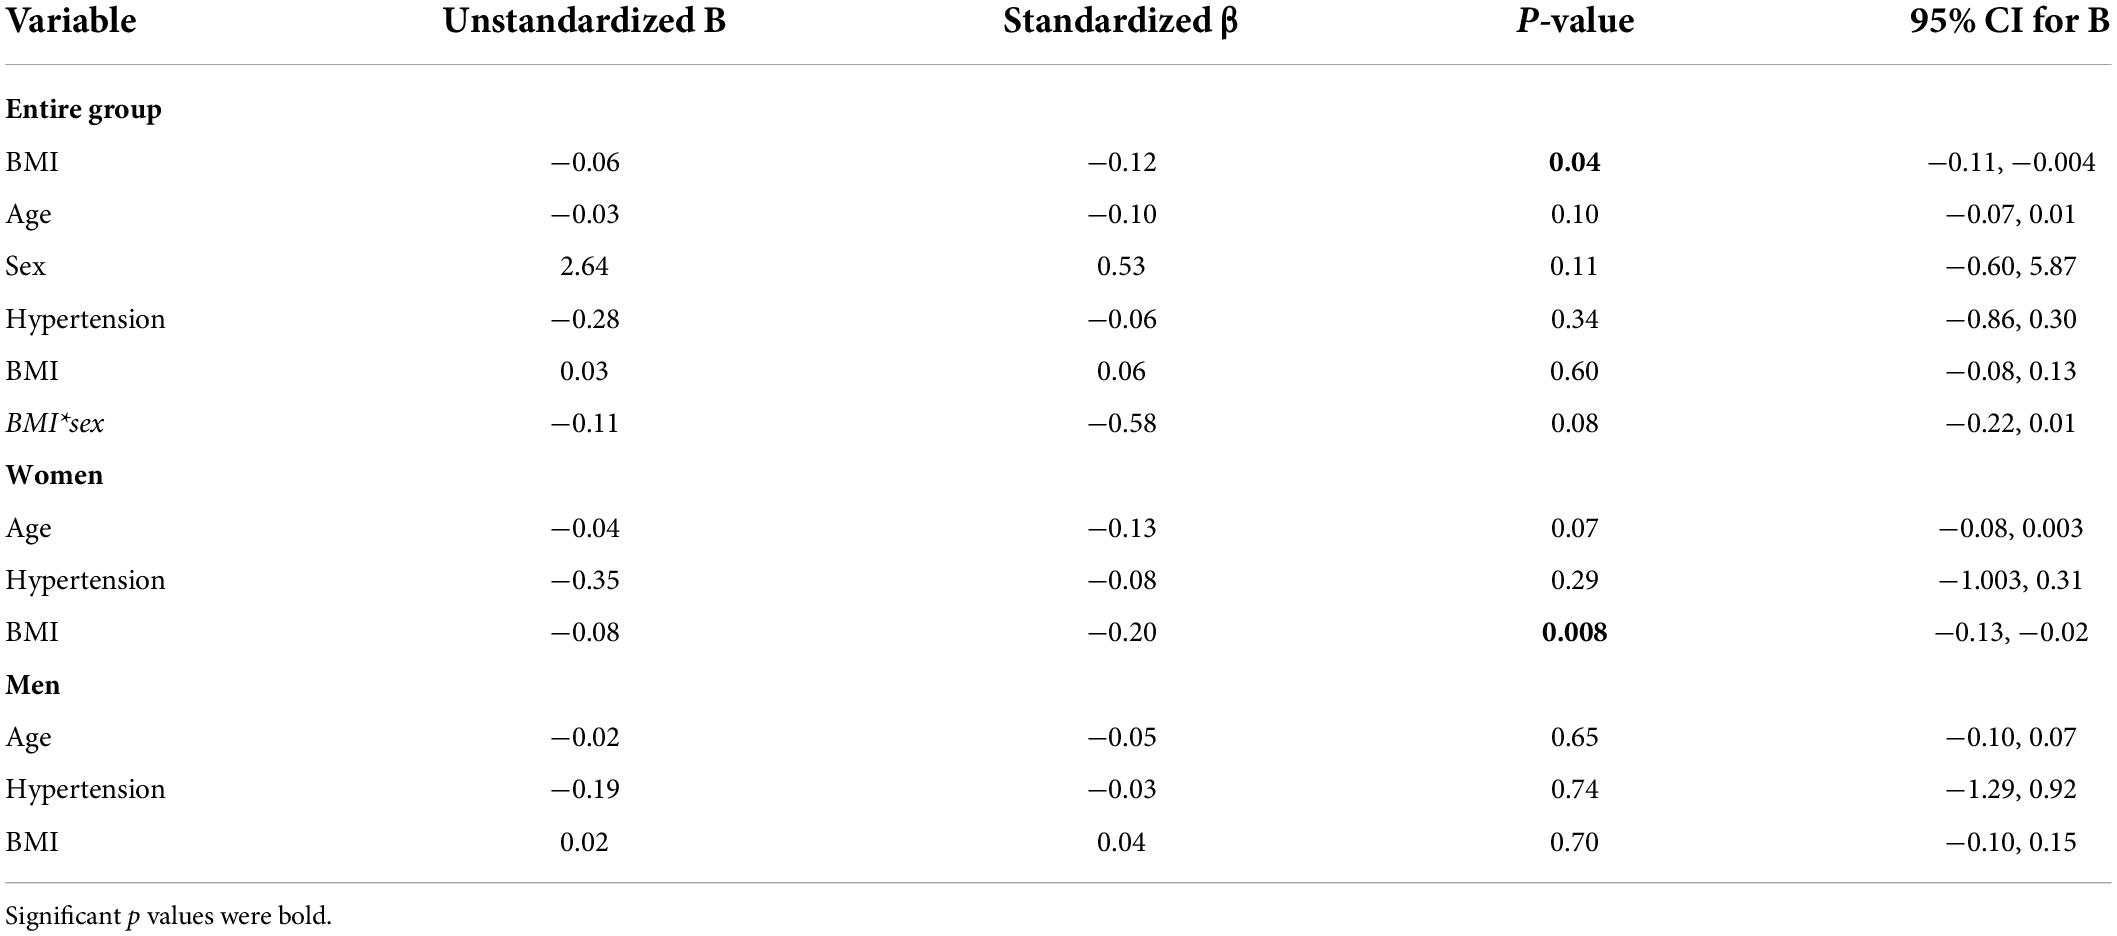
Table 2. Linear regression models predicting hippocampal CVRCO2 in the entire group and among women and men separately.
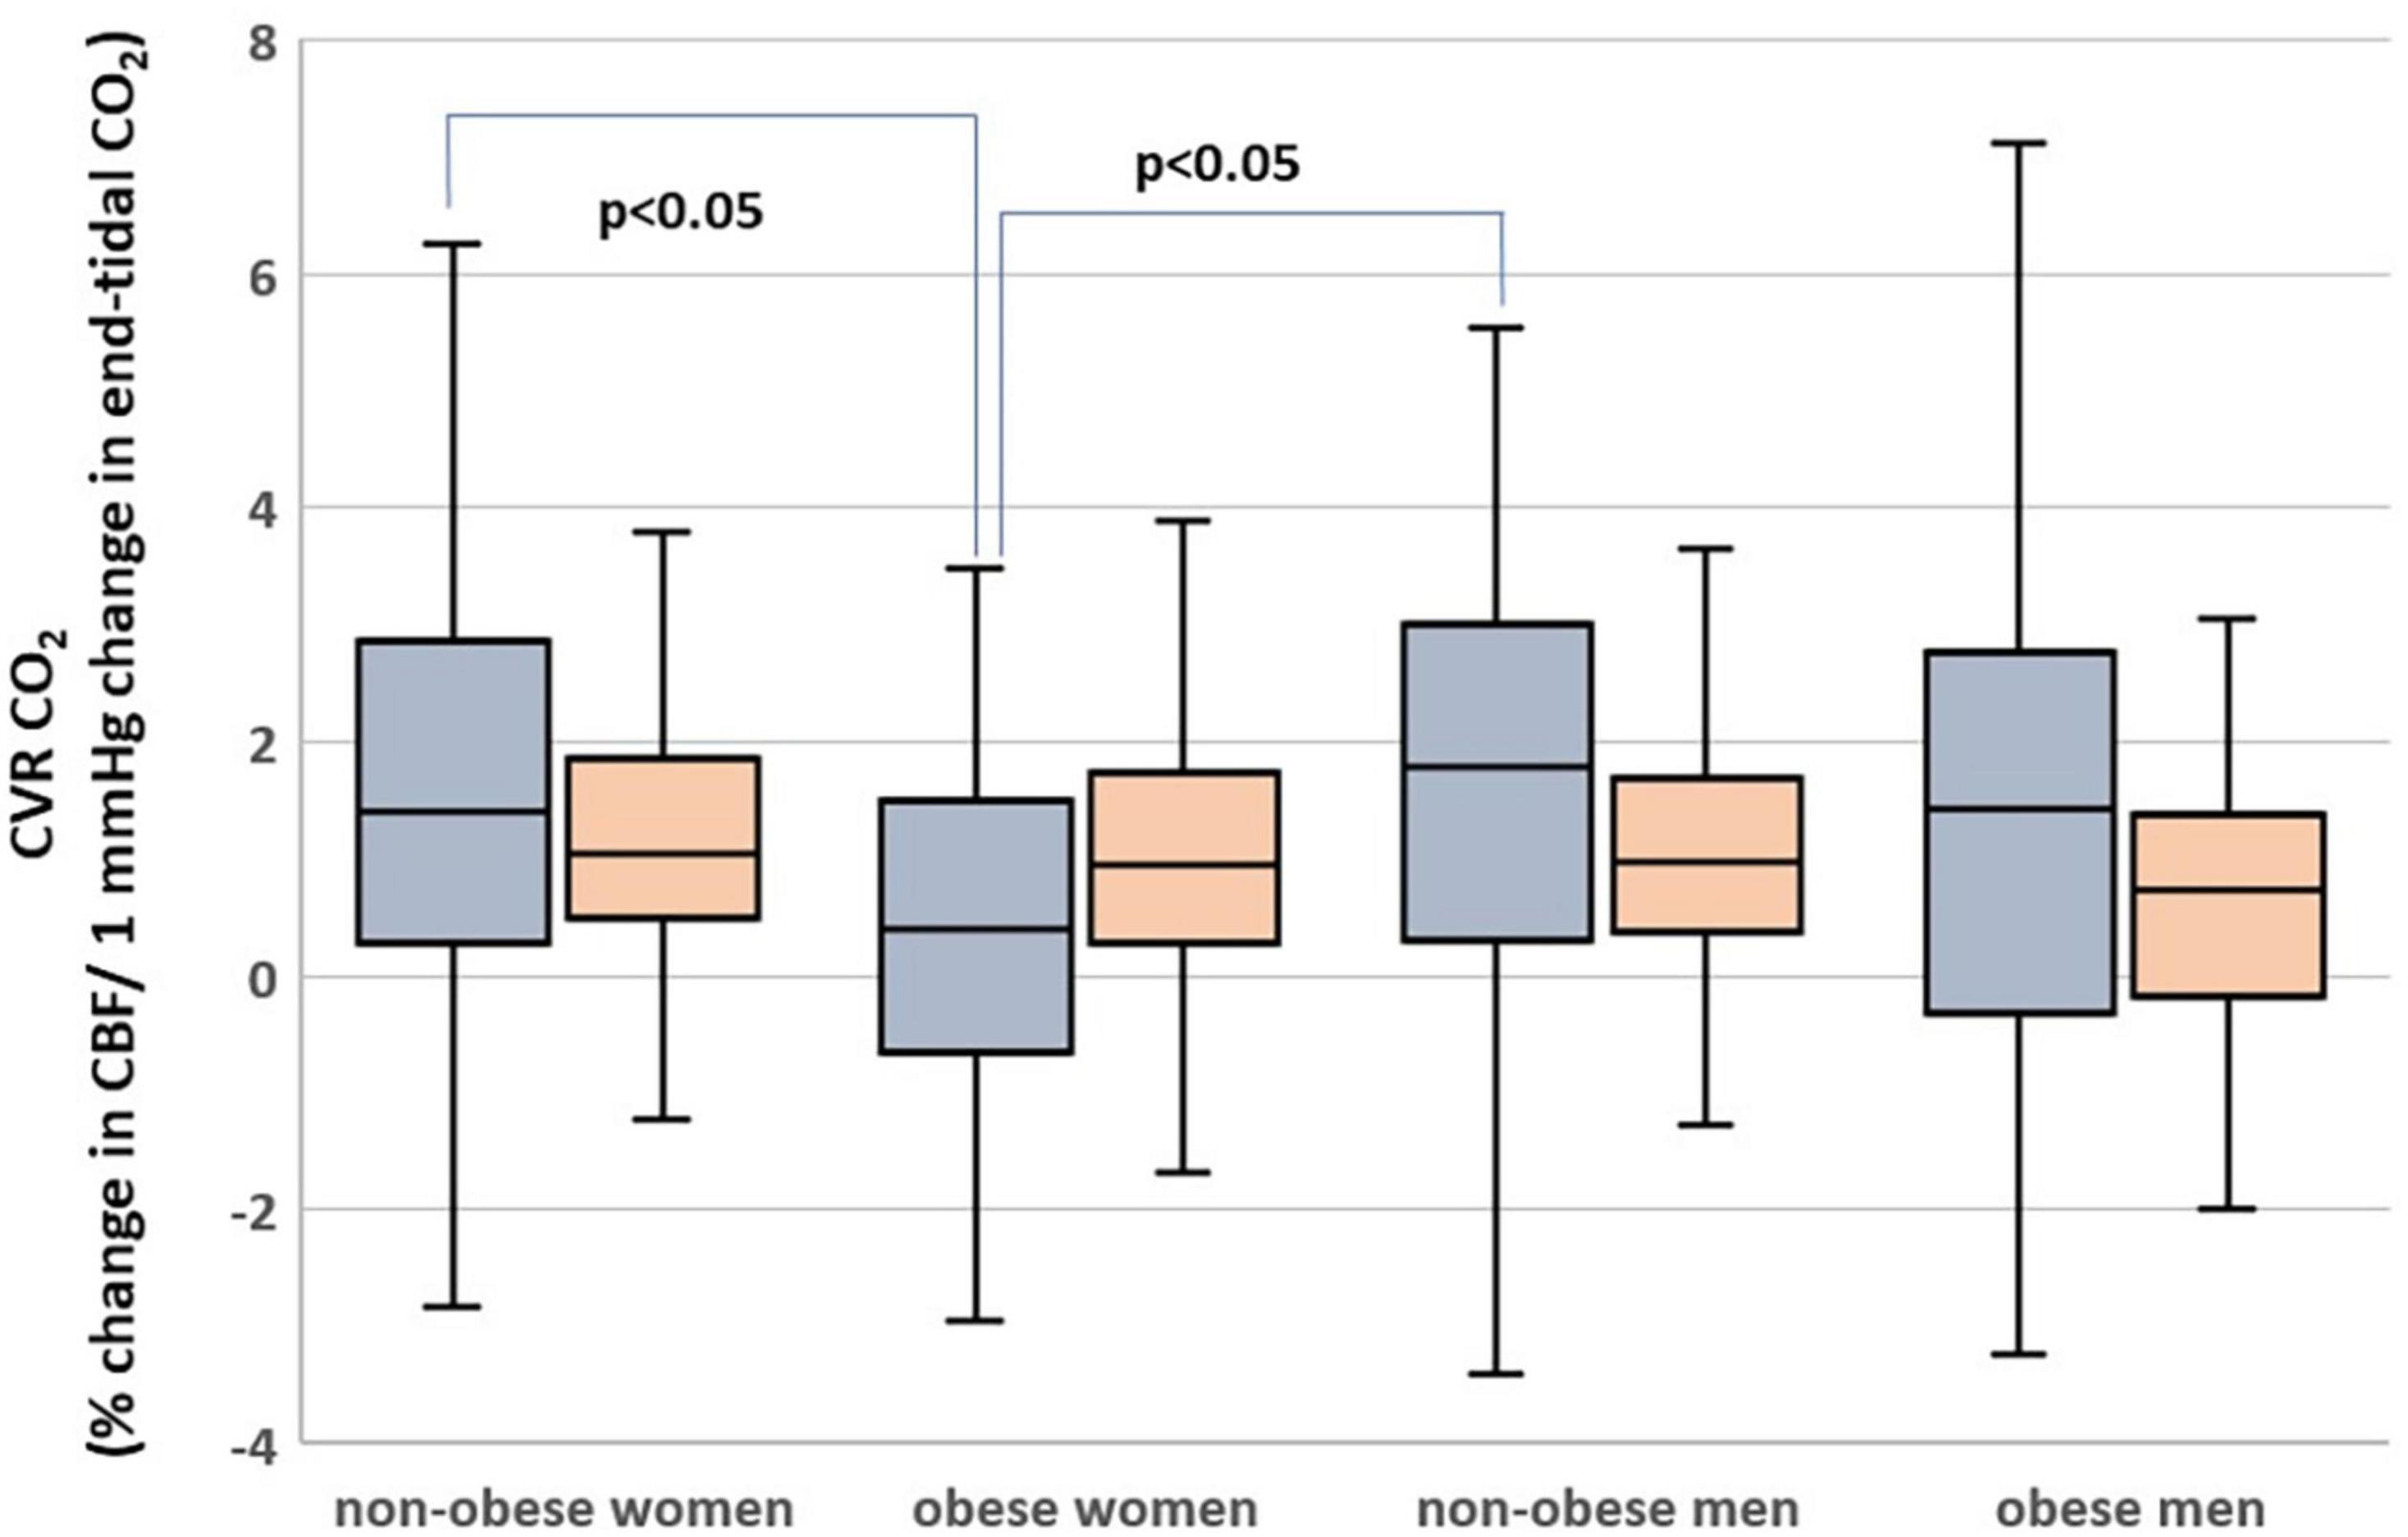
Figure 3. Hippocampal (gray) and cortical (orange) cerebrovascular reactivity to CO2 (CVRCO2) in men and women with obesity and non-obese men and women.
In subjects without diabetes (n = 284), BMI was associated with hippocampal CVRCO2 [model’s F(1; 283) = 4.0, p = 0.046] but not with hippocampal CBF or volume. In a fully adjusted analysis, BMI-sex interaction was statistically significant (Supplementary Table 2). Analyses stratified by sex again revealed the BMI-hippocampal CVRCO2 relationship only in women [model’s F(3,181) = 4.85, p = 0.003] (Supplementary Table 2).
Information about insulin resistance was available for 280 subjects. Two hundred eight did not show insulin resistance and 186 out of 208 had hippocampal CVRCO2 data. There was a negative relationship between BMI and hippocampal CVRCO2 [models’ F(1,185) = 3.9, p = 0.049]. Further adjustments for age, sex, and hypertension did not show that these covariates were significant (Supplementary Table 3). The BMI-sex interaction did not contribute to the model. BMI was not associated with hippocampal CBF or volume.
Analyses using CVRCO2 values after taking outliers 2 standard deviations outside the mean (n = 315) are presented in Supplementary Table 7. They yielded similar results.
Body mass index was associated with GM volume [model’s F(1,330) = 19.5, p < 0.001], but not with CVRCO2 or CBF. In the fully adjusted model [F(4,330) = 35.9, p < 0.001], age and sex were also statistically significant (Table 3). The BMI-sex interaction did not contribute to the model. Higher BMI and older age were associated with lower GM volume. Women had higher GM volumes than men.
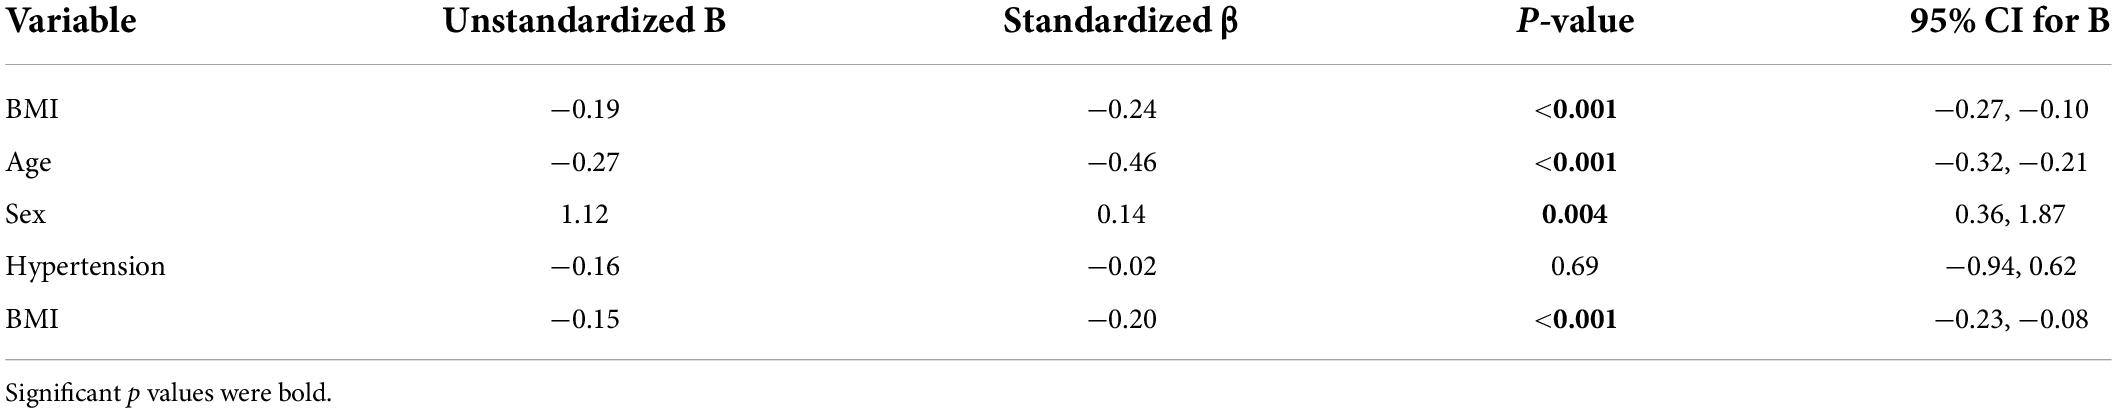
Table 3. Linear regression models predicting GM volumes.
In subjects without diabetes (n = 314), univariate analyses showed that BMI was inversely associated with GM volume [models’ F(1,313) = 21.0, p < 0.001] but not with cortical CVRCO2 or CBF. In the fully adjusted model [F(4,313) = 36.6, p < 0.001], age and sex were statistically significant (Supplementary Table 4). Higher BMI and older age were associated with higher atrophy. Women had higher GM volumes than men.
In this subgroup (n = 208), BMI was inversely associated with GM volume [models’ F(1,207 = 5.1, p = 0.03] in univariate analysis. However, this relationship was no longer significant in the fully adjusted model [F(4,207) = 21.7, p < 0.001] (Supplementary Table 5). BMI was not associated with cortical CVRCO2 or CBF.
Analyses using CVRCO2 values after taking outliers 2 standard deviations outside the mean (n = 313) yielded similar results: no relationship was found between BMI and cortical CVRCO2.
In a group of cognitively unimpaired middle-aged and older adults, higher BMI was associated with lower hippocampal CVRCO2. This relationship was present in women. Women are at a greater risk of developing dementia than men (Seshadri et al., 1997). In addition, and most relevant to our study, obesity seems to play a stronger role as a dementia risk factor in women (Whitmer et al., 2005; Ma et al., 2020). Women differ from men in terms of body fat distribution, metabolic and hormonal regulation of fat deposition, and adipocytes function (Pradhan, 2014). There is also evidence that the hemodynamic response to CO2 challenge differs between sexes, although the direction of these differences is not settled and may depend on age (Deegan et al., 2011; Urback et al., 2018). Finally, our previous study showed that higher BMI was related to amyloid deposition in women but not in men (Glodzik et al., 2016). All these prompted us to stratify analyses based on sex. In our group, women had a somewhat better profile of risk factors than men, especially less insulin resistance and less diabetes, even within the obese subgroup (although the differences between obese women and obese men are not significant). Women had higher brain volumes and higher CBF; however, women who were obese had the lowest hippocampal CVRCO2, and BMI-hippocampal CVRCO2 relationship was evident among women. Our finding, although novel in the brain, is not without precedent in the periphery. In an earlier study, measures of fat distribution were inversely associated with endothelium-dependent and flow-mediated vasodilation, and these relationships were stronger in women than in men (Lind et al., 2019). There is also evidence indicating that women are particularly prone to developing obesity-related endothelial impairment (Suboc et al., 2013). Although mechanisms of this vulnerability are not fully explained, some suggested that higher expression and activation of endothelial mineralocorticoid receptors in women may be a culprit (Faulkner et al., 1979). An alternative explanation could relate to sex hormone levels, which we did not measure. Obesity is related to an increase in androgen level in women but not in men. Since androgens are known vasoconstrictors, we speculate that increased androgens might have contributed to the observed association (Abi-Ghanem et al., 2020). It is also possible that, since in our group there were fewer men than women, there was not enough power to detect the relationship. Endothelial injury is a plausible cause of impaired vasoreactivity (Lavi et al., 2006). High BMI may affect endothelium in a few ways. Endothelial progenitor cells of individuals with obesity release less proangiogenic factors and are more susceptible to apoptotic stimuli (MacEneaney et al., 2010). Second, high BMI results in a persistent proinflammatory state, leading in turn to endothelial damage (Rocha and Libby, 2009).
Earlier research indicates that both diabetes (Last et al., 2007) and insulin resistance, (Frosch et al., 2017) linked to higher BMI, are characterized by gray matter CVRCO2 impairment. Others reported a negative association between global measures of vasoreactivity, namely, the breath holding index and BMI (Rodríguez-Flores et al., 2014). Our novel observation that a negative BMI-CVRCO2 relationship is present in the hippocampus supports previous epidemiological evidence that obesity is a risk factor for dementia (Kivipelto et al., 2005) and neurodegeneration (Gottesman et al., 2017). An earlier study suggested that it was not obesity itself, but rather its metabolic complication, that is, insulin resistance that was responsible for CVRCO2 impairment (Frosch et al., 2017). Our study, conducted in a larger and older group, demonstrates a significant inverse relationship between BMI and hippocampal CVRCO2 even after excluding subjects with diabetes and insulin resistance.
In contrast to earlier findings of reduced CBF with increased body weight (Amen et al., 2020), we found no relationship between BMI and hippocampal blood flow in our group. Hippocampal volume and BMI were also not related. This is somewhat unexpected but may be consistent with a previous study, which found larger hippocampi in elderly subjects with obesity (Widya et al., 2011). On the other hand, several other reports linked obesity with hippocampal atrophy (Cherbuin et al., 2015; Lynch et al., 2021). It is tempting to conclude that functional impairment, detectable in the condition of increased demand, preceded deficit in resting CBF and structural damage. However, our observation that BMI was associated with GM volume, but not cortical CBF or CVRCO2, does not fully support this hypothesis. Our method of assessing cortical perfusion only partially (6 mm slab at the level of the middle temporal lobe) could be responsible for these discrepancies. While hippocampal regions were matched for volume, flow and vasoreactivity, we measured global GM volume from the 3D T1W sequence, but CBF and CVRCO2 were derived from a single slice used in the ASL protocol.
We found that hippocampal perfusion was higher than cortical CBF. The same was true for CVRCO2. Possibly, higher vascular density in the hippocampus as compared to the cortex (Rane et al., 2016) is responsible for this finding. The spillover of ASL signals from big vessels passing near the hippocampus (larger than penetrating arteries in the temporal cortex) could also be the reason for this discrepancy. Finally, it is tempting to speculate that heightened vascular demand puts the hippocampus at a greater risk in the state of challenge.
Overall, we offer that BMI-CVRCO2 relationship in the hippocampus, but not in the surrounding cortex, provides further evidence for hippocampal sensitivity to inflammatory and ischemic damage (Bartsch and Wulff, 2015). In the end, the ultimate proof of the causal relationship between BMI and CVR would be a prospective intervention aimed at BMI reduction.
There are a few limitations to our study. First, and most importantly, it was previously shown that computer-controlled, prospective, end-tidal targeting is an optimal and reliable method of controlling the level of exhaled CO2 (Fisher, 2016). Our rebreathing method produces a rather mild hypercapnia, the termination point not was standardized, and participants were not asked to hyperventilate. All these factors might have resulted in a weak stimulus in our measurements.
The hippocampus is a small structure, and thus, its measurements are intrinsically more susceptible to noise and error, as evidenced by higher numbers of subjects excluded from the analysis of this region. Second, our group was unbalanced: it contained more women, who were younger and healthier. This, however, should have worked against our hypothesis, preventing us from showing BMI-vasoreactivity association among women. We did not assess the level of physical activity in our participants. Similarly, we do not have more precise measures of body composition. Possibly assessing relationships between brain metrics and fat mass or fat-free mass could have revealed more informative associations.
Our subjects were cognitively healthy, middle-aged, or older; thus, we do not know whether we can generalize findings to cognitively impaired individuals in different age groups. Finally, cross-sectional associations cannot be substituted for causal relationships. We do not know how many subjects developed dementia and whether these subjects with reduced hippocampal CVRCO2 were at a higher risk.
Despite these shortcomings, we observed that among cognitively healthy middle-age and older adults, higher BMI was associated with lower hippocampal CVRCO2. This phenomenon persisted after excluding subjects with insulin resistance and was seen predominantly in women. Altogether, these findings lend support to the notion that obesity is a risk factor for hippocampal hemodynamic impairment and suggest targeting obesity as an important prevention strategy. Prospective studies assessing the effects of weight loss on brain hemodynamic measures are warranted.
The data that support the findings of this study are available from the corresponding author on reasonable request.
The studies involving human participants were reviewed and approved by the Institutional Review Board at NYU Grossman School of Medicine. The patients/participants provided their written informed consent to participate.
LG, HR, TB, PS, and ML: drafting and revision of manuscript for content (incl. medical writing), study concept and design, data analysis and interpretation, and major role in data acquisition. YL: drafting and revision of manuscript for content (incl. medical writing), study concept and design, and data analysis and interpretation. ES: drafting and revision of manuscript for content, and data analysis and interpretation. RO: drafting and revision of manuscript for content (incl. medical writing), and data analysis and interpretation. AB, CW, and TM: drafting and revision of manuscript for content (incl. medical writing). ET and PH: drafting and revision of manuscript for content, and major role in data acquisition. All authors contributed to the article and approved the submitted version.
Funding for this study was received from NIH grants HL111724, NS104364, AG022374, AG12101, AG08051, HL118624, R01HL117787, and R01AG056031.
The authors declare that the research was conducted in the absence of any commercial or financial relationships that could be construed as a potential conflict of interest.
All claims expressed in this article are solely those of the authors and do not necessarily represent those of their affiliated organizations, or those of the publisher, the editors and the reviewers. Any product that may be evaluated in this article, or claim that may be made by its manufacturer, is not guaranteed or endorsed by the publisher.
The Supplementary Material for this article can be found online at: https://www.frontiersin.org/articles/10.3389/fnagi.2022.948470/full#supplementary-material
Abi-Ghanem, C., Robison, L. S., and Zuloaga, K. L. (2020). Androgens’ effects on cerebrovascular function in health and disease. Biol. Sex Differ. 11:35. doi: 10.1186/s13293-020-00309-4
Alford, S., Patel, D., Perakakis, N., and Mantzoros, C. S. (2018). Obesity as a risk factor for Alzheimer’s disease: Weighing the evidence. Obes. Rev. 19, 269–280. doi: 10.1111/obr.12629
Alwatban, M., Murman, D. L., and Bashford, G. (2019). Cerebrovascular Reactivity Impairment in Preclinical Alzheimer’s Disease. J. Neuroimaging 29, 493–498. doi: 10.1111/jon.12606
Amen, D. G., Wu, J., George, N., and Newberg, A. (2020). Patterns of Regional Cerebral Blood Flow as a Function of Obesity in Adults. J. Alzheimers Dis. 77, 1331–1337. doi: 10.3233/jad-200655
American Diabetes Association. (2020). 2. Classification and Diagnosis of Diabetes: Standards of Medical Care in Diabetes-2020. Diabetes Care 43, S14–S31. doi: 10.2337/dc20-S002
Ashburner, J., and Friston, K. J. (2000). Voxel-based morphometry–the methods. Neuroimage 11, 805–821.
Bartsch, T., and Wulff, P. (2015). The hippocampus in aging and disease: From plasticity to vulnerability. Neuroscience 309, 1–16. doi: 10.1016/j.neuroscience.2015.07.084
CDC (2022). Adult Obesity Facts. Available online at: https://www.cdc.gov/obesity/data/adult.html (accessed November 8, 2022).
Cherbuin, N., Sargent-Cox, K., Fraser, M., Sachdev, P., and Anstey, K. J. (2015). Being overweight is associated with hippocampal atrophy: The PATH Through Life Study. Int. J. Obes. 39, 1509–1514. doi: 10.1038/ijo.2015.106
Chobonian, A., Bakris, G. L., Black, H. R., Cushman, W. C., Green, L. A., Izzo, J. L. Jr., et al. (2003). The Seventh Report of the Joint National Committee on Prevention Detection, Evaluation, and Treatment of High Blood Pressure. JAMA 289, 2560–2572.
Chooi, Y. C., Ding, C., and Magkos, F. (2019). The epidemiology of obesity. Metabolism 92, 6–10. doi: 10.1016/j.metabol.2018.09.005
Coucha, M., Abdelsaid, M., Ward, R., Abdul, Y., and Ergul, A. (2018). Impact of Metabolic Diseases on Cerebral Circulation: Structural and Functional Consequences. Compr. Physiol. 8, 773–799. doi: 10.1002/cphy.c170019
Coverdale, N. S., Gati, J. S., Opalevych, O., Perrotta, A., and Shoemaker, J. K. (2014). Cerebral blood flow velocity underestimates cerebral blood flow during modest hypercapnia and hypocapnia. J. Appl. Physiol. 117, 1090–1096. doi: 10.1152/japplphysiol.00285.2014
Deegan, B. M., Sorond, F. A., Galica, A., Lipsitz, L. A., O’Laighin, G., and Serrador, J. M. (2011). Elderly women regulate brain blood flow better than men do. Stroke 42, 1988–1993. doi: 10.1161/strokeaha.110.605618
Duvernoy, H. M. (2005). Functional Anatomy, Vascularization and Serial Sections with MRI. Berlin Hedelberg: Springer
Faulkner, J. L., Kennard, S., Huby, A. C., Antonova, G., Lu, Q., Jaffe, I. Z., et al. (1979). Progesterone Predisposes Females to Obesity-Associated Leptin-Mediated Endothelial Dysfunction via Upregulating Endothelial MR (Mineralocorticoid Receptor) Expression. Hypertension 2019, 678–686. doi: 10.1161/hypertensionaha.119.12802
Fischl, B., Salat, D. H., Busa, E., Albert, M., Dieterich, M., Haselgrove, C., et al. (2002). Whole brain segmentation: Automated labeling of neuroanatomical structures in the human brain. Neuroimage 33, 341–355.
Fisher, J. A. (2016). The CO2 stimulus for cerebrovascular reactivity: Fixing inspired concentrations vs. targeting end-tidal partial pressures. J. Cereb. Blood Flow Metab. 36, 1004–1011. doi: 10.1177/0271678x16639326
Frosch, O. H., Yau, P. L., Osorio, R. S., Rusinek, H., Storey, P., and Convit, A. (2017). Insulin resistance among obese middle-aged is associated with decreased cerebrovascular reactivity. Neurology 89, 249–255. doi: 10.1212/wnl.0000000000004110
Glodzik, L., Randall, C., Rusinek, H., and de Leon, M. J. (2013). Cerebrovascular reactivity to carbon dioxide in Alzheimer’s disease. J. Alzheimer’s Dis. 35, 427–440. doi: 10.3233/JAD-122011
Glodzik, L., Rusinek, H., Brys, M., Tsui, W. H., Switalski, R., Mosconi, L., et al. (2011). Framingham cardiovascular risk profile correlates with impaired hippocampal and cortical vasoreactivity to hypercapnia. J. Cereb. Blood Flow Metab. 31, 671–679. doi: 10.1038/jcbfm.2010.145
Glodzik, L., Rusinek, H., Kamer, A., Pirraglia, E., Tsui, W., Mosconi, L., et al. (2016). Effects of vascular risk factors, statins, and antihypertensive drugs on PiB deposition in cognitively normal subjects. Alzheimers Dement. 2, 95–104. doi: 10.1016/j.dadm.2016.02.007
Glodzik, L., Rusinek, H., Tsui, W., Pirraglia, E., Kim, H.-J., Deshpande, A., et al. (2019). Different Relationship Between Systolic Blood Pressure and Cerebral Perfusion in Subjects With and Without Hypertension. Hypertension 73, 197–205. doi: 10.1161/HYPERTENSIONAHA.118.11233
Glodzik-Sobanska, L., Rusinek, H., Mosconi, L., Li, Y., Zhan, J., de Santi, S., et al. (2005). The role of quantitative structural imaging in the early diagnosis of Alzheimer’s disease. Neuroimaging Clin. N. Am. 15, 803–826. doi: 10.1016/j.nic.2005.09.004
Gottesman, R. F., Schneider, A. L., Zhou, Y., Coresh, J., Green, E., Gupta, N., et al. (2017). Association Between Midlife Vascular Risk Factors and Estimated Brain Amyloid Deposition. JAMA 317, 1443–1450. doi: 10.1001/jama.2017.3090
Grüne, F., Kazmaier, S., Stolker, R. J., Visser, G. H., and Weyland, A. (2015). Carbon dioxide induced changes in cerebral blood flow and flow velocity: Role of cerebrovascular resistance and effective cerebral perfusion pressure. J. Cereb. Blood Flow Metab. 35, 1470–1477. doi: 10.1038/jcbfm.2015.63
Kastrup, A., Thomas, C., Hartmann, C., and Schabet, M. (1997). Sex dependency of cerebrovascular CO2 reactivity in normal subjects. Stroke 28, 2353–2356. doi: 10.1161/01.str.28.12.2353
Katz, A., Nambi, S. S., Mather, K., Baron, A. D., Follmann, D. A., Sullivan, G., et al. (2000). Quantitative insulin sensitivity check index: A simple, accurate method for assessing insulin sensitivity in humans. J. Clin. Endocrinol. Metab. 85, 2402–2410. doi: 10.1210/jcem.85.7.6661
Kim, D., Hughes, T. M., Lipford, M. E., Craft, S., Baker, L. D., Lockhart, S. N., et al. (2021). Relationship Between Cerebrovascular Reactivity and Cognition Among People With Risk of Cognitive Decline. Front. Physiol. 12:645342. doi: 10.3389/fphys.2021.645342
Kivipelto, M., Ngandu, T., Fratiglioni, L., Viitanen, M., Kåreholt, I., Winblad, B., et al. (2005). Obesity and vascular risk factors at midlife and the risk of dementia and Alzheimer disease. Arch. Neurol. 62, 1556–1560. doi: 10.1001/archneur.62.10.1556
Last, D., Alsop, D. C., Abduljalil, A. M., Marquis, R. P., de Bazelaire, C., Hu, K., et al. (2007). Global and regional effects of type 2 diabetes on brain tissue volumes and cerebral vasoreactivity. Diabetes Care 30, 1193–1199. doi: 10.2337/dc06-2052
Lavi, S., Gaitini, D., Milloul, V., and Jacob, G. (2006). Impaired cerebral CO2 vasoreactivity: Association with endothelial dysfunction. Am. J. Physiol. Heart Circ. Physiol. 291, H1856–H1861. doi: 10.1152/ajpheart.00014.2006
Li, W., Prakash, R., Chawla, D., Du, W., Didion, S. P., Filosa, J. A., et al. (2013). Early effects of high-fat diet on neurovascular function and focal ischemic brain injury. Am. J. Physiol. Regul. Integr. Comp. Physiol. 304, R1001–R1008. doi: 10.1152/ajpregu.00523.2012
Lind, L., Strand, R., Michaelsson, K., Kullberg, J., and Ahlström, H. (2019). Relationship between endothelium-dependent vasodilation and fat distribution using the new “imiomics” image analysis technique. Nutr. Metab. Cardiovasc. Dis. 29, 1077–1086. doi: 10.1016/j.numecd.2019.06.017
Liu, P., De Vis, J. B., and Lu, H. (2019). Cerebrovascular reactivity (CVR) MRI with CO2 challenge: A technical review. Neuroimage 187, 104–115. doi: 10.1016/j.neuroimage.2018.03.047
Lumeng, C. N., and Saltiel, A. R. (2011). Inflammatory links between obesity and metabolic disease. J. Clin. Invest. 121, 2111–2117. doi: 10.1172/jci57132
Lynch, K. M., Page, K. A., Shi, Y., Xiang, A. H., Toga, A. W., and Clark, K. A. (2021). The effect of body mass index on hippocampal morphology and memory performance in late childhood and adolescence. Hippocampus 31, 189–200. doi: 10.1002/hipo.23280
Ma, Y., Ajnakina, O., Steptoe, A., and Cadar, D. (2020). Higher risk of dementia in English older individuals who are overweight or obese. Int. J. Epidemiol. 49, 1353–1365. doi: 10.1093/ije/dyaa099
MacEneaney, O. J., Kushner, E. J., Westby, C. M., Cech, J. N., Greiner, J. J., Stauffer, B. L., et al. (2010). Endothelial progenitor cell function, apoptosis, and telomere length in overweight/obese humans. Obesity 18, 1677–1682. doi: 10.1038/oby.2009.494
Minhas, J. S., Panerai, R. B., and Robinson, T. G. (2018). Sex differences in cerebral haemodynamics across the physiological range of PaCO(2). Physiol. Meas. 39:105009. doi: 10.1088/1361-6579/aae469
Morris, J. C. (1993). The Clinical Dementia Rating (CDR): Current version and scoring rules. Neurology 43, 2412–2414. doi: 10.1212/wnl.43.11.2412-a
Muntner, P., Shimbo, D., Carey, R. M., Charleston, J. B., Gaillard, T., Misra, S., et al. (1979). Measurement of Blood Pressure in Humans: A Scientific Statement From the American Heart Association. Hypertension 2019, e35–e66. doi: 10.1161/hyp.0000000000000087
Nguyen, J. C., Killcross, A. S., and Jenkins, T. A. (2014). Obesity and cognitive decline: Role of inflammation and vascular changes. Front. Neurosci. 8:375. doi: 10.3389/fnins.2014.00375
Osmond, J. M., Mintz, J. D., Dalton, B., and Stepp, D. W. (2009). Obesity increases blood pressure, cerebral vascular remodeling, and severity of stroke in the Zucker rat. Hypertension 53, 381–386. doi: 10.1161/hypertensionaha.108.124149
Pradhan, A. D. (2014). Sex differences in the metabolic syndrome: Implications for cardiovascular health in women. Clin. Chem. 60, 44–52. doi: 10.1373/clinchem.2013.202549
Rane, S., Talati, P., Donahue, M. J., and Heckers, S. (2016). iVASO reproducibility in the hippocampus and cortex at different blood water nulling times. Magn. Reson. Med. 75, 2379–2387. doi: 10.1002/mrm.25836
Ravens, J. R., Toole, J. F., and Hasegawa, T. (1968). Anastomoses in the vascular bed of the human cerebrum. J. Neuropathol. Exp. Neurol. 27, 123–124.
Reisberg, B. S. S., Franssen, E. H., de Leon, M. J., Kluger, A., Torossian, C. L., Shulman, E., et al. (1993). Clinical stages of normal aging and Alzheimer’s disease: The GDS staging system. Neurosci. Res. 13, 551–554.
Rocha, V. Z., and Libby, P. (2009). Obesity, inflammation, and atherosclerosis. Nat. Rev. Cardiol. 6, 399–409. doi: 10.1038/nrcardio.2009.55
Rodríguez-Flores, M., García-García, E., Cano-Nigenda, C. V., and Cantú-Brito, C. (2014). Relationship of obesity and insulin resistance with the cerebrovascular reactivity: A case control study. Cardiovasc. Diabetol. 13:2. doi: 10.1186/1475-2840-13-2
Rusinek, H., Brys, M., Glodzik, L., Switalski, R., Tsui, W. H., Haas, F., et al. (2011). Hippocampal blood flow in normal aging measured with arterial spin labeling at 3T. Magn. Reason. Med. 65, 128–137. doi: 10.1002/mrm.22611
Seshadri, S., Wolf, P. A., Beiser, A., Au, R., McNulty, K., White, R., et al. (1997). Lifetime risk of dementia and Alzheimer’s disease. The impact of mortality on risk estimates in the Framingham Study. Neurology 49, 1498–1504. doi: 10.1212/wnl.49.6.1498
Shepherd, J. T., and Katusiæ, Z. S. (1991). Endothelium-derived vasoactive factors: I. Endothelium-dependent relaxation. Hypertension 18, III76–III85. doi: 10.1161/01.hyp.18.5_suppl.iii76
Singh-Manoux, A., Dugravot, A., Shipley, M., Brunner, E. J., Elbaz, A., Sabia, S., et al. (2018). Obesity trajectories and risk of dementia: 28 years of follow-up in the Whitehall II Study. Alzheimers Dement. 14, 178–186. doi: 10.1016/j.jalz.2017.06.2637
Suboc, T. M., Dharmashankar, K., Wang, J., Ying, R., Couillard, A., Tanner, M. J., et al. (2013). Moderate Obesity and Endothelial Dysfunction in Humans: Influence of Gender and Systemic Inflammation. Physiol. Rep. 1:e00058. doi: 10.1002/phy2.58
Urback, A. L., Metcalfe, A. W. S., Korczak, D. J., MacIntosh, B. J., and Goldstein, B. I. (2018). Magnetic resonance imaging of cerebrovascular reactivity in healthy adolescents. J. Neurosci. Methods. 306, 1–9. doi: 10.1016/j.jneumeth.2018.06.001
van der Thiel, M., Rodriguez, C., Van De Ville, D., Giannakopoulos, P., and Haller, S. (2019). Regional Cerebral Perfusion and Cerebrovascular Reactivity in Elderly Controls With Subtle Cognitive Deficits. Front. Aging Neurosci. 11:19. doi: 10.3389/fnagi.2019.00019
Wenzel, J., Hansen, C. E., Bettoni, C., Vogt, M. A., Lembrich, B., Natsagdorj, R., et al. (2020). Impaired endothelium-mediated cerebrovascular reactivity promotes anxiety and respiration disorders in mice. Proc. Natl. Acad. Sci. U.S.A. 117, 1753–1761. doi: 10.1073/pnas.1907467117
Whitmer, R. A., Gunderson, E. P., Barrett-Connor, E., Quesenberry, C. P. Jr., and Yaffe, K. (2005). Obesity in middle age and future risk of dementia: A 27 year longitudinal population based study. BMJ 330:1360. doi: 10.1136/bmj.38446.466238.E0
Widya, R. L., de Roos, A., Trompet, S., de Craen, A. J., Westendorp, R. G., Smit, J. W., et al. (2011). Increased amygdalar and hippocampal volumes in elderly obese individuals with or at risk of cardiovascular disease. Am. J. Clin. Nutr. 93, 1190–1195. doi: 10.3945/ajcn.110.006304
Keywords: Alzheimer’s disease, hippocampus, obesity, MRI, cerebral blood blow, cerebrovascular reactivity (CVR)
Citation: Glodzik L, Rusinek H, Butler T, Li Y, Storey P, Sweeney E, Osorio RS, Biskaduros A, Tanzi E, Harvey P, Woldstad C, Maloney T and de Leon MJ (2022) Higher body mass index is associated with worse hippocampal vasoreactivity to carbon dioxide. Front. Aging Neurosci. 14:948470. doi: 10.3389/fnagi.2022.948470
Received: 19 May 2022; Accepted: 22 July 2022;
Published: 07 September 2022.
Edited by:
James Duffin, University of Toronto, CanadaReviewed by:
Youngkyoo Jung, University of California, Davis, United StatesCopyright © 2022 Glodzik, Rusinek, Butler, Li, Storey, Sweeney, Osorio, Biskaduros, Tanzi, Harvey, Woldstad, Maloney and de Leon. This is an open-access article distributed under the terms of the Creative Commons Attribution License (CC BY). The use, distribution or reproduction in other forums is permitted, provided the original author(s) and the copyright owner(s) are credited and that the original publication in this journal is cited, in accordance with accepted academic practice. No use, distribution or reproduction is permitted which does not comply with these terms.
*Correspondence: Lidia Glodzik, bGlnNDAwNUBtZWQuY29ybmVsbC5lZHU=
Disclaimer: All claims expressed in this article are solely those of the authors and do not necessarily represent those of their affiliated organizations, or those of the publisher, the editors and the reviewers. Any product that may be evaluated in this article or claim that may be made by its manufacturer is not guaranteed or endorsed by the publisher.
Research integrity at Frontiers
Learn more about the work of our research integrity team to safeguard the quality of each article we publish.