 Marge Kartau1*Susanna Melkas1Joonas Kartau2Anne Arola3Hanna Laakso3Johanna Pitkänen1Juha Lempiäinen1Juha Koikkalainen4,5Jyrki Lötjönen4,6Antti Korvenoja7Matti Ahlström1Sanna-Kaisa Herukka8Timo Erkinjuntti1Hanna Jokinen3
- 1Department of Neurology, Helsinki University Hospital and University of Helsinki, Helsinki, Finland
- 2Department of Mathematics and Statistics, University of Helsinki, Helsinki, Finland
- 3Division of Neuropsychology, HUS Neurocenter, Helsinki University Hospital and University of Helsinki, Helsinki, Finland
- 4Combinostics Ltd, Tampere, Finland
- 5Faculty of Health Sciences, University of Eastern Finland, Kuopio, Finland
- 6Department of Neuroscience and Biomedical Engineering, School of Science, Aalto University, Espoo, Finland
- 7Medical Imaging Center, Radiology, University of Helsinki and Helsinki University Hospital, Helsinki, Finland
- 8Institute of Clinical Medicine/Neurology, University of Eastern Finland, Helsinki, Finland
Background: The usefulness of neurofilament light (NfL) as a biomarker for small vessel disease has not been established. We examined the relationship between NfL, neuroimaging changes, and clinical findings in subjects with varying degrees of white matter hyperintensity (WMH).
Methods: A subgroup of participants (n = 35) in the Helsinki Small Vessel Disease Study underwent an analysis of NfL in cerebrospinal fluid (CSF) as well as brain magnetic resonance imaging (MRI) and neuropsychological and motor performance assessments. WMH and structural brain volumes were obtained with automatic segmentation.
Results: CSF NfL did not correlate significantly with total WMH volume (r = 0.278, p = 0.105). However, strong correlations were observed between CSF NfL and volumes of cerebral grey matter (r = −0.569, p < 0.001), cerebral cortex (r = −0.563, p < 0.001), and hippocampi (r = −0.492, p = 0.003). CSF NfL also correlated with composite measures of global cognition (r = −0.403, p = 0.016), executive functions (r = −0.402, p = 0.017), memory (r = −0.463, p = 0.005), and processing speed (r = −0.386, p = 0.022). Regarding motor performance, CSF NfL was correlated with Timed Up and Go (TUG) test (r = 0.531, p = 0.001), and gait speed (r = −0.450, p = 0.007), but not with single-leg stance. After adjusting for age, associations with volumes in MRI, functional mobility (TUG), and gait speed remained significant, whereas associations with cognitive performance attenuated below the significance level despite medium to large effect sizes.
Conclusion: NfL was strongly related to global gray matter and hippocampal atrophy, but not to WMH severity. NfL was also associated with motor performance. Our results suggest that NfL is independently associated with brain atrophy and functional mobility, but is not a reliable marker for cerebral small vessel disease.
Introduction
Neurofilament light (NfL) is a polypeptide expressed only in neurons and released into cerebrospinal fluid (CSF) following axonal injury, irrespective of underlying cause (Zetterberg, 2016). Plasma NfL is a consequence of leaked NfL from CSF. Elevated NfL levels have been found in numerous neurological conditions from Alzheimer’s disease (AD) to motor neuron disease (MND) (Kuhle et al., 2011; Lu et al., 2015; Rohrer et al., 2016; Byrne et al., 2017; Mattsson et al., 2017; Benatar et al., 2018; Gaetani et al., 2019a; Lin et al., 2019). There is good evidence for the usefulness of NfL in the differential diagnosis and prognosis of amyotrophic lateral sclerosis (ALS). NfL can also be used to differentiate between clinical and genetic ALS subgroups (Behzadi et al., 2021; Zhou et al., 2021).
Some studies have suggested a confounding effect between NfL levels and subjects’ body mass index (BMI), blood volume (Manouchehrinia et al., 2020), and glucose level (Sampedro et al., 2020). NfL is a dynamic biomarker and it has been suggested as part of a follow-up strategy in, for example, multiple sclerosis (MS) as a marker of disease activity and treatment response (Novakova et al., 2017).
Small vessel disease (SVD)-related white matter hyperintensities (WMH) and subcortical infarcts have been found to associate with elevated NfL (Sjögren et al., 2001; Jonsson et al., 2010; Gattringer et al., 2017; Duering et al., 2018; Peters et al., 2020). In addition to WMH and subcortical infarcts, SVD-related changes include microbleeds, enlarged perivascular spaces and brain atrophy (Wardlaw et al., 2013).
Association between NfL and cognitive impairment has been studied across several neurological diseases such as MS, Parkinson disease, MND, and AD (Lin et al., 2018; Gaetani et al., 2019b; Olsson et al., 2019). Most of these studies revealed an inverse relationship between general cognitive status and NfL level. Association between NfL and motor skills has been studied in MS, ALS and Parkinson disease (Allali et al., 2020; Vacchiano et al., 2021; Ye et al., 2021).
In recent years, numerous studies have reported association between NfL and brain atrophy in MS (Barro et al., 2018; Plavina et al., 2020) and neurodegenerative diseases (Skillbäck et al., 2014; Dhiman et al., 2020). Khalili et al. showed in a population-based cohort that NfL is associated with brain volume changes (Khalil et al., 2020).
The aim of this study was to explore the association of CSF NfL levels with WMH and structural brain volumes. Another focus in this study was to examine how NfL as an axonal injury marker is related to global cognition and the specific domains of processing speed, executive function, and memory as well as functional mobility, gait, and balance.
Materials and methods
Participants were drawn from the Helsinki SVD study, a prospective cohort study. The Helsinki SVD study investigates the progression of imaging, clinical, and cognitive characteristics of cerebral SVD in elderly individuals. Subjects were recruited from the imaging registry of the Helsinki University Hospital (HUS), Finland during the period between October 2016 and March 2020. The Helsinki SVD study enrolled 152 participants with different degrees of WMH, aged 65–75 years, excluding subjects with major neurological and psychiatric diseases, substance abuse, history of head trauma needing hospitalization, severe sight or hearing impairments influencing conducting cognitive tests, intellectual disability, and inability to undergo brain magnetic resonance imaging (MRI). Comprehensive neurological, neuropsychological and laboratory examinations and a brain MRI with standard protocol were carried out during three visits within 1 month.
We recruited patients to participate in this substudy to evaluate CSF samples starting from 2019. The patients who had undergone brain MRI not more than 6 months earlier were eligible. Further exclusion criteria were hippocampal atrophy Scheltens grade 3–4, anticoagulant therapy, predisposition to bleeding, and refusal of lumbar puncture. A final total of 35 patients met the study criteria and were willing to participate in the substudy.
The demographic and clinical information of the participants as well as participants risk factors for small vessel disease are presented in Table 1.
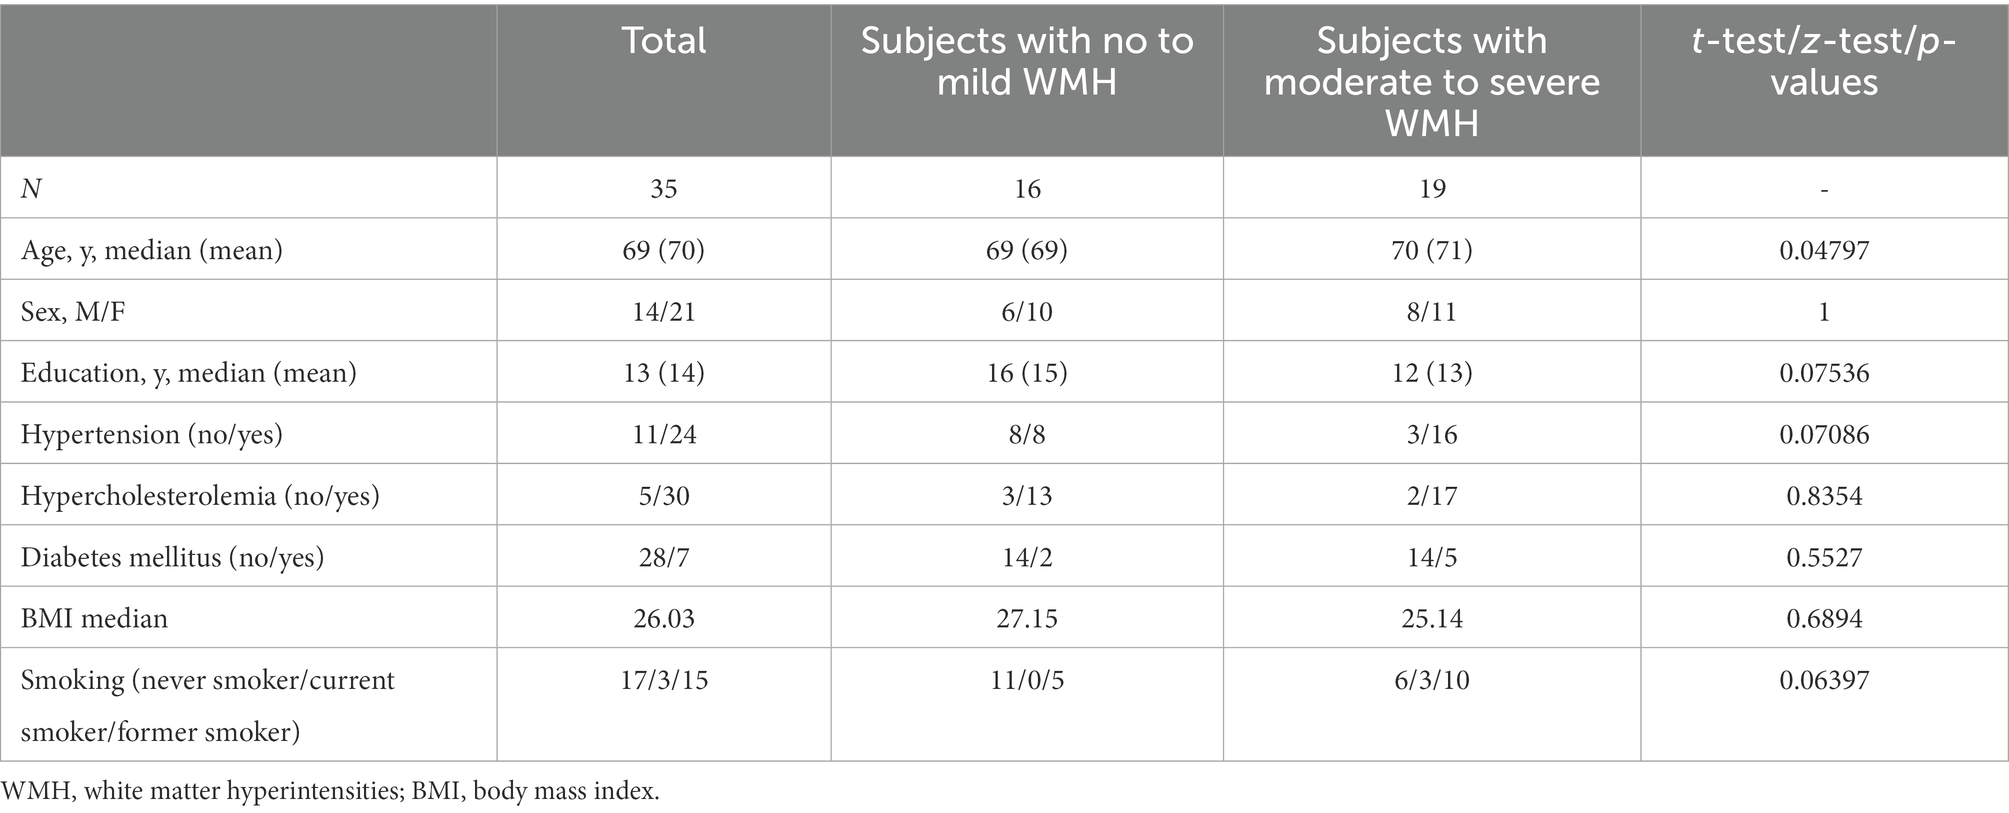
Table 1. Demographic data and vascular risk factors between subjects with no to mild WMH and subjects with moderate to severe WMH.
The study was approved by the Ethics Committee of the HUS and conducted according to the Declaration of Helsinki. Informed written consent was received from each study participant.
Magnetic resonance imaging
Imaging was performed with a 3 T MRI scanner with a 32-channel head coil. The imaging protocol consisted of a plane localizer, 3D fluid-attenuated inversion recovery (FLAIR) SPACE, 3D T2 SPACE, 3D T1 MPRAGE, 3D gradient echo (GE) susceptibility weighted imaging (SWI) sequence, 3D GE sequence with magnetization transfer pulse on and off.
WMH of vascular origin were defined on FLAIR sequences as hyperintense areas in the white matter without cavitation. WMH were first evaluated visually by an experienced neuroradiologist using the modified Fazekas scale, with scores 0 = none, 1 = mild, 2 = moderate, and 3 = severe (Pantoni et al., 2005). Two groups were formed based on Fazekas scores, one group with subjects with no to mild WMH (n = 16) and another with subjects with moderate to severe WMH (n = 19). Volumes of brain structures and WMH were further evaluated using an automated multi-stage segmentation method on FLAIR images as previously described (Lötjönen et al., 2010; Koikkalainen et al., 2016; Jokinen et al., 2021). We used volumes of cerebral gray matter, cerebral cortex, hippocampi, and WMH. All brain volumes (ml) were normalized for intracranial volume (Buckner et al., 2004), and logarithmic transformation was used to account for non-normality of WMH volume distributions.
Evaluation of cognitive functions
A comprehensive neuropsychological assessment was carried out with an extensive test battery as previously detailed (Jokinen et al., 2021). Based on multiple tests, standardized domain-specific composite scores were constructed for six cognitive functions: processing speed, executive functions, working memory, memory and learning, visuospatial perception, and verbal reasoning. A global cognition score (GCS) was calculated by taking the mean of all domain scores. In the present study, we used GCS as the primary measure, and processing speed, executive functions, and memory as the key domain-specific outcomes.
Evaluation of motor skills
To evaluate motor functions, we used the Timed Up and Go (TUG) test as well as measurements of gait speed, and balance. The TUG test assesses functional mobility. The subject was asked to rise from a chair without using armrests, walk 3 meters, turn, walk back to the chair and sit down again (Podsiadlo and Richardson, 1991). The variable was the time in seconds that subjects needed to complete the test. Gait speed was measured twice in meters per second (m/s) over an 8-meter distance. The faster of two results was recorded (Baezner et al., 2008). Single-leg stance time was measured to assess balance. Subjects were asked to stand on one leg with hands on their hips. The variable used was the best time of two trials on each leg with a maximum of 60 s (Baezner et al., 2008).
Laboratory tests
CSF samples were collected from January 2019 to March 2020. Samples were processed and frozen according to standardized procedures. The levels of NfL, Aβ1-42, total Tau and phosphorylated Tau in the CSF were determined at the biomarker laboratory of the University of Eastern Finland. CSF NfL was measured using Simoa (Single Molecule Array) digital immunoassay (Wilson et al., 2016) (Nfl Advantage assay, #103186, Quanterix, Lexington, Massachusetts, United States) according to the manufacturer’s instructions. Prior to analysis, the samples were diluted as recommended in the assay protocol; CSF samples 1:100 in NfL sample diluent buffer (Quanterix). All measured values were within the calibration range (0.5–500 pg./ml). The average intra-assay CV for duplicate sample measurements was 6.0%. The operators were blinded to all clinical information. All samples were analyzed on the same batch of reagents, using the same Simoa HD-1 instrument (Quanterix).
CSF Aβ1-42, total Tau and phosphorylated Tau were measured using electrochemiluminescence immunoassays Elecsys β-Amyloid (1–42) CSF (#06986811), Elecsys Total-Tau CSF (#6986838) and Elecsys Phospho-Tau (181P) CSF (#6986846) on a fully automated cobas e602 analyzer (Bittner et al., 2016; Lifke et al., 2019).
Statistical analyses
Statistical analyses were performed in R, version 4.0.5.
To evaluate differences between patients with no to mild WMH and moderate to severe WMH, t-tests were performed for age, years of education, and BMI. To evaluate differences in proportions z-tests for sex, hypertension, hypercholesterolemia, diabetes, and smoking were performed. For smoking, samples were classified as ever-smokers or never smokers for the z-test.
Independent two-sample t-tests were used to identify potential differences in CSF NfL level between sexes and WMH groups.
CSF NfL and the WMH and structural brain volumes (volumes of total WMH, cerebral gray matter, cerebral cortex, hippocampus), cognitive and motor tests results (global cognition, executive functions, memory, processing speed, TUG, gait speed, single-leg stance) and BMI, diabetes, hypertension were explored with Pearson correlation tests. Linear regression adjusted for age was also used to assess the strength of the individual relationships between CSF NfL and the response variables: subjects’ age, GCS, TUG, gait speed, and volumes of cerebral gray matter, cerebral cortex, hippocampus, and total WMH. The effect size of each variable was measured with Cohen’s f2. Adjustments for false discovery rates (FDR) were applied separately to the MRI and cognitive and motor variables. Results that were significant using an FDR of 0.05 have been marked in Table 2.
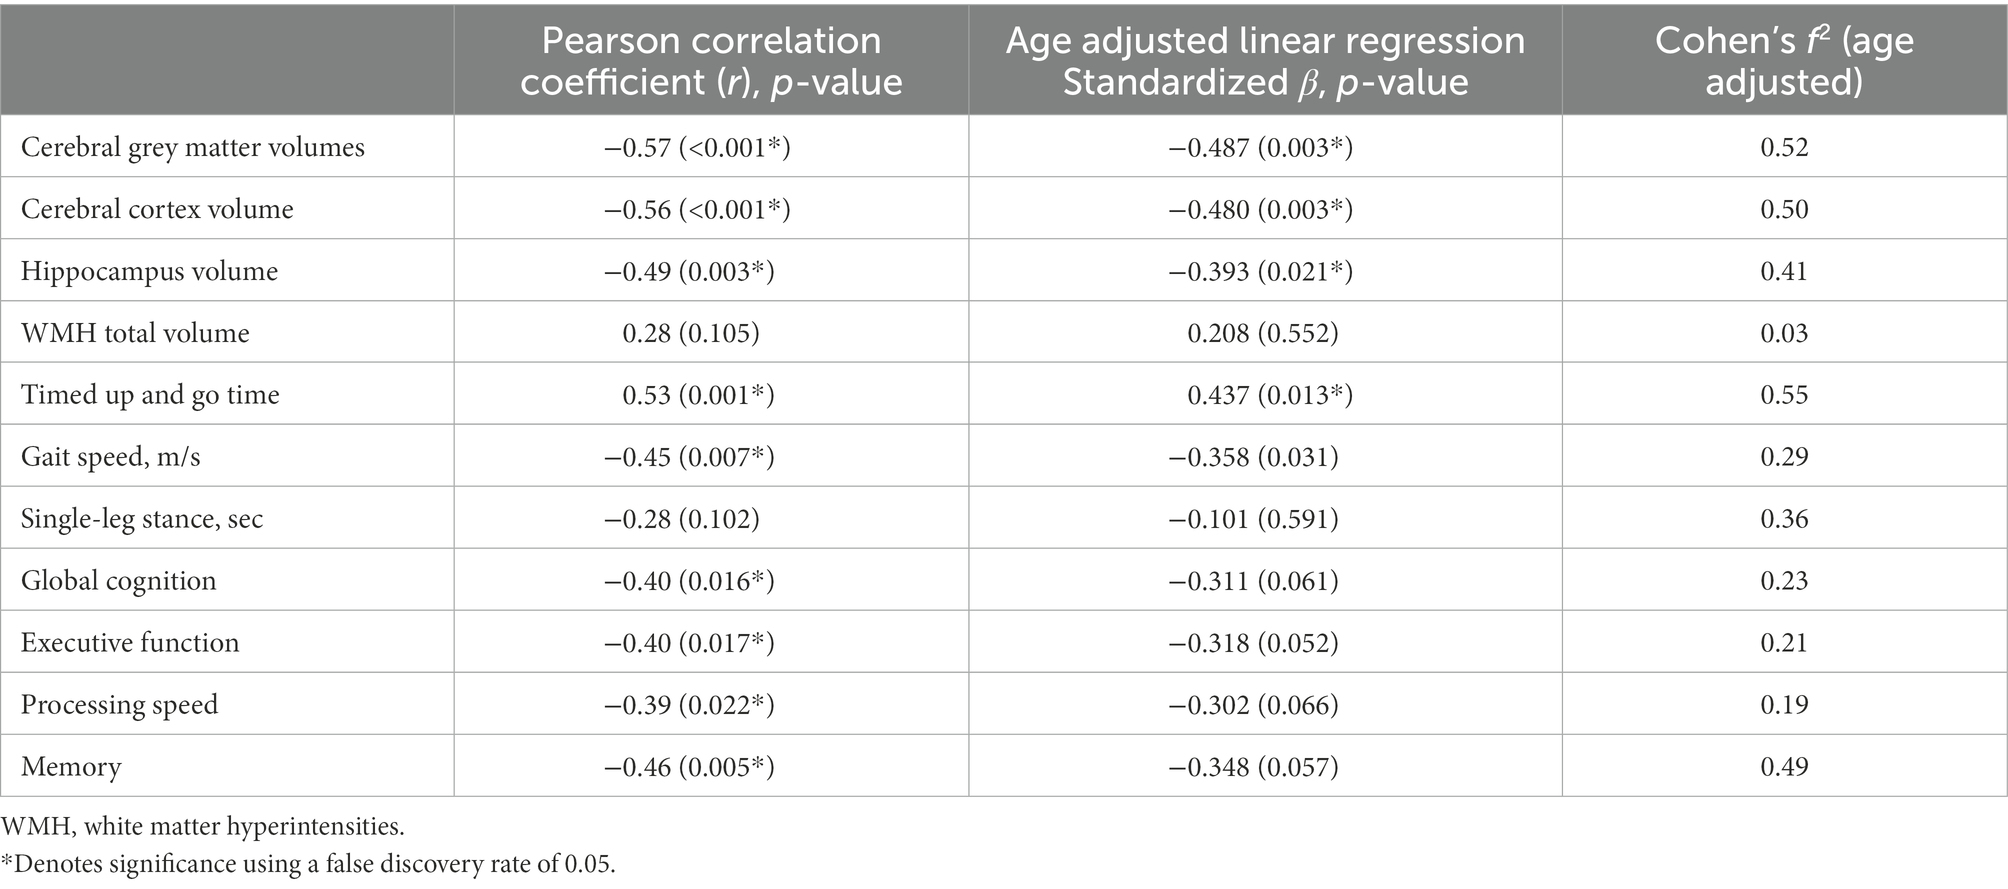
Table 2. Association between CSF NfL levels (independent variable) with brain volumes and WMH´-s on MRI and cognitive and motor results (dependent variables).
Results
CSF samples were collected from 35 subjects. The CSF NfL mean and median were 917.33 pg./ml and 819.06 pg./ml respectively, with a range of 450.48–793.74 pg./ml. CSF NfL correlated positively with subject’s age (r = 0.41, p = 0.016), but was not associated with sex (|t| = 1.21, p = 0.237).
CSF NfL did not correlate with BMI (CSF NfL r = −0.32, p = 0.065), nor were they associated with presence of diabetes (t-test for CSF NfL |t| = 0.902, p = 0.389) or hypertension (t-test for CSF NfL|t| = 1.62, p = 0.117).
A summary of the correlation tests of interest and their corresponding 95% confidence intervals (CIs) can be seen in Figure 1.
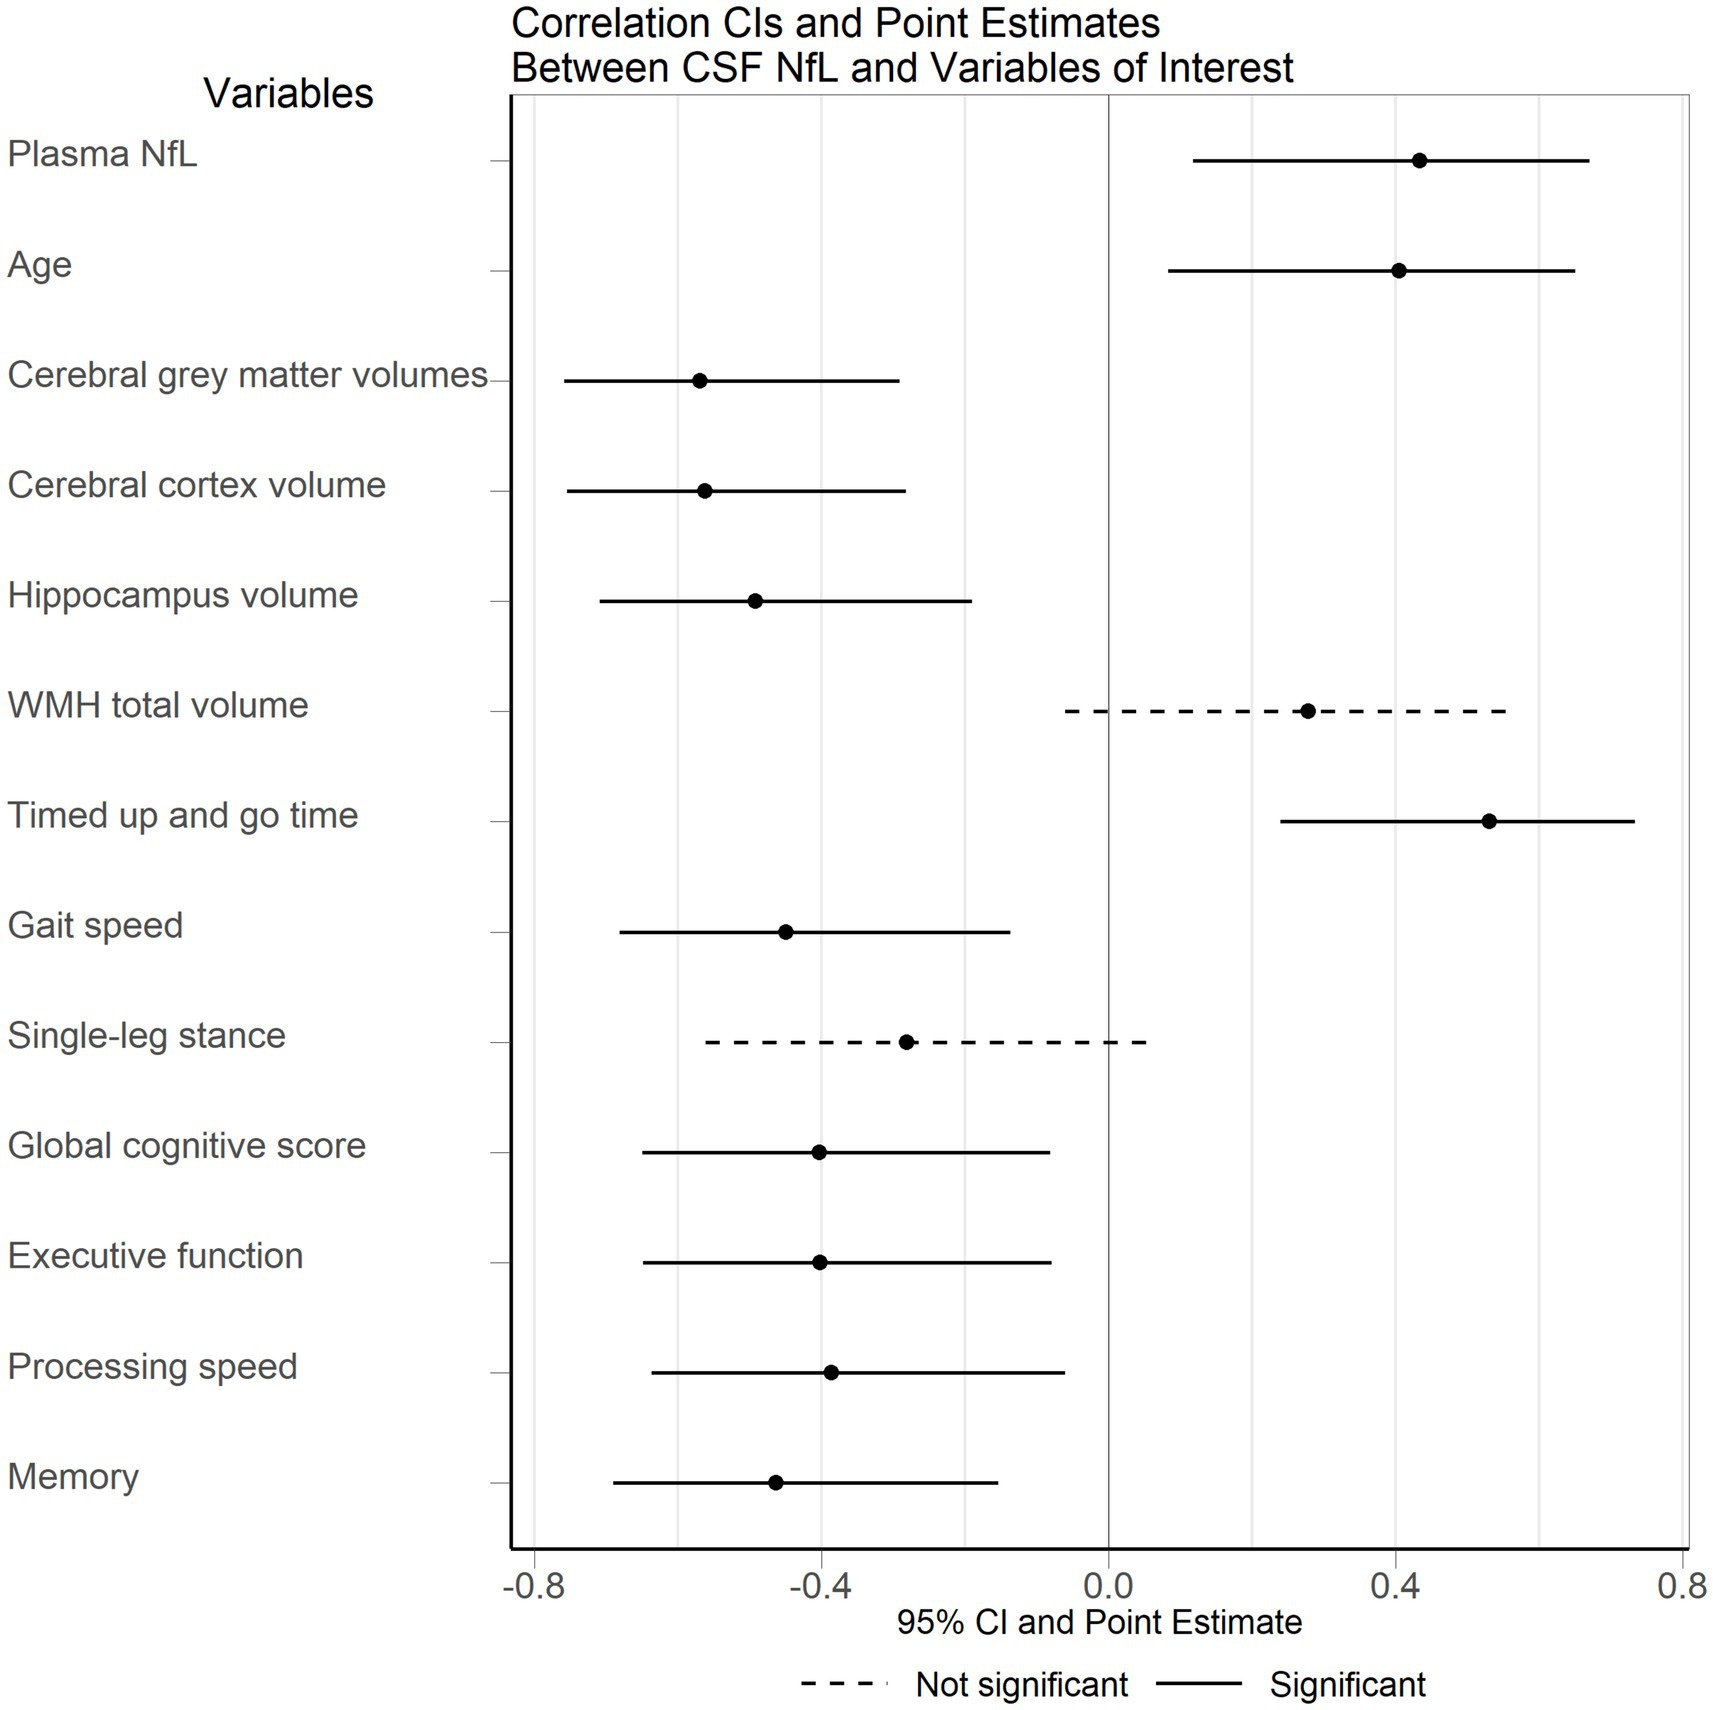
Figure 1. Correlation of CSF NfL with brain volumes and motor and cognitive results. CSF, cerebrospinal fluid; NfL, neurofilament light; WMH, white matter hyperintensities.
The mean of CSF Aβ1-42 in subjects group with no to mild WMH was 1278.99 pg./ml, and in group with moderate to severe WMH and 1264.65 pg./ml. The mean concentration of CSF t-tau were 202.41 pg./ml in group with no to mild WMH and 221.60 pg./ml in group with moderate to severe WMH; the mean CSF p-tau levels were 17.22 pg./ml in group with no to mild WMH and 19.17 pg./ml in group with moderate to severe WMH. There were no significant correlations with CSF NfL and other CSF (Aβ1-42, t-tau, p-tau) biomarkers.
NfL correlation to brain atrophy and WMH volumes
NfL was strongly correlated with volumes of cerebral grey matter (p < 0.001, r = − 0.57), cerebral cortex (p = 0.004, r = − 0.56) and hippocampi (p = 0.003, r = − 0.49), but not with total WMH volume (p = 0.105, r = 0.29) (Table 2). The difference between CSF NfL levels of subjects with no or mild and moderate to severe WMHs was not statistically significant (|t| = 1.61, p = 0.118).
Age adjusted linear regression analyses with CSF NfL as the explanatory variable confirmed that CSF NfL was highly associated with volumes of cerebral grey matter (standardized β = −0.487, p = 0.003, Cohen’s f2 = 0.52), cerebral cortex (standardized β = −0.480, p = 0.003, Cohen’s f2 = 0.50) and with hippocampal volumes (standardized β = −0.393, p = 0.021, Cohen’s f2 = 0.41) (Table 2).
NfL correlation to motor and cognitive performance
CSF NfL had a negative correlation with GCS (r = −0.40, p = 0.016). CSF NfL was also significantly correlated with executive function (r = − 0.40, p = 0.017), processing speed (r = − 0.39, p = 0.022) and memory (r = − 0.46, p = 0.005). However, after adjusting for age, the relationships between CSF NfL and GCS (standardized β = −0.311, p = 0.061, Cohen’s f2 = 0.23), executive function (standardized β = −0.318, p = 0.052, Cohen’s f2 = 0.21), processing speed (standardized β = −0.302, p = 0.066, Cohen’s f2 = 0.19), and memory (standardized β = −0.348, p = 0.0575, Cohen’s f2 = 0.49) were no longer significant despite medium to large effect sizes (Table 2).
Both TUG test and gait speed were associated with CSF NfL (Table 2). Pearson correlation for TUG test revealed that CSF NfL was positively correlated (r = 0.53, p = 0.001). Gait speed was negatively correlated with CSF NfL (r = − 0.45, p = 0.007). Single-leg stance test was not correlated with NfL. Similar results were found using age adjusted linear regression between CSF NfL and TUG tests (p = 0.013, Cohen’s f2 = 0.55), and gait speed (p = 0.031, Cohen’s f2 = 0.29), while no significant relationship was found for single-leg stance tests (standardized β = −0.101, p = 0.591, Cohen’s f2 = 0.36).
Discussion
In this study, NfL was not significantly associated with WMH volume. However, NfL correlated strongly with cerebral grey matter, cerebral cortex, and hippocampal volumes. Additionally, higher NfL levels were associated with impaired motor performance (functional mobility and gait speed). NfL was also related to impaired cognitive functions, which was partly explained by age.
In our analysis we used CSF NfL because much higher concentrations of NfL were found in CSF than in plasma. NfL first leaks into the extracellular space after neuronal damage, from there into CSF, and ultimately into the bloodstream. Plasma NfL level in our study (data not shown) showed the same correlations although somewhat weaker. NfL in plasma is a less sensitive marker than NfL in CSF. However, given that peripheral samples are far easier to access, plasma NfL can be a promising method in clinical practice.
Concerning the relation between NfL and WMH, our study differs from previous studies (Sjögren et al., 2001; Jonsson et al., 2010; Gattringer et al., 2017; Duering et al., 2018; Peters et al., 2020). A potential explanation is that, as has been suggested (Gattringer et al., 2017), NfL may mainly be a marker for active SVD with recent subcortical/lacunar infarcts more than a marker for chronic, slowly progressing changes like WMH. We have not evaluated the impact of infarcts due to the low frequency of lacunar infarcts in our sample.
Concerning the relation between NfL and brain atrophy in patients with varying degrees of WMH, we have not identified any previous studies to compare with, as previous studies have focused on MS and neurodegenerative disease.
In line with previous studies, we found an association between higher CSF NfL level and increasing age (Yilmaz et al., 2017; Khalil et al., 2020). CSF NfL was consistently correlated with cognitive function, although in age adjusted models the relationship did not quite reach significance. We can infer that age partly explains the relationship between NfL and cognitive function. In the age adjusted linear models, both cognitive and motor performance had effect sizes ranging from medium (GCS, executive function, processing speed, gait speed) to large (memory, TUG, single-leg stance) with respect to CSF NfL. It is probable that the reason for a lack of significance for some of the variables was the small sample size.
The relation between NfL and motor performance has been studied in MS (Allali et al., 2020), Parkinson disease (Aamodt et al., 2021; Ye et al., 2021) and in motoneuron disease, using Expanded Disability Status Scale, Unified Parkinson’s Disease Rating Scale and ALS Functional Rating Scale-revised, respectively (Vacchiano et al., 2021). The TUG and gait speed tests are easy to perform, and our study confirms that they are sensitive tools to evaluate neurologic disability caused by neuroaxonal damage.
Investigating other clinical factors, our results did not confirm the association between NfL and BMI, blood pressure, and blood glucose that has been indicated in some previous studies (Manouchehrinia et al., 2020; Sampedro et al., 2020).
The strengths of our study are the comprehensive evaluations of cognitive and motor abilities with objective well-validated tests and the quantification of brain changes with advanced automated image analysis (Jokinen et al., 2021). There are some limitations in this study. The sample size in this sub-study is relatively small and therefore it is necessary to further explore these results in larger cohorts. Another limitation is the lack of repeated CSF samples, which would give us the ability to follow up the laboratory parameters and better estimate the connection between laboratory biomarkers and possible neurodegeneration.
In conclusion, our study indicates that NfL level generally reflects neuroaxonal damage of CNS and neural death, neuroradiologically apparent as brain atrophy and clinically manifesting as a decline in motor performance. High levels of NfL suggest active neurodegeneration or ongoing axonal injury. Neither NfL nor brain atrophy are specific for any given disease, so potential comorbidity should be considered when interpreting NfL levels and brain atrophy in various neurological conditions.
Data availability statement
The raw data supporting the conclusions of this article will be made available by the authors, without undue reservation.
Ethics statement
The study was approved by the Ethics Committee of the HUS and conducted according to the Declaration of Helsinki. The patients/participants provided their written informed consent to participate in this study.
Author contributions
SM, HJ, MK, TE, HL, JP, MA, and JLe contributed to conception and design of the study. AK, JLö, and JKo performed the radiological and MRI analysis. JKa performed the statistical analysis. MK wrote the first draft of the manuscript. SM and HJ wrote sections of the manuscript. S-KH did the laboratory work. All authors contributed to manuscript revision, read, and approved the submitted version.
Conflict of interest
JKo and JLö are employed by Combinostics Ltd.
The remaining authors declare that the research was conducted in the absence of any commercial or financial relationships that could be construed as a potential conflict of interest.
Publisher’s note
All claims expressed in this article are solely those of the authors and do not necessarily represent those of their affiliated organizations, or those of the publisher, the editors and the reviewers. Any product that may be evaluated in this article, or claim that may be made by its manufacturer, is not guaranteed or endorsed by the publisher.
References
Aamodt, W. W., Waligorska, T., Shen, J., Tropea, T. F., Siderowf, A., Weintraub, D., et al. (2021). Neurofilament light chain as a biomarker for cognitive decline in Parkinson disease. Mov. Disord. Off. 36, 2945–2950. doi: 10.1002/mds.28779
Allali, G., Kuhle, J., Breville, G., Leppert, D., Armand, S., and Lalive, P. H. (2020). Serum neurofilament light chains in MS: association with the timed up and go. Neurol. Neuroimmunol. Neuroinflamm. 7:e895. doi: 10.1212/NXI.0000000000000895
Baezner, H., Blahak, C., Poggesi, A., Pantoni, L., Inzitari, D., Chabriat, H., et al. (2008). Association of gait and balance disorders with age-related white matter changes: the LADIS study. Neurology 70, 935–942. doi: 10.1212/01.wnl.0000305959.46197.e6
Barro, C., Benkert, P., Disanto, G., Tsagkas, C., Amann, M., Naegelin, Y., et al. (2018). Serum neurofilament as a predictor of disease worsening and brain and spinal cord atrophy in multiple sclerosis. Brain J. Neurol. 141, 2382–2391. doi: 10.1093/brain/awy154
Behzadi, A., Pujol-Calderón, F., Tjust, A. E., Wuolikainen, A., Höglund, K., Forsberg, K., et al. (2021). Neurofilaments can differentiate ALS subgroups and ALS from common diagnostic mimics. Sci. Rep. 11:22128. doi: 10.1038/s41598-021-01499-6
Benatar, M., Wuu, J., Andersen, P. M., Lombardi, V., and Malaspina, A. (2018). Neurofilament light: a candidate biomarker of presymptomatic amyotrophic lateral sclerosis and phenoconversion. Ann. Neurol. 84, 130–139. doi: 10.1002/ana.25276
Bittner, T., Zetterberg, H., Teunissen, C. E., Ostlund, R. E., Militello, M., Andreasson, U., et al. (2016). Technical performance of a novel, fully automated electrochemiluminescence immunoassay for the quantitation of β-amyloid (1-42) in human cerebrospinal fluid. Alzheim. Dement. J. Alzheim. Assoc. 12, 517–526. doi: 10.1016/j.jalz.2015.09.009
Buckner, R. L., Head, D., Parker, J., Fotenos, A. F., Marcus, D., Morris, J. C., et al. (2004). A unified approach for morphometric and functional data analysis in young, old, and demented adults using automated atlas-based head size normalization: reliability and validation against manual measurement of total intracranial volume. Neuro Image 23, 724–738. doi: 10.1016/j.neuroimage.2004.06.018
Byrne, L. M., Rodrigues, F. B., Blennow, K., Durr, A., Leavitt, B. R., Roos, R. A. C., et al. (2017). Neurofilament light protein in blood as a potential biomarker of neurodegeneration in Huntington’s disease: a retrospective cohort analysis. Lancet Neurol. 16, 601–609. doi: 10.1016/S1474-4422(17)30124-2
Dhiman, K., Gupta, V. B., Villemagne, V. L., Eratne, D., Graham, P. L., Fowler, C., et al. (2020). Cerebrospinal fluid neurofilament light concentration predicts brain atrophy and cognition in Alzheimer’s disease. Alzheim. Dement. Amst. Neth. 12:e12005. doi: 10.1002/dad2.12005
Duering, M., Konieczny, M. J., Tiedt, S., Baykara, E., Tuladhar, A. M., Peters, N., et al. (2018). Serum Neurofilament light chain levels are related to small vessel disease burden. J. Stroke 20, 228–238. doi: 10.5853/jos.2017.02565
Gaetani, L., Blennow, K., Calabresi, P., Di Filippo, M., Parnetti, L., and Zetterberg, H. (2019a). Neurofilament light chain as a biomarker in neurological disorders. J. Neurol. Neurosurg. Psychiatry 90, 870–881. doi: 10.1136/jnnp-2018-320106
Gaetani, L., Salvadori, N., Lisetti, V., Eusebi, P., Mancini, A., Gentili, L., et al. (2019b). Cerebrospinal fluid neurofilament light chain tracks cognitive impairment in multiple sclerosis. J. Neurol. 266, 2157–2163. doi: 10.1007/s00415-019-09398-7
Gattringer, T., Pinter, D., Enzinger, C., Seifert-Held, T., Kneihsl, M., Fandler, S., et al. (2017). Serum neurofilament light is sensitive to active cerebral small vessel disease. Neurology 89, 2108–2114. doi: 10.1212/WNL.0000000000004645
Jokinen, H., Laakso, H. M., Ahlström, M., Arola, A., Lempiäinen, J., Pitkänen, J., et al. (2021). Synergistic associations of cognitive and motor impairments with functional outcome in covert cerebral small vessel disease. Eur. J. Neurol. 29, 158–167. doi: 10.1111/ene.15108
Jonsson, M., Zetterberg, H., van Straaten, E., Lind, K., Syversen, S., Edman, A., et al. (2010). Cerebrospinal fluid biomarkers of white matter lesions - cross-sectional results from the LADIS study. Eur. J. Neurol. 17, 377–382. doi: 10.1111/j.1468-1331.2009.02808.x
Khalil, M., Pirpamer, L., Hofer, E., Voortman, M. M., Barro, C., Leppert, D., et al. (2020). Serum neurofilament light levels in normal aging and their association with morphologic brain changes. Nat. Commun. 11:812. doi: 10.1038/s41467-020-14612-6
Koikkalainen, J., Rhodius-Meester, H., Tolonen, A., Barkhof, F., Tijms, B., Lemstra, A. W., et al. (2016). Differential diagnosis of neurodegenerative diseases using structural MRI data. Neurol. Image Clin. 11, 435–449. doi: 10.1016/j.nicl.2016.02.019
Kuhle, J., Gosert, R., Bühler, R., Derfuss, T., Sutter, R., Yaldizli, O., et al. (2011). Management and outcome of CSF-JC virus PCR-negative PML in a natalizumab-treated patient with MS. Neurology 77, 2010–2016. doi: 10.1212/WNL.0b013e31823b9b27
Lifke, V., Kollmorgen, G., Manuilova, E., Oelschlaegel, T., Hillringhaus, L., Widmann, M., et al. (2019). Elecsys® Total-tau and Phospho-tau (181P) CSF assays: analytical performance of the novel, fully automated immunoassays for quantification of tau proteins in human cerebrospinal fluid. Clin. Biochem. 72, 30–38. doi: 10.1016/j.clinbiochem.2019.05.005
Lin, Y.-S., Lee, W.-J., Wang, S.-J., and Fuh, J.-L. (2018). Levels of plasma neurofilament light chain and cognitive function in patients with Alzheimer or Parkinson disease. Sci. Rep. 8:17368. doi: 10.1038/s41598-018-35766-w
Lin, C.-H., Li, C.-H., Yang, K.-C., Lin, F.-J., Wu, C.-C., Chieh, J.-J., et al. (2019). Blood NfL: a biomarker for disease severity and progression in Parkinson disease. Neurology 93, e1104–e1111. doi: 10.1212/WNL.0000000000008088
Lötjönen, J. M., Wolz, R., Koikkalainen, J. R., Thurfjell, L., Waldemar, G., Soininen, H., et al. (2010). Fast and robust multi-atlas segmentation of brain magnetic resonance images. Neuro Image 49, 2352–2365. doi: 10.1016/j.neuroimage.2009.10.026
Lu, C.-H., Macdonald-Wallis, C., Gray, E., Pearce, N., Petzold, A., Norgren, N., et al. (2015). Neurofilament light chain: a prognostic biomarker in amyotrophic lateral sclerosis. Neurology 84, 2247–2257. doi: 10.1212/WNL.0000000000001642
Manouchehrinia, A., Piehl, F., Hillert, J., Kuhle, J., Alfredsson, L., Olsson, T., et al. (2020). Confounding effect of blood volume and body mass index on blood neurofilament light chain levels. Ann. Clin. Transl. Neurol. 7, 139–143. doi: 10.1002/acn3.50972
Mattsson, N., Andreasson, U., Zetterberg, H., and Blennow, K. (2017). Alzheimer’s Disease Neuroimaging Initiative. Association of Plasma Neurofilament Light with Neurodegeneration in patients with Alzheimer disease. JAMA Neurol. 74, 557–566. doi: 10.1001/jamaneurol.2016.6117
Novakova, L., Zetterberg, H., Sundström, P., Axelsson, M., Khademi, M., Gunnarsson, M., et al. (2017). Monitoring disease activity in multiple sclerosis using serum neurofilament light protein. Neurology 89, 2230–2237. doi: 10.1212/WNL.0000000000004683
Olsson, B., Portelius, E., Cullen, N. C., Sandelius, Å., Zetterberg, H., Andreasson, U., et al. (2019). Association of Cerebrospinal Fluid Neurofilament Light Protein Levels with Cognition in patients with dementia, motor neuron disease, and movement disorders. JAMA Neurol. 76, 318–325. doi: 10.1001/jamaneurol.2018.3746
Pantoni, L., Basile, A. M., Pracucci, G., Asplund, K., Bogousslavsky, J., Chabriat, H., et al. (2005). Impact of age-related cerebral white matter changes on the transition to disability -- the LADIS study: rationale, design and methodology. Neuroepidemiology 24, 51–62. doi: 10.1159/000081050
Peters, N., van Leijsen, E., Tuladhar, A. M., Barro, C., Konieczny, M. J., Ewers, M., et al. (2020). Serum Neurofilament light chain is associated with incident lacunes in progressive cerebral small vessel disease. J. Stroke 22, 369–376. doi: 10.5853/jos.2019.02845
Plavina, T., Singh, C. M., Sangurdekar, D., de Moor, C., Engle, B., Gafson, A., et al. (2020). Association of Serum Neurofilament Light Levels with Long-term Brain Atrophy in patients with a first multiple sclerosis episode. JAMA Netw. Open 3:e2016278. doi: 10.1001/jamanetworkopen.2020.16278
Podsiadlo, D., and Richardson, S. (1991). The timed “up & go”: a test of basic functional mobility for frail elderly persons. J. Am. Geriatr. Soc. 39, 142–148. doi: 10.1111/j.1532-5415.1991.tb01616.x
Rohrer, J. D., Woollacott, I. O. C., Dick, K. M., Brotherhood, E., Gordon, E., Fellows, A., et al. (2016). Serum neurofilament light chain protein is a measure of disease intensity in frontotemporal dementia. Neurology 87, 1329–1336. doi: 10.1212/WNL.0000000000003154
Sampedro, F., Stantonyonge, N., Martínez-Horta, S., Alcolea, D., Lleó, A., Muñoz, L., et al. (2020). Increased plasma neurofilament light chain levels in patients with type-1 diabetes with impaired awareness of hypoglycemia. BMJ Open Diabetes Res. Care 8:e001516. doi: 10.1136/bmjdrc-2020-001516
Sjögren, M., Blomberg, M., Jonsson, M., Wahlund, L. O., Edman, A., Lind, K., et al. (2001). Neurofilament protein in cerebrospinal fluid: a marker of white matter changes. J. Neurosci. Res. 66, 510–516. doi: 10.1002/jnr.1242
Skillbäck, T., Farahmand, B., Bartlett, J. W., Rosén, C., Mattsson, N., Nägga, K., et al. (2014). CSF neurofilament light differs in neurodegenerative diseases and predicts severity and survival. Neurology 83, 1945–1953. doi: 10.1212/WNL.0000000000001015
Vacchiano, V., Mastrangelo, A., Zenesini, C., Masullo, M., Quadalti, C., Avoni, P., et al. (2021). Plasma and CSF Neurofilament light chain in amyotrophic lateral sclerosis: a cross-sectional and longitudinal study. Front. Aging Neurosci. 13:753242. doi: 10.3389/fnagi.2021.753242
Wardlaw, J. M., Smith, E. E., Biessels, G. J., Cordonnier, C., Fazekas, F., Frayne, R., et al. (2013). Neuroimaging standards for research into small vessel disease and its contribution to ageing and neurodegeneration. Lancet Neurol. 12, 822–838. doi: 10.1016/S1474-4422(13)70124-8
Wilson, D. H., Rissin, D. M., Kan, C. W., Fournier, D. R., Piech, T., Campbell, T. G., et al. (2016). The Simoa HD-1 analyzer: a novel fully automated digital immunoassay analyzer with single-molecule sensitivity and multiplexing. J. Lab. Autom. 21, 533–547. doi: 10.1177/2211068215589580
Ye, R., Locascio, J. J., Goodheart, A. E., Quan, M., Zhang, B., and Gomperts, S. N. (2021). Serum NFL levels predict progression of motor impairment and reduction in putamen dopamine transporter binding ratios in de novo Parkinson’s disease: an 8-year longitudinal study. Parkinsonism Relat. Disord. 85, 11–16. doi: 10.1016/j.parkreldis.2021.02.008
Yilmaz, A., Blennow, K., Hagberg, L., Nilsson, S., Price, R. W., Schouten, J., et al. (2017). Neurofilament light chain protein as a marker of neuronal injury: review of its use in HIV-1 infection and reference values for HIV-negative controls. Expert. Rev. Mol. Diagn. 17, 761–770. doi: 10.1080/14737159.2017.1341313
Zetterberg, H. (2016). Neurofilament light: a dynamic cross-disease fluid biomarker for neurodegeneration. Neuron 91, 1–3. doi: 10.1016/j.neuron.2016.06.030
Keywords: neurofilament light, small vessel disease, white matter hyperintensities, brain atrophy, motor performance, cognitive performance
Citation: Kartau M, Melkas S, Kartau J, Arola A, Laakso H, Pitkänen J, Lempiäinen J, Koikkalainen J, Lötjönen J, Korvenoja A, Ahlström M, Herukka S-K, Erkinjuntti T and Jokinen H (2023) Neurofilament light level correlates with brain atrophy, and cognitive and motor performance. Front. Aging Neurosci. 14:939155. doi: 10.3389/fnagi.2022.939155
Edited by:
Alessandro Martorana, University of Rome Tor Vergata, ItalyReviewed by:
Alison Jane Ellen Green, University of Edinburgh, United KingdomLaura Pasetto, Mario Negri Institute for Pharmacological Research (IRCCS), Italy
Copyright © 2023 Kartau, Melkas, Kartau, Arola, Laakso, Pitkänen, Lempiäinen, Koikkalainen, Lötjönen, Korvenoja, Ahlström, Herukka, Erkinjuntti and Jokinen. This is an open-access article distributed under the terms of the Creative Commons Attribution License (CC BY). The use, distribution or reproduction in other forums is permitted, provided the original author(s) and the copyright owner(s) are credited and that the original publication in this journal is cited, in accordance with accepted academic practice. No use, distribution or reproduction is permitted which does not comply with these terms.
*Correspondence: Marge Kartau, ✉ marge.kartau@hus.fi