 Fan He
 Yu-ming Zhou†
 Huan-huan Huang
 Yu-hang Cheng
- The National Clinical Research Center for Mental Disorders and Beijing Key Laboratory of Mental Disorders, Beijing Anding Hospital, Beijing Institute for Brain Disorders, Capital Medical University, Beijing, China
Childhood-onset schizophrenia (COS) is an unusual severe neurodevelopmental disorder of unknown etiology. In this study, we aimed to survey the missense variants in new cases of COS and also identify possible pathology biomarkers for COS. We found one list of mutated genes such as TTN, MUC12, and MUC2, which are the candidates to be involved in the etiology of COS. Next, we used WGSNA to predict COS disease-related genes and identified differential DNA methylation among COS disease groups, COS dangerous groups, and normal groups and found eight methylation sites that can be used as the diagnostic biomarkers. A total of six key genes are obtained through the intersection analysis between weighted correlation network analysis (WGCNA) mode, methylation-related genes, and differentially expressed genes (DGenes). These genes may play important roles in the progression of COS and serve as the potential biomarkers for future diagnosis. Our results might help to design the molecule or gene-targeted drugs for COS.
Introduction
Schizophrenia (SCZ) is a common and severe mental disorder, with a prevalence rate of about 1% in the general population (Weinberger, 1987; Kirilina et al., 2005). Approximately 1/7–1/3 of this disease begins in children and adolescents. It is estimated that about 13 million people in China suffer from the disease (Ran et al., 2003). Most adult schizophrenia can be traced back to childhood, in which the personality and developmental behavioral traits are different from those of the general population. In addition, the behavioral genetic theory shows that acquired behavior is closely related to genes, so schizophrenia may stem from childhood or earlier abnormalities even if it appears in adulthood (Addington and Rapoport, 2009). So, it makes sense to steer clear of the traditional model of schizophrenia studies focused on adults and instead focus on the specific group of people with childhood-onset schizophrenia (COS) (Wan et al., 2019; Zhang et al., 2020). Since schizophrenia has been described as a kind of disease more than a century ago, revealing that the etiology and pathology of the disease and seeking for effective diagnosis and treatment have been the hot issues concerned by psychiatric departments. Studies in China and abroad suggest that both genetic factors and environmental factors play an important role in the pathogenesis of schizophrenia, which may be caused by the interaction of gene mutation and epigenetic change. The research focusing on copy number variations (CNVs) and family-based relationship has revealed a few genetic variations of COS (Addington et al., 2005; Gornick et al., 2005).
The study of structural variations, such as the microdeletions and microduplications, has shown a higher CNV frequency in patients with COS compared with population controls and adult-onset patients (Awadalla et al., 2010; Ahn et al., 2014). Previous research in patients with schizophrenia found that the rate of de novo variants and the potentially harmful de novo single base pair variants is higher than expected (McKenna et al., 2010; Girard et al., 2011). Epigenetic modifications are thought to play a role in schizophrenia and other psychiatric diseases with development origins. Recent discovery shows that certain schizophrenia risk loci can affect random variation in gene expression through epigenetic processes. With the advanced development of sequencing techniques, a lot of valuable bioinformatic sources on COS are available from many public databases such as Gene Expression Omnibus (GEO) database and so on.
In this study, we analyzed the de novo rare variants in new COS cases by whole-exome sequencing (WES) and try to find out the probable COS candidate genes. To achieve this, we measured the rate of de novo variants (DNVs) and used weighted correlation network analysis (WGCNA) to construct a network of co-expressed genes, to describe the correlations among genes across multiple samples. We also checked differential DNA methylation between COS disease groups, COS dangerous groups, and normal groups.
Materials and Methods
Sample Overview
A total of 16 cases of COS and 22 cases of normal control children were defined by outpatient clinics or general psychiatric wards and recruited for exome sequencing. The mean age of onset was about 14 years (range, 4–18 years). None of these samples have been exome-sequenced previously. For methylation difference analysis, we used six cases in the disease group, six cases in the dangerous group, and six cases in the normal group (Table 1). The patients have given informed consent, and their anonymity was well preserved. The protocol for the research project has been approved by the Ethics Committee of Beijing Anding Hospital of Capital Medical University (no. 2016103FS-2), and it is conformed to the provisions of the Declaration of Helsinki. All patients and their guardians provided their written informed consent to participate in this study.
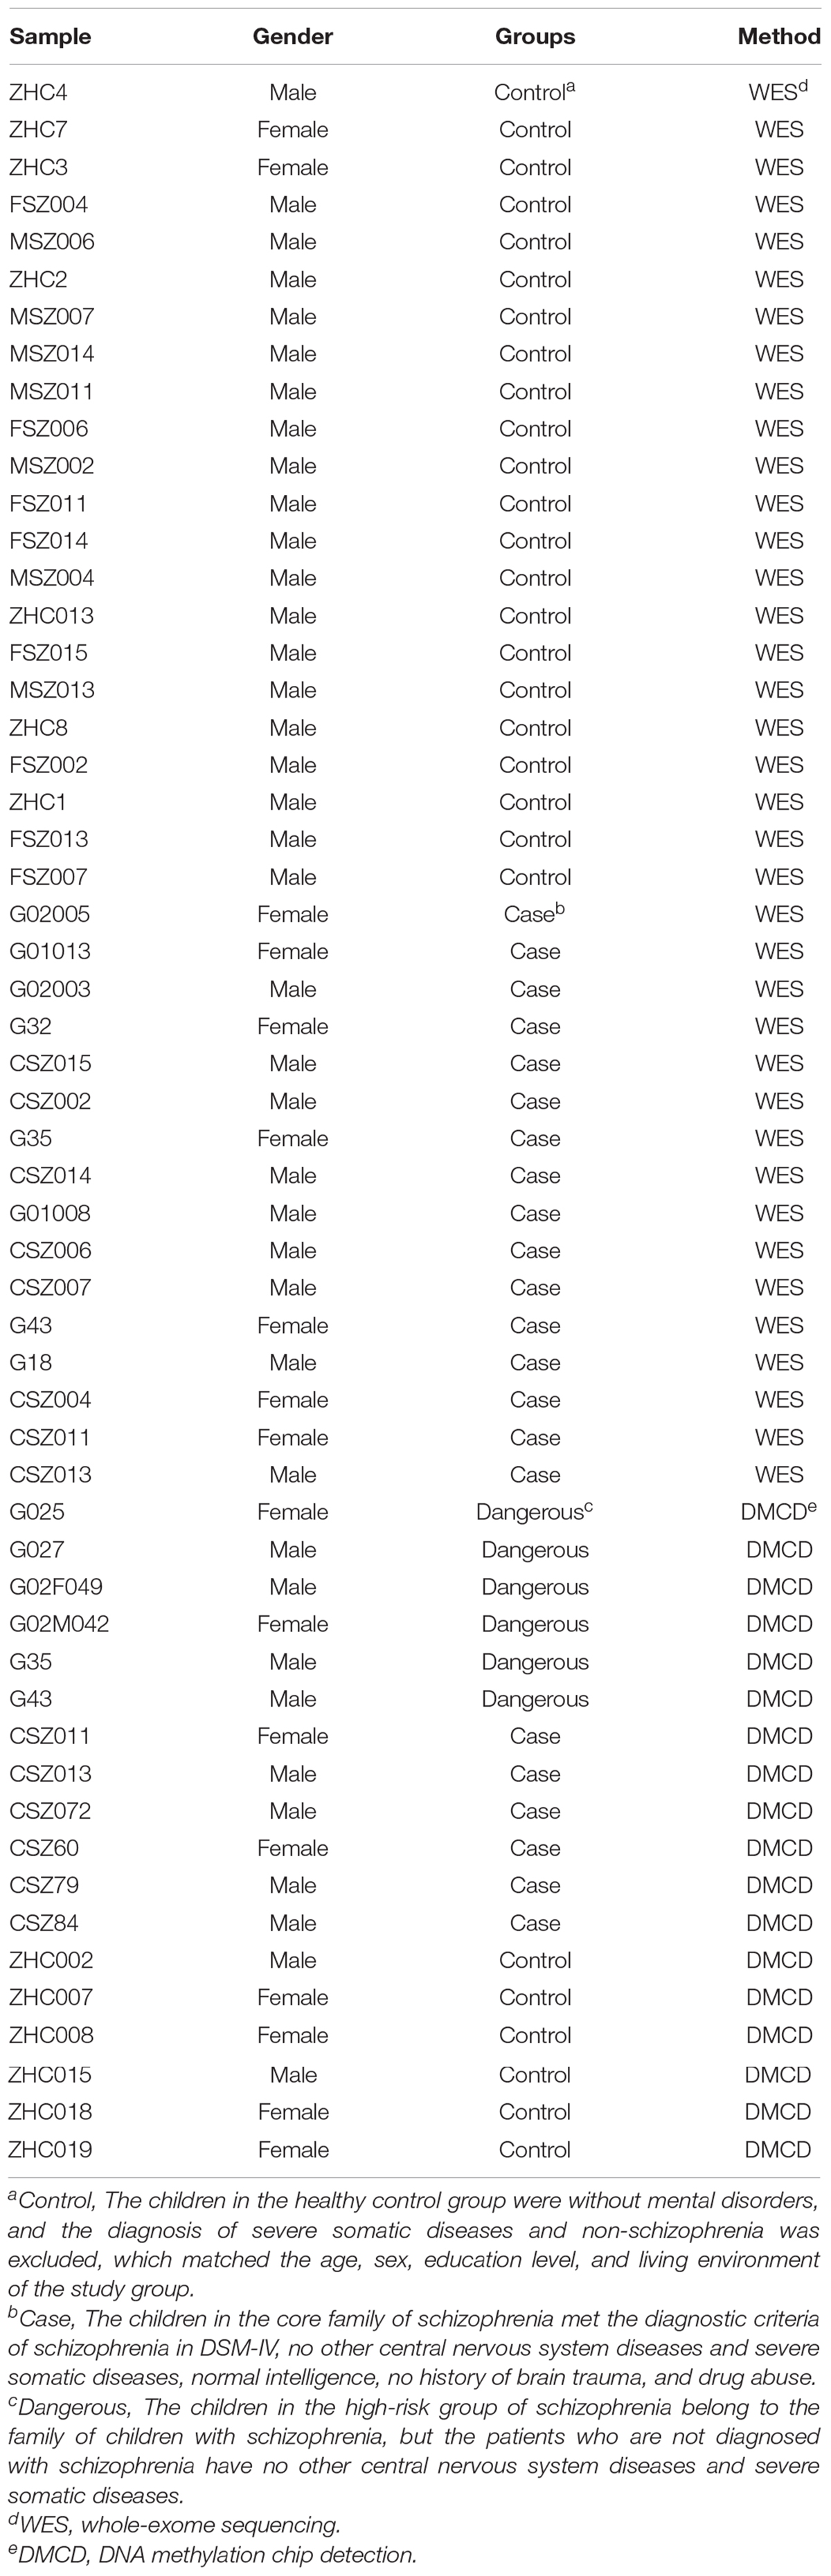
Table 1. Included clinical data and test grouping.
Whole-Exome Sequencing
Exome sequencing was carried out on 38 individuals in the COS cases and performed using SureSelectXT Human All Exon kit V6 (Agilent Technologies, CA, United States). Exome sequence was generated using Illumina HiSeq 2000 in the Genesky Technology company, China. Raw sequencing reads were processed according to the genome analysis toolkit (GATK1) best practice guidelines (DePristo et al., 2011; Kakati et al., 2019). Reads were aligned to the human Reference GRCh37.p5 Primary Assembly using the Burrow-Wheeler Aligner (BWA2) v0.7.15. Variants were called using GATK haplotype caller (v3.5) and filtered using the GATK variant quality score recalibration tool, VQSR. For all samples that passed quality control, sequence data were generated for a median of 83% of the exome target at ≥10 × coverage.
Acquisition of Somatic Mutation Data by Maftools
Maftools is an R package published on bioconductor and used specifically for the visualization of information in Mutation Annotation Format (MAF) files. We prepared the MAF of somatic variants and carried out the Maftools to perform the visualization process.
Gene Expression Omnibus Data Source
We used the keyword ‘‘COS’’ during searching the Gene Expression Omnibus (GEO) database.3 The datasets were generated under the following criteria: (1) the datasets contain samples from both normal and patients with COS with necessary clinical features; (2) datasets demonstrate the original expression profiles from microarray that had been corrected and standardized; (3) datasets have enough samples for further analysis. The dataset was selected with GSE19112 using as datasets.
Weighted Correlation Network Analysis
We used the bioinformatic tool WGCNA to construct the expression patterns of genes from multiple samples and generate the clusters of genes having similar expression patterns by Bioconductor.4 It helps the researcher to analyze the correlations between modules and specific phenotypes or features (Langfelder and Horvath, 2008). The soft threshold method was used for expression profiles’ Pearson correlation analysis. In addition, the connection strengths were determined between transcripts to construct the weighted network. We conducted average linkage hierarchical clustering to group transcripts by topological overlap dissimilarity in network connection strengths. To get the correct module number and clarify the gene interaction, we set the limited minimum gene number to 30 of each module and used the 0.25 threshold to merge similar modules.
Functional and Pathway Enrichment Analysis
Database for annotation visualization and integration discovery (David) (V6.8)5 was used to better understand their biological functions. Interested genes were uploaded for Gene Ontology (GO) and Kyoto Encyclopedia of Genes and Genomes (KEGG) pathway enrichment analyses, with cutoff values of p < 0.01 and p < 0.05 established for significant biological processes and pathways, respectively.
Protein-Protein Interaction Network and Co-expression Analysis
Interested genes were uploaded to the search tool for the retrieval of interacting genes (STRING) (v11.5)6 database. Confidence was set to more than 0.4, and other parameters were set to default. We visualized the gene co-expression network with Cytoscape (v3.73).
Results
Landscape of Mutation Profiles in Childhood-Onset Schizophrenia
First, the statistics of the diverse mutation types at the sample and gene levels were performed. We carried out the whole-exome sequencing on 38 patients with COS. The results derived from the mutation data with VCF format are visualized by the “maftools” package. Briefly, these mutations are further separated into eight categories based on their impact on protein coding. Among them, the missense mutation accounts for the largest proportion (Figure 1A), single-nucleotide polymorphism (SNP) occurred more frequently than insertion (INS) or deletion (DEl) (Figure 1B). In addition, C > T type was the most common in SNV, which is divided into six categories when considering the combination of mutations in COS (Figure 1C). In addition, we calculated the number of altered bases per sample and displayed the mutation types in diverse colors in the box plot for COS, related to the eight types in Figure 1A and with an average of 866.5 variants in each sample (Figures 1D,E). Finally, we displayed the top 10 mutated genes in COS with ranked percentages, including TTN (87%), MUC12 (82%), MUC2 (97%), VSTM1 (89%), TRIM61 (97%), NEB (76%), PRR23D1 (95%), ANKLE1 (79%), BAGE (92%), and C5 (74%) (Figure 1F). Oncoplot displayed the mutation information of the top 10 most mutated genes in 38 samples, and the different colors with annotations at the bottom stand for the different mutation types (Figure 1G).
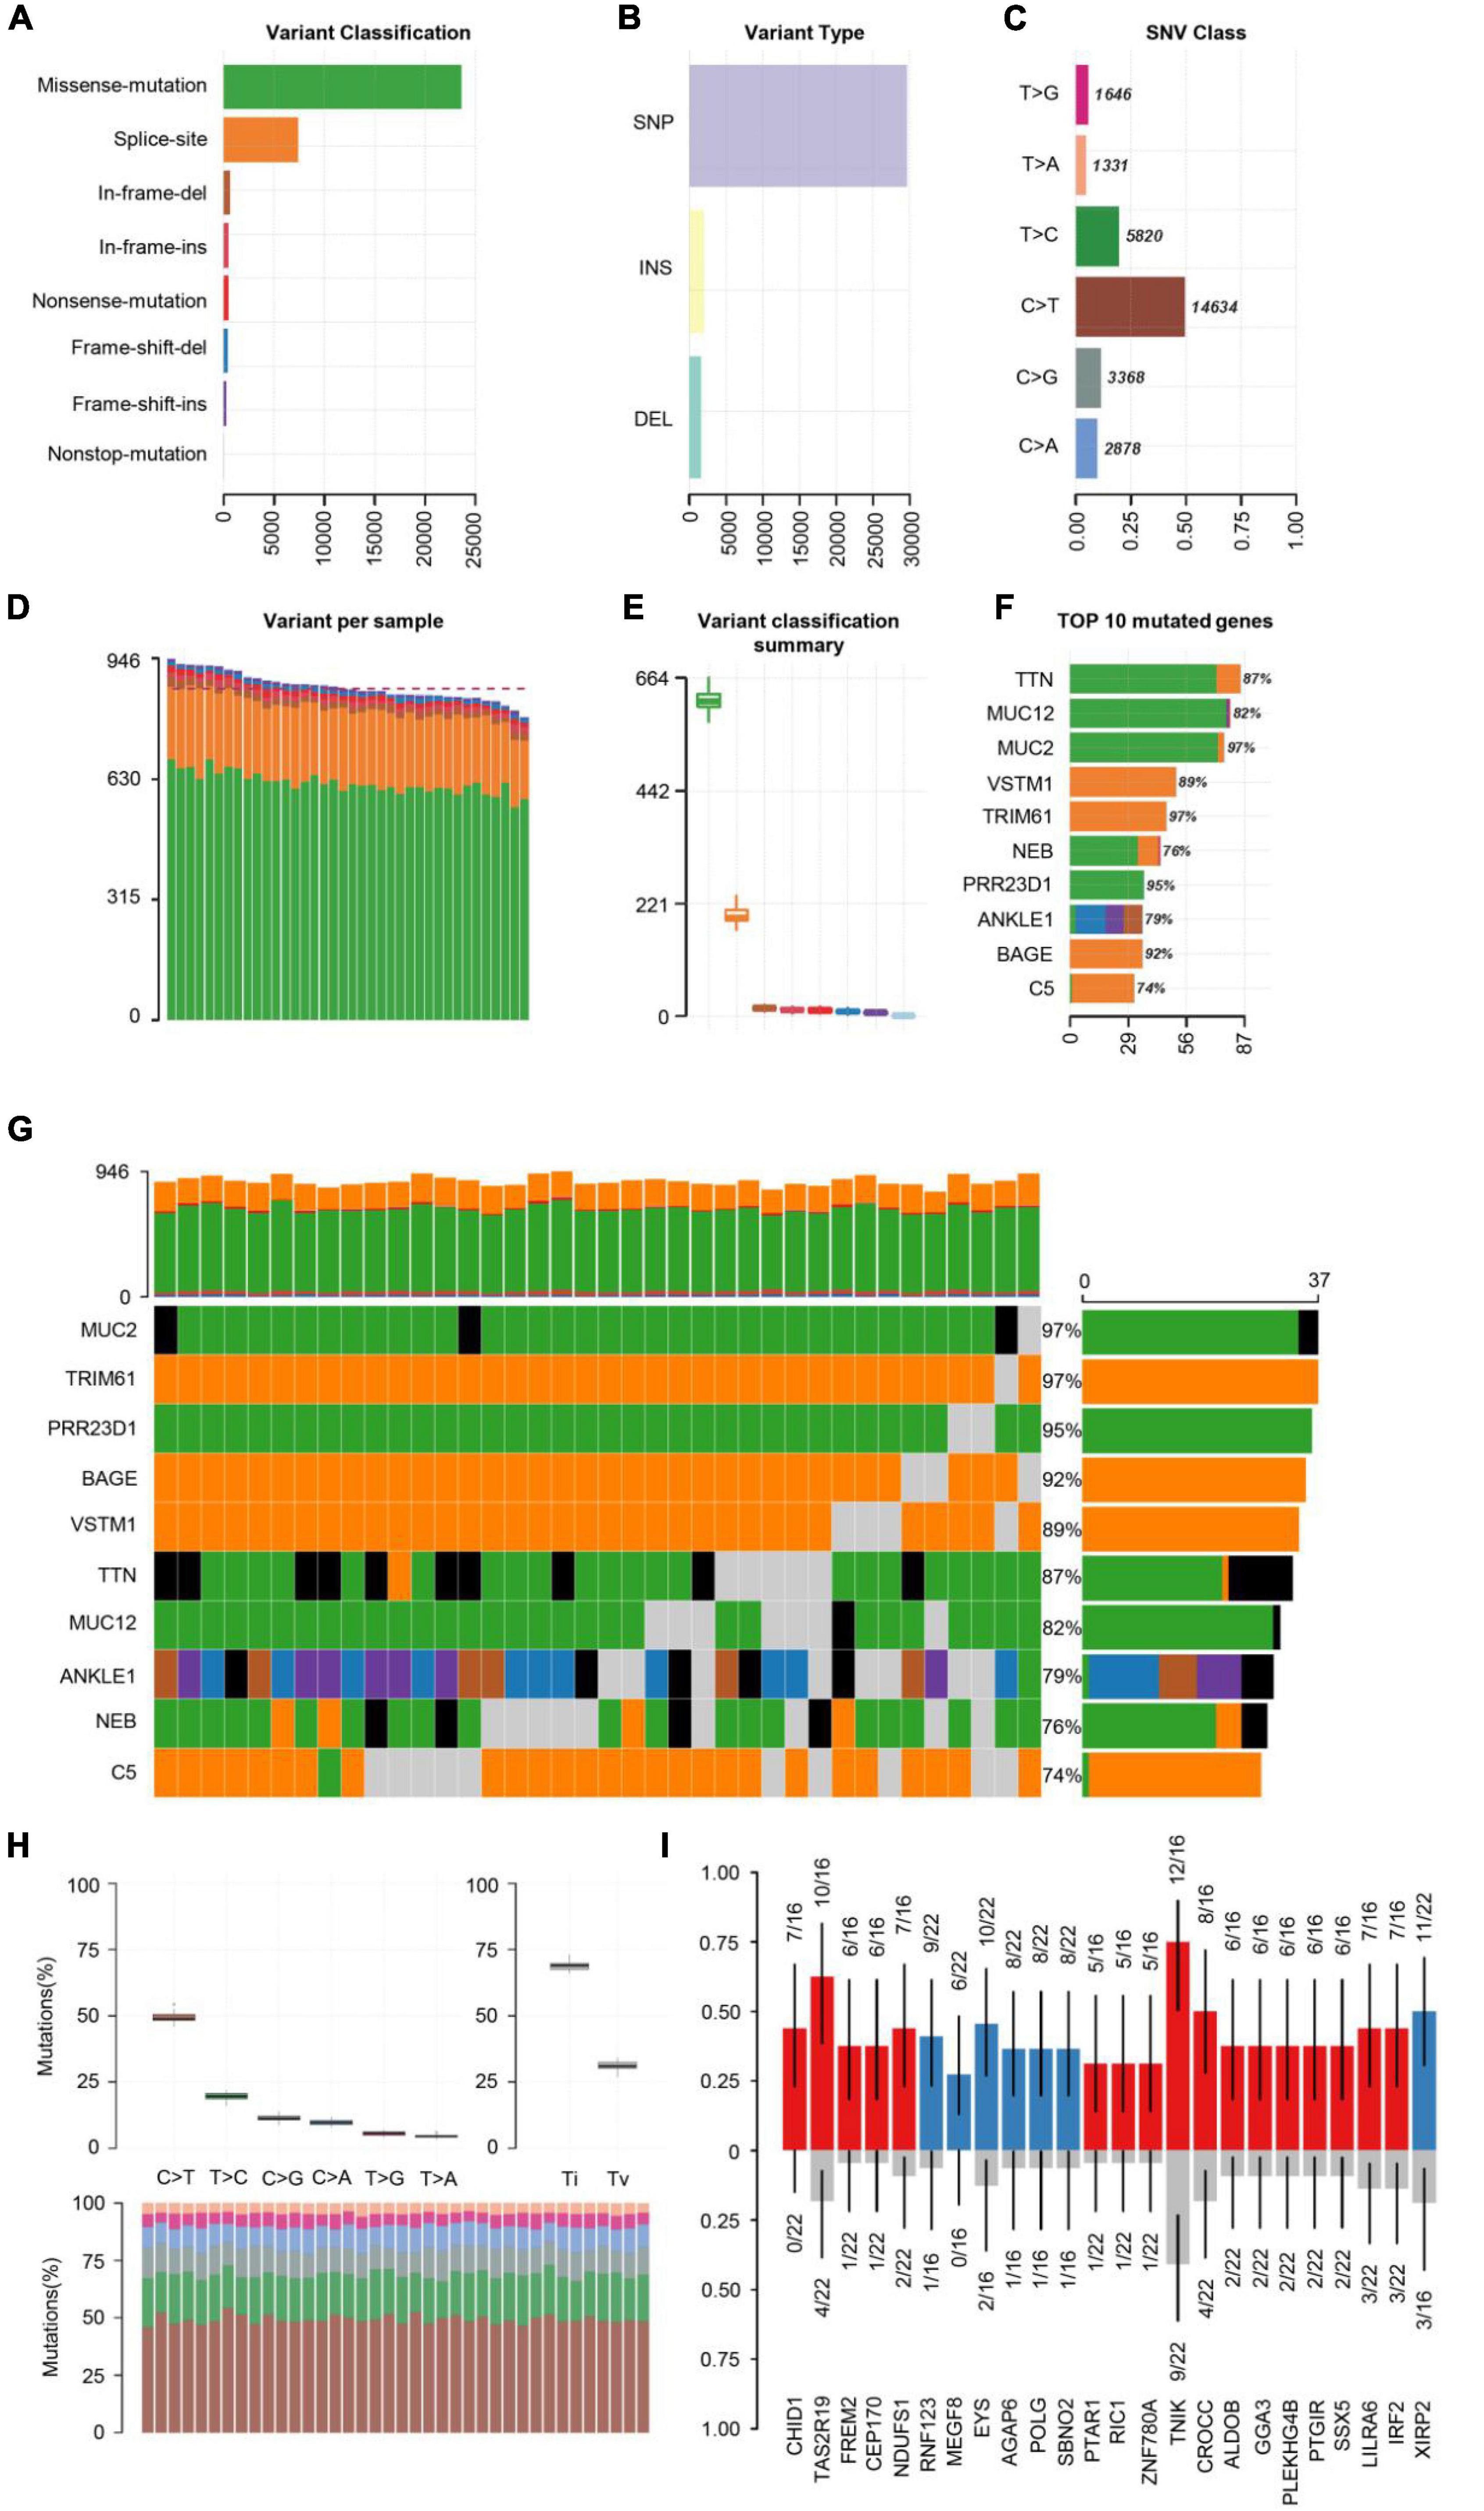
Figure 1. Summary of visualized results of the mutation information by statistical calculations. (A) Histogram of the different mutation types’ frequency distribution. The mutation types are classified according to different categories, among which missense mutations account for the largest proportion. (B) The frequency distribution of different variant types is divided into three categories: SNP, INS, and DEl. SNP is shown with more frequency. (C) The frequency distribution of SNV mutation types is divided into six categories. C > T is the most common in SNV. (D) Stacked histograms of different types of variation in each sample. (E) Box plot of the distribution of different mutation types per sample. (F) Stacked histogram of different types of mutation on the top 10 mutated genes with the highest mutation frequency. (G) Oncoplot of the top 10 most frequently mutated genes in COS samples, displaying the distribution of various mutation types in each sample. Each column represents a sample, and each row represents a gene. Mutated genes were shown in colored squares, and no mutated genes were shown in gray squares. (H) The transition and crosscut diagrams explain the distribution of SNV in COS with six crosscut and transition events. The mutation spectrum distribution of each sample is shown in the stacked bar graph (bottom). (I) The box plots of different allele frequencies between control and cases analyzed by Plotting VAF. Blue represents the number of control samples, red represents the number of disease samples, and gray represents no mutation.
Previous research has shown that exploring somatic mutations helps to discover the occurrence and development of schizophrenia (Nishioka et al., 2019). We analyzed the mutation frequency of 10 key genes, with varying degrees of mutation. The plot of transition divides single nuclear variants (SNV) into six categories (Figure 1H). C > T mutation accounted for almost 50% of the total mutations among them. Next, we screened the new key genes which may be related to COS. The box plots showed different allele frequencies analyzed by plotting variant allele frequency (VAF), which helps to quickly estimate the cloning status of top mutant genes (Figure 1I).
Childhood-Onset Schizophrenia-Related Weighted Correlation Network Analysis Modules and Genes
Then, we analyzed the gene expression in COS cases. In October 2020, we downloaded the GSE19112 gene expression data set obtained from donors with or without COS from GEO and selected the GPL version of the dataset with the largest number of disease samples for further analysis. A total of 76 samples of the dataset GSE19112, 38 patient samples and 38 normal samples, are selected for WGCNA screening of potential genes.
All genes involved in the GEO dataset have passed WGCNA. The top 25% of genes with the largest variance were preserved for following WGCNA analysis, which ultimately included 1,360 genes and 76 samples. The scale independence was set to be 0.85, and the soft threshold power of matrix transformation was verified to be six for network analysis. The mean connectivity of the co-expression network was high to make sure a scale-free network (Figure 2A). We constructed the co-expression modules and identified seven modules related to COS, which were arbitrarily designated blue (190 genes), brown (176 genes), green (64 genes), gray (32 genes), red (45 genes), turquoise (779 genes), and yellow (74 genes) (Figure 2B). The most common clinical features of COS were selected and linked to gene expression modules founded on the associations between the clinical traits of common expression pattern modules and the eigengenes. The turquoise (r = 0.83, p = 4e-20) and red modules (r = −0.61, p = 3e-09) are closely related to the type (Figure 2C).
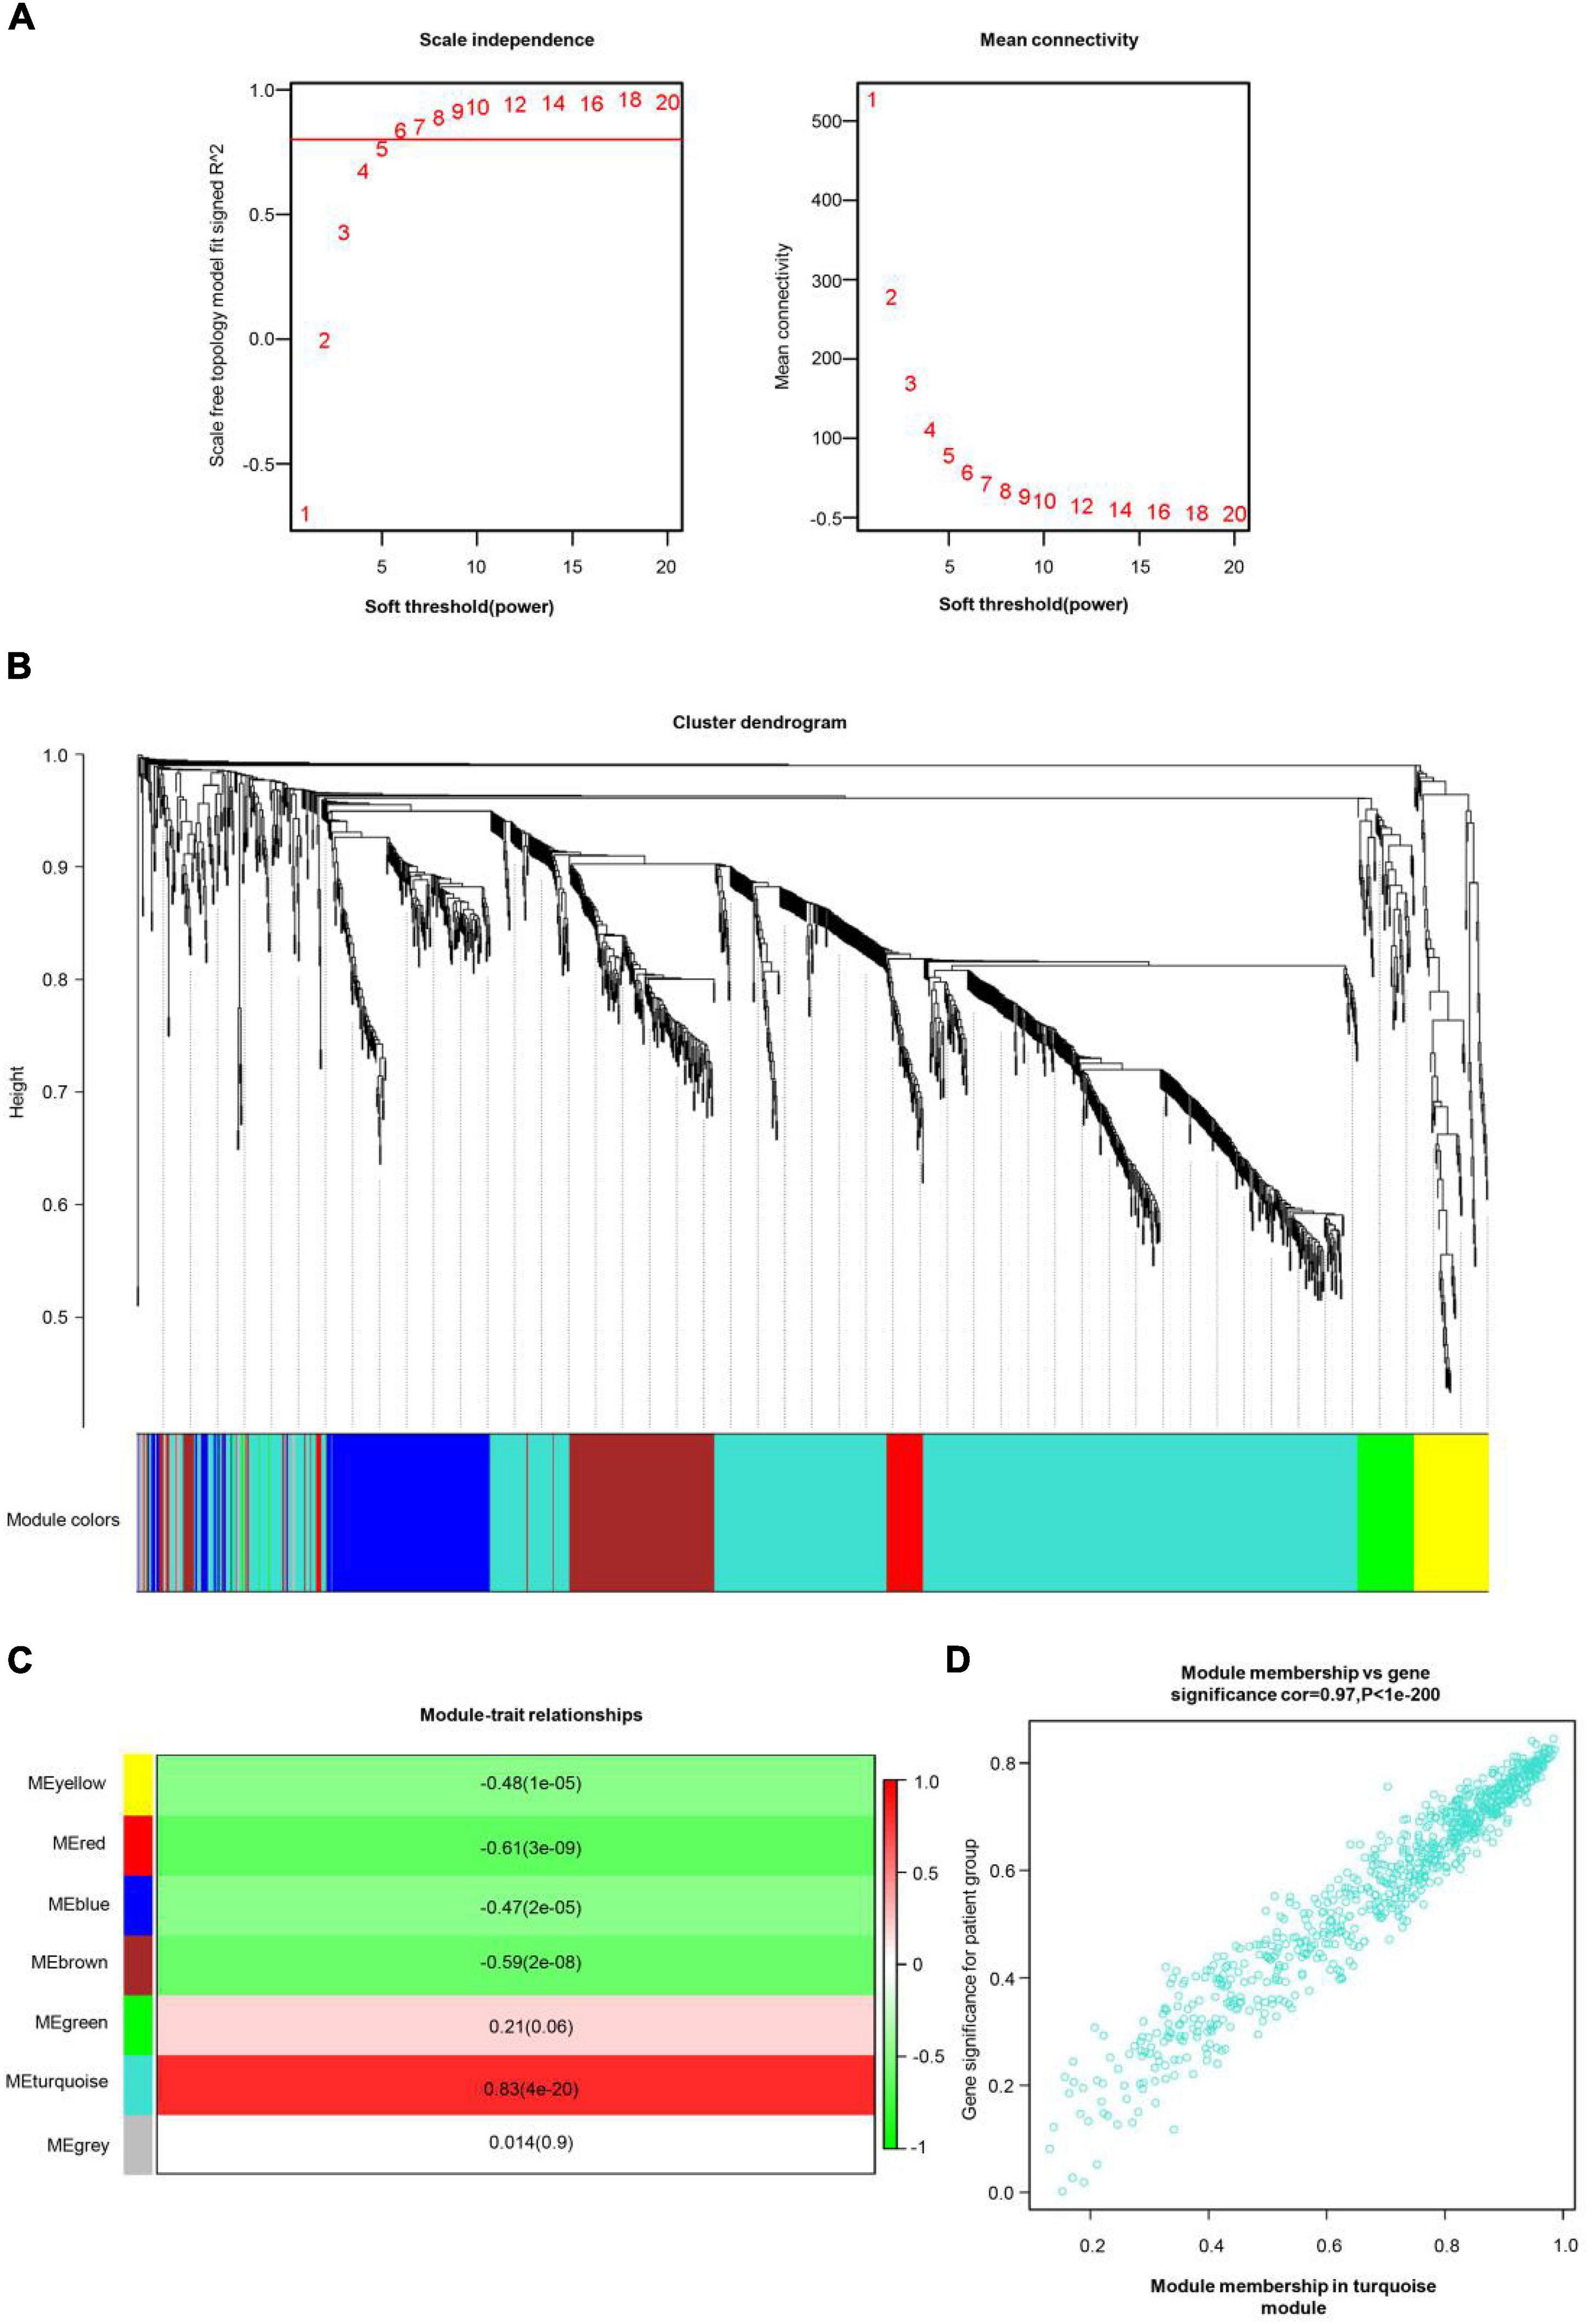
Figure 2. COS-related WGCNA modules and genes. (A) The scale independence shown in scale-free topology fit index analysis of soft threshold power (β). The red line represents the correlation coefficient (0.85). Right: Mean connectivity of gene co-expression modules with different soft threshold powers. (B) The identification of co-expression module in COS. The branches of the cluster dendrogram symbolized seven gene modules. On the cluster dendrogram, every piece of the leaves corresponds to a diverse gene module. (C) The correlation between clinical traits and gene modules was represented by the correlation coefficient in each cell. The most positively and negatively relevant modules were the turquoise and the red, respectively. (D) Scatter plot of gene significance (GS) vs. module membership (MM) in the turquoise module.
Then, the scatter plots of gene significance vs. module membership for the turquoise modules were constructed (Figure 2D). It indicated that gene significance for patient group and module membership in turquoise module are positively correlated, cor = 0.97, p < 1e-200.
WGSNA Predicts the Intersection of Childhood-Onset Schizophrenia Disease-Related Genes and Differential Genes
Then, GEO GSE19112 data were used for differential expression analysis using ANOVA. A total of 752 significantly differentially expressed genes (DEGs) were identified with cutoff values of p < 0.001 and | log2(fold-change) | > 1 (Figure 3A), including 351 upregulated genes and 401 downregulated genes. Next, the ME turquoise gene set was screened by WGSNA above, and the differential genes were intersected and used for GO enrichment analysis. These DEGs were mainly involved in the pathological progress of COS (Figures 3B,C). The most important KEGG pathway terms showed that DEGs were mainly enriched in human papillomavirus infection, wnt signaling pathway, and PI3K-Akt signaling pathway. Considering the BP criterion, DEGs were mainly rich in BPs related to the regulation of cell–cell signaling by wnt and wnt signaling pathway. Considering the CC criterion, the DEGs were mainly enriched in adherens junction. Considering the MF criterion, the DEGs were mainly rich in cell adhesion molecule binding and protein serine–threonine kinase activity.
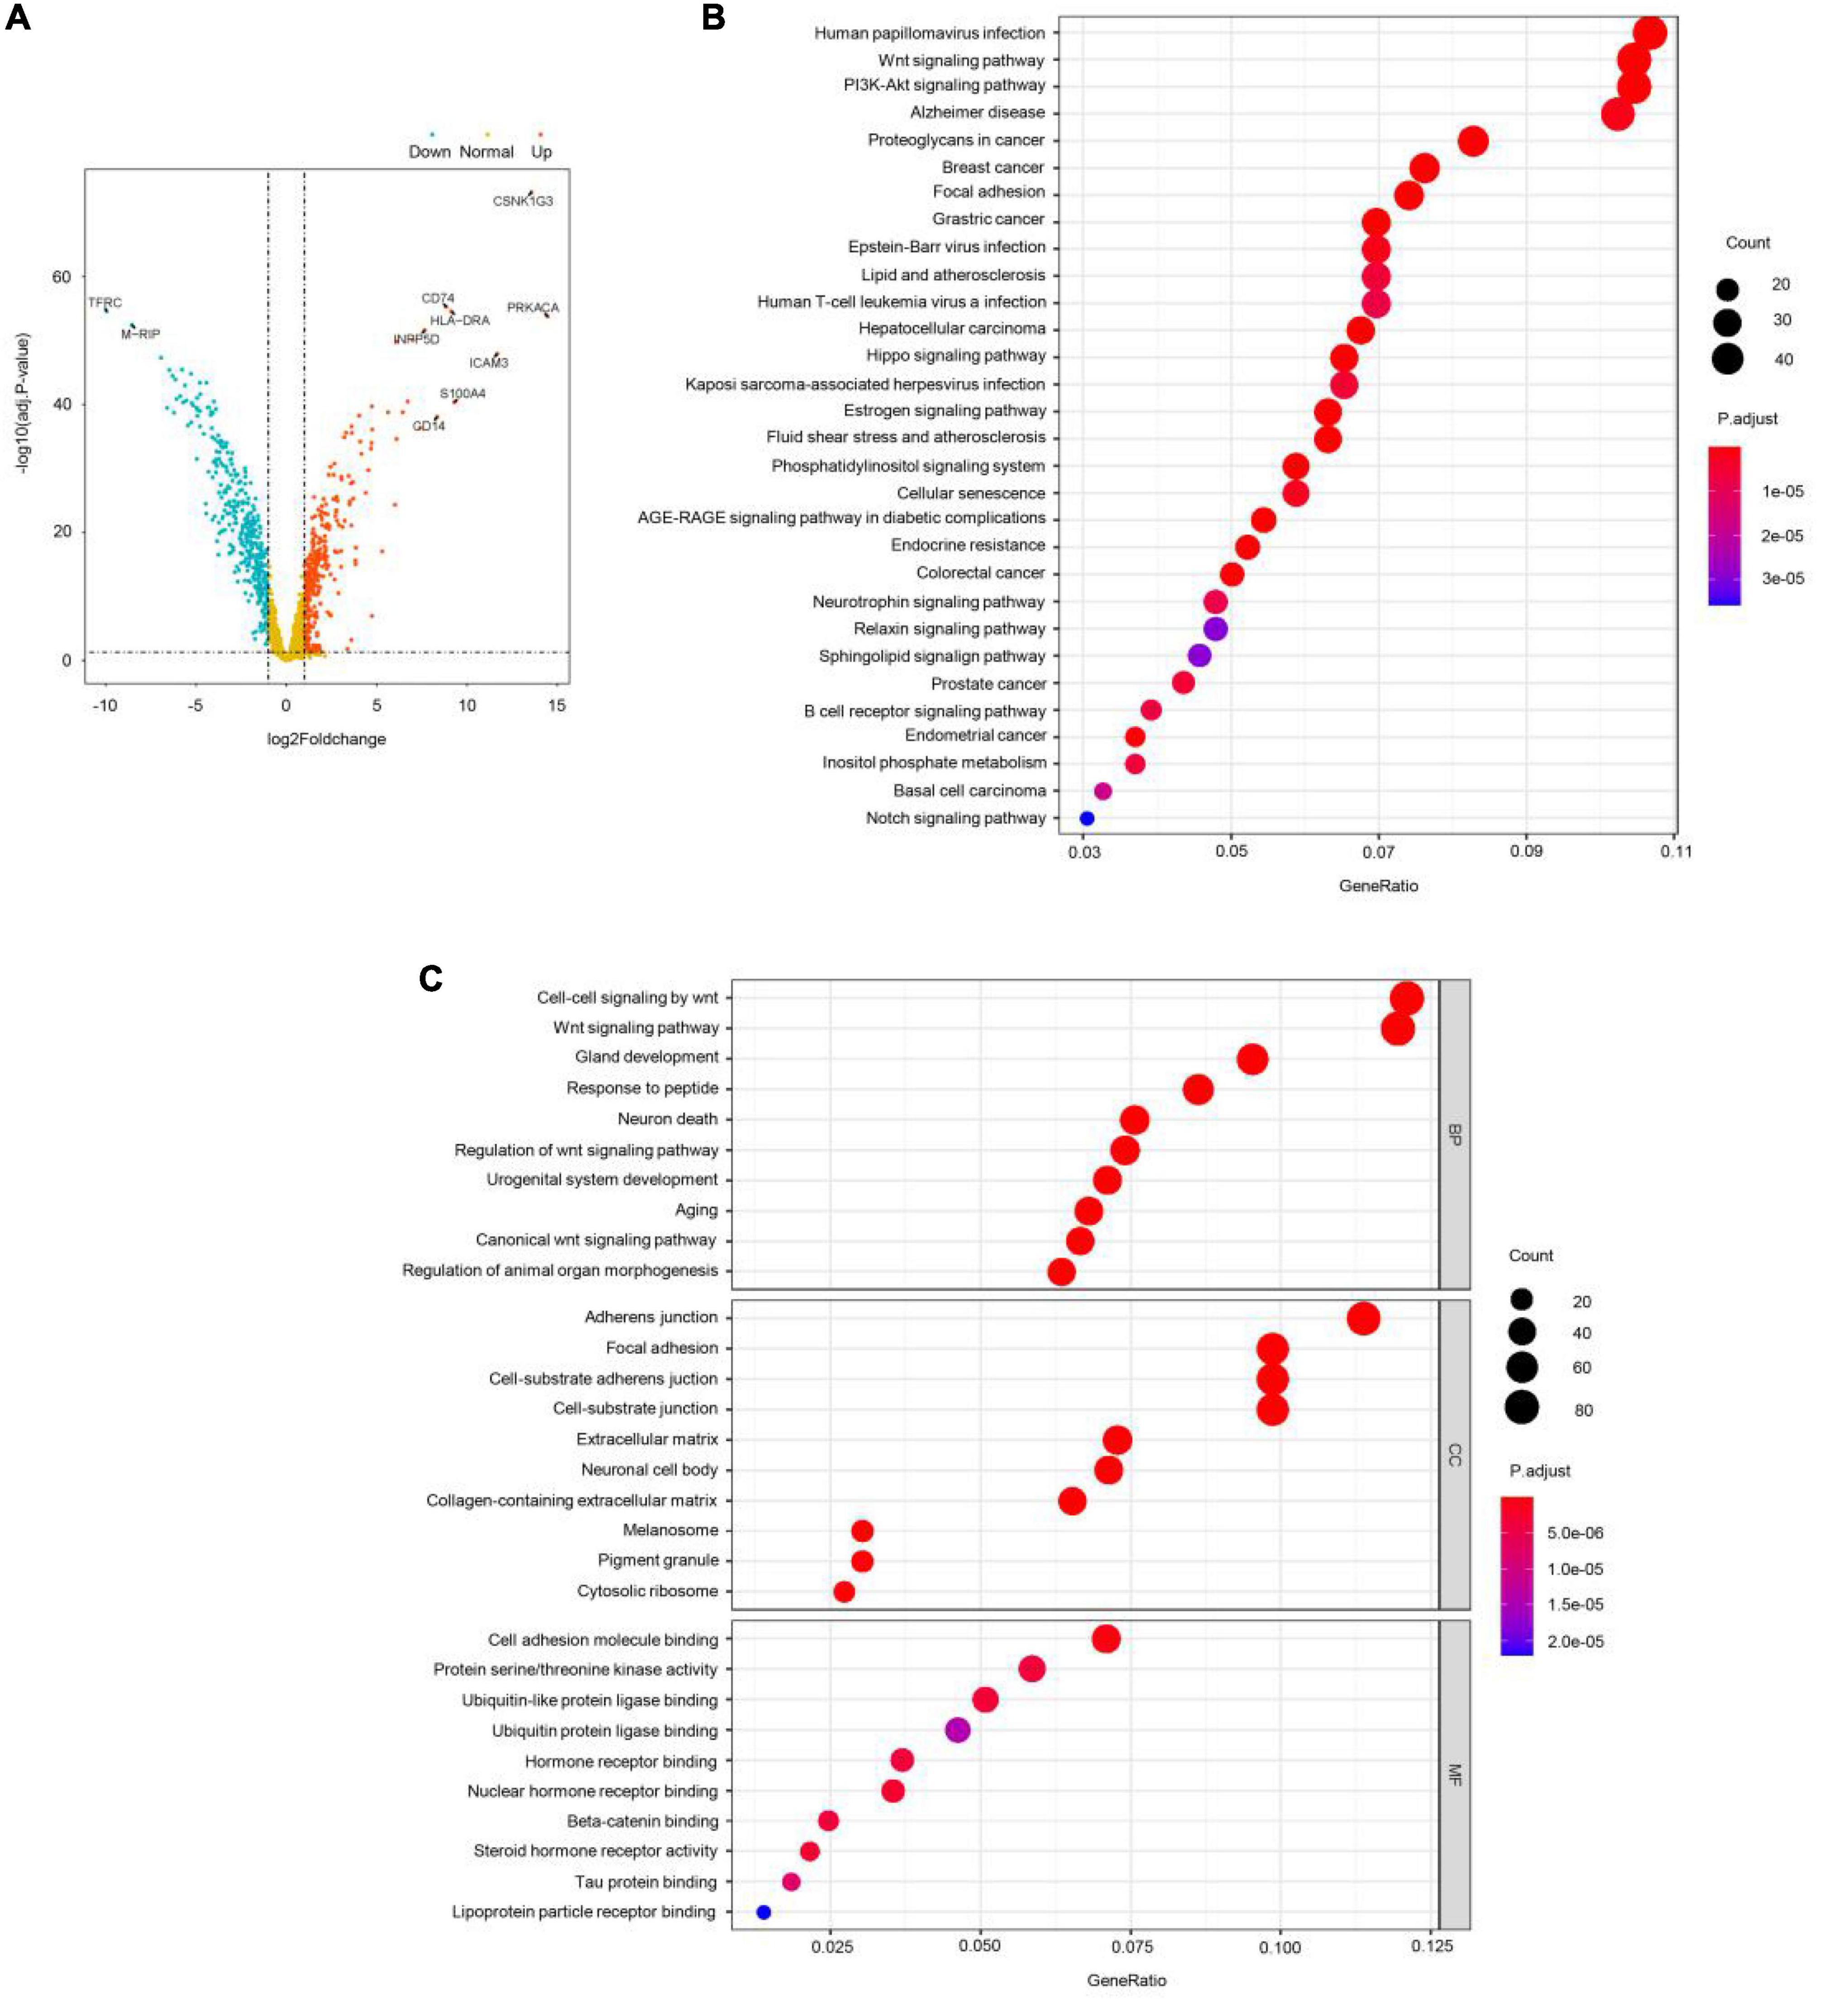
Figure 3. WGSNA predicts the intersection of COS disease-related genes and differential genes. (A) X-axis represents log2 fold-changes and Y-axis represents the negative logarithm of the p-value to the base 20. Black vertical and horizontal dashed lines reflected the filtering criteria (FC = ±1 and p-value = 0.001). (B,C) Gene Ontology (GO) enrichment annotations, Kyoto Encyclopedia of Genes and Genomes (KEGG) pathway analysis of the pathological progression of WGSNA predicted the COS disease-related genes and differential genes intersection genes. Significantly enriched pathways featured p < 0.001. The analysis was conducted using R clusterProfiler.
Identification of Differential Methylation Sites
We also performed genome-wide DNA methylation profiling and the differential DNA methylation analysis in COS cases. Differential analysis of methylation sites in disease samples compared with normal led to the identification of 52 differential methylation sites, named disease vs. normal, including 27 upregulated and 25 downregulated sites. On the other hand, analysis in dangerous samples compared with normal led to the identification of 49 differential methylation sites (named dangerous vs. normal, including 20 upregulated and 29 downregulated sites). Analysis in disease samples compared with dangerous led to the identification of 48 differential methylation sites (named disease vs. dangerous, including 24 upregulated and 24 downregulated sites). We selected significantly upregulated and downregulated methylation sites to plot their differentially degree patterns on volcano plots and heatmaps (Figures 4A–F). Next, we made the intersection analysis between disease vs. normal, dangerous vs. normal, and disease vs. dangerous groups and got eight differential methylation sites, which are used as the key research objects (Figure 4G).
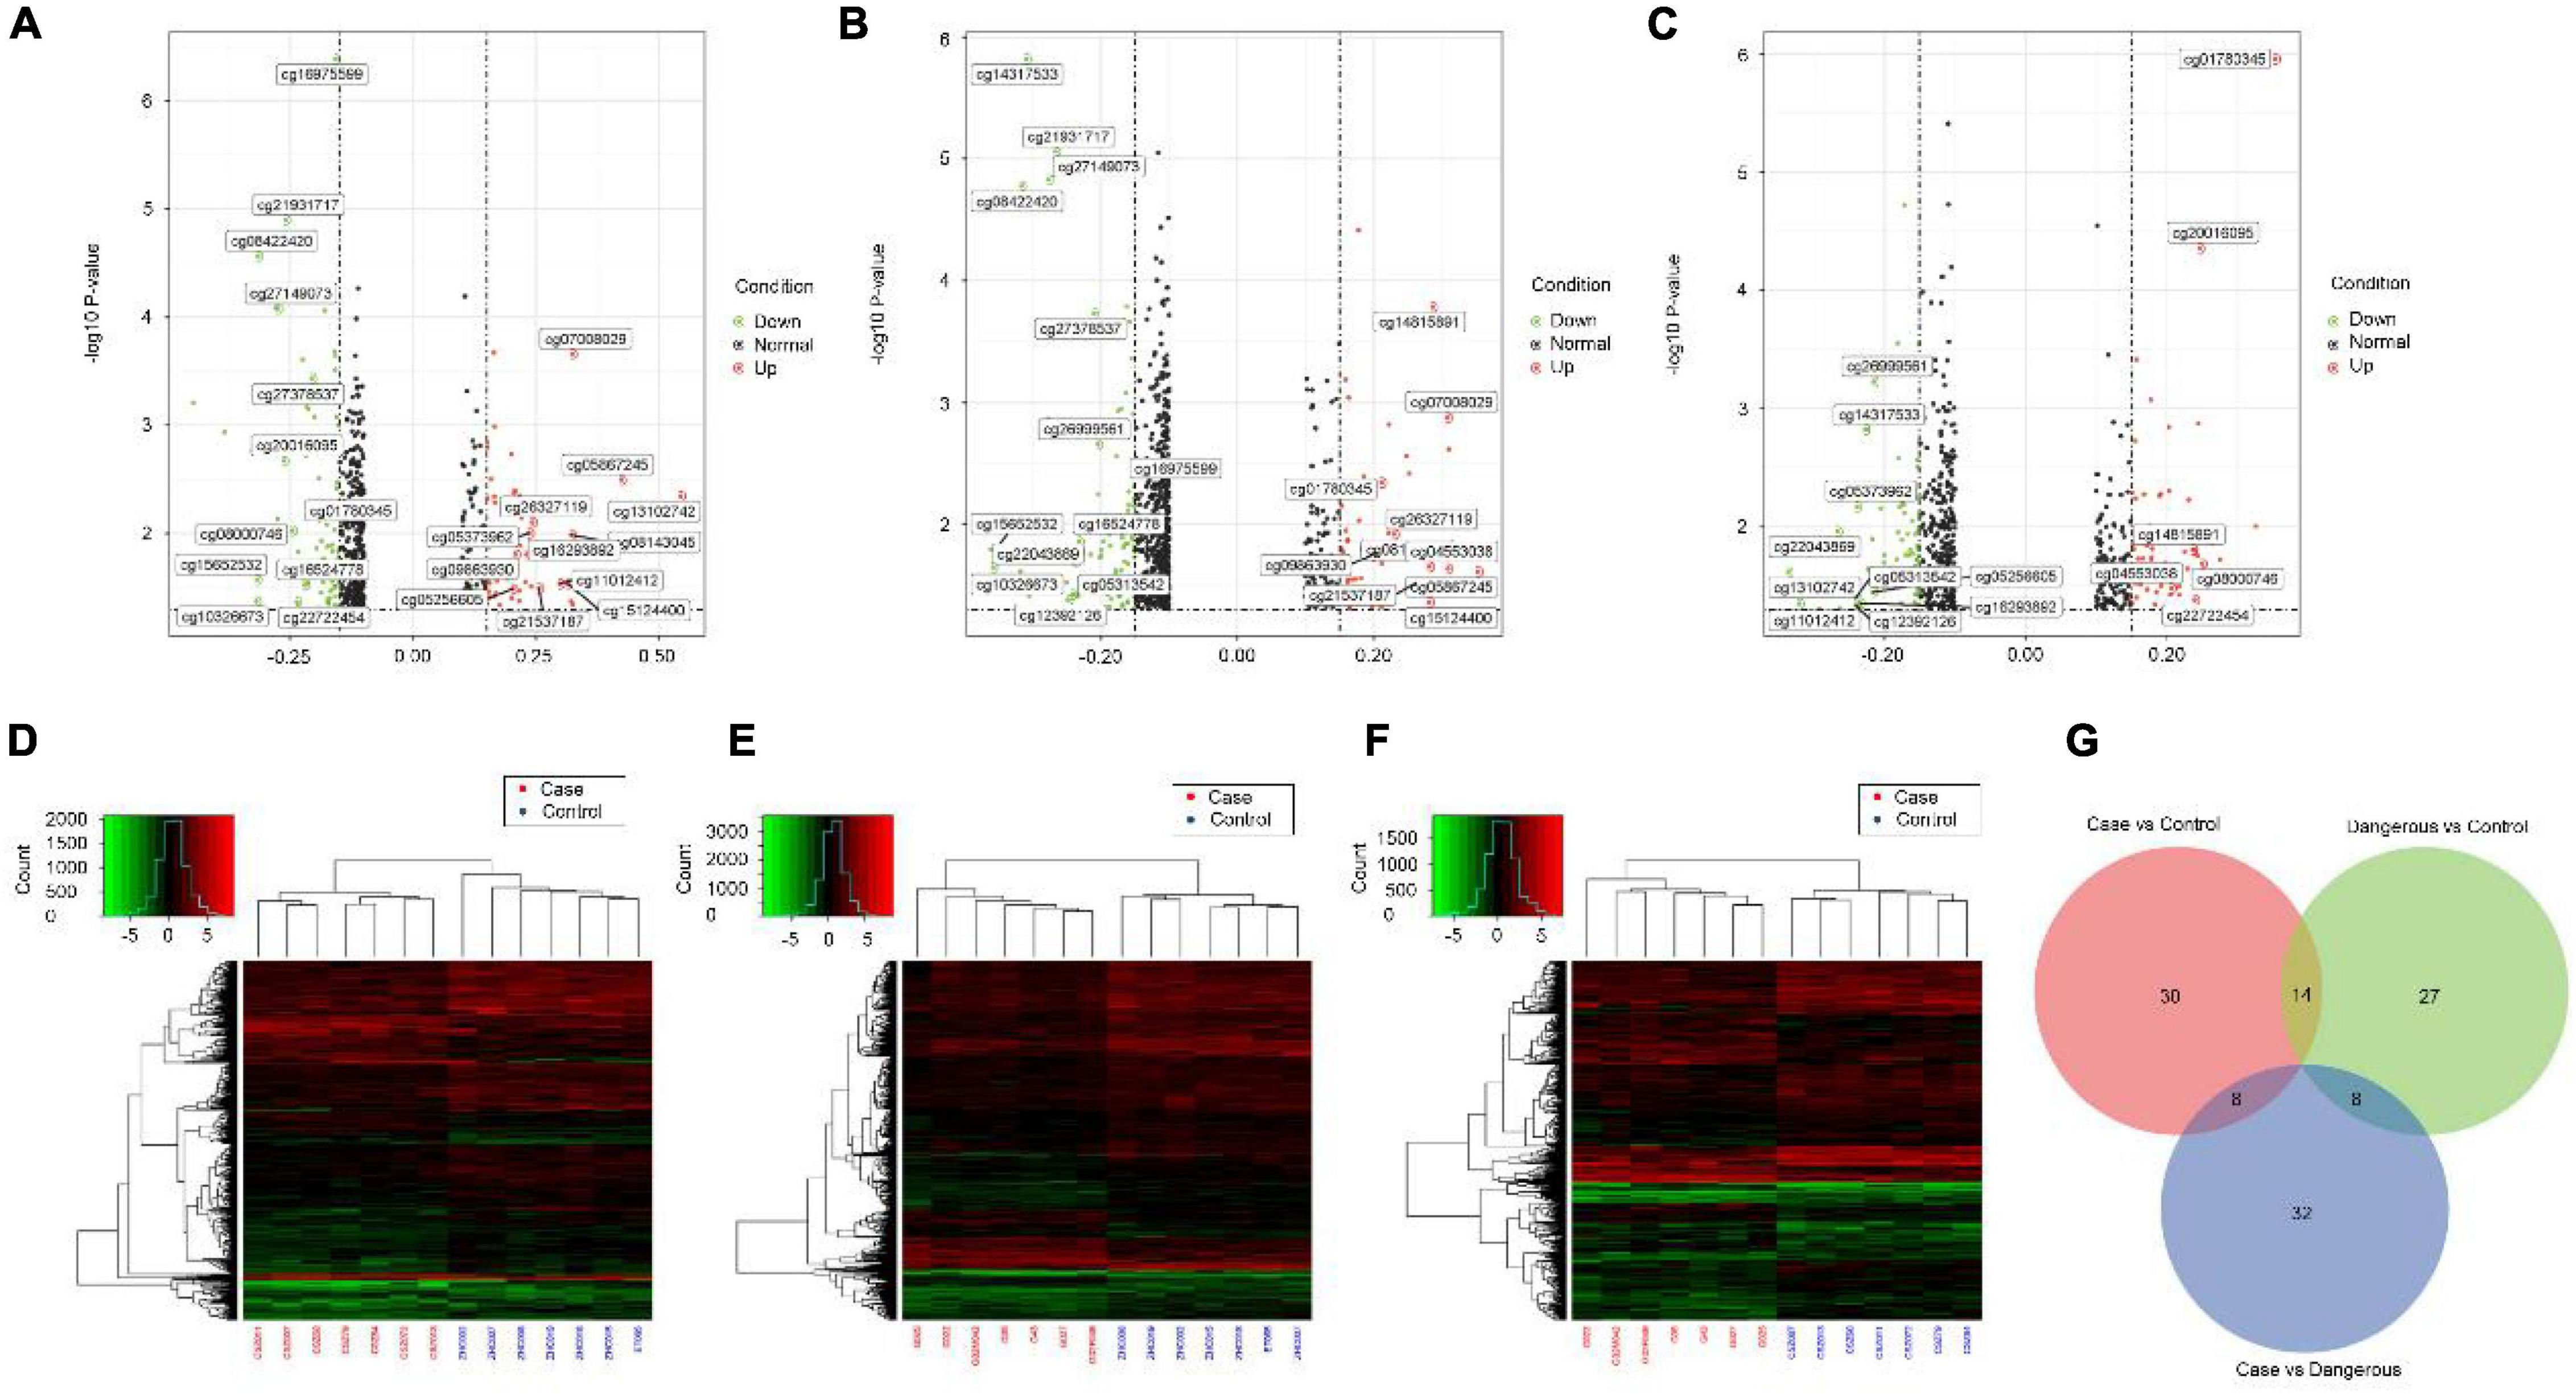
Figure 4. Volcano plots and heatmaps of differential methylation sites. Volcano plots of differential methylation sites were shown in panel (A) disease vs. normal, (B) dangerous vs. normal, and (C) disease vs. dangerous. Red and green points correspond to methylation difference (methylation diff > 0.2 and methylation diff < –0.2) up and down, respectively, and indicate p-value < 0.05. The heatmaps of differential methylation sites were shown in panel (D) disease vs. normal, (E) dangerous vs. normal, and (F) disease vs. dangerous. Hierarchically clustered, each column represents a sample, and every row represents a methylation site. The methylation value for each row was normalized by the z-score. Red indicates high relative methylation and green indicates low relative methylation. (G) Venn diagram of number of differential methylation sites in three groups. Overlapping sets show the differential methylation sites in two or three comparison pairs.
Function Enrichment Analysis of Differential Methylation Genes
Next, GO enrichment analyses for differential methylation genes were performed. The most significant GO terms in each group are presented in Figure 4. For disease vs. normal group, the differential methylation genes were mainly enriched in KEGG related to the metabolic pathways and enriched in OMIM related to major depressive disorder (Figures 5A,B). For dangerous vs. normal group, the differential methylation genes were mainly enriched in the metabolic pathways and olfactory transduction when considering the KEGG criterion and related to some mental pathways when considering the OMIM criterion (Figures 5C,D). In addition, for disease vs. dangerous group, the differential methylation genes were mainly enriched in KEGG related to the metabolic pathways and enriched in OMIM related to some mental pathways (Figures 5E,F).
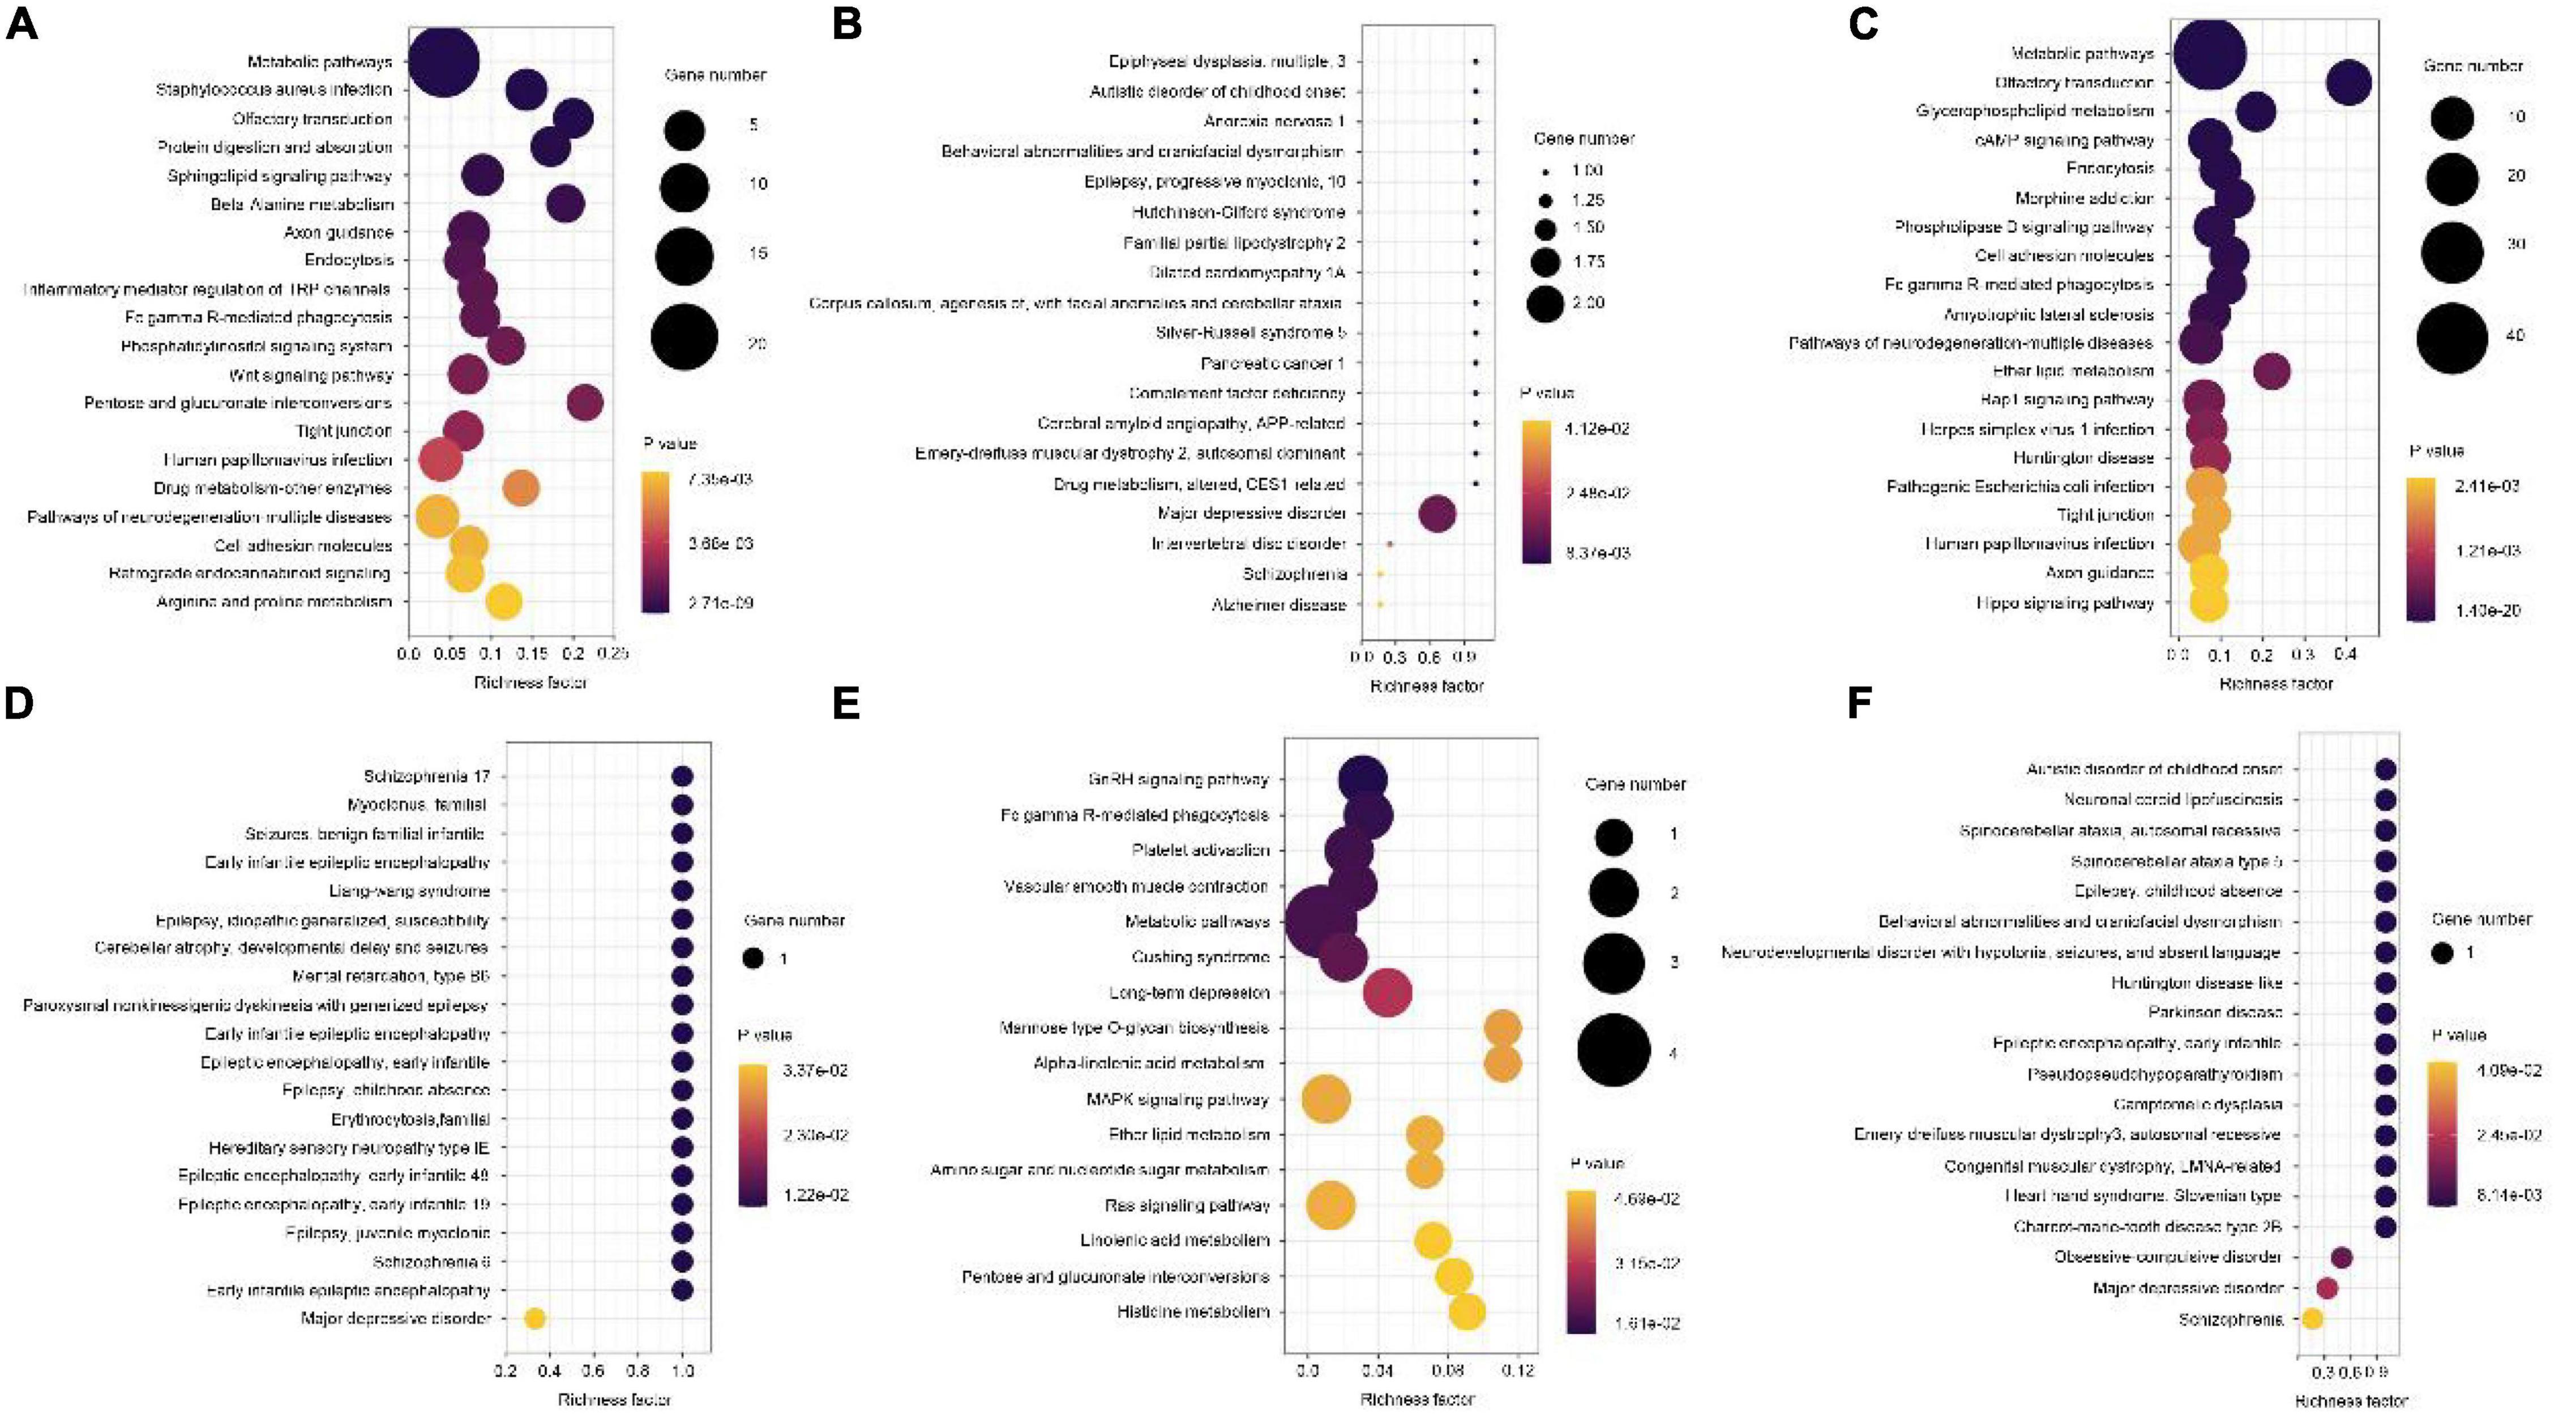
Figure 5. Kyoto Encyclopedia of Genes and Genomes (KEGG) pathway and OMIM analysis of the pathological progression of methylation-related genes in disease vs. normal group (A,B), dangerous vs. normal group (C,D), and disease vs. dangerous group (E,F). Significantly enriched pathways featured p < 0.001. The analysis was conducted using R clusterProfiler.
Protein-Protein Interaction Network Construction and Hub Genes Identification
To further explore the most significant clusters of methylation-related genes, we performed a protein-protein interaction (PPI) network analysis. A confidence score of > 0.7 was set as the threshold and protein nodes that did not interact with other proteins were removed. A total of 28 of 52 methylation-related genes were mapped into the PPI network complex, and the PPI network data file of STRING was imported into Cytoscape. In this network, with a degree of > 5, 15 nodes were chosen as hub nodes, including 12 genes (3 methylation-related genes). The results are presented in Figure 6A. At the same time, we used GeneCodis4 to enrich OMIM and drew methylation-gene-disease network shown as Figure 6B. We also used clusterProfiler to enrich KEGG pathway and draw methylation-gene-pathway network through Cytoscape 3.8.0 as shown in Figure 6C. Finally, we used CytoHubba plugin to screen out hub methylation sites, hub genes, and pathways, as shown in Figure 6D.
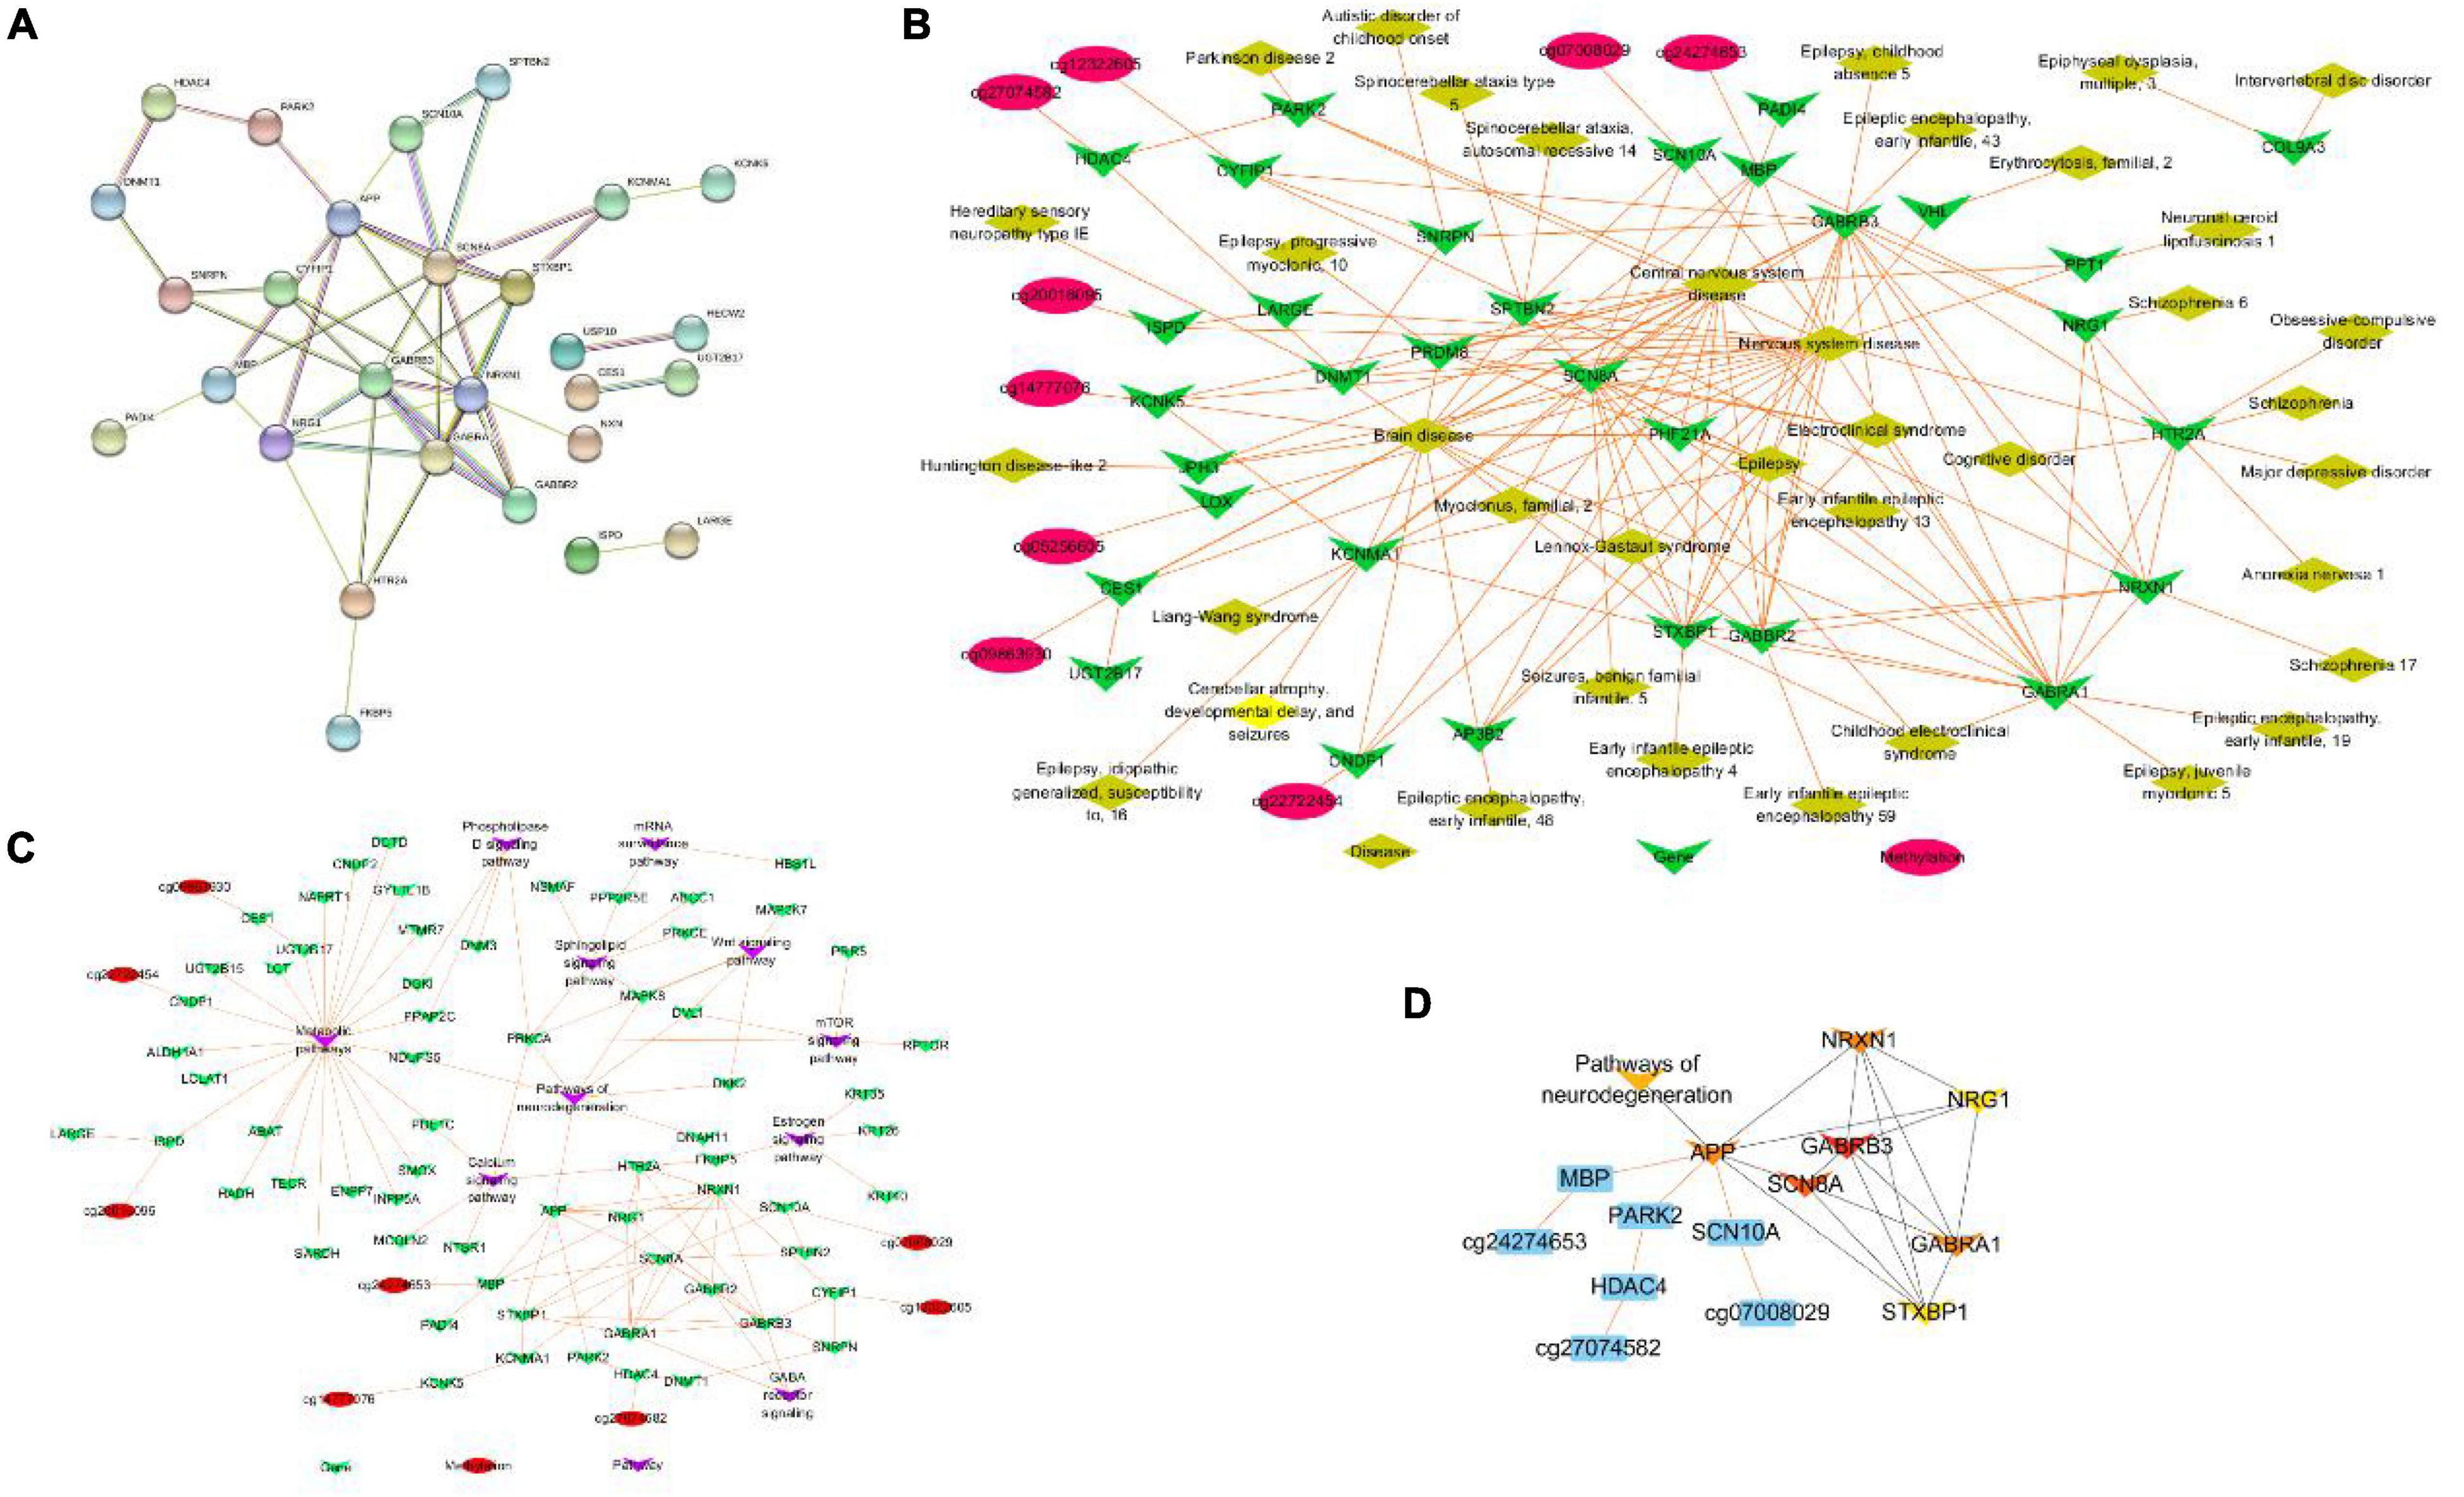
Figure 6. PPI network construction and hub genes identification. (A) The protein–protein interaction (PPI) network. (B) Methylation-gene-disease network. (C) Methylation-gene-pathway network. (D) The hob network by CytoHubba.
Analysis of Methylation as the Diagnostic Actor
Receiver operating characteristic curves were generated according to the data of disease vs. normal groups methylation and found eight methylation sites that can be used as the diagnostic biomarkers: cg07008029, cg0986930, cg12322605, cg20016095, cg24274653, cg27074582, cg05373962, and cg13102742 (Figure 7).
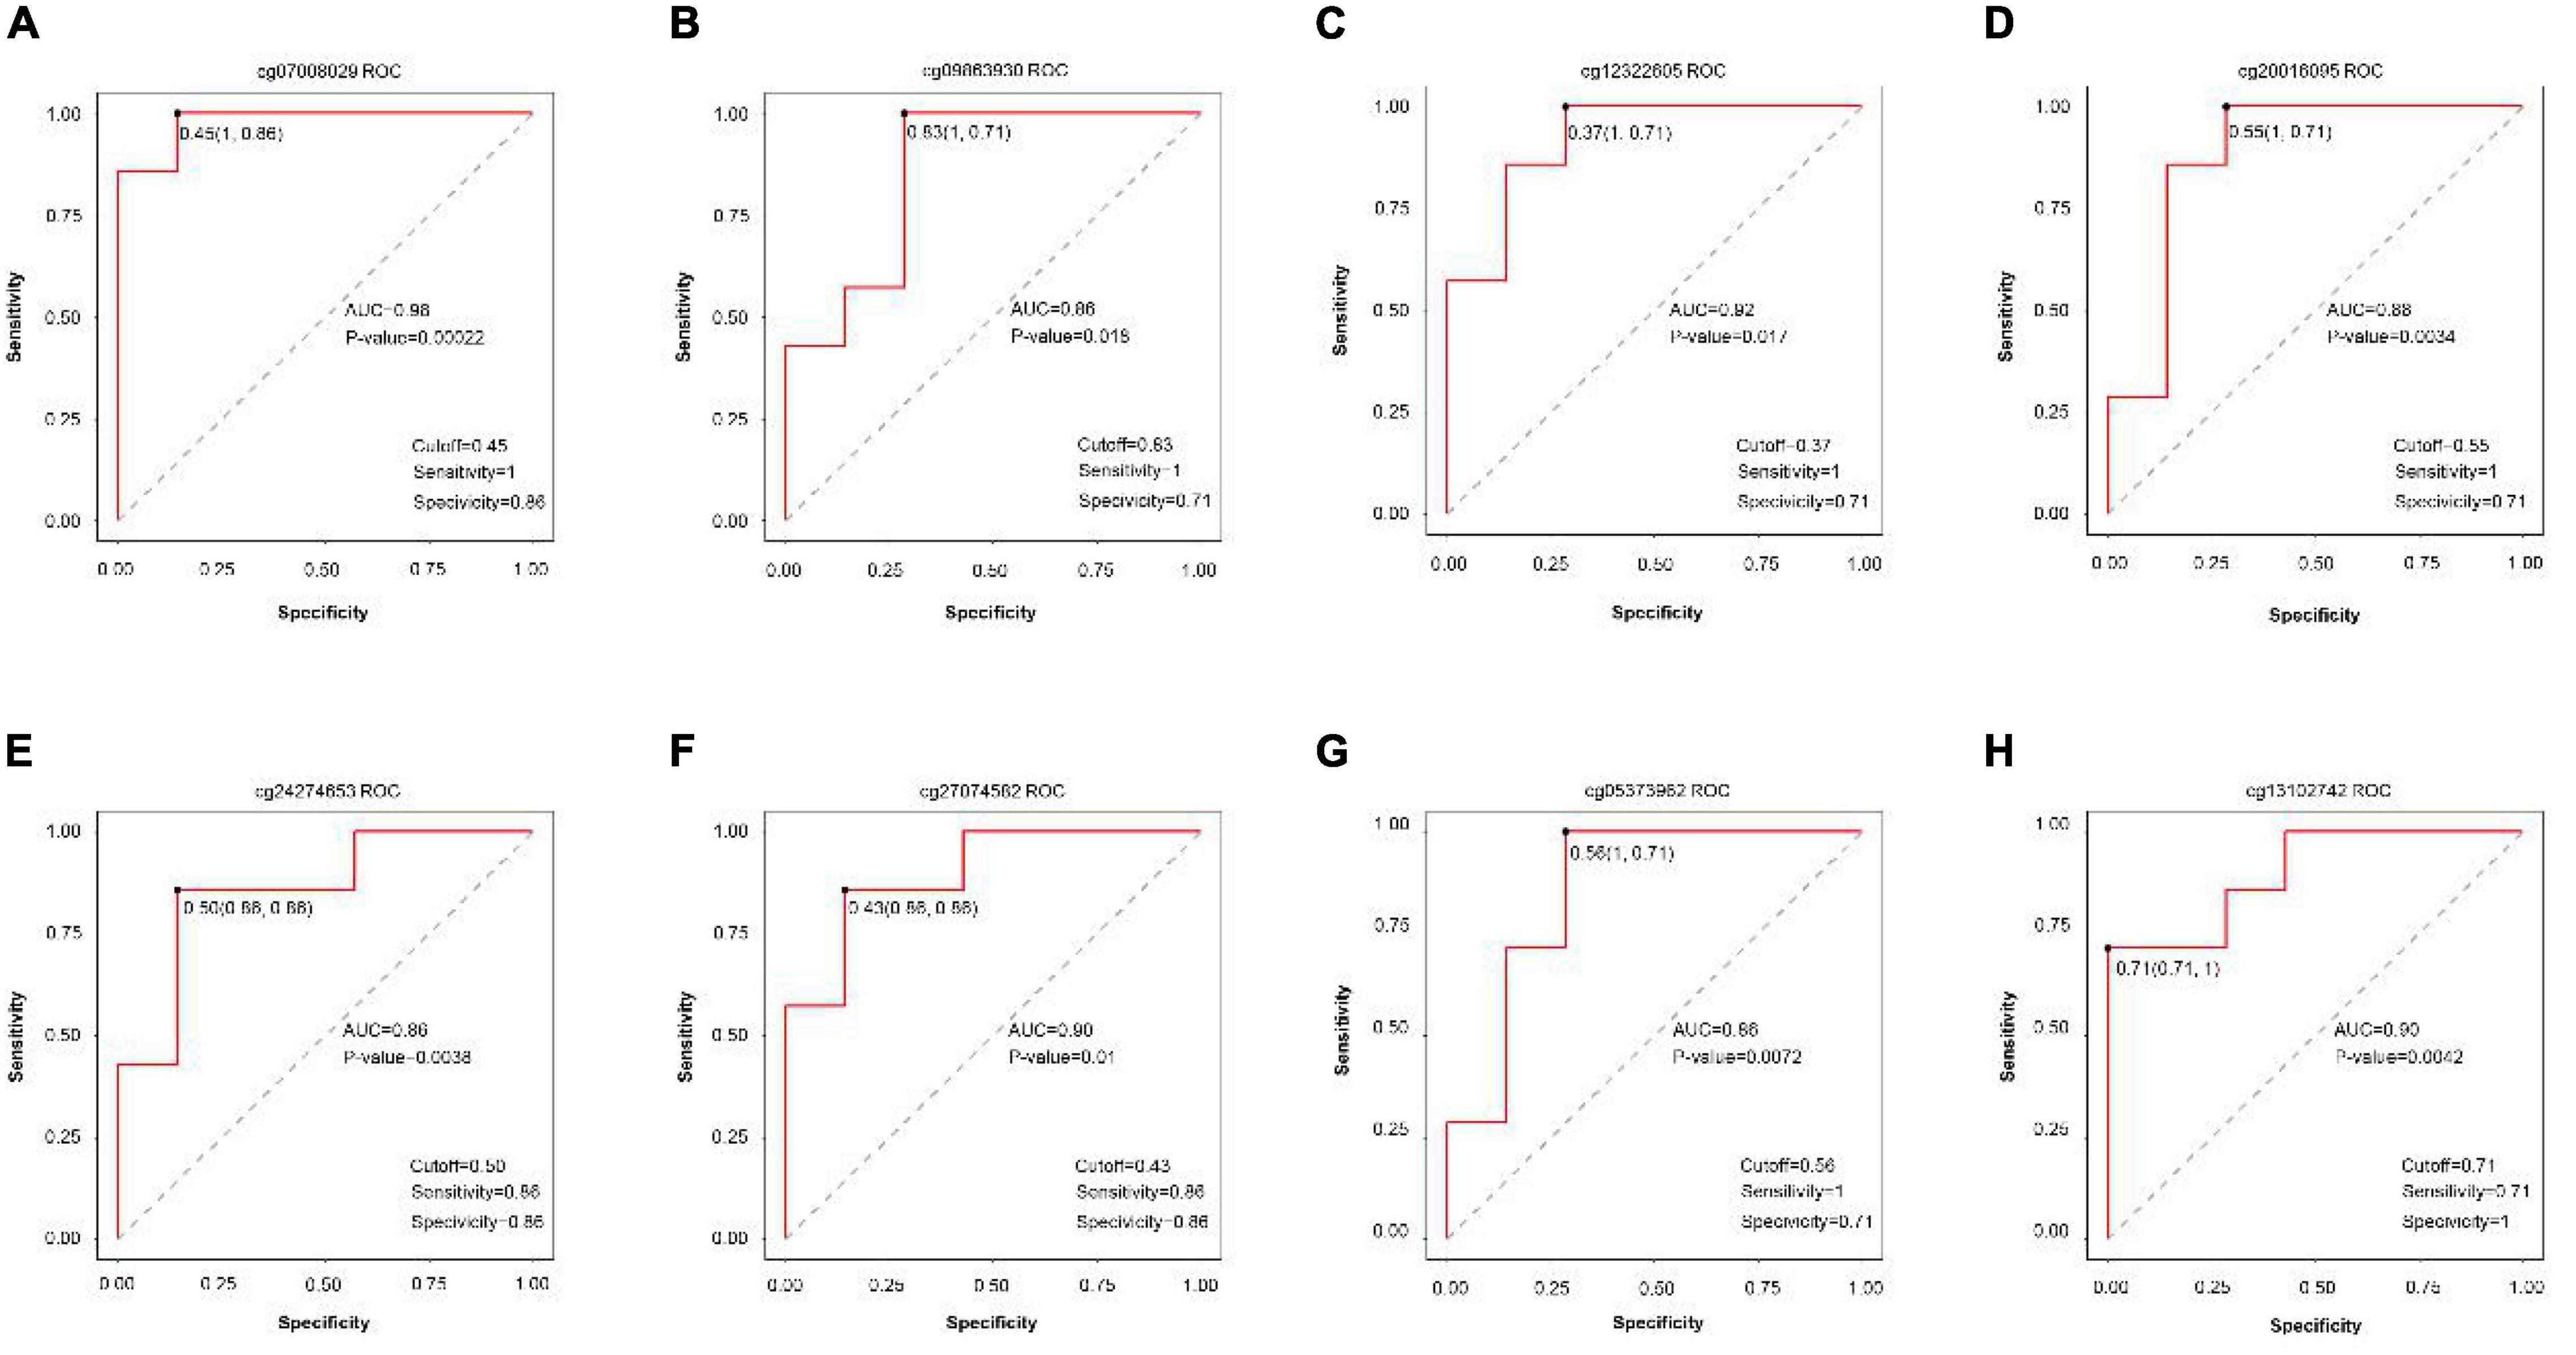
Figure 7. ROC curve comparing sensitivity and specificity of gene methylation panels in disease vs. normal groups. (A) cg07008029, (B) cg0986930, (C) cg12322605, (D) cg20016095, (E) cg24274653, (F) cg27074582, (G) cg05373962, and (H) cg13102742.
Finally, we made the intersection analysis between WGCNA turquoise mode, methylation-related genes, and differentially expressed genes (DGenes) (Figure 8 and Table 2). A total of six key genes, CYFIP1, LCLAT1, MYH15, SDHAP3, UGT2B17, and HDAC4, are obtained. Importantly, HDAC4 is also found in PPI hub genes.
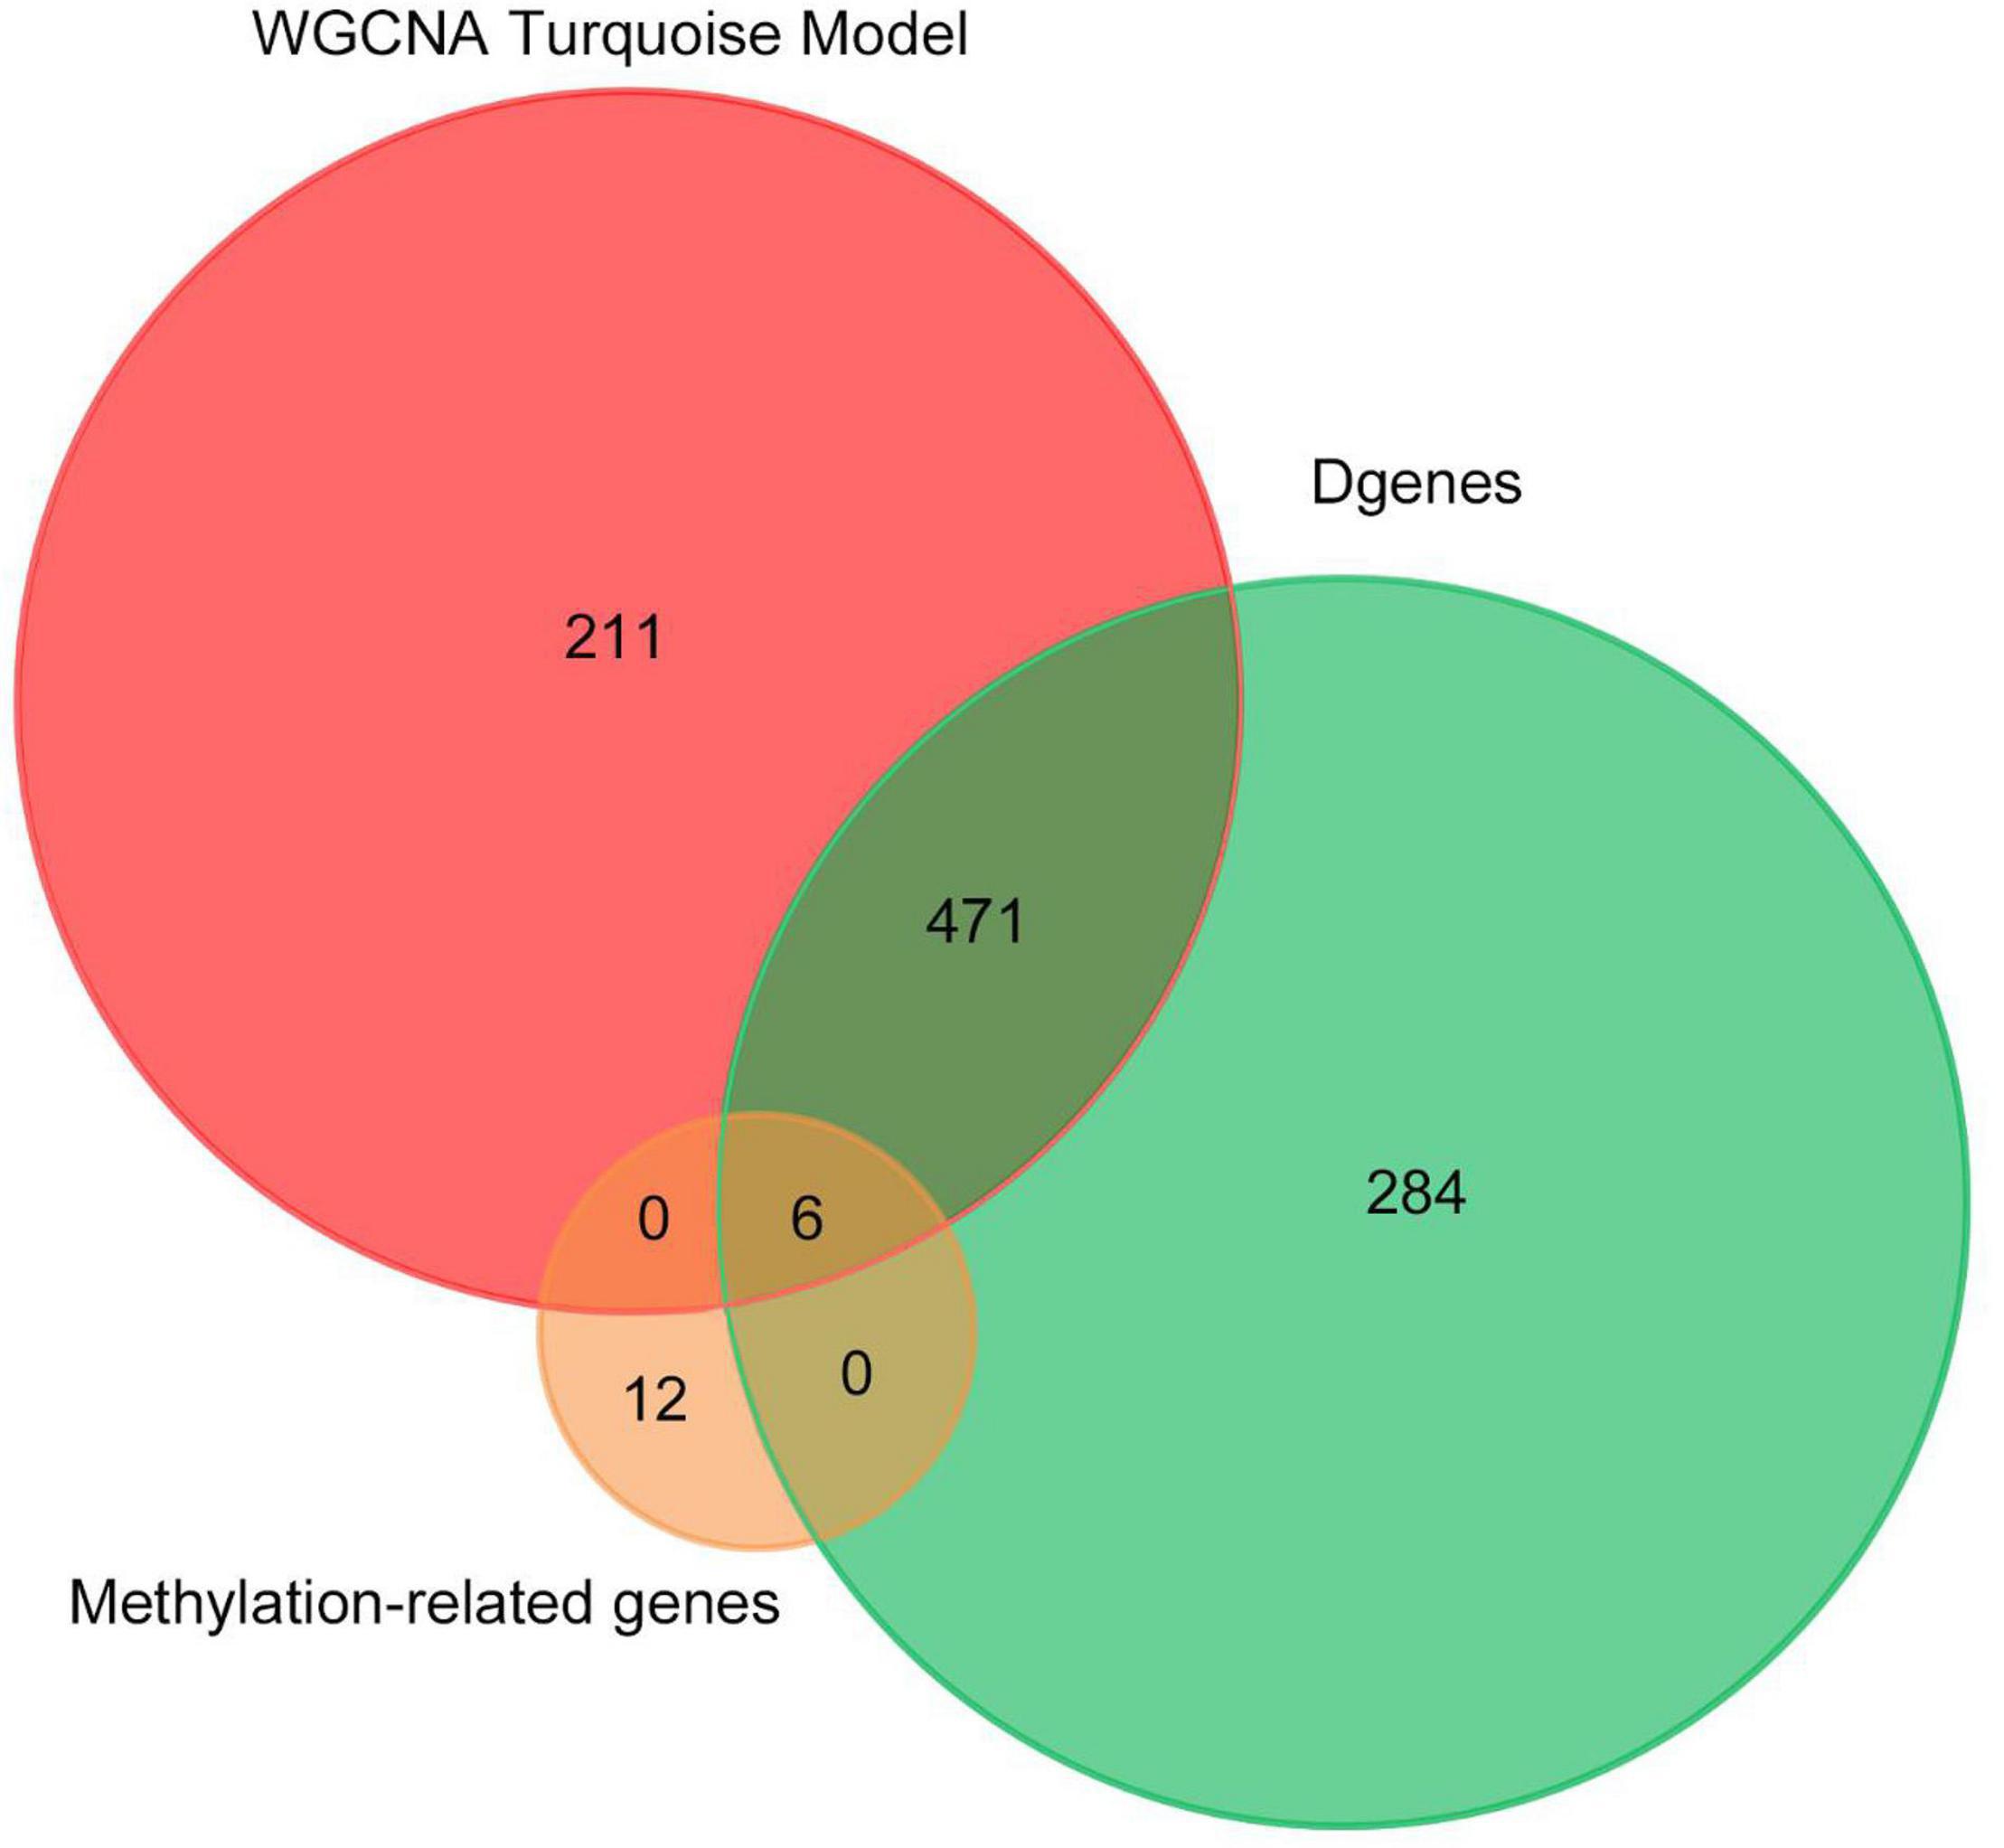
Figure 8. Venn diagram of number of genes in WGCNA turquoise mode, methylation-related genes, and DGenes. Overlapping sets show the number of genes in two or three comparison pairs.
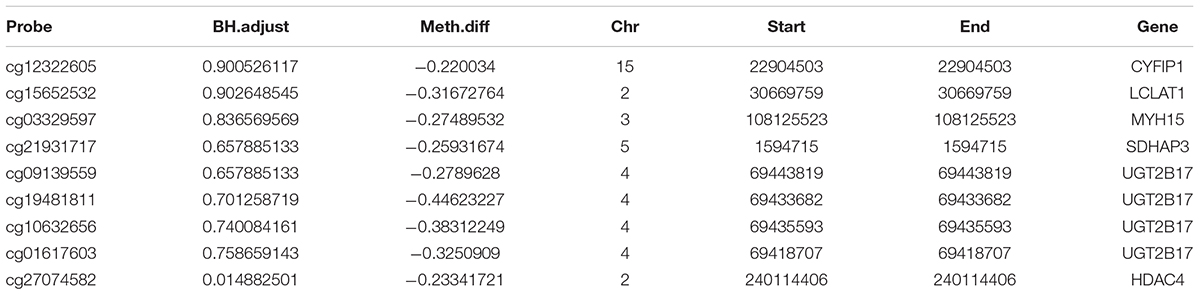
Table 2. Genes associated with differential methylation sites.
Discussion
The exon sequence is only 1% of the total genome but usually associated with disease (Choi et al., 2009; Hedges et al., 2009; Stenson et al., 2009). The presence of the directional genome capture tool makes the exon sequence possible. In recent years, more than 2,000 articles on exome studies have been published in PubMed, and hundreds of diseases are studied deeply by whole-exome sequencing (WES). De novo variants (DNVs) which cause disruption of gene function are likely to contribute to the etiology of neuropsychiatric disorders (Girard et al., 2011; O’Roak et al., 2011; Xu et al., 2011; Gilissen et al., 2014). In this study, the association between genes and childhood-onset schizophrenia (COS) was identified by WES from 38 cases. Previous study showed that COS is an early-onset disease, so we hypothesize that DNVs, which are enriched for more harmful and rigorous effects, might play a greater character in COS than in adult schizophrenia. Our study found single-nucleotide polymorphism (SNP) occurred more frequently than insertion or deletion, and C > T was the most common of SNV in COS. We also found one list of top mutated genes such as TTN, MUC12, MUC2, VSTM1, TRIM61, NEB, and PRR23D1, which are the candidates to be involved in the etiology of COS. Among the mutated genes identified, some were previously reported in schizophrenia or other neuropsychiatric disorders through the literature search and seem to be good candidates as COS predisposing genes.
Previous research to identify the compound mutations of SCZ initiated the titin (TTN) gene with the rare protein-altering compound heterozygous mutations in SCZ trios (Li et al., 2020). MUC12, the member of mucins protein family, is important for intestinal integrity and related to Crohn’s disease (CD) and ulcerative colitis (UC) (Buisine et al., 1999; Moehle et al., 2006; Luu et al., 2010). Next, we will further check whether these interesting genes are involved in biological pathways related to COS, especially the early development of the central nervous system, and also validate these results in a larger COS cohort.
As WGCNA is reportedly to be more reliable and more biologically significant than other methods (Chou et al., 2014), we used this method to form the clusters of predictive functionally related genes. In this way, we identified modules and selected genes that might be considered as the biomarkers for the diagnosis and/or treatment of COS. We used WGCNA to construct 7 COS-related co-expression modules containing 1,360 genes identified in 76 samples to determine the relationships between the COS transcriptome and clinic traits. A total of two co-expression modules were strongly associated with the clinical traits of COS. Differential expression analysis with ANOVA identified 752 significant DEGs, including 351 upregulated and 401 downregulated genes. Although WGCNA may not be as effective as other techniques in identifying modules with high functional relevance and biological significance, it is the most widely used for this purpose (Kakati et al., 2019). We used this correlation-based gene screening method to identify candidate biomarkers and/or therapeutic targets for COS.
Methylation of DNA usually occurs in the cytosine 5-carbon position of CpG dinucleotide and appears significant in normal development and diseases. Until now, no studies have checked the differences in DNA methylation in COS. In this research, which is the first to disclose differences in DNA methylation in COS cases, we performed a genome-wide DNA methylation analysis between COS disease groups, COS dangerous groups, and normal groups. The differential methylation genes were mainly enriched in KEGG related to the metabolic pathways, and eight methylation sites were found to be used as the diagnostic biomarkers. Finally, six key genes, such as CYFIP1, LCLAT1, MYH15, SDHAP3, UGT2B17, and HDAC4, are obtained through the intersection analysis between WGCNA turquoise mode, methylation-related genes, and DGenes. Significantly, HDAC4 is also found in PPI hub genes.
The histone deacetylases (HDACs) participate in the pathological and physiological conditions by regulating the histone acetylation status. The histone deacetylase 4 (HDAC4) is a member of the HDAC family lacking HDAC activity. HDAC4 could interact with signal transduction molecules, transcription factors, and HDAC3 to regulate the transcription of genes in neurodevelopment, neuronal survival, and synaptic plasticity. The homeostasis of HDAC4 highly expressed in the brain is essential for maintaining cognitive function. Previous research indicates that the abnormal HDAC4 expression plays a key role in the cognitive impairment of several brain diseases, such as mental disorders and neurodegenerative diseases. Cognitive disorders are common in patients with schizophrenia, especially memory and learning impairment. Some evidence suggests that HDAC4 may be related to the pathology of schizophrenia (Wu et al., 2016). Other data support the idea that inhibition of HDACs by small molecules might offer a therapeutic alternative for the treatment of many symptoms linked with schizophrenia, especially cognitive deficits (Weïwer et al., 2013). In the future, it will be important to study the role of HDAC isoforms in schizophrenia and to emphasize the technology to develop selective inhibitors of these isoforms as the potential treatments for schizophrenia.
In our study, we analyzed the mutation profiles using the WES data and found one list of mutated genes. We also used WGCNA to construct a network of co-expressed genes and identified differential DNA methylation. A total of six key genes are obtained through the intersection analysis between WGCNA mode, methylation-related genes, and DGenes. These genes may play important roles in the progression of COS and serve as the potential biomarkers for future diagnosis. Our results could help to design the molecule or gene targeted drugs for COS. This study also has limitations. Because the children’s sample is very difficult to collect, we did not get a large sample size and needed to perform the repeated studies containing larger samples. Based on the present data, we speculate the disruption of gene function caused by DNVs and/or DNA methylation difference in COS could affect the expression of functional genes, such as HDAC4, related to the etiology of neuropsychiatric disorders, especially schizophrenia. To test this hypothesis, we will perform further research to confirm the links between the disruption of regulatory gene function and the expression of functional genes in COS progress with larger samples.
Data Availability Statement
The original contributions presented in this study are publicly available. These data can be found here: NCBI, PRJNA83030 and PRJNA828362.
Ethics Statement
The studies involving human participants were reviewed and approved by the Ethics Committee of Beijing Anding Hospital of Capital Medical University. Written informed consent to participate in this study was provided by the participants’ legal guardian/next of kin.
Author Contributions
Y-HC and YZ conceived and planned the experiments. Y-JQ performed the experiment and acquired the data. H-HH analyzed and interpreted the data. FH drafted the manuscript. Y-MZ revised the manuscript. All authors provided critical feedback, helped in shaping the research, analysis, and manuscript, and read and approved the final submitted manuscript.
Funding
This research was supported by the grants from the Research on Prevention and Control of Major Chronic Non-communicable Diseases in the Ministry of Science and Technology (Nos. 2017YFC1309905 and 2016YFC1306100), Fund of Beijing Municipal Science and Technology Commission-Beijing Brain Research (Z161100000216151), and Beijing Hospitals Authority Clinical Medicine Development of Special Funding Support (ZYLX202128).
Conflict of Interest
The authors declare that the research was conducted in the absence of any commercial or financial relationships that could be construed as a potential conflict of interest.
Publisher’s Note
All claims expressed in this article are solely those of the authors and do not necessarily represent those of their affiliated organizations, or those of the publisher, the editors and the reviewers. Any product that may be evaluated in this article, or claim that may be made by its manufacturer, is not guaranteed or endorsed by the publisher.
Acknowledgments
We acknowledge Beijing Genecome Medical Technology Co., Ltd. in China for assistance with data analysis and sequencing.
Footnotes
- ^ https://software.broadinstitute.org/gatk/best-practices/
- ^ http://bio-bwa.sourceforge.net/
- ^ http://www.ncbi.nlm.nih.gov/geo/
- ^ http://bioconductor.org/biocLite.R
- ^ https://david.ncifcrf.gov/
- ^ https://string-db.org/
References
Addington, A. M., and Rapoport, J. L. (2009). The genetics of childhood-onset schizophrenia: when madness strikes the prepubescent. Curr. Psychiatry Rep. 11, 156–161. doi: 10.1007/s11920-009-0024-y
Addington, A. M., Gornick, M., Duckworth, J., Sporn, A., Gogtay, N., Bobb, A., et al. (2005). GAD1 (2q31.1), which encodes glutamic acid decarboxylase (GAD67), is associated with childhood-onset schizophrenia and cortical gray matter volume loss. Mol. Psychiatry 10, 581–588. doi: 10.1038/sj.mp.4001599
Ahn, K., Gotay, N., Andersen, T. M., Anvari, A. A., Gochman, P., Lee, Y., et al. (2014). High rate of disease-related copy number variations in childhood onset schizophrenia. Mol. Psychiatry 19, 568–572. doi: 10.1038/mp.2013.59
Awadalla, P., Gauthier, J., Myers, R. A., Casals, F., Hamdan, F. F., Griffing, A. R., et al. (2010). Direct measure of the de novo mutation rate in autism and schizophrenia cohorts. Am. J. Hum. Genet. 87, 316–324. doi: 10.1016/j.ajhg.2010.07.019
Buisine, M. P., Desreumaux, P., Debailleul, V., Gambiez, L., Geboes, K., Ectors, N., et al. (1999). Abnormalities in mucin gene expression in Crohn’s disease. Inflamm. Bowel Dis. 5, 24–32. doi: 10.1097/00054725-199902000-00004
Choi, M., Scholl, U. I., Ji, W., Liu, T., Tikhonova, I. R., Zumbo, P., et al. (2009). Genetic diagnosis by whole exome capture and massively parallel DNA sequencing. Proc. Natl. Acad. Sci. U.S.A. 106, 19096–19101. doi: 10.1073/pnas.0910672106
Chou, W. C., Cheng, A. L., Brotto, M., and Chuang, C. Y. (2014). Visual gene-network analysis reveals the cancer gene co-expression in human endometrial cancer. BMC Genomics 15:300. doi: 10.1186/1471-2164-15-300
DePristo, M. A., Banks, E., Poplin, R., Garimella, K. V., Maguire, J. R., Hartl, C., et al. (2011). A framework for variation discovery and genotyping using next-generation DNA sequencing data. Nat. Genet. 43, 491–498. doi: 10.1038/ng.806
Gilissen, C., Hehir-Kwa, J. Y., Thung, D. T., van de Vorst, M., van Bon, B. W., Willemsen, M. H., et al. (2014). Genome sequencing identifies major causes of severe intellectual disability. Nature 511, 344–347. doi: 10.1038/nature13394
Girard, S. L., Gauthier, J., Noreau, A., Xiong, L., Zhou, S., Jouan, L., et al. (2011). Increased exonic de novo mutation rate in individuals with schizophrenia. Nat. Genet. 43, 860–863. doi: 10.1038/ng.886
Gornick, M. C., Addington, A. M., Sporn, A., Gogtay, N., Greenstein, D., Lenane, M., et al. (2005). Dysbindin (DTNBP1, 6p22.3) is associated with childhood-onset psychosis and endophenotypes measured by the Premorbid Adjustment Scale (PAS). J. Autism Dev. Disord. 35, 831–838. doi: 10.1007/s10803-005-0028-3
Hedges, D. J., Burges, D., Powell, E., Almonte, C., Huang, J., Young, S., et al. (2009). Exome sequencing of a multigenerational human pedigree. PLoS One 4:e8232. doi: 10.1371/journal.pone.0008232
Kakati, T., Bhattacharyya, D. K., Barah, P., and Kalita, J. K. (2019). Comparison of methods for differential co-expression analysis for disease biomarker prediction. Comput. Biol. Med. 113:103380. doi: 10.1016/j.compbiomed.2019.103380
Kirilina, E. A., Suvorov, N. I., Popova, S. S., Khaidukov, S. V., Rapoport, E. M., Fonina, L. A., et al. (2005). Induction of differentiation in leukemic cell strains with myelopeptide-4. Bull. Exp. Biol. Med. 140, 554–557. doi: 10.1007/s10517-006-0022-6
Langfelder, P., and Horvath, S. (2008). WGCNA: an R package for weighted correlation network analysis. BMC Bioinformatics 9:559. doi: 10.1186/1471-2105-9-559
Li, M., Shen, L., Chen, L., Huai, C., Huang, H., Wu, X., et al. (2020). Novel genetic susceptibility loci identified by family based whole exome sequencing in Han Chinese schizophrenia patients. Transl. Psychiatry 10:5.
Luu, Y., Junker, W., Rachagani, S., Das, S., Batra, S. K., Heinrikson, R. L., et al. (2010). Human intestinal MUC17 mucin augments intestinal cell restitution and enhances healing of experimental colitis. Int. J. Biochem. Cell Biol. 42, 996–1006. doi: 10.1016/j.biocel.2010.03.001
McKenna, A., Hanna, M., Banks, E., Sivachenko, A., Cibulskis, K., Kernytsky, A., et al. (2010). The Genome Analysis Toolkit: a MapReduce framework for analyzing next-generation DNA sequencing data. Genome Res. 20, 1297–1303. doi: 10.1101/gr.107524.110
Moehle, C., Ackermann, N., Langmann, T., Aslanidis, C., Kel, A., Kel-Margoulis, O., et al. (2006). Aberrant intestinal expression and allelic variants of mucin genes associated with inflammatory bowel disease. J. Mol. Med. (Berl) 84, 1055–1066. doi: 10.1007/s00109-006-0100-2
Nishioka, M., Bundo, M., Iwamoto, K., and Kato, T. (2019). Somatic mutations in the human brain: implications for psychiatric research. Mol. Psychiatry 24, 839–856. doi: 10.1038/s41380-018-0129-y
O’Roak, B. J., Deriziotis, P., Lee, C., Vives, L., Schwartz, J. J., Girirajan, S., et al. (2011). Exome sequencing in sporadic autism spectrum disorders identifies severe de novo mutations. Nat. Genet. 43, 585–589. doi: 10.1038/ng.835
Ran, M. S., Xiang, M. Z., Li, S. X., Shan, Y. H., Huang, M. S., Li, S. G., et al. (2003). Prevalence and course of schizophrenia in a Chinese rural area. Aust. N. Z. J. Psychiatry 37, 452–457. doi: 10.1046/j.1440-1614.2003.01203.x
Stenson, P. D., Mort, M., Ball, E. V., Howells, K., Phillips, A. D., Thomas, N. S., et al. (2009). The human gene mutation database: 2008 update. Genome Med. 1:13. doi: 10.1186/gm13
Wan, L., Li, Y., Zhou, Y., Li, R., and Zheng, Y. (2019). Age matters: an atypical association between polymorphism of mthfr and clinical phenotypes in children with schizophrenia. J. Mol. Neurosci. 69, 485–493. doi: 10.1007/s12031-019-01382-0
Weinberger, D. R. (1987). Implications of normal brain development for the pathogenesis of schizophrenia. Arch. Gen. Psychiatry 44, 660–669. doi: 10.1001/archpsyc.1987.01800190080012
Weïwer, M., Lewis, M. C., Wagner, F. F., and Holson, E. B. (2013). Therapeutic potential of isoform selective HDAC inhibitors for the treatment of schizophrenia. Future Med. Chem. 5, 1491–1508. doi: 10.4155/fmc.13.141
Wu, Y., Hou, F., Wang, X., Kong, Q., Han, X., and Bai, B. (2016). Aberrant expression of histone deacetylases 4 in cognitive disorders: molecular mechanisms and a potential target. Front. Mol. Neurosci. 9:114.
Xu, B., Roos, J. L., Dexheimer, P., Boone, B., Plummer, B., Levy, S., et al. (2011). Exome sequencing supports a de novo mutational paradigm for schizophrenia. Nat. Genet. 43, 864–868.
Keywords: de novo mutations, exome sequencing, WGSNA, DNA methylation, gene biomarker, childhood-onset schizophrenia
Citation: He F, Zhou Y-m, Qi Y-j, Huang H-h, Guan L, Luo J, Cheng Y-h and Zheng Y (2022) Exploration of Mutated Genes and Prediction of Potential Biomarkers for Childhood-Onset Schizophrenia Using an Integrated Bioinformatic Analysis. Front. Aging Neurosci. 14:829217. doi: 10.3389/fnagi.2022.829217
Received: 05 December 2021; Accepted: 17 May 2022;
Published: 16 June 2022.
Edited by:
Fernanda Laezza, University of Texas Medical Branch at Galveston, United StatesReviewed by:
Ching-Chi Chiu, Chang Gung University, TaiwanYanyong Liu, Chinese Academy of Medical Sciences and Peking Union Medical College, China
Copyright © 2022 He, Zhou, Qi, Huang, Guan, Luo, Cheng and Zheng. This is an open-access article distributed under the terms of the Creative Commons Attribution License (CC BY). The use, distribution or reproduction in other forums is permitted, provided the original author(s) and the copyright owner(s) are credited and that the original publication in this journal is cited, in accordance with accepted academic practice. No use, distribution or reproduction is permitted which does not comply with these terms.
*Correspondence: Yu-hang Cheng, Y2hlbmd5dWhhbmcyMDA1QDEyNi5jb20=; Yi Zheng, eWl6aGVuZ0BjY211LmVkdS5jbg==
†These authors have contributed equally to this work