 Alireza Nazarian
 Elena Loiko1
 Hussein N. Yassine
 Caleb E. Finch
 Alexander M. Kulminski
- 1Biodemography of Aging Research Unit, Social Science Research Institute, Duke University, Durham, NC, United States
- 2Departments of Medicine and Neurology, Keck School of Medicine, University of Southern California, Los Angeles, CA, United States
- 3Andrus Gerontology Center, University of Southern California, Los Angeles, CA, United States
The APOE ε2, ε3, and ε4 alleles differentially impact various complex diseases and traits. We examined whether these alleles modulated associations of 94 single-nucleotide polymorphisms (SNPs) harbored by 26 genes in 19q13.3 region with 217 plasma metabolites using Framingham Heart Study data. The analyses were performed in the E2 (ε2ε2 or ε2ε3 genotype), E3 (ε3ε3 genotype), and E4 (ε3ε4 or ε4ε4 genotype) groups separately. We identified 31, 17, and 22 polymorphism-metabolite associations in the E2, E3, and E4 groups, respectively, at a false discovery rate PFDR < 0.05. These entailed 51 and 19 associations with 20 lipid and 12 polar analytes. Contrasting the effect sizes between the analyzed groups showed 20 associations with group-specific effects at Bonferroni-adjusted P < 7.14E−04. Three associations with glutamic acid or dimethylglycine had significantly larger effects in the E2 than E3 group and 12 associations with triacylglycerol 56:5, lysophosphatidylethanolamines 16:0, 18:0, 20:4, or phosphatidylcholine 38:6 had significantly larger effects in the E2 than E4 group. Two associations with isocitrate or propionate and three associations with phosphatidylcholines 32:0, 32:1, or 34:0 had significantly larger effects in the E4 than E3 group. Nine of 70 SNP-metabolite associations identified in either E2, E3, or E4 groups attained PFDR < 0.05 in the pooled sample of these groups. However, none of them were among the 20 group-specific associations. Consistent with the evolutionary history of the APOE alleles, plasma metabolites showed higher APOE-cluster-related variations in the E4 than E2 and E3 groups. Pathway enrichment mainly highlighted lipids and amino acids metabolism and citrate cycle, which can be differentially impacted by the APOE alleles. These novel findings expand insights into the genetic heterogeneity of plasma metabolites and highlight the importance of the APOE-allele-stratified genetic analyses of the APOE-related diseases and traits.
Introduction
The chromosome 19q13.3 harboring genes, such as APOE (apolipoprotein E), NECTIN2 (nectin cell adhesion molecule 2), TOMM40 (translocase of outer mitochondrial membrane 40), and APOC1 (apolipoprotein C1) is involved in important physiological and pathological processes. The polymorphisms in this region have been implicated in Alzheimer’s disease (AD), cardiovascular and cerebrovascular pathologies, serum lipids, blood cells count, blood proteins, diabetes, obesity, longevity, etc. (MacArthur et al., 2017). In particular, the ε2, ε3, and ε4 alleles of APOE gene differentially impact the risk of various complex diseases and traits. AD, coronary artery disease (CAD), and lifespan are the most prominent examples, on which the ε4 allele has adverse effects whereas the ε2 allele confers beneficial effects compared with the ε3 allele (Belloy et al., 2019; Wolters et al., 2019). APOE encodes a lipoprotein, which plays key roles in lipid metabolism peripherally and in the central nervous system (CNS) (Stelzer et al., 2016). APOE alleles were found to differentially impact lipid metabolism (Wolters et al., 2019). The ε4 allele is considered as an atherogenic allele, which may be associated with increased risk of CAD and ischemic stroke via elevated serum levels of total cholesterol (TC) and low-density lipoprotein cholesterol (LDL-C), while ε2-carriers have lower plasma levels of TC and LDL-C and decreased risks of CAD and carotid artery atherosclerosis (Lehtimäki et al., 1990; Ilveskoski et al., 2000; Natarajan et al., 2016; Belloy et al., 2019; Karjalainen et al., 2019; Loika et al., 2021). In CNS, APOE is mainly involved in cholesterol homeostasis required for myelinization, neuronal membranes integrity and survival, and synaptogenesis. The ε4-encoded protein is maladaptive leading to changes in lipid metabolism and β-amyloid (Aβ) aggregation in brain due to its increased production and decreased clearance (Barberger-Gateau et al., 2011; Liu et al., 2013; Yamazaki et al., 2019).
In recent years, metabolomics analysis has emerged as a powerful strategy to identify molecular signatures of complex diseases and traits. The identified disease-metabolite associations can serve as novel disease biomarkers, which are important particularly for early diagnosis of late-onset diseases (Bäckström et al., 2003; Sabatine et al., 2005; Lewis et al., 2008; Gueli and Taibi, 2013; Laaksonen, 2016; Yanai, 2017; McGarrah et al., 2018; Socha et al., 2020; Piubelli et al., 2021). In addition, metabolites, as intermediate phenotypes, may mediate the genetic bases of complex disorders (Andreou et al., 2015). Interestingly, the differential impacts of APOE alleles have been reported in metabolomics studies as well. For instance, the healthy ε4 carriers were found to have significantly higher myoinositol-to-creatine and choline-to-creatine ratios compared to ε3ε3 subjects (Gomar et al., 2014). In a study of patients with early stages AD, eight metabolites, mostly glycerophospholipids (e.g., cardiolipins, lysophosphatidylcholines, and lysophosphatidylethanolamines) involved in lipid metabolism, could reliably discriminate ε4-carriers from non-carriers. All eight metabolites had lower serum levels in the ε4-carriers (Peña-Bautista et al., 2020). The differential impacts of ε2 and ε4 alleles on serum lipid metabolites have been also emphasized elsewhere (Karjalainen et al., 2019). As another example, while cortical Aβ aggregation was nominally associated with arachidonic acid, an ω-6 polyunsaturated fatty acid (PUFA), in ε4 non-carriers (P < 0.03), the similar association was non-significant in the ε4 carriers (P < 0.57) (Hooper et al., 2017). Randomized controlled trials have suggested that ε4 allele may alter the fate of ω-3 both in the brain (Arellanes et al., 2020) and in the periphery (Tomaszewski et al., 2020). For Instance, by examining the brain responses to high-dose supplementation (2.1 g/day over a 6-month period) with docosahexaenoic acid, Arellanes et al. (2020) found that the ε4 negative subjects had higher cerebrospinal fluid (CSF) levels of ω-3 docosahexaenoic acid and eicosapentaenoic acid compared to the ε4 positive subjects.
The APOE 19q13.3 locus is a genetically heterogenous region within which complex haplotype structures, interactions, and compound genotypes have been identified (Templeton et al., 2005; Yu et al., 2007; Lescai et al., 2011; Lutz et al., 2016; Babenko et al., 2018; Kulminski et al., 2018, 2020a,b,2021; Zhou et al., 2019; Nazarian et al., 2022a,b). For instance, linkage disequilibrium (LD) and association studies have highlighted complex genetic structure in this locus that are statistically different between AD-affected and unaffected subjects (Kulminski et al., 2018, 2020a,b). In addition, stratified analyses have identified sets of interactions and compound genotypes in the APOE locus of the ε2- and ε4-carriers, which may modify the effects of these alleles on AD risk and, to some extent, justify their incomplete penetrance (Nazarian et al., 2022a,b).
While previous studies have provided valuable insights into the genetic associations of the plasma metabolites (Mittelstrass et al., 2011; Rhee et al., 2013; Shin et al., 2014; Demirkan et al., 2015; Draisma et al., 2015; Krumsiek et al., 2015; Long et al., 2017; Lotta et al., 2021), little attention has been devoted to their genetic heterogeneity in the APOE 19q13.3 locus. Given the genetic complexity of this locus, we hypothesized that the APOE alleles may modulate associations of the regional single-nucleotide polymorphisms (SNPs) with plasma metabolites. Therefore, stratified analyses of SNP-metabolite associations in distinct groups of subjects carrying different APOE alleles/genotypes may reveal group-specific associations, which have not been identified in the non-stratified analyses. We examined associations between SNPs within the APOE locus and 217 plasma metabolites using data from the Framingham Heart Study (FHS) in three groups of subjects (i.e., E2: ε2ε2 and ε2ε3; E3: ε3ε3; and E4: ε3ε4 and ε4ε4). Our analyses revealed novel associations with plasma metabolites, mostly with lipid analytes. Two subsets of associations identified in ε2- or ε4-carriers were group-specific with significantly different effects between the groups under consideration.
Materials and methods
Study participants
We used the metabolite profiling data collected in the FHS Offspring cohort (Feinleib et al., 1975) and the genetic data from the FHS Candidate Gene Association Resource (CARe). The metabolite profiling data provides information on blood concentrations of 217 polar [e.g., amino acids, biogenic amines, carnitine, carbohydrates (e.g., pentose, hexoses, and disaccharides), nucleosides, etc.] and lipid [e.g., diacylglycerols (DAGs), triacylglycerols (TAGs), cholesterol esters (CEs), phosphatidylcholines (PCs), lysophosphatidylcholine (LPC), lysophosphatidylethanolamines (LPEs), and sphingomyelins (SMs)] analytes measured by a liquid chromatography/mass spectrometry (LC/MS) platform. The measured metabolites have been reported as normalized unit-free values (Feinleib et al., 1975; Rhee et al., 2013). To analyze the genetic heterogeneity at the APOE 19q13.3 locus, study participants were divided into three groups based on their APOE genotypes: (1) E2: subjects with ε2ε2 or ε2ε3 genotype, (2) E3: subjects with ε3ε3 genotype, and (3) E4: subjects with ε3ε4 or ε4ε4 genotype. The FHS study designated APOE genotypes of participants and their cognitive status based on the neurologic exam criteria (McKhann et al., 1984, 2011). Table 1 summarizes the basic demographic and clinical information about these 1798 subjects. The study participants were of Caucasian ancestry.
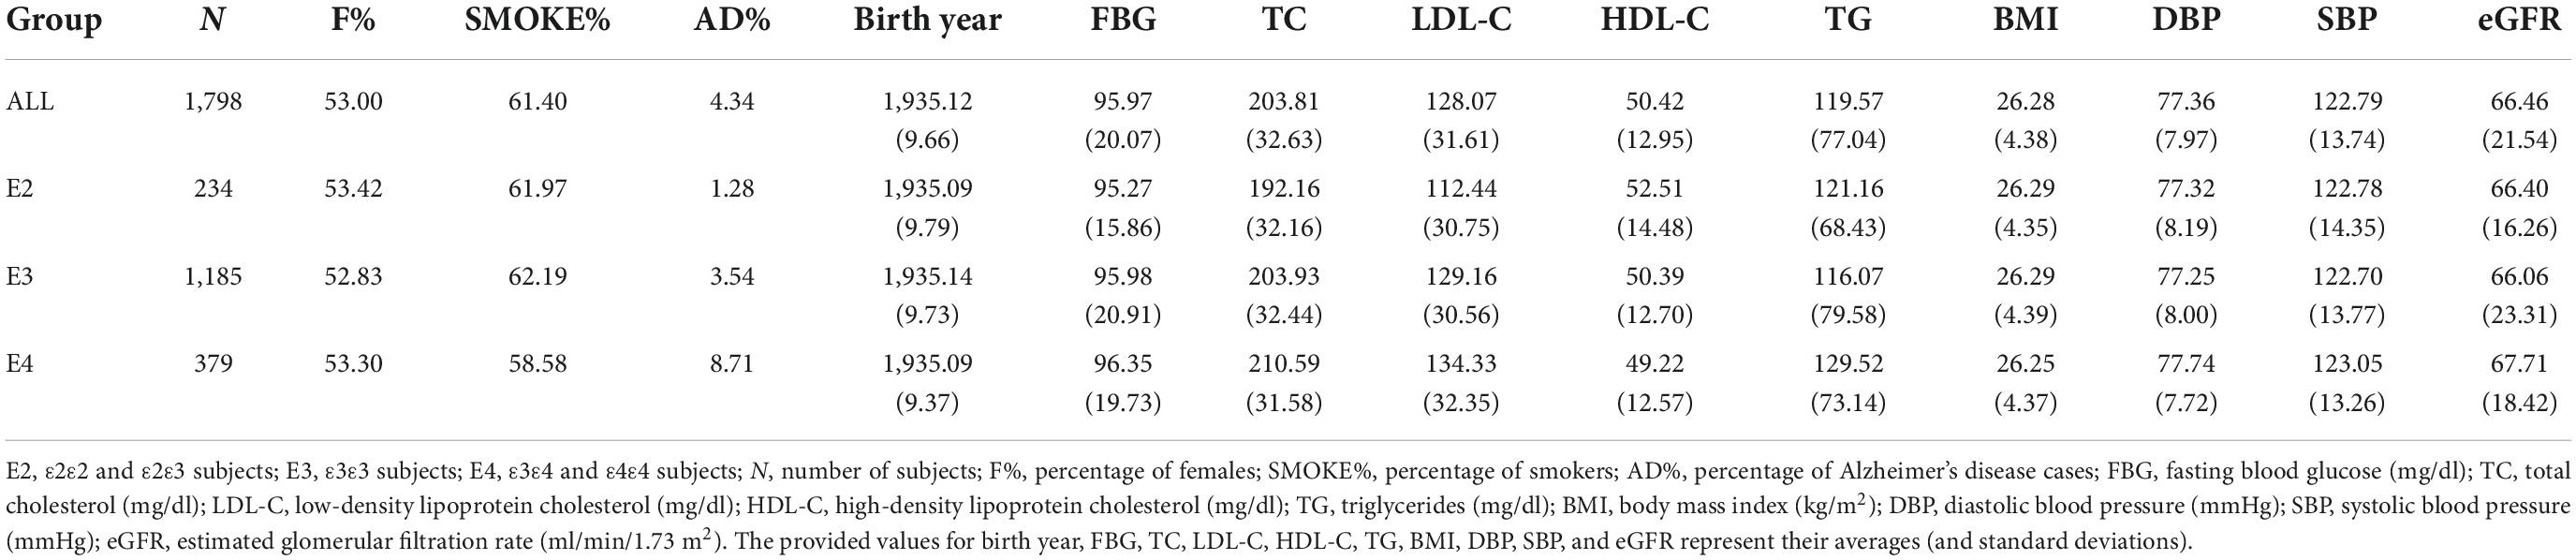
Table 1. Demographic information about study participants.
Genotype data quality control
The low-quality genetic data including SNPs with minor allele frequencies less than 1%; SNPs with P-values less than 1E−06 in Hardy-Weinberg equilibrium test; SNPs or subjects with missing rates larger than 5%; and SNPs, subjects, or families with Mendel error rates larger than 2% were first filtered out using PLINK package (Purcell et al., 2007). All SNPs in the APOE 19q13.3 locus (within 1 Mb up-/downstream of the APOE gene) available on the FHS CARe array were included. After quality control (QC) process, 94 SNPs (mapped to 26 genes from CEACAM22P to RSPH6A) were retained for our analyses.
Association analysis
Stage one: Association study
Additive genetic models were fitted to identify the associations between the log-transformed concentrations of each of the 217 metabolites and the 94 SNPs in the APOE 19q13.3 locus using GCTA package (Yang et al., 2011). Following (Rhee et al., 2013; Huang et al., 2020), the fitted linear regression models were adjusted for sex, birth year, smoking history, body mass index (BMI), diastolic blood pressure (DBP), systolic blood pressure (SBP), fasting blood glucose (FBG), TC, LDL-C, high-density lipoprotein cholesterol (HDL-C), triglycerides (TG), estimated glomerular filtration rate (eGFR), and AD status of subjects, as well as the top five principal components of genetic data [obtained by the GENESIS R package (Conomos et al., 2015)] as fixed-effects covariates. Since the FHS dataset has a family-based design, the family structure was included as a random-effects covariate. Significant associations were identified at a false discovery rate (FDR) adjusted PFDR < 0.05 (Benjamini and Hochberg, 1995; Storey et al., 2022). Stage one analyses were separately performed in each of the three APOE-stratified groups of participants (i.e., E2, E3, and E4 sub-groups).
Stage two: Group-specific associations
For any SNP significantly associated with a given metabolite in each of the E2, E3, and E4 groups, the effects (i.e., beta coefficients) of the SNP were contrasted between E2 and E3 groups, E4 and E3 groups, and E2 and E4 groups using a Chi-square test (Allison, 1999):
where, b1 (SE1) and b2 (SE2) are the beta coefficients (their standard errors) for a given SNP in the two contrasted groups.
Any SNP with significantly different effects between the two contrasted groups was considered to have a group-specific association. Significant findings from the chi-square tests were determined at a Bonferroni-adjusted threshold considering the number of tested SNPs.
Since the E2, E3, and E4 groups had different sample sizes, which would impact the statistical power of corresponding association analyses, the group-specific associations were further evaluated by fitting interaction models (Gogarten et al., 2019) in which the APOE status, SNP, and SNP-by-APOE status were included as fixed-effects variables along with the covariates mentioned in stage one analyses. A significant interaction term for any SNP corroborated its group-specific association.
Pathway enrichment
MetaboAnalyst (v5.0) webtool (Pang et al., 2021) was used to identify KEGG (Kyoto Encyclopedia of Genes and Genomes) pathways (Kanehisa and Goto, 2000) enriched by metabolites that had significant associations in stage one of genetic analyses.
Results
Association analysis
Despite the importance of controlling for confounding effects of the cardiovascular and metabolic syndrome-related risk factors on genetic associations of plasma metabolites (Rhee et al., 2013; Huang et al., 2020), the inclusion of several covariates in the fitted model may increase the risk of multicollinearity. That is, if the variables of interest (here 94 SNPs in the APOE 19q13.3 locus) have high collinearity with other covariates, their estimated parameters would be unstable due to a potential decrease in the effective sample sizes (and statistical powers) and inflated standard errors (Johnston et al., 2018; Tomaschek et al., 2018). By examining potential multicollinearity, we found that these SNPs were weakly correlated with the other covariates (Pearson squared correlation coefficient r2 ranged from 1.30E−40 to 5.36E−02) and had small variance inflation factors (VIFs) of 1.01 to 1.36. These results implied minor impacts from multicollinearity on the estimated parameters, which can be safely ignored (Johnston et al., 2018; Tomaschek et al., 2018).
Our analyses identified 70 SNP-metabolite associations (with 20 lipid metabolites and 12 polar analytes) at PFDR < 0.05 in the E2, E3, and E4 groups (Supplementary Tables 1–3). Most (51) of the identified associations were with lipid analytes, such as TAGs, LPEs, PCs, CEs, and SMs, many of which contained PUFAs [i.e., fatty acids (FAs) with two or more double bonds]. Several associations were also with non-lipid soluble analytes (e.g., amino acids, disaccharide, nucleosides, etc.).
Analyzing the E2 group, we found 31 SNP-metabolite associations (Supplementary Table 1). 27 of them were with lipid analytes including associations of SNPs mapped to BCL3 and APOE with multiple TAGs (i.e., 54:4, 54:5, 54:6, 56:3, 56:4, and 56:5); mapped to APOC2, APOC4, and CLPTM1 with three LPEs (i.e., 16:0, 18:0, 20:4); and mapped to CKM with PC 38:6. In addition, 4 SNP-metabolite associations were identified for non-lipid analytes including associations of rs10402271 (BCAM variant) with disaccharide sucrose (containing one glucose and one fructose molecules), rs10413089 (APOC2 variant) and rs10421404 (CLPTM1 variant) with amino acid glutamic acid, and rs16979759 (CKM variant) with dimethylglycine, a derivative of the amino acid glycine.
A total of 17 SNP-metabolite associations were identified in the E3 group (Supplementary Table 2), most (14) of which were with lipid analytes including associations of SNPs mapped to APOC2, APOC4, and CLPTM1 with CE 20:3, PC 32:0, and mapped to APOC4/APOC4-APOC2 with TAG 56:4. In addition, rs4884 (CKM variant) and rs11083777 (EML2 variant) were associated with amino acids aspartate and asparagine, respectively, and rs16939 (DMPK variant) was associated with xanthosine, a purine nucleoside.
Our analyses identified 22 SNP-metabolite associations in the E4 group (Supplementary Table 3). 10 of them were with lipid analytes including associations of SNPs mapped to NECTIN2 with three PCs (i.e., 32:0, 32:1, and 34:0); mapped to NECTIN2 and CKM with two SMs (i.e., 18:0 and 22:0, respectively); and mapped to NECTIN2, CKM, DMPK, and DMWD with various TAGs (i.e., 50:2, 52:1, 56:6, and 58:11). Several associations with amino acids derivatives were also identified including associations of five SNPs (i.e., rs1871046, rs12610605, rs8106922, rs440446, and rs769450) mapped to NECTIN2, TOMM40, and APOE with ADMA (asymmetric dimethylarginine), a derivative of the amino acid L-arginine; and the association of rs12709889 (APOC2/APOC4-APOC2 variant) with the thyroid gland hormone thyroxin, a derivative of the amino acid tyrosine. Also, three SNPs mapped to NECTIN2 (i.e., rs519113, rs2075642, and rs387976) were associated with two intermediates of the tricarboxylic acid (TCA) cycle, i.e., aconitate and isocitrate. Finally, rs12609547 (RELB variant) was associated with uridine, a pyrimidine nucleoside and rs1064725 (APOC1 variant) was associated with propionate, a conjugate base of a short-chain FA.
Most of the lipid metabolites with significant associations in the E2, E3, and E4 groups contained ω-3 (e.g., eicosatetraenoic acid and docosahexaenoic acid) or ω-6 (e.g., arachidonic acid) PUFAs in their structures (Wishart et al., 2007). These were more abundant in the E2 group than in the other two groups [i.e., TAGs 54:4, 54:5, 54:6, 56:3, 56:4, 56:5, LPE 20:4, PC 38:6 (E2 group); TAG 56:4, CE 20:3 (E3 group); and TAGs 50:2, 56:6, 58:11 (E4 group)].
APOE SNPs
The ε2-encoding SNP, rs7412, was associated with TAGs 54:5, 54:6, 56:3, and 56:4 in the E2 group. In contrast, no associations were identified for the ε4-encoding SNP, rs429358, in the E4 group at PFDR < 0.05.
SNPs overlaps between groups
Several SNP associations were significant in both E2 and E3 groups (i.e., rs5157, rs2288912, rs7257468, rs3760627, and rs2239375), although their associations were with different lipid analytes. These SNPs were associated with LPEs 16:0, 18:0, and 20:4 in the E2 group but with CE 20:3 and PC 32:0 in the E3 group. Also, rs12709889 was associated with PC 32:0 in the E3 group and with thyroxine in the E4 group.
Linkage disequilibrium
In each group there are metabolites associated with multiple SNPs. Such associations may not be merely attributed to the potential LD between SNPs. For instance, while rs7412, rs17728272, and rs2965174 are associated with TAGs 54:5 and 54:6 in the E2 group, rs7412 is not in noticeable LD with these two SNPs (r2 = 0.01, P < 0.1595 and r2 = 0.0365, P < 0.0072, respectively). As another example, rs1871046 and rs2075642, which are among significant SNPs in the E4 group, are in significant LD (r2 = 0.1281, P < 0.0001), however, the former is associated with ADMA and the latter is associated with isocitrate. Supplementary Tables 4–6 display the LD measures (r2 in lower-left triangle and D′ in upper-right triangle) among the identified SNPs in the three analyzed groups. The SNP-pairs with r2 > 0.1 are in significant LD at P < 0.0001 in the CEU population (i.e., Utah Residents with Northern and Western European Ancestry) (Machiela and Chanock, 2015).
Group-specific associations
The Chi-square test to compare the effect sizes (i.e., beta coefficients) of SNPs between the three analyzed groups revealed that among associations identified in the E2 group, three SNPs-amino acids associations [i.e., the associations of rs10421404 (APOC2/APOC4-APOC2 variant) and rs10413089 (CLPTM1 variant) with glutamic acid, and rs16979759 (CKM variant) with dimethylglycine] were significantly different between the E2 and E3 groups at the Bonferroni-adjusted significance level of 7.14E−04 (i.e., 0.05/70). The effect directions of these three SNPs were opposite in the two groups, indicating opposite patterns of associations between their minor/major alleles and metabolites concentrations in the E2 and E3 groups. In addition, the effects of these SNPs were nominally different between the E2 and E4 groups. Also, 12 associations with lipid analytes, comprising of 6 SNPs [i.e., the association of rs2965101 and rs17728272 (BCL3 variants) with TAG 56:5; rs7257468 (APOC2/APOC4-APOC2 variant), rs3760627, and rs2239375 (CLPTM1 variants) with LPEs 16:0, 18:0, and 20:4; and rs123187 (CKM variant) with PC 38:6] were significantly different between the E2 and E4 groups at P < 7.14E−04. Again, the effect directions of these SNPs were opposite in the two groups. Also, the effects of these SNPs were different between the E2 and E3 groups at nominal significance. The magnitudes of the estimated effects for these 15 SNPs were larger in the E2 group than the E3 or E4 group (Table 2 and Supplementary Table 1).
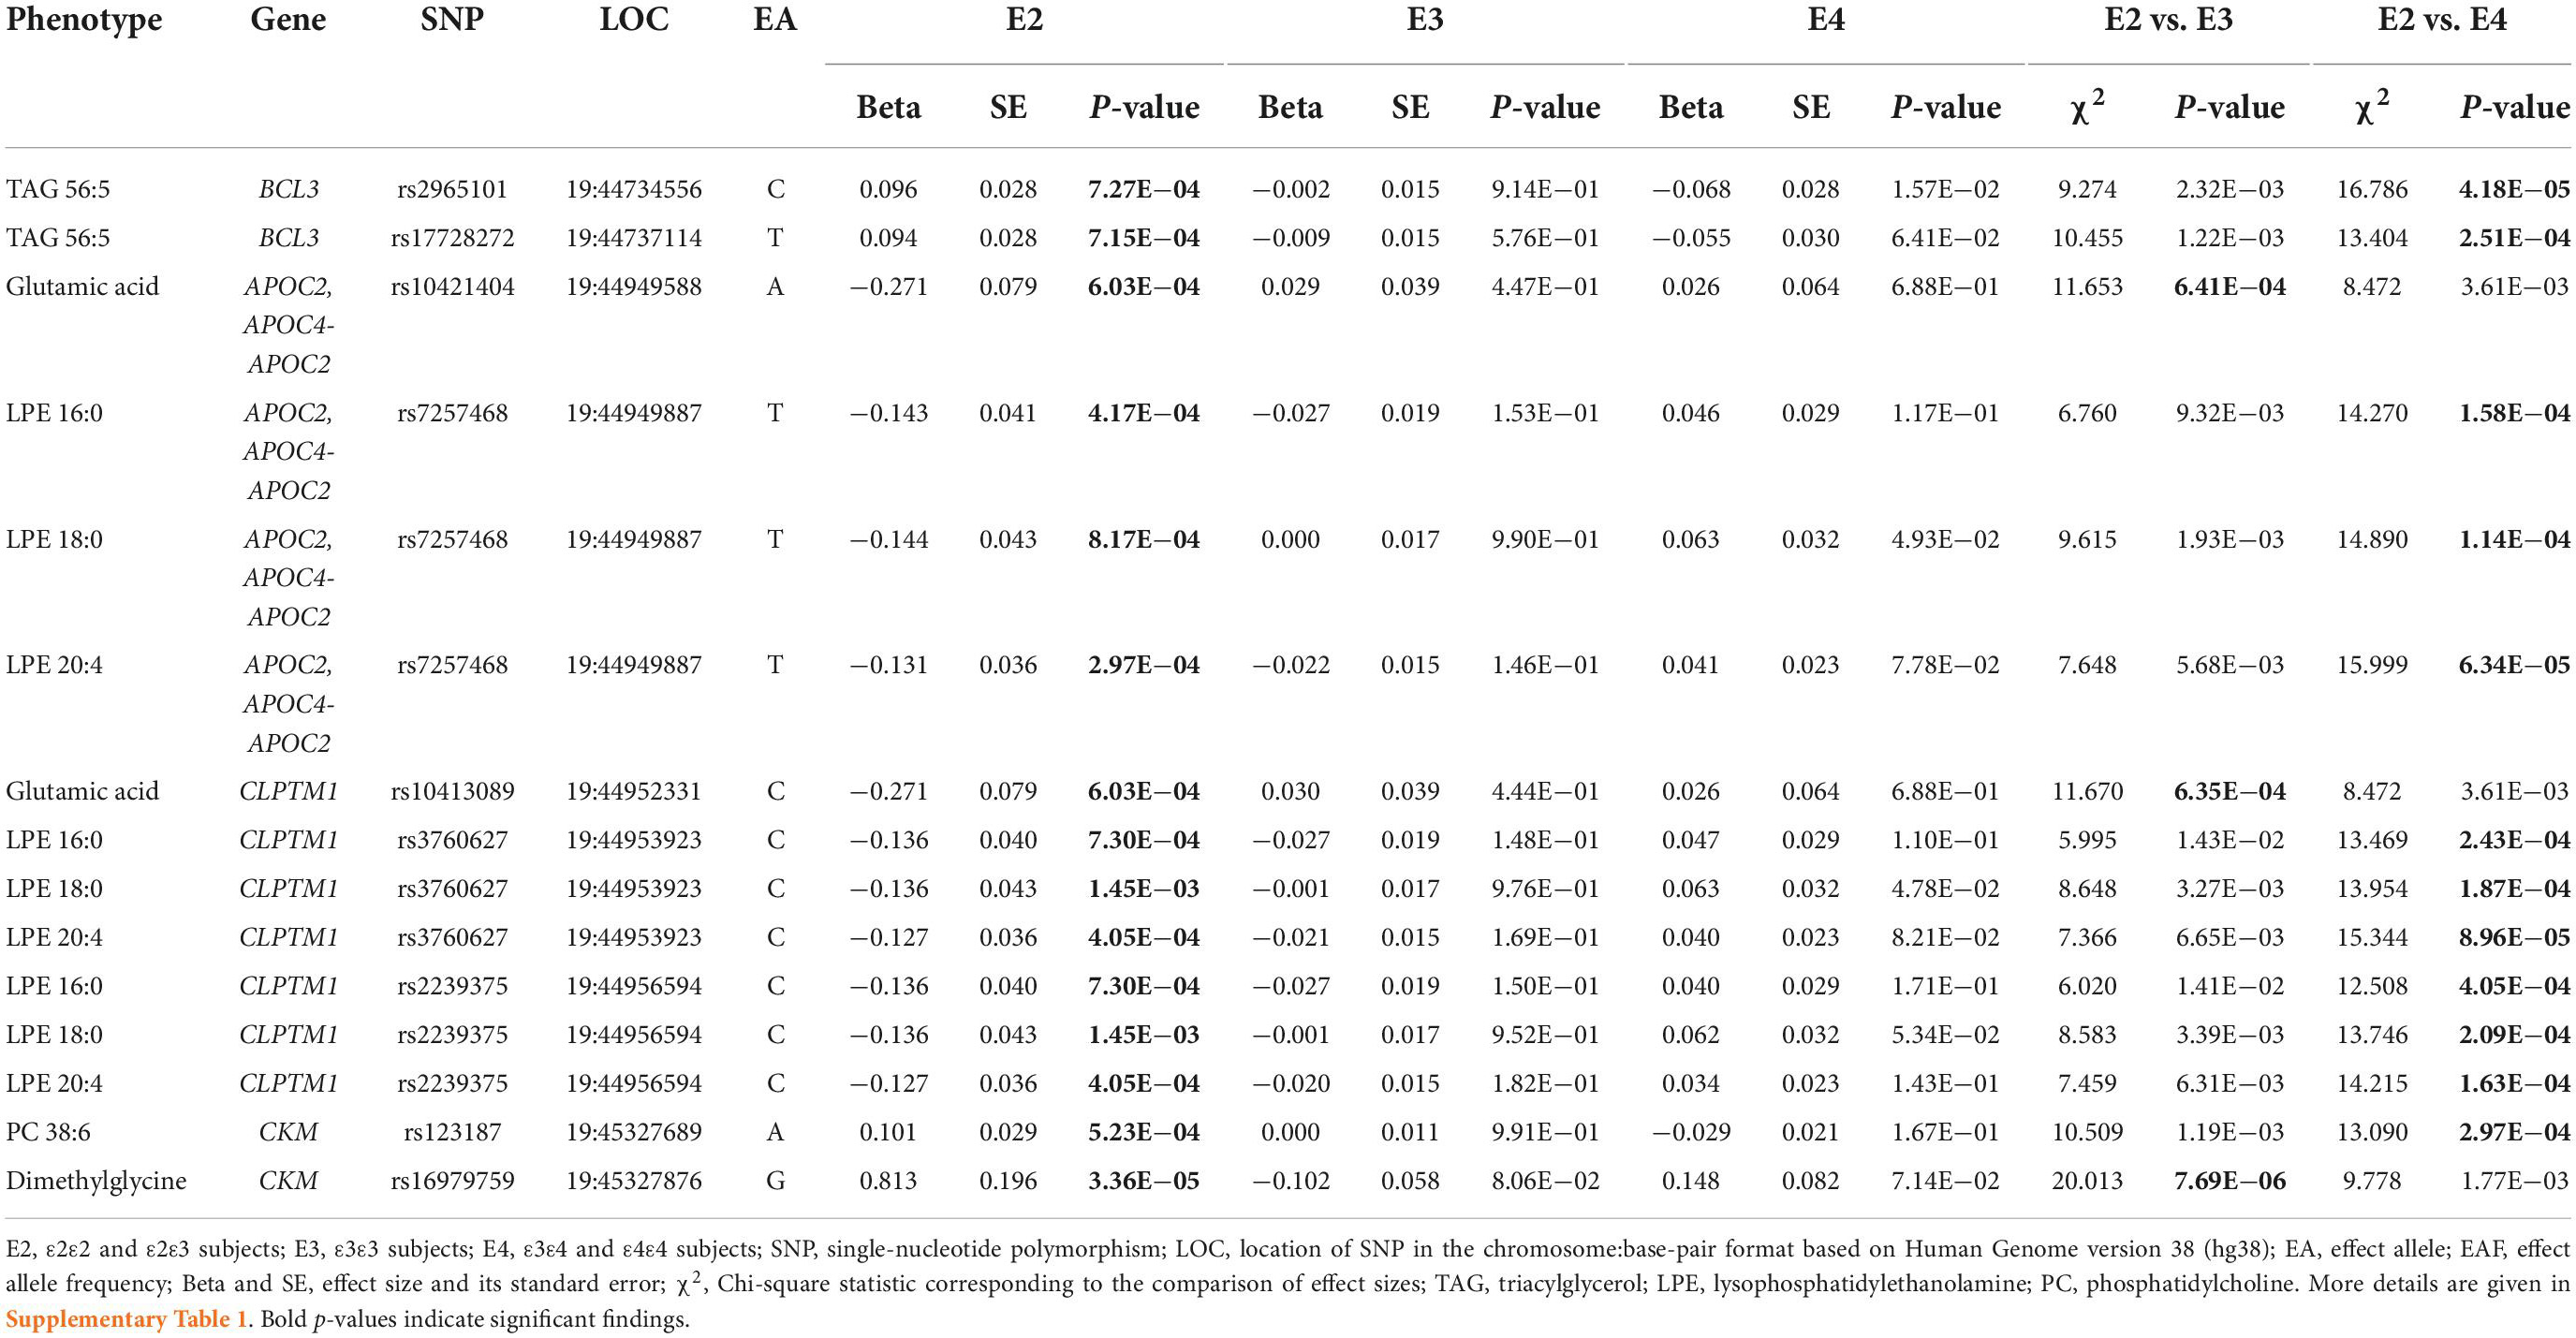
Table 2. Group-specific associations identified in the E2 group.
None of the SNP-metabolite associations identified in the E3 had group-specific effects in the chi-square test (Supplementary Table 2).
Among the SNP-metabolite associations identified in the E4 group, the associations of rs8105340 (NECTIN2 variant) with PCs 32:0, 32:1, and 34:0; rs519113 (NECTIN2 variant) with isocitrate; and rs1064725 (APOC1 variant) with propionate were significantly different between the E4 and E3 groups at the Bonferroni-adjusted level of P < 7.14E−04. The directions of effects for the associations of rs8105340 with the aforementioned three PCs were opposite in the E3 and E4 groups, however, the two other SNPs had the same directions of effects in the two groups. In addition, the effects of SNPs in the latter two associations were different between the E2 and E4 groups at nominal significance. The magnitudes of the estimated effects for these five SNPs were larger in the E4 group than the E3 group (Table 3 and Supplementary Table 3).
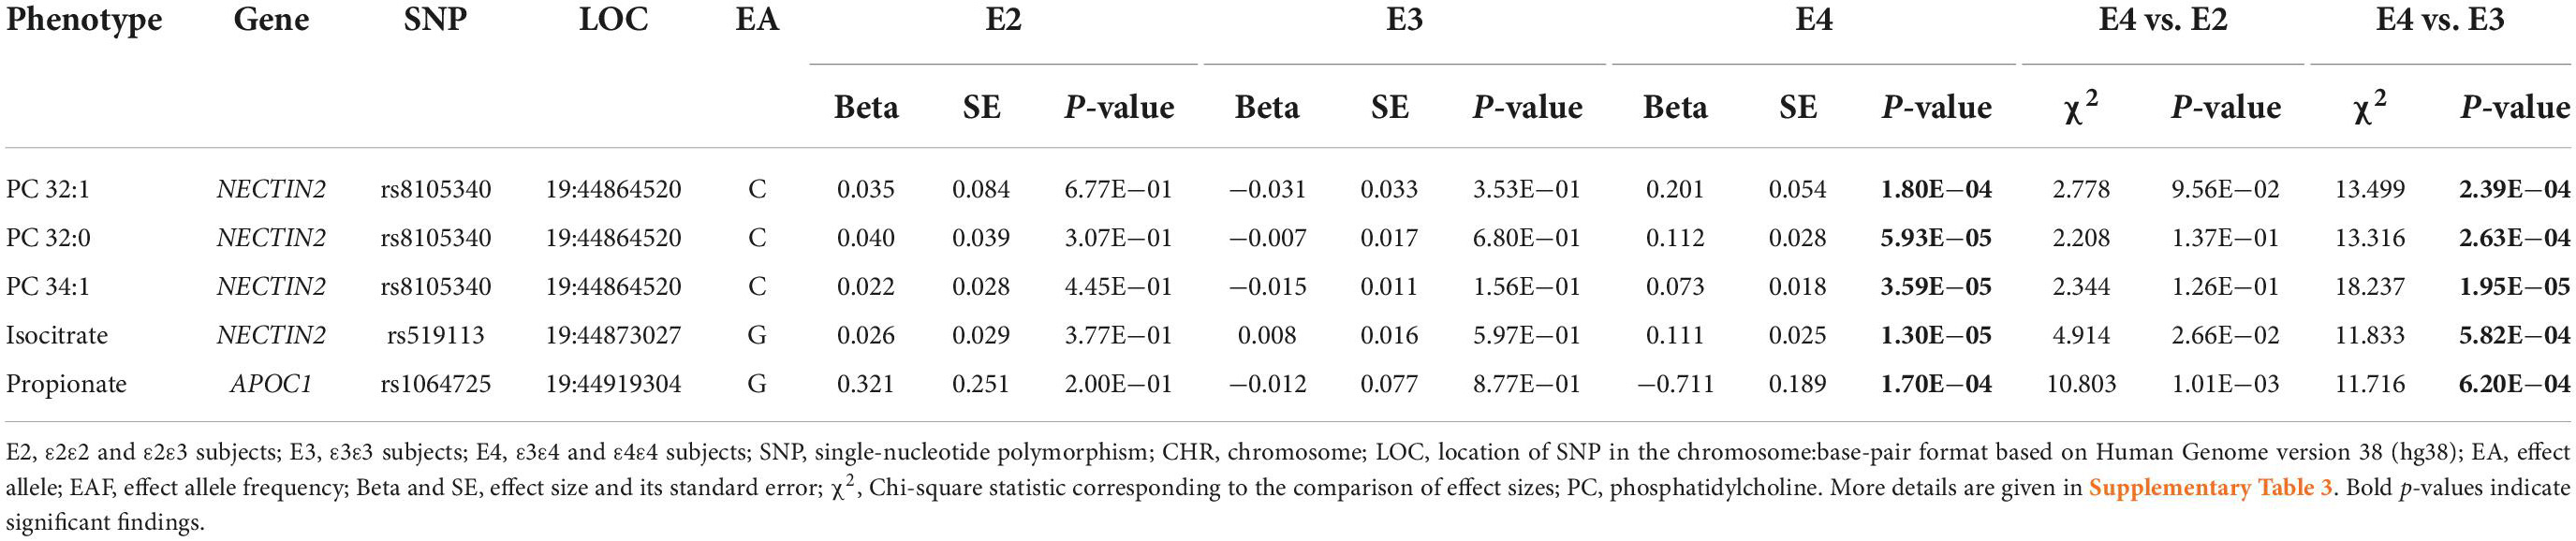
Table 3. Group-specific associations identified in the E4 group.
The interaction analyses corroborated the group-specific associations as all 20 interaction terms (i.e., SNP-by-APOE status terms) were significant (Supplementary Table 7). Of note, the interaction of 18 SNPs with APOE status attained the Bonferroni-adjusted P < 7.14E−04. Two exceptions were the associations of rs123187 with PC 38:6 (significantly different between E2 and E4 groups) and rs519113 with isocitrate (significantly different between E3 and E4 groups) whose interactions with the APOE status attained P < 8.49E−04 and P < 1.13E−03, respectively.
None of the effects of the group-specific SNPs were significantly different between males and females in chi-square tests (P > 0.05), indicating minimal impacts of biological sex on the identified associations.
Supplementary Table 8 and Supplementary Figure 1 summarizes information on the statistical distributions of metabolites with group-specific associations. The means of these 12 metabolites were significantly different from zero indicating that the identified associations were not pointing to the technical measurement variability, which may particularly be important in the case of low-abundance metabolites. Also, their means were not different among the E2, E3, and E4 groups (except TAG 56:5), as indicated by overlapping confidence intervals for a given metabolite in these groups.
Association analysis in the pooled E2, E3, and E4 sample
Among 70 SNP-metabolite associations identified in the E2, E3, or E4 group, only 9 associations attained PFDR < 0.05 in the pooled sample of these groups (Supplementary Table 9). They included associations of rs7412 with TAGs 56:3 and 56:4 (primarily identified in the E2 group), rs5157, rs5167, rs2288912, rs7257468, rs3760627, and rs2239375 with CE 20:3, and rs12721109 with TAG 56:4 (primarily identified in the E3 group). None of them were among the 20 group-specific associations.
The pooled sample analyses (Supplementary Table 10) showed that the APOE SNPs (rs429358 and rs7412) were not associated with 32 metabolites of interest at PFDR < 0.05, except for the associations of rs7412 with TAGs 56:3 and 56:4.
APOE-allele-specific clustering of the identified associations
SNPs associated with plasma metabolites were mapped to 8, 6, and 10 genes in the E2, E3, and E4 groups, respectively. Of them, 2, 1, and 4 genes were uniquely linked to these groups, respectively Figure 1 [plotted using Gviz R package (Hahne and Ivanek, 2016)] and Supplementary Table 11. The clustering analysis of associations of lipid and polar metabolites separately showed that 6, 3, and 4 genes from the APOE region were associated with lipid metabolites in the E2, E3, and E4 groups, respectively. Of them, 2 and 3 genes were exclusively linked to the E2 and E4 groups, respectively. In addition, SNPs mapped to 6, 3, and 7 genes were associated with polar analytes in the E2, E3, and E4 groups, respectively, of which the associations of 2, 2, and 4 genes were unique in these groups, respectively.
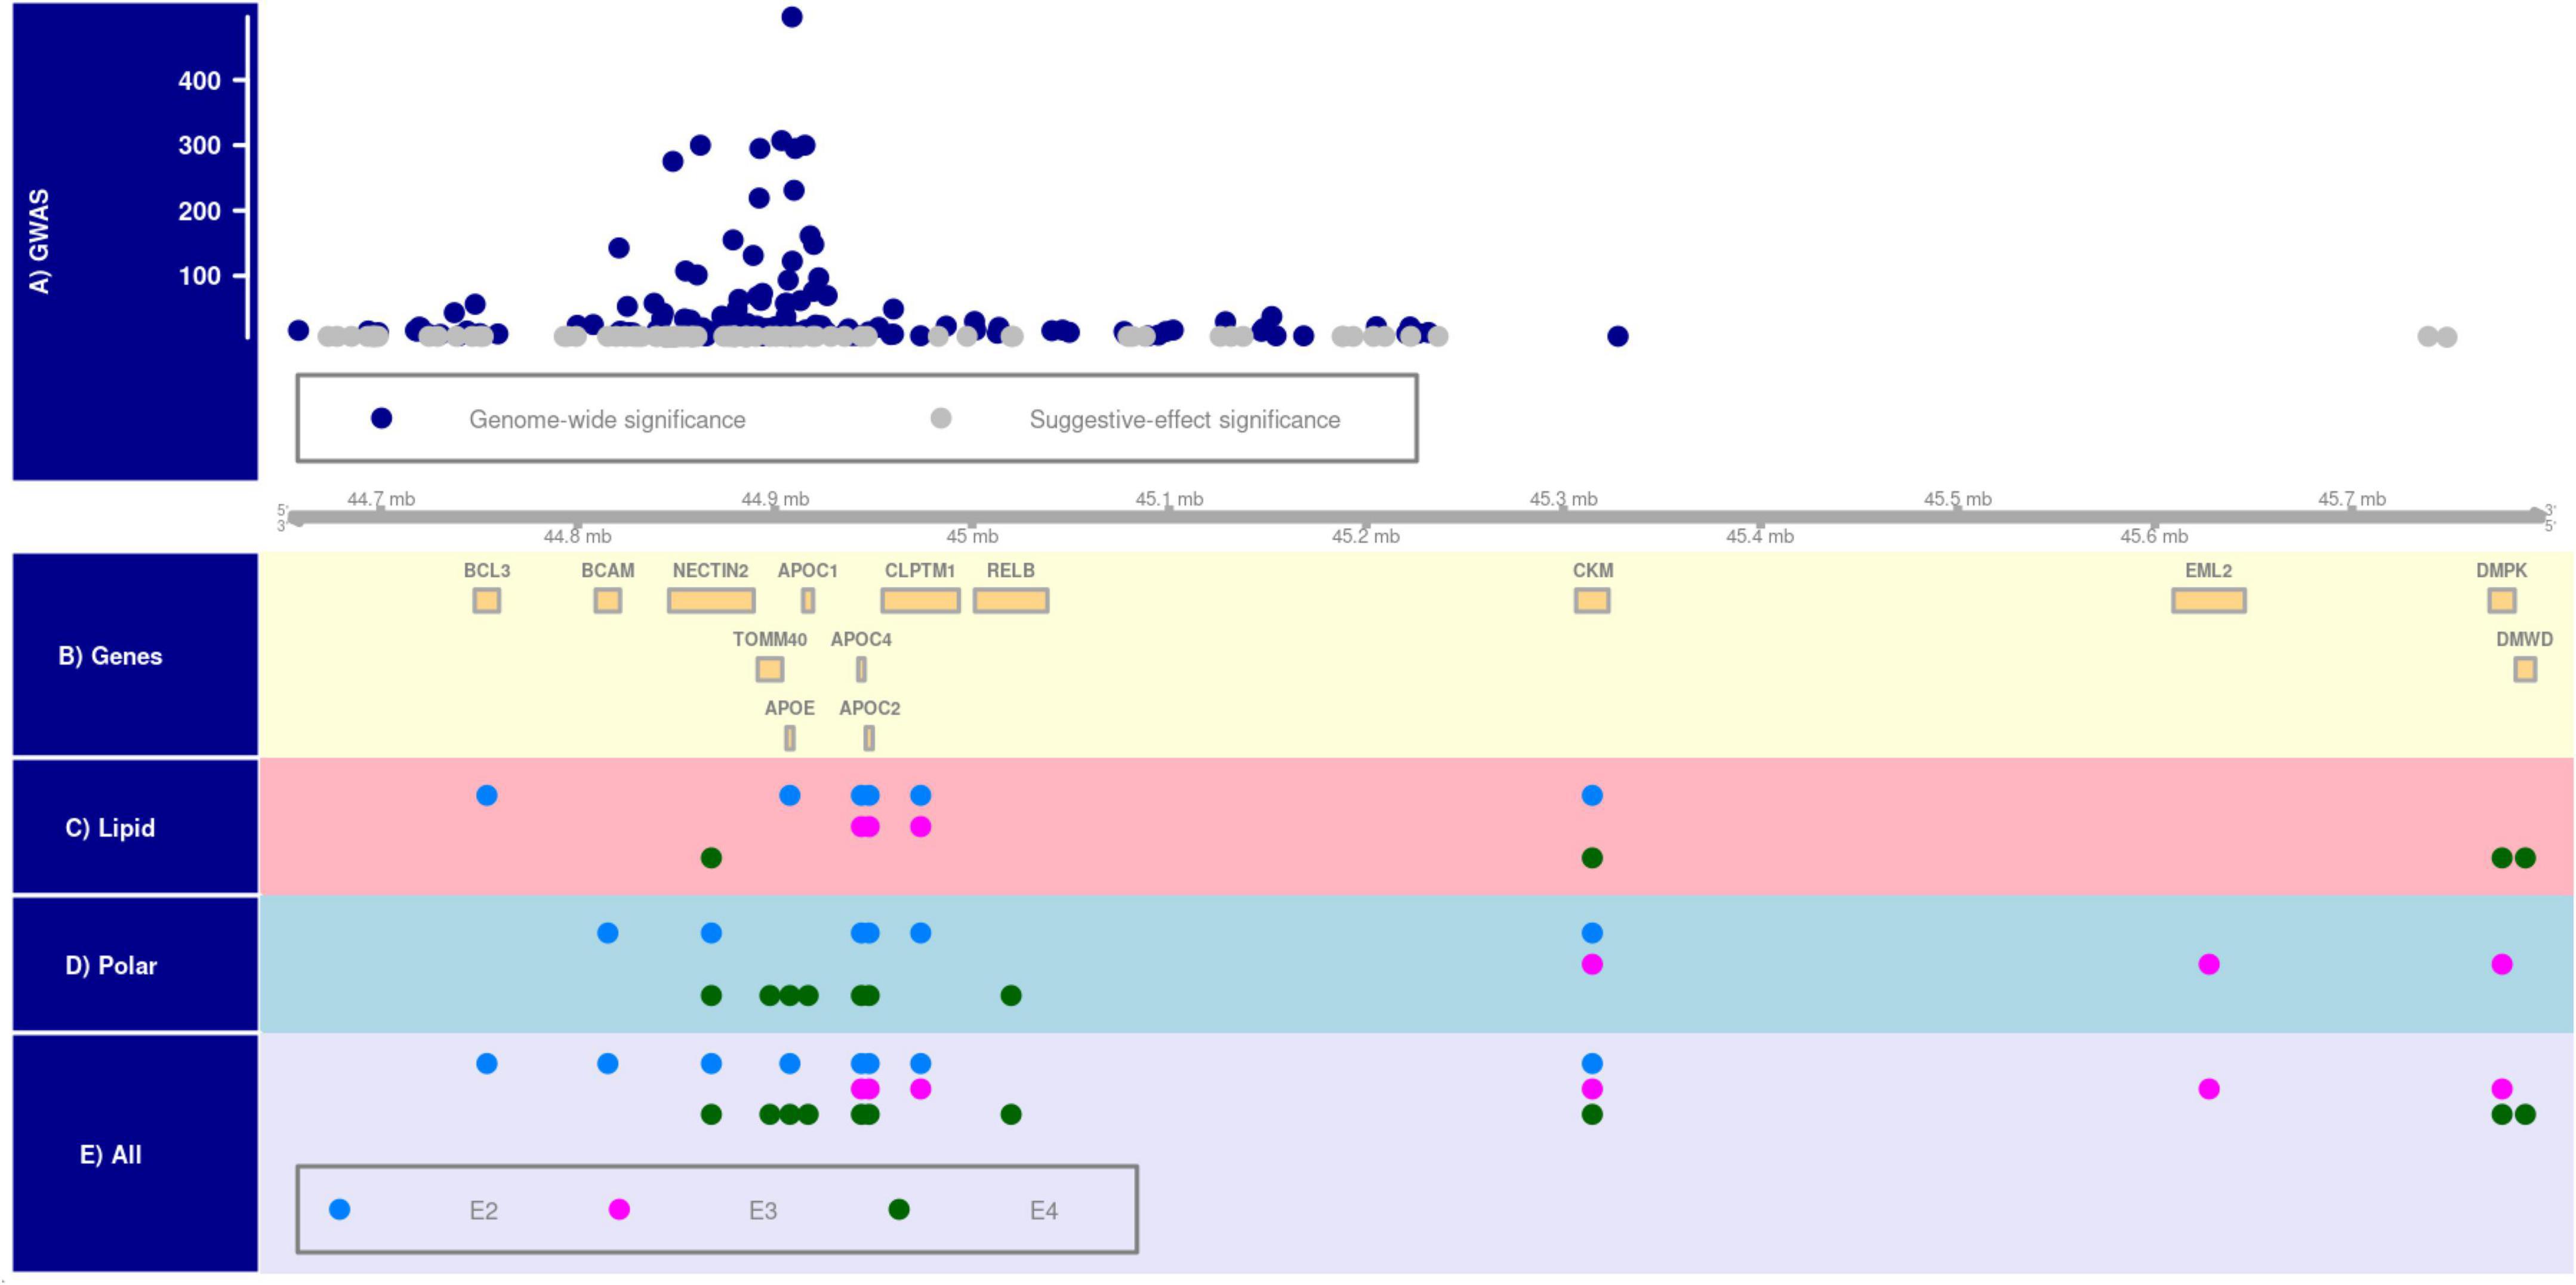
Figure 1. APOE-allele-specific clustering of genes identified for all metabolites, lipid metabolites, and polar metabolites. Panel (A) shows the distribution of –log (p-value) of Alzheimer’s disease-associated SNPs at genome-wide (i.e., P < 5E–08) and suggestive-effect (i.e., 5E–08 ≤ P < 5E–06) significance levels in the 19q13.3 region [chromosomal positions are based on Human Genome version 38 (hg38) and shown in mega base-pair format]. Panel (B) shows the location of genes in this locus. Panels (C–E) show metabolite-by-gene associations for polar, lipid, and all metabolites in the E2 (ε2ε2 and ε2ε3 subjects), E3 (ε3ε3 subjects), and E4 (ε3ε4 and ε4ε4 subjects) groups.
Pathway enrichment
The KEGG pathways enriched by lipid and polar metabolites, which were associated with APOE region SNPs in the E2, E3, or E4 groups, are displayed in Supplementary Figures 2–7. Most of the identified genetic associations (Supplementary Tables 1–3) were with lipid metabolites containing saturated and unsaturated FAs in their structures (Wishart et al., 2007) involved in lipid metabolism pathways, such as biosynthesis of unsaturated fatty acids, fatty acid elongation, and fatty acid degradation pathways (Supplementary Figures 2, 4, 6). Due to small number of polar metabolites with significant associations (3, 3, and 6 metabolites in the E2, E3, and E4 groups, respectively), most of pathways enriched by them (Supplementary Figures 3, 5, 7) contained only one metabolite. The top enriched pathways containing two or more polar analytes included D-glutamine and D-glutamate metabolism (E2 group); alanine, aspartate and glutamate metabolism, and aminoacyl-tRNA biosynthesis (E3 group); tricarboxylic acid cycle (TCA, also known as citrate cycle), and glyoxylate and dicarboxylate metabolism (E4 group) (Table 4).
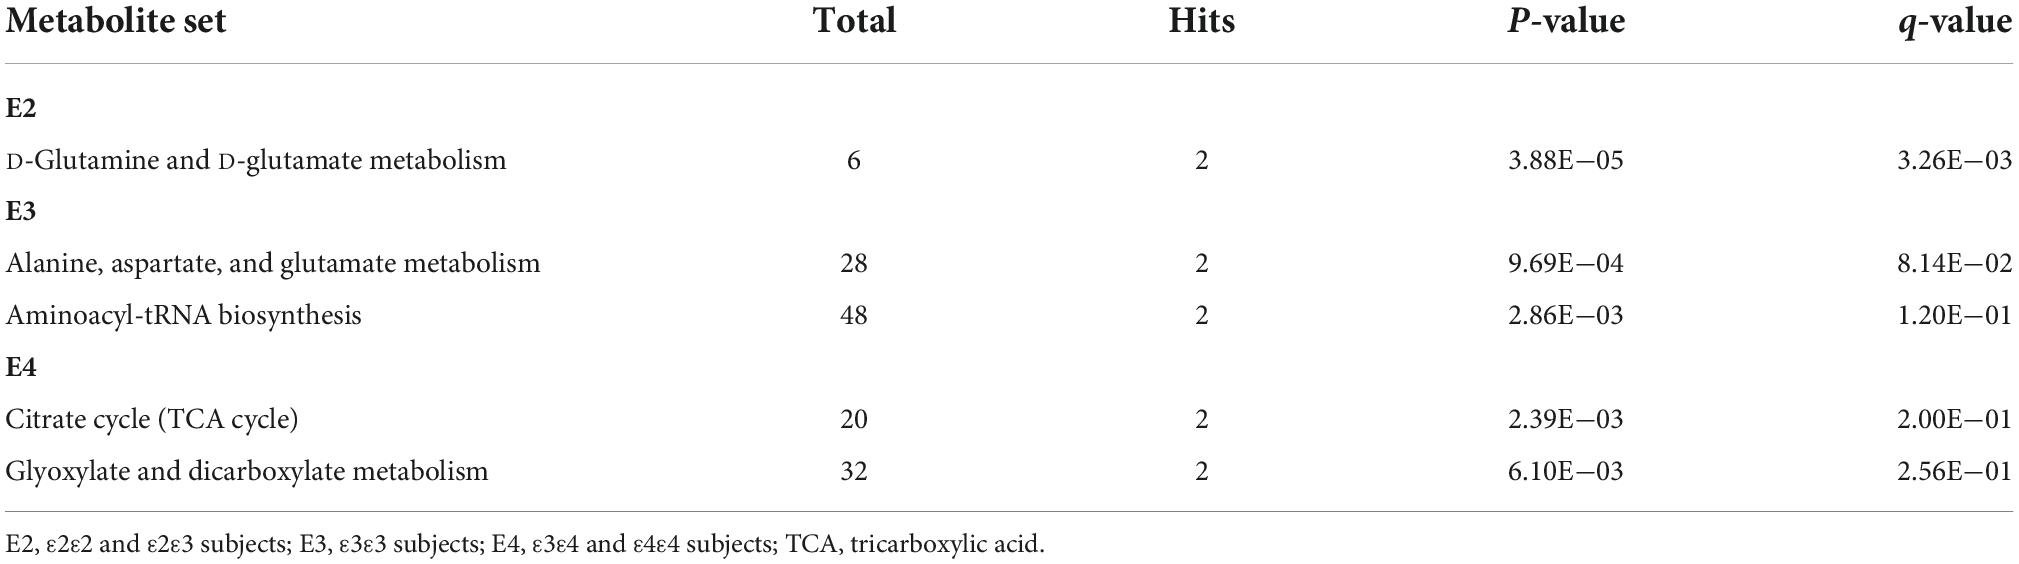
Table 4. Top pathways enriched by non-lipid metabolites in the E2, E3, and E4 groups.
Discussion
The APOE alleles differentially contribute to several complex diseases and traits. We performed stratified univariate analysis on the associations of 94 SNPs in the APOE gene cluster with 217 available plasma metabolites, to understand how APOE alleles may modify these associations. Our analyses revealed 31, 17, and 22 SNP-metabolite associations in the E2, E3, and E4 groups, respectively (Supplementary Tables 1–3). Of these 70 associations, 51 were with 20 lipid metabolites and 19 with 12 polar analytes. None of these associations were previously reported in samples not stratified by APOE alleles at the genome-wide (P < 5E−08) or suggestive-effect (5E−08 ≤ P < 5E−06) significance levels (Mittelstrass et al., 2011; Rhee et al., 2013; Shin et al., 2014; Demirkan et al., 2015; Draisma et al., 2015; Krumsiek et al., 2015; Long et al., 2017; Lotta et al., 2021).
We reviewed the GWAS catalog to identify links between metabolite-associated SNPs and other phenotypes (MacArthur et al., 2017). In addition to AD, we uncovered extensive associations with lipid traits. In the E2 group, rs10402271 was previously associated with TC, LDL-C, and HDL-C and rs10421404 was linked to LDL-C. Additionally, the ε2 encoding rs7412 showed extensive pleiotropy with TC, LDL-C, HDL-C, TG, apolipoprotein B (Apo-B), apolipoprotein A1 (Apo-A1), and lipoprotein (a). In the E3 group, we found rs12721109 was previously associated with TC, LDL-C, TG, Apo-B, Apo-A1, and lipoprotein (a). Furthermore, rs5167 showed associations with HDL-C and TG. In the E4 group, GWAS have identified associations of rs12610605 and rs1064725 with TG, rs519113 with HDL-C, rs8106922 with TC and LDL-C, and rs769450 with TC, LDL-C, Apo-B, and lipoprotein (a).
Interestingly, we found the effects of 15 SNP-metabolite associations for nine SNPs in the E2 group were significantly different between the E2 and E3 groups (3 associations) or the E2 and E4 groups (12 associations) (Table 2 and Supplementary Tables 1, 7). The former three associations were linked to two polar analytes (glutamic acid and dimethylglycine), whereas the latter 12 were linked to lipid analytes. Of these 12 associations, six were with LPE 20:4, PC 38:6, and TAG 56:5, which included ω-3 or ω-6 PUFAs in their structures (Wishart et al., 2007). In the E4 group, we found five SNP-metabolite associations for three SNPs with significantly different effects between the E4 and E3 groups (Table 3 and Supplementary Tables 3, 7). Three SNP-metabolite associations were with phosphatidylcholines, and the other two were with isocitrate and propionate polar analytes. None of these group-specific SNP-metabolite associations were significant in the pooled sample of the E2, E3, and E4 groups. The group-specific associations indicate genetic heterogeneity of plasma metabolites in the APOE 19q13.3 locus, which is in line with our previous studies that demonstrated complex LD structure differentially affects AD risk in this locus (Kulminski et al., 2018, 2020a,b; Nazarian et al., 2022a,b). Therefore, we suggest APOE-stratified analyses are essential for dissecting the genetic architecture of complex diseases and traits sensitive to APOE ε2/ε3/ε4 polymorphism.
Allele-specific clustering of the identified associations showed higher genetic variation of plasma metabolites in the E4 group compared to the E2 and E3 groups (Figure 1 and Supplementary Table 11), which may reflect evolutionary adaptation. Indeed, it is hypothesized that the ε3 allele evolved from the ancestral ε4 allele about 0.266 million years ago due to adaptation to meet consumption (Finch, 2012), followed by the ε2 allele (McIntosh et al., 2012; Huebbe and Rimbach, 2017). Consequently, more genetic variability and less robustness are expected in genetic networks linked to the ε4 allele compared to the other two alleles. Interestingly, the E4-associated genetic variations did not overlap with that of the E3 group in lipid and polar metabolites. This observation may suggest diverging molecular mechanisms in evolution of the ε3 allele.
Most of the identified genetic associations in our study were with lipid metabolites, many of which contained PUFAs (Wishart et al., 2007). Altered lipid metabolism has been implicated in the pathogenesis of diseases whose risks are modified by APOE ε2/ε3/ε4 polymorphism, such as AD (Zhu et al., 2019; Castor et al., 2020; Yin, 2022) and CAD (Freeman, 2006; Park et al., 2015; Cohain et al., 2021). Associations with PUFA-containing metabolites were more abundant in the E2 group than in the other two groups. PUFAs and their derivatives mediate FA signaling and are essential for neuron survival and function (Bazinet and Layé, 2014), and are involved in cellular immunity and neuroinflammation (Bazinet and Layé, 2014; Panda et al., 2022). Multiple studies have suggested ω-3 PUFA intake or supplementation can attenuate cognitive decline and dementia, particularly in people with sub-optimal plasma levels (Tully et al., 2003; Schaefer et al., 2006; Cherubini et al., 2007; Lopez et al., 2011; Yamagishi et al., 2017; Yanai, 2017; Hooper et al., 2018). Additionally, ω-3 PUFAs may be cardioprotective (Siscovick et al., 2017; Pizzini et al., 2018).
In addition, polar metabolites associated with APOE region SNPs in the E2, E3, and E4 groups have been implicated in AD (Jiménez-Jiménez et al., 1998; Selley, 2003; Dobolyi et al., 2011; Gueli and Taibi, 2013; Kaddurah-Daouk et al., 2013; Wang et al., 2014; Ansoleaga et al., 2015; González-Domínguez et al., 2015; Luo et al., 2015; Syeda et al., 2018; Baumel et al., 2021) and CAD (Valkonen et al., 2001; Bäckström et al., 2003; Lewis et al., 2008; Tveitevåg Svingen et al., 2013; Bartolomaeus et al., 2019; Cappola et al., 2019). For instance, AD patients had higher CSF levels (Jiménez-Jiménez et al., 1998) and a decreased cortical (temporal cortex) concentration (Gueli and Taibi, 2013) of glutamate. AD was also associated with lower plasma and CSF asparagine levels (Jiménez-Jiménez et al., 1998), as well as higher aspartate concentration in plasma (Jiménez-Jiménez et al., 1998) and lower aspartate concentration in the temporal cortex (Gueli and Taibi, 2013). Furthermore, AD was associated with increased plasma ADMA levels (Selley, 2003; Luo et al., 2015), as well as higher xanthosine in CSF (Kaddurah-Daouk et al., 2013) and lower xanthosine concentration in the entorhinal cortex (Ansoleaga et al., 2015). Also, AD mouse models had elevated propionate concentrations in the prefrontal cortex (Syeda et al., 2018) and hippocampus (González-Domínguez et al., 2015). In contrast, uridine dietary supplementation may slow brain atrophy and improve cognition in early AD stages (Dobolyi et al., 2011; Baumel et al., 2021).
Differential pathways enrichment of polar metabolite between APOE allele groups, such as enrichment of D-glutamine and D-glutamate metabolism in the E2 group and TCA cycle and glyoxylate and dicarboxylate metabolism in the E4 group (Table 4), is in line with previous reports that APOE alleles differentially impact the efficiency of various cellular metabolic processes (Konttinen et al., 2019; Williams et al., 2020). The ε4 allele is associated with decreased glucose uptake, and increased processes like lactate production from anaerobic glycolysis, glucose flux into the pentose phosphate pathway, gluconeogenesis (Williams et al., 2020), and utilization of PUFAs for energy production through calcium-dependent activation of phospholipase A2 signaling (Wang et al., 2022). Different brain regions of cognitively normal ε4 carriers have shown glucose hypometabolism, similar to AD patients (Reiman et al., 1996, 2004). In addition, the ε4 allele contributes to a higher pyruvate carboxylase to pyruvate dehydrogenase activity ratio and enrichment of glucose-derived carbon in TCA cycle. In contrast, the ε2 allele, and to some extent the ε3 allele, is associated with more efficient glucose uptake, increased glucose flux into glycolysis and oxidative TCA metabolism, decreased pyruvate carboxylase to pyruvate dehydrogenase activity ratio, and increased glutaminase enzyme levels which affect utilization of glutamine in TCA cycle (Williams et al., 2020). These metabolic differences are critical because disruption of mitochondrial glucose metabolism increases FAs metabolism, which can expose neurons to oxidative damage from PUFAs and monounsaturated FAs catabolism and increase the levels of oxidized dicarboxylic acids (DCAs) in urine. Indeed, elevated urinary excretion of DCAs may be a biomarker for early AD (Castor et al., 2020).
Despite the rigor, our study has limitations. The statistical power of our association analyses in the E2 and E4 groups was not optimal because the frequencies of the ε2 and ε4 alleles are substantially smaller in the general population than the frequency of the ε3 alleles. This disproportion may increase the number of false negatives in the E2 and E4 groups compared with the E3 group. However, this problem is partly offset by the significant findings in the comparative analysis of the group-specific effects. In addition, since we were interested in the potential modulatory effects of the APOE alleles on SNP-metabolite associations, the E2 and E4 groups included subjects with 1 or 2 copies of the ε2 and ε4 alleles, respectively. Future analyses may further refine these results by stratifying these two groups into heterozygotes and minor-allele homozygotes. Data with substantially larger sample sizes, however, is required for this analysis due to the small frequency of the ε2 and ε4 homozygotes in the general population. The analysis of independent studies will also help to replicate our findings and generalize them to other populations. Finally, the statistical power of our pathway enrichment analyses is not optimal due to the small number of metabolites having significant genetic associations.
Conclusion
Our APOE-stratified analyses of the genetic heterogeneity of plasma metabolites identified 70 novel SNP-metabolite associations in the APOE 19q13.3 locus. Most of these associations were with lipid metabolites. The non-lipid metabolites were mainly enriched in pathways related to amino acid metabolism and the TCA cycle, which are differentially impacted by the APOE alleles. Consistent with the evolutionary history of the APOE alleles, the genetic architecture of plasma metabolites in the ε4 carriers entailed higher variation in the APOE genes cluster compared to the ε2 and ε3ε3 carriers. Importantly, twenty of these associations were found to be group-specific as the SNP effects were statistically different between subjects with different APOE alleles. These findings provide novel insights into the genetic heterogeneity of plasma metabolites at this locus and highlight the importance of the APOE-stratified analyses of diseases and traits differentially impacted by APOE alleles.
Data availability statement
The FHS data used in this study can be obtained by qualified researchers from dbGaP (https://www.ncbi.nlm.nih.gov/gap/). The FHS data were accessed upon approval by the Duke University Institutional Review Board (IRB) and all analyses were performed following the IRB guidelines. Requests to access these datasets should be directed to https://www.ncbi.nlm.nih.gov/gap/.
Ethics statement
This work focuses on the secondary analysis of data obtained from dbGaP upon approval by the Duke University Institutional Review Board (IRB) and does not involve gathering data from human subjects directly.
Author contributions
AN and AMK designed the study. EL contributed to data preparation. AN analyzed the data. CEF and HNY provided the critical feedback. AN, AMK, CEF, and HNY wrote and revised the manuscript. All authors have read and approved the final manuscript.
Funding
This research was supported by Grants from the National Institute on Aging R01 AG047310 (AMK), R01 AG061853 (AMK), R01 AG065477 (AMK), R01 AG070488 (AMK), P01 AG055367 (CEF), P50 AG05142 (CEF), RF1 AG054442 (CEF), RF1 AG076124 (HNY), R01 AG055770 (HNY), R01 AG067063 (HNY), R01 AG054434 (HNY), R21 AG056518 (HNY), and P30 AG066530 (HNY). The funders had no role in study design, data collection and analysis, decision to publish, or manuscript preparation. The content is solely the responsibility of the authors and does not necessarily represent the official views of the National Institutes of Health.
Acknowledgments
This manuscript was prepared using limited access Framingham Heart Study (FHS) data obtained from dbGaP (accession number: phs000007.v28.p10). The Framingham Heart Study (FHS) is conducted and supported by the National Heart, Lung, and Blood Institute (NHLBI) in collaboration with Boston University (Contract Nos. N01-HC-25195 and HHSN268201500001I). This manuscript was not prepared in collaboration with investigators of the FHS and does not necessarily reflect the opinions or views of the FHS, Boston University, or NHLBI. Funding for SHARe Affymetrix genotyping was provided by NHLBI Contract N02-HL-64278. SHARe Illumina genotyping was provided under an agreement between Illumina and Boston University. Funding for CARe genotyping was provided by NHLBI Contract N01-HC-65226. Funding support for the Framingham Dementia dataset was provided by NIH/NIA grant R01 AG08122. Funding support for the Framingham Inflammatory Markers was provided by NIH grants R01 HL064753, R01 HL076784, and R01 AG028321. Funding support for the Framingham C-reactive Protein dataset was provided by NIH grants R01 HL064753, R01 HL076784, and R01 AG028321. Funding support for the Framingham Adiponectin dataset was provided by NIH/NHLBI grant R01-DK-080739. Funding support for the Framingham Interleukin-6 dataset was provided by NIH grants R01 HL064753, R01 HL076784, and R01 AG028321.
Conflict of interest
The authors declare that the research was conducted in the absence of any commercial or financial relationships that could be construed as a potential conflict of interest.
Publisher’s note
All claims expressed in this article are solely those of the authors and do not necessarily represent those of their affiliated organizations, or those of the publisher, the editors and the reviewers. Any product that may be evaluated in this article, or claim that may be made by its manufacturer, is not guaranteed or endorsed by the publisher.
Supplementary material
The Supplementary Material for this article can be found online at: https://www.frontiersin.org/articles/10.3389/fnagi.2022.1023493/full#supplementary-material
References
Allison, P. D. (1999). Comparing logit and probit coefficients across groups. Sociol. Methods Res. 28, 186–208. doi: 10.1177/0049124199028002003
Andreou, D., Söderman, E., Axelsson, T., Sedvall, G. C., Terenius, L., Agartz, I., et al. (2015). Cerebrospinal fluid monoamine metabolite concentrations as intermediate phenotypes between glutamate-related genes and psychosis. Psychiatry Res. 229, 497–504. doi: 10.1016/j.psychres.2015.06.023
Ansoleaga, B., Jové, M., Schlüter, A., Garcia-Esparcia, P., Moreno, J., Pujol, A., et al. (2015). Deregulation of purine metabolism in Alzheimer’s disease. Neurobiol. Aging 36, 68–80. doi: 10.1016/j.neurobiolaging.2014.08.004
Arellanes, I. C., Choe, N., Solomon, V., He, X., Kavin, B., Martinez, A. E., et al. (2020). Brain delivery of supplemental docosahexaenoic acid (DHA): A randomized placebo-controlled clinical trial. EBio Med. 59:102883. doi: 10.1016/j.ebiom.2020.102883
Babenko, V. N., Afonnikov, D. A., Ignatieva, E. V., Klimov, A. V., Gusev, F. E., and Rogaev, E. I. (2018). Haplotype analysis of APOE intragenic SNPs. BMC Neurosci. 19:16. doi: 10.1186/s12868-018-0413-4
Bäckström, T., Goiny, M., Lockowandt, U., Liska, J., and Franco-Cereceda, A. (2003). Cardiac outflow of amino acids and purines during myocardial ischemia and reperfusion. J. Appl. Physiol. 94, 1122–1128. doi: 10.1152/japplphysiol.00138.2002
Barberger-Gateau, P., Samieri, C., Féart, C., and Plourde, M. (2011). Dietary omega 3 polyunsaturated fatty acids and Alzheimer’s disease: Interaction with Apolipoprotein E genotype. Curr. Alzheimer Res. 8, 479–491. doi: 10.2174/156720511796391926
Bartolomaeus, H., Balogh, A., Yakoub, M., Homann, S., Markó, L., Höges, S., et al. (2019). Short-chain fatty acid propionate protects from hypertensive cardiovascular damage. Circulation 139, 1407–1421. doi: 10.1161/CIRCULATIONAHA.118.036652
Baumel, B. S., Doraiswamy, P. M., Sabbagh, M., and Wurtman, R. (2021). Potential neuroregenerative and neuroprotective effects of uridine/choline-enriched multinutrient dietary intervention for mild cognitive impairment: A narrative review. Neurol. Ther. 10, 43–60. doi: 10.1007/s40120-020-00227-y
Bazinet, R. P., and Layé, S. (2014). Polyunsaturated fatty acids and their metabolites in brain function and disease. Nat. Rev. Neurosci. 15, 771–785. doi: 10.1038/nrn3820
Belloy, M. E., Napolioni, V., and Greicius, M. D. (2019). A quarter century of APOE and Alzheimer’s disease: Progress to date and the path Forward. Neuron 101, 820–838. doi: 10.1016/j.neuron.2019.01.056
Benjamini, Y., and Hochberg, Y. (1995). Controlling the false discovery rate: A practical and powerful approach to multiple testing. J. R. Stat. Soc. Series B 57, 289–300. doi: 10.2307/2346101
Cappola, A. R., Desai, A. S., Medici, M., Cooper, L. S., Egan, D., Sopko, G., et al. (2019). Thyroid and cardiovascular disease. Circulation 139, 2892–2909. doi: 10.1161/CIRCULATIONAHA.118.036859
Castor, K. J., Shenoi, S., Edminster, S. P., Tran, T., King, K. S., Chui, H., et al. (2020). Urine dicarboxylic acids change in pre-symptomatic Alzheimer’s disease and reflect loss of energy capacity and hippocampal volume. PLoS One 15:e0231765. doi: 10.1371/journal.pone.0231765
Cherubini, A., Andres-Lacueva, C., Martin, A., Lauretani, F., Iorio, A. D., Bartali, B., et al. (2007). Low plasma N-3 fatty acids and dementia in older persons: The InCHIANTI study. J. Gerontol. A Biol. Sci. Med. Sci. 62, 1120–1126. doi: 10.1093/gerona/62.10.1120
Cohain, A. T., Barrington, W. T., Jordan, D. M., Beckmann, N. D., Argmann, C. A., Houten, S. M., et al. (2021). An integrative multiomic network model links lipid metabolism to glucose regulation in coronary artery disease. Nat. Commun. 12:547. doi: 10.1038/s41467-020-20750-8
Conomos, M. P., Miller, M. B., and Thornton, T. A. (2015). Robust inference of population structure for ancestry prediction and correction of stratification in the presence of relatedness. Genet. Epidemiol. 39, 276–293. doi: 10.1002/gepi.21896
Demirkan, A., Henneman, P., Verhoeven, A., Dharuri, H., Amin, N., van Klinken, J. B., et al. (2015). Insight in genome-wide association of metabolite quantitative traits by exome sequence analyses. PLoS Genet. 11:e1004835. doi: 10.1371/journal.pgen.1004835
Dobolyi, A., Juhász, G., Kovács, Z., and Kardos, J. (2011). Uridine function in the central nervous system. Curr. Top. Med. Chem. 11, 1058–1067. doi: 10.2174/156802611795347618
Draisma, H. H. M., Pool, R., Kobl, M., Jansen, R., Petersen, A.-K., Vaarhorst, A. A. M., et al. (2015). Genome-wide association study identifies novel genetic variants contributing to variation in blood metabolite levels. Nat. Commun. 6:7208. doi: 10.1038/ncomms8208
Feinleib, M., Kannel, W. B., Garrison, R. J., McNamara, P. M., and Castelli, W. P. (1975). The Framingham offspring study: Design and preliminary data. Prev. Med. 4, 518–525. doi: 10.1016/0091-7435(75)90037-7
Finch, C. E. (2012). Evolution of the human lifespan, past, present, and future: Phases in the evolution of human life expectancy in relation to the inflammatory load. Proc. Am. Philos. Soc. 156, 9–44.
Freeman, M. W. (2006). “Lipid Metabolism and Coronary Artery Disease,” in Principles of Molecular Medicine, eds M. S. Runge and C. Patterson (Totowa, NJ: Humana Press), 130–137. doi: 10.1007/978-1-59259-963-9_15
Gogarten, S. M., Sofer, T., Chen, H., Yu, C., Brody, J. A., Thornton, T. A., et al. (2019). Genetic association testing using the GENESIS R/Bioconductor package. Bioinformatics 35, 5346–5348. doi: 10.1093/bioinformatics/btz567
Gomar, J. J., Gordon, M. L., Dickinson, D., Kingsley, P. B., Uluğ, A. M., Keehlisen, L., et al. (2014). APOE genotype modulates proton magnetic resonance spectroscopy metabolites in the aging brain. Biol. Psychiatry 75, 686–692. doi: 10.1016/j.biopsych.2013.05.022
González-Domínguez, R., García-Barrera, T., Vitorica, J., and Gómez-Ariza, J. L. (2015). Metabolomic screening of regional brain alterations in the APP/PS1 transgenic model of Alzheimer’s disease by direct infusion mass spectrometry. J. Pharm. Biomed. Anal. 102, 425–435. doi: 10.1016/j.jpba.2014.10.009
Gueli, M. C., and Taibi, G. (2013). Alzheimer’s disease: Amino acid levels and brain metabolic status. Neurol. Sci. 34, 1575–1579. doi: 10.1007/s10072-013-1289-9
Hahne, F., and Ivanek, R. (2016). “Visualizing Genomic Data Using Gviz and Bioconductor,” in Statistical Genomics: Methods and Protocols Methods in Molecular Biology, eds E. Mathé and S. Davis (New York, NY: Springer), 335–351. doi: 10.1007/978-1-4939-3578-9_16
Hooper, C., De Souto Barreto, P., Payoux, P., Salabert, A. S., Guyonnet, S., Andrieu, S., et al. (2017). Cross-sectional associations of cortical β-amyloid with erythrocyte membrane long-chain polyunsaturated fatty acids in older adults with subjective memory complaints. J. Neurochem. 142, 589–596. doi: 10.1111/jnc.14062
Hooper, C., Vellas, B., and Mapt/Dsa study group. (2018). Fatty acids and Alzheimer’s disease: Evidence on cognition and cortical β-amyloid from secondary analyses of the Multidomain Alzheimer Preventive Trial. J. Prev. Alzheimers Dis. 5, 168–170. doi: 10.14283/jpad.2018.7
Huang, Y., Zheng, H., Tan, K., Sun, X., Ye, J., and Zhang, Y. (2020). Circulating metabolomics profiling reveals novel pathways associated with cognitive decline in patients with hypertension. Ther. Adv. Neurol. Disord. 13, 1–18. doi: 10.1177/1756286420947973
Huebbe, P., and Rimbach, G. (2017). Evolution of human apolipoprotein E (APOE) isoforms: Gene structure, protein function and interaction with dietary factors. Ageing Res. Rev. 37, 146–161. doi: 10.1016/j.arr.2017.06.002
Ilveskoski, E., Loimaala, A., Mercuri, M. F., Lehtimäki, T., Pasanen, M., Nenonen, A., et al. (2000). Apolipoprotein E polymorphism and carotid artery intima-media thickness in a random sample of middle-aged men. Atherosclerosis 153, 147–153. doi: 10.1016/S0021-9150(00)00383-X
Jiménez-Jiménez, F. J., Molina, J. A., Gómez, P., Vargas, C., de Bustos, F., Benito-León, J., et al. (1998). Neurotransmitter amino acids in cerebrospinal fluid of patients with Alzheimer’s disease. J. Neural. Transm. 105, 269–277. doi: 10.1007/s007020050056
Johnston, R., Jones, K., and Manley, D. (2018). Confounding and collinearity in regression analysis: A cautionary tale and an alternative procedure, illustrated by studies of British voting behaviour. Qual. Quant. 52, 1957–1976. doi: 10.1007/s11135-017-0584-6
Kaddurah-Daouk, R., Zhu, H., Sharma, S., Bogdanov, M., Rozen, S. G., Matson, W., et al. (2013). Alterations in metabolic pathways and networks in Alzheimer’s disease. Transl. Psychiatry 3:e244. doi: 10.1038/tp.2013.18
Kanehisa, M., and Goto, S. (2000). KEGG: Kyoto encyclopedia of genes and genomes. Nucleic Acids Res. 28, 27–30. doi: 10.1093/nar/28.1.27
Karjalainen, J.-P., Mononen, N., Hutri-Kähönen, N., Lehtimäki, M., Juonala, M., Ala-Korpela, M., et al. (2019). The effect of apolipoprotein E polymorphism on serum metabolome – a population-based 10-year follow-up study. Sci. Rep. 9:458. doi: 10.1038/s41598-018-36450-9
Konttinen, H., Cabral-da-Silva, M. E. C., Ohtonen, S., Wojciechowski, S., Shakirzyanova, A., Caligola, S., et al. (2019). PSEN1ΔE9, APPswe, and APOE4 confer disparate phenotypes in human ipsc-derived microglia. Stem. Cell Rep. 13, 669–683. doi: 10.1016/j.stemcr.2019.08.004
Krumsiek, J., Mittelstrass, K., Do, K. T., Stückler, F., Ried, J., Adamski, J., et al. (2015). Gender-specific pathway differences in the human serum metabolome. Metabolomics 11, 1815–1833. doi: 10.1007/s11306-015-0829-0
Kulminski, A. M., Huang, J., Wang, J., He, L., Loika, Y., and Culminskaya, I. (2018). Apolipoprotein E region molecular signatures of Alzheimer’s disease. Aging Cell 17:e12779. doi: 10.1111/acel.12779
Kulminski, A. M., Philipp, I., Loika, Y., He, L., and Culminskaya, I. (2020a). Haplotype architecture of the Alzheimer’s risk in the APOE region via co-skewness. Alzheimers Dement. 12:e12129. doi: 10.1002/dad2.12129
Kulminski, A. M., Shu, L., Loika, Y., Nazarian, A., Arbeev, K., Ukraintseva, S., et al. (2020b). APOE region molecular signatures of Alzheimer’s disease across races/ethnicities. Neurobiol. Aging 87, 141.e1–141.e8. doi: 10.1016/j.neurobiolaging.2019.11.007
Kulminski, A. M., Philipp, I., Loika, Y., He, L., and Culminskaya, I. (2021). Protective association of the ε2/ε3 heterozygote with Alzheimer’s disease is strengthened by TOMM40-APOE variants in men. Alzheimers Dement. 17, 1779–1787. doi: 10.1002/alz.12413
Laaksonen, R. (2016). Identifying new risk markers and potential targets for coronary artery disease: The value of the lipidome and metabolome. Cardiovasc. Drugs Ther. 30, 19–32. doi: 10.1007/s10557-016-6651-8
Lehtimäki, T., Moilanen, T., Viikari, J., Akerblom, H. K., Ehnholm, C., Rönnemaa, T., et al. (1990). Apolipoprotein E phenotypes in Finnish youths: A cross-sectional and 6-year follow-up study. J. Lipid. Res. 31, 487–495.
Lescai, F., Chiamenti, A. M., Codemo, A., Pirazzini, C., D’Agostino, G., Ruaro, C., et al. (2011). An APOE haplotype associated with decreased ε4 expression increases the risk of late onset Alzheimer’s disease. J. Alzheimers Dis. 24, 235–245. doi: 10.3233/JAD-2011-101764
Lewis, G. D., Wei, R., Liu, E., Yang, E., Shi, X., Martinovic, M., et al. (2008). Metabolite profiling of blood from individuals undergoing planned myocardial infarction reveals early markers of myocardial injury. J. Clin. Invest. 118, 3503–3512. doi: 10.1172/JCI35111
Liu, C.-C., Kanekiyo, T., Xu, H., and Bu, G. (2013). Apolipoprotein E and Alzheimer disease: Risk, mechanisms and therapy. Nat. Rev. Neurol. 9, 106–118. doi: 10.1038/nrneurol.2012.263
Loika, Y., Feng, F., Loiko, E., and Kulminski, A. M. (2021). Mediation of the APOE associations with Alzheimer’s and coronary heart diseases through body mass index and lipids. Geroscience 44, 1141–1156. doi: 10.1007/s11357-021-00458-3
Long, T., Hicks, M., Yu, H.-C., Biggs, W. H., Kirkness, E. F., Menni, C., et al. (2017). Whole-genome sequencing identifies common-to-rare variants associated with human blood metabolites. Nat. Genet. 49, 568–578. doi: 10.1038/ng.3809
Lopez, L. B., Kritz-Silverstein, D., and Barrett Connor, E. (2011). High dietary and plasma levels of the omega-3 fatty acid docosahexaenoic acid are associated with decreased dementia risk: The Rancho Bernardo study. J. Nutr. Health Aging 15, 25–31. doi: 10.1007/s12603-011-0009-5
Lotta, L. A., Pietzner, M., Stewart, I. D., Wittemans, L. B. L., Li, C., Bonelli, R., et al. (2021). A cross-platform approach identifies genetic regulators of human metabolism and health. Nat. Genet. 53, 54–64. doi: 10.1038/s41588-020-00751-5
Luo, Y., Yue, W., Quan, X., Wang, Y., Zhao, B., and Lu, Z. (2015). Asymmetric dimethylarginine exacerbates Aβ-induced toxicity and oxidative stress in human cell and Caenorhabditis elegans models of Alzheimer disease. Free Radic. Biol. Med. 79, 117–126. doi: 10.1016/j.freeradbiomed.2014.12.002
Lutz, M. W., Crenshaw, D., Welsh-Bohmer, K. A., Burns, D. K., and Roses, A. D. (2016). New genetic approaches to AD: Lessons from APOE-TOMM40 phylogenetics. Curr. Neurol. Neurosci. Rep. 16:48. doi: 10.1007/s11910-016-0643-8
MacArthur, J., Bowler, E., Cerezo, M., Gil, L., Hall, P., Hastings, E., et al. (2017). The new NHGRI-EBI Catalog of published genome-wide association studies (GWAS Catalog). Nucleic Acids Res. 45:D896–D901. doi: 10.1093/nar/gkw1133
Machiela, M. J., and Chanock, S. J. (2015). LDlink: A web-based application for exploring population-specific haplotype structure and linking correlated alleles of possible functional variants. Bioinformatics 31, 3555–3557. doi: 10.1093/bioinformatics/btv402
McGarrah, R. W., Crown, S. B., Zhang, G.-F., Shah, S. H., and Newgard, C. B. (2018). Cardiovascular metabolomics. Circ. Res. 122, 1238–1258. doi: 10.1161/CIRCRESAHA.117.311002
McIntosh, A. M., Bennett, C., Dickson, D., Anestis, S. F., Watts, D. P., Webster, T. H., et al. (2012). The apolipoprotein E (APOE) gene appears functionally monomorphic in chimpanzees (Pan troglodytes). PLoS One 7:e47760. doi: 10.1371/journal.pone.0047760
McKhann, G., Drachman, D., Folstein, M., Katzman, R., Price, D., and Stadlan, E. M. (1984). Clinical diagnosis of Alzheimer’s disease: Report of the NINCDS-ADRDA Work Group under the auspices of Department of Health and Human Services Task Force on Alzheimer’s Disease. Neurology 34, 939–944. doi: 10.1212/wnl.34.7.939
McKhann, G. M., Knopman, D. S., Chertkow, H., Hyman, B. T., Jack, C. R., Kawas, C. H., et al. (2011). The diagnosis of dementia due to Alzheimer’s disease: Recommendations from the National Institute on Aging-Alzheimer’s Association workgroups on diagnostic guidelines for Alzheimer’s disease. Alzheimers Dement. 7, 263–269. doi: 10.1016/j.jalz.2011.03.005
Mittelstrass, K., Ried, J. S., Yu, Z., Krumsiek, J., Gieger, C., Prehn, C., et al. (2011). Discovery of sexual dimorphisms in metabolic and genetic biomarkers. PLoS Genet. 7:e1002215. doi: 10.1371/journal.pgen.1002215
Natarajan, P., Bis, J. C., Bielak, L. F., Cox, A. J., Dörr, M., Feitosa, M. F., et al. (2016). Multiethnic exome-wide association study of subclinical atherosclerosis. Circ. Cardiovasc. Genet. 9, 511–520. doi: 10.1161/CIRCGENETICS.116.001572
Nazarian, A., Loika, Y., He, L., Culminskaya, I., and Kulminski, A. M. (2022a). Genome-wide analysis identified abundant genetic modulators of contributions of the apolipoprotein E alleles to Alzheimer’s disease risk. Alzheimers Dement. 3:10.1002/alz.12540. doi: 10.1002/alz.12540
Nazarian, A., Philipp, I., Culminskaya, I., He, L., and Kulminski, A. M. (2022b). Inter- and intra-chromosomal modulators of the APOE ε2 and ε4 effects on the Alzheimer’s disease risk. GeroScience [Epub ahead of print]. doi: 10.1007/s11357-022-00617-0
Panda, C., Varadharaj, S., and Voruganti, V. S. (2022). PUFA, genotypes and risk for cardiovascular disease. Prostaglandins Leukot. Essent. Fatty Acids 176:102377. doi: 10.1016/j.plefa.2021.102377
Pang, Z., Chong, J., Zhou, G., de Lima Morais, D. A., Chang, L., Barrette, M., et al. (2021). MetaboAnalyst 5.0: Narrowing the gap between raw spectra and functional insights. Nucleic Acids Res. 49:W388–W396. doi: 10.1093/nar/gkab382
Park, J. Y., Lee, S.-H., Shin, M.-J., and Hwang, G.-S. (2015). Alteration in metabolic signature and lipid metabolism in patients with angina pectoris and myocardial infarction. PLoS One 10:e0135228. doi: 10.1371/journal.pone.0135228
Peña-Bautista, C., Roca, M., López-Cuevas, R., Baquero, M., Vento, M., and Cháfer-Pericás, C. (2020). Metabolomics study to identify plasma biomarkers in Alzheimer disease: ApoE genotype effect. J. Pharm. Biomed. Anal. 180:113088. doi: 10.1016/j.jpba.2019.113088
Piubelli, L., Murtas, G., Rabattoni, V., and Pollegioni, L. (2021). The role of D-amino acids in Alzheimer’s disease. J. Alzheimers. Dis. 80, 475–492. doi: 10.3233/JAD-201217
Pizzini, A., Lunger, L., Sonnweber, T., Weiss, G., and Tancevski, I. (2018). The role of omega-3 fatty acids in the setting of coronary artery disease and COPD: A review. Nutrients 10:E1864. doi: 10.3390/nu10121864
Purcell, S., Neale, B., Todd-Brown, K., Thomas, L., Ferreira, M. A. R., Bender, D., et al. (2007). PLINK: A tool set for whole-genome association and population-based linkage analyses. Am. J. Hum. Genet. 81, 559–575. doi: 10.1086/519795
Reiman, E. M., Caselli, R. J., Yun, L. S., Chen, K., Bandy, D., Minoshima, S., et al. (1996). Preclinical evidence of Alzheimer’s disease in persons homozygous for the epsilon 4 allele for apolipoprotein E. N. Engl. J. Med. 334, 752–758. doi: 10.1056/NEJM199603213341202
Reiman, E. M., Chen, K., Alexander, G. E., Caselli, R. J., Bandy, D., Osborne, D., et al. (2004). Functional brain abnormalities in young adults at genetic risk for late-onset Alzheimer’s dementia. Proc. Natl. Acad. Sci. U.S.A. 101, 284–289. doi: 10.1073/pnas.2635903100
Rhee, E. P., Ho, J. E., Chen, M.-H., Shen, D., Cheng, S., Larson, M. G., et al. (2013). A genome-wide association study of the human metabolome in a community-based cohort. Cell Metab. 18, 130–143. doi: 10.1016/j.cmet.2013.06.013
Sabatine, M. S., Liu, E., Morrow, D. A., Heller, E., McCarroll, R., Wiegand, R., et al. (2005). Metabolomic identification of novel biomarkers of myocardial ischemia. Circulation 112, 3868–3875. doi: 10.1161/CIRCULATIONAHA.105.569137
Schaefer, E. J., Bongard, V., Beiser, A. S., Lamon-Fava, S., Robins, S. J., Au, R., et al. (2006). Plasma phosphatidylcholine docosahexaenoic acid content and risk of dementia and Alzheimer disease: The Framingham Heart Study. Arch. Neurol. 63, 1545–1550. doi: 10.1001/archneur.63.11.1545
Selley, M. L. (2003). Increased concentrations of homocysteine and asymmetric dimethylarginine and decreased concentrations of nitric oxide in the plasma of patients with Alzheimer’s disease. Neurobiol. Aging 24, 903–907. doi: 10.1016/s0197-4580(03)00007-1
Shin, S.-Y., Fauman, E. B., Petersen, A.-K., Krumsiek, J., Santos, R., Huang, J., et al. (2014). An atlas of genetic influences on human blood metabolites. Nat. Genet. 46, 543–550. doi: 10.1038/ng.2982
Siscovick, D. S., Barringer, T. A., Fretts, A. M., Wu, J. H. Y., Lichtenstein, A. H., Costello, R. B., et al. (2017). Omega-3 polyunsaturated fatty acid (fish oil) supplementation and the prevention of clinical cardiovascular disease: A science advisory from the American heart association. Circulation 135:e867–e884. doi: 10.1161/CIR.0000000000000482
Socha, E., Kośliński, P., Koba, M., Mądra-Gackowska, K., Kędziora-Kornatowska, K., Gackowski, M., et al. (2020). Amino acid levels as potential biomarker of elderly patients with dementia. Brain Sci. 10:E914. doi: 10.3390/brainsci10120914
Stelzer, G., Rosen, N., Plaschkes, I., Zimmerman, S., Twik, M., Fishilevich, S., et al. (2016). The GeneCards suite: From gene data mining to disease genome sequence analyses. Curr. Protoc. Bioinform. 54, 1.30.1–1.30.33. doi: 10.1002/cpbi.5
Storey, J. D., Bass, A. J., Dabney, A., Robinson, D., and Warnes, G. (2022). qvalue: Q-value Estimation for False Discovery Rate Control. R Package Version 2.28.0. doi: 10.18129/B9.bioc.qvalue
Syeda, T., Sanchez-Tapia, M., Pinedo-Vargas, L., Granados, O., Cuervo-Zanatta, D., Rojas-Santiago, E., et al. (2018). Bioactive food abates metabolic and synaptic alterations by modulation of gut microbiota in a mouse model of Alzheimer’s disease. J. Alzheimers Dis. 66, 1657–1682. doi: 10.3233/JAD-180556
Templeton, A. R., Maxwell, T., Posada, D., Stengård, J. H., Boerwinkle, E., and Sing, C. F. (2005). Tree scanning: A method for using haplotype trees in phenotype/genotype association studies. Genetics 169, 441–453. doi: 10.1534/genetics.104.030080
Tomaschek, F., Hendrix, P., and Baayen, R. H. (2018). Strategies for addressing collinearity in multivariate linguistic data. J. Phon. 71, 249–267. doi: 10.1016/j.wocn.2018.09.004
Tomaszewski, N., He, X., Solomon, V., Lee, M., Mack, W. J., Quinn, J. F., et al. (2020). Effect of APOE genotype on plasma docosahexaenoic acid (DHA), eicosapentaenoic acid, arachidonic acid, and hippocampal volume in the Alzheimer’s disease cooperative study-sponsored DHA clinical trial. J. Alzheimers Dis. 74, 975–990. doi: 10.3233/JAD-191017
Tully, A. M., Roche, H. M., Doyle, R., Fallon, C., Bruce, I., Lawlor, B., et al. (2003). Low serum cholesteryl ester-docosahexaenoic acid levels in Alzheimer’s disease: A case-control study. Br. J. Nutr. 89, 483–489. doi: 10.1079/BJN2002804
Tveitevåg Svingen, G. F., Ueland, P. M., Pedersen, E. K. R., Schartum-Hansen, H., Seifert, R., Ebbing, M., et al. (2013). Plasma dimethylglycine and risk of incident acute myocardial infarction in patients with stable angina pectoris. Arterioscler. Thromb. Vasc. Biol. 33, 2041–2048. doi: 10.1161/ATVBAHA.113.301714
Valkonen, V. P., Päivä, H., Salonen, J. T., Lakka, T. A., Lehtimäki, T., Laakso, J., et al. (2001). Risk of acute coronary events and serum concentration of asymmetrical dimethylarginine. Lancet 358, 2127–2128. doi: 10.1016/S0140-6736(01)07184-7
Wang, G., Zhou, Y., Huang, F.-J., Tang, H.-D., Xu, X.-H., Liu, J.-J., et al. (2014). Plasma metabolite profiles of Alzheimer’s disease and mild cognitive impairment. J. Proteome Res. 13, 2649–2658. doi: 10.1021/pr5000895
Wang, S., Li, B., Solomon, V., Fonteh, A., Rapoport, S. I., Bennett, D. A., et al. (2022). Calcium-dependent cytosolic phospholipase A2 activation is implicated in neuroinflammation and oxidative stress associated with ApoE4. Mol. Neurodegener. 17:42. doi: 10.1186/s13024-022-00549-5
Williams, H. C., Farmer, B. C., Piron, M. A., Walsh, A. E., Bruntz, R. C., Gentry, M. S., et al. (2020). APOE alters glucose flux through central carbon pathways in astrocytes. Neurobiol. Dis. 136:104742. doi: 10.1016/j.nbd.2020.104742
Wishart, D. S., Tzur, D., Knox, C., Eisner, R., Guo, A. C., Young, N., et al. (2007). HMDB: The Human Metabolome Database. Nucleic Acids Res. 35:D521–D526. doi: 10.1093/nar/gkl923
Wolters, F. J., Yang, Q., Biggs, M. L., Jakobsdottir, J., Li, S., Evans, D. S., et al. (2019). The impact of APOE genotype on survival: Results of 38,537 participants from six population-based cohorts (E2-CHARGE). PLoS One 14:e0219668. doi: 10.1371/journal.pone.0219668
Yamagishi, K., Ikeda, A., Chei, C.-L., Noda, H., Umesawa, M., Cui, R., et al. (2017). Serum α-linolenic and other ω-3 fatty acids, and risk of disabling dementia: Community-based nested case-control study. Clin. Nutr. 36, 793–797. doi: 10.1016/j.clnu.2016.05.011
Yamazaki, Y., Zhao, N., Caulfield, T. R., Liu, C.-C., and Bu, G. (2019). Apolipoprotein E and Alzheimer disease: Pathobiology and targeting strategies. Nat. Rev. Neurol. 15, 501–518. doi: 10.1038/s41582-019-0228-7
Yanai, H. (2017). Effects of n-3 polyunsaturated fatty acids on dementia. J. Clin. Med. Res. 9, 1–9. doi: 10.14740/jocmr2815w
Yang, J., Lee, S. H., Goddard, M. E., and Visscher, P. M. (2011). GCTA: A tool for genome-wide complex trait analysis. Am. J. Hum. Genet. 88, 76–82. doi: 10.1016/j.ajhg.2010.11.011
Yin, F. (2022). Lipid metabolism and Alzheimer’s disease: Clinical evidence, mechanistic link and therapeutic promise. FEBS J. [Epub ahead of print]. doi: 10.1111/febs.16344
Yu, C.-E., Seltman, H., Peskind, E. R., Galloway, N., Zhou, P. X., Rosenthal, E., et al. (2007). Comprehensive analysis of APOE and selected proximate markers for late-onset Alzheimer’s disease: Patterns of linkage disequilibrium and disease/marker association. Genomics 89, 655–665. doi: 10.1016/j.ygeno.2007.02.002
Zhou, X., Chen, Y., Mok, K. Y., Kwok, T. C. Y., Mok, V. C. T., Guo, Q., et al. (2019). Non-coding variability at the APOE locus contributes to the Alzheimer’s risk. Nat. Commun. 10:3310. doi: 10.1038/s41467-019-10945-z
Keywords: metabolomics, genetic heterogeneity, APOE ε2 allele, APOE ε3 allele, APOE ε4 allele, pleiotropy
Citation: Nazarian A, Loiko E, Yassine HN, Finch CE and Kulminski AM (2022) APOE alleles modulate associations of plasma metabolites with variants from multiple genes on chromosome 19q13.3. Front. Aging Neurosci. 14:1023493. doi: 10.3389/fnagi.2022.1023493
Received: 19 August 2022; Accepted: 07 October 2022;
Published: 28 October 2022.
Edited by:
Timothy S. Chang, University of California, Los Angeles, United StatesReviewed by:
Xueqiu Jian, The University of Texas Health Science Center at San Antonio, United StatesLijun Wang, Naval Medical University, China
Copyright © 2022 Nazarian, Loiko, Yassine, Finch and Kulminski. This is an open-access article distributed under the terms of the Creative Commons Attribution License (CC BY). The use, distribution or reproduction in other forums is permitted, provided the original author(s) and the copyright owner(s) are credited and that the original publication in this journal is cited, in accordance with accepted academic practice. No use, distribution or reproduction is permitted which does not comply with these terms.
*Correspondence: Alireza Nazarian, YWxpcmV6YS5uYXphcmlhbkBkdWtlLmVkdQ==; Alexander M. Kulminski, a3VsbWluc2tAZHVrZS5lZHU=