 Bin Cui
 Weimin Zheng
 Shan Ren2
 Zhigang Chen
 Zhiqun Wang
94% of researchers rate our articles as excellent or good
Learn more about the work of our research integrity team to safeguard the quality of each article we publish.
Find out more
ORIGINAL RESEARCH article
Front. Aging Neurosci. , 03 August 2021
Sec. Neurocognitive Aging and Behavior
Volume 13 - 2021 | https://doi.org/10.3389/fnagi.2021.687649
Recent studies have demonstrated the structural and functional changes in patients with multiple system atrophy (MSA). However, little is known about the different parameter changes of the most vulnerable regions in different types of MSA. In this study, we collected resting-state structure, perfusion, and patients with functional magnetic resonance imaging (fMRI) data of cerebellum-type of MSA (MSA-c) and Parkinson-type of MSA (MSA-p). First, by simultaneously using voxel-based morphology (VBM), arterial spin labeling (ASL), and amplitude of low-frequency fluctuation (ALFF), we analyzed the whole brain differences of structure, perfusion, and functional activation between patients with MSA-c and MSA-p. Second, we explored the relationships among structure, perfusion, function, and the clinical variables in patients with MSA. Finally, we extracted the MRI parameters of a specific region to separate the two groups and search for a sensitive imaging biomarker. As a result, compared with patients with MSA-p type, patients with MSA-c type showed decreased structure atrophy in several cerebella and vermis subregions, reduced perfusion in bilateral cerebellum_4_5 and vermis_4_5, and an decreased ALFF values in the right lingual gyrus (LG) and fusiform (FFG). Subsequent analyses revealed the close correlations among structure, perfusion, function, and clinical variables in both MSA-c and MSA-p. Finally, the receiver operating characteristic (ROC) analysis showed that the regional cerebral blood flow (rCBF) of bilateral cerebellum_4_5/vermis_4_5 could differentiate the two groups at a relatively high accuracy, yielding the sensitivity of 100%, specificity of 79.2%, and the area under the curve (AUC) value of 0.936. These findings have important implications for understanding the underlying neurobiology of different types of MSA and added the new evidence for the disrupted rCBF, structure, and function of MSA, which may provide the potential biomarker for accurately detecting different types of patients with MSA and new ideas for the treatment of different types of MSA in the future.
Multiple system atrophy (MSA) is a progressive neurodegenerative disorder, pathologically characterized by deposition of alpha synuclein-positive glial cytoplasmic inclusions (GCIs) in several specific regions including the striatum, cerebellum, and olivopontine structures (Brettschneider et al., 2017; Krismer et al., 2019). Clinically, MSA is mainly divided into MSA-p type with poor levodopa-responsive parkinsonian syndrome, and MSA-c type with cerebellar ataxia syndrome. However, the clinical differentiation between patients with MSA-c and MSA-p is challenged by the presence of clinical features common to both forms, resulting in the relatively high rate of misdiagnosis and incorrect treatment at clinical practice. Previous researchers have applied structural magnetic resonance imaging (sMRI) in aiding the differential diagnosis between MSA-c and MSA-p type (Matsusue et al., 2009; Deguchi et al., 2015; Krismer and Wenning, 2017; Chelban et al., 2019; Dash et al., 2019), and found that structural atrophy was mainly concentrated in the putamen, middle cerebellar peduncle (MCP), pons, and cerebellum. Another study found no structural abnormalities in MSA patients with MSA (Chelban et al., 2019), which inspires us to find some more sensitive technique to reach an accurate differential diagnosis of the disease.
Arterial spin labeling (ASL) is a non-invasive technique that can provide quantitative information of regional cerebral blood flow (rCBF) (Zhang, 2016). Ideally, the use of ASL might show a higher discriminative value than the sMRI technique, because the hypo-perfusion injury always occurs earlier than the structural atrophy. The ASL technique takes the inflowing magnetically labeled arterial blood as exogenous an contrast agent, instead of routine contrast-enhanced MRI (Hartkamp et al., 2013). Moreover, ASL has several other advantages, such as higher spatial resolution, faster acquisition, and stability (Haller et al., 2016). So far, only two MSA studies have focused on the ASL application. One of the previous studies revealed the decreased rCBF in several cerebellum subregions in patients with MSA-c type (Zheng et al., 2019). Another ASL study focused on differentiation of the Parkinson's disease (PD) and MSA, although the authors performed some perfusion comparisons between patients, with MSA-c and MSA-p they did not further extract the imaging biomarkers to classify the different types of MSA (Erro et al., 2020).
Recently, increasing attention has focused on exploring MSA-related intrinsic brain activity changes during resting-state functional MRI (rs-fMRI). For the intrinsic brain activity, by using the regional homogeneity (ReHo) approach, the researcher found the motor network dysfunction in patients with MSA (You et al., 2011). Besides the ReHo method, the amplitude of low-frequency fluctuations (ALFF) played an important role, which can directly reflect regional spontaneous brain activity by calculating the square root of the power spectrum of the rs-fMRI signals in a low-frequency range (Zang et al., 2007). In one of the previous studies, we used the ALFF method to examine the whole brain activity changes and observed significantly decreased ALFF values in several cerebellum regions in patients with MSA-c type (Ren et al., 2019). Another study focused on MSA-p type and revealed decreased ALFF values mainly in bilateral basal ganglion, as well as increased ALFF values in right cerebellum and parieto-temporo-occipital cortex (Wang et al., 2017). These results were based on the comparison between MSA subtype (MSA-p or MSA-c) and normal controls. However, there was no study directly comparing the ALFF changes between MSA-c type and MSA-p type.
Based on the previous studies of structure, perfusion, and function, it trigged the interests in the relationship among the three multimode MRI parameters in different subtypes of MSA. In addition, no study investigated the association among these multimode MRI parameters simultaneously in MSA disease. Additionally, the association between the MRI parameters and clinical performances in patients with MSA is not very clear. Thus, to deeply understand the specific patterns of structure, perfusion, and functional activity in different MSA subtypes, we performed the current study by using the multimodal MRI methods. First, we aim to analyze the whole brain differences of structure, rCBF, and ALFF values between MSA-c and MSA-p. Second, we intend to explore the relationships among perfusion-structure-function coupling of MSA-c and MSA-p. Furthermore, we will explore the correlation between the multimodal MRI parameters and the clinical variables. Finally, we intend to extract the MRI parameters of a specific region to separate the two groups and search for an imaging biomarker of the disease.
Twenty-four patients with MSA-c type and 13 patients with MSA-p type were recruited at the clinic of Dongfang Hospital of Beijing University of Chinese Medicine. There was no statistical difference in age and gender between the two groups. The diagnosis of MSA-c and MSA-p type was according to the established international diagnostic criteria of probable MSA defined by the American Academy of Neurology and American Autonomic Society (Gilman et al., 2008). All subjects were evaluated by complete physical and neuropsychological examinations including Unified Multiple System Atrophy Rating Scale (UMSARS). The clinical examinations were performed on the day before MRI scanning. The inclusion criteria for controls were as follows: (1) there were no neurological or psychiatric disorders including obsessive disorder, anxiety disorder, schizophrenia, depression, epilepsy, and so on; (2) there was a lack of significant cognitive decline (Mini-mental State Examination (MMSE) score > 24); (3) there were no neurological deficiencies including visual or hearing loss; (4) there were no treatment with deep brain stimulation or operation; (5) there was no evidence of movement disorder, vascular brain lesions, brain tumor, and/or marked cortical and/or subcortical atrophy on MRI scan. The exclusion criteria for the subjects were as follows: the subjects of hemorrhage, infarction, tumors, trauma, or severe white matter (WM) hyperintensity were excluded from the study. Clinical and demographic information of the subjects were shown in Table 1.
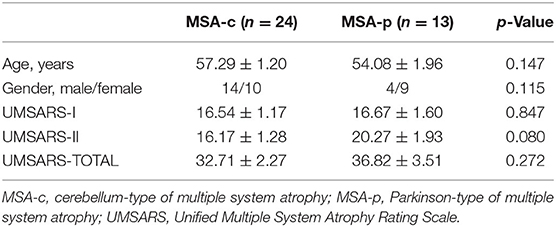
Table 1. Clinical and demographical data.
All subjects gave written informed consent in accordance with the Declaration of Helsinki. The protocol was approved by the Medical Research Ethical Committee of Dongfang Hospital of Beijing University of Chinese Medicine.
MRI data acquisition was performed on a GE 3.0T Discovery 750 scanner. Foam padding and headphones were used to control head motion and scanner noise. High-resolution anatomical images were collected using a 3D brain volume T1-weighted sequence with the following parameters: repetition time (TR)/ echo time (TE)/inversion time (TI)/ flip angle (FA) = 8,150 ms/3.17 ms/450 ms/12°, resolution = 256 × 256 matrix, slices = 188, thickness = 1 mm, voxel size = 1 × 1 × 1 mm3. The 3D-ASL data were acquired using the following parameters: TR/TE = 2.0 s/14 ms, post-label delay (PLD) = 2.0 s, field of view (FOV) = 256 × 256 mm2, matrix size = 64 × 64, in-plane resolution = 3 × 3 mm2, bandwidth = 2,232 Hz/px, phase partial Fourier = 6/8, echo-planar imaging (EPI) factor = 64. Twelve slices of 6 mm thickness were acquired. The resting-state BOLD image parameters were as following: TR/ TE/ FA = 2,000 ms/30 ms/90°, FOV = 24 × 24 cm2, resolution = 64 × 64 matrix, slices = 36, thickness = 3 mm, gap = 1 mm, voxel size = 3.75 × 3.75 × 3 mm3, and bandwidth = 2,232 Hz/pixel. All subjects were instructed to keep their eyes closed, relax, move as little as possible, think of nothing in particular, and stay awake during the scans.
T1-weighted images were preprocessed with the Statistical Parametric Mapping 12 (SPM12) (http://www.fil.ion.ucl.ac.uk/spm/) software implemented in MATLAB 2013a (Math Works, Natick, MA, USA). First, the T1 structural images were segmented into gray matter (GM), WM, and cerebrospinal fluid (CSF) areas, using the unified standard segmentation option in SPM12. Then, images were spatially normalized into the standard Montreal Neurological Institute (MNI) space by employing the Diffeomorphic Anatomical Registration through Exponentiated Lie algebra (DARTEL) algorithm. The normalized GM and WM components were modulated for non-linear change and then smoothed using a Gaussian kernel of 8 mm full width at half-maximum (FWHM).
The images with differences in 3D-ASL were averaged, and the rCBF map was calculated with the weighted reference image of proton density (Xu et al., 2010). Image processing was also performed using SPM12 software. First, the rCBF images were normalized to the MNI space. Then, to reduce the individual variance, the normalized rCBF images were standardized using the mean division. Finally, each standardized rCBF map was spatially smoothed with a Gaussian kernel of 8 mm FWHM.
Resting-state functional MRI data preprocessing was performed using the Data Processing Assistant for Resting-State fMRI (DPARSF) (Yan and Zang, 2010). The preprocessing steps included data conversion, removal of the first 10 volumes, slice timing, and head motion correction. Head motion between volumes was evaluated and corrected using rigid-body registration, and the dataset with maximum translation exceeding 2.5 mm and maximum rotation exceeding 2.5° were excluded from this study. To spatially normalize the fMRI data, the realigned volumes were spatially standardized into the MNI space using the EPI template. The functional images were resampled into a voxel size of 3 × 3 × 3 mm3. Then, the functional images were smoothed with a Gaussian kernel of 4 mm FWHM. Finally, several nuisance covariates (24 motion parameters, their first-time derivations, WM, and CSF) were regressed out from the data. After preprocessing, the effects of low-frequency drift and high-frequency physiological noise (respiratory and cardiac rhythms) were reduced by time bandpass filtering (0.01–0.08 Hz) of the fMRI data. Next, to acquire the power spectrum, the time series was transformed to a frequency domain using fast Fourier transform (FFT) (parameters: taper percent = 0, FFT length = shortest). And then the power spectrum was square-rooted and averaged across 0.01–0.08 Hz at each voxel. This averaged square root was viewed as the ALFF. For standardization purposes, the ALFF value of each voxel was divided by the global mean ALFF value to standardize data across subjects.
To assess the between-group differences (between the patients with MSA-c and MSA-p) of the rCBF, GM, and WM volumes, and ALFF values in the whole brain, two-sample t-tests were performed with age, and gender as covariates using SPM12. The significance threshold was set to Family-wise error (FWE) correction at the cluster level (p < 0.05). In addition, multiple comparisons analysis were performed to identify the relationships among perfusion-structure-function coupling of patients with MSA-c and MSA-p type. A note needs to be made here that the multiple comparisons analyze were performed among the average values on regions of interest (ROIs), and the ROIs were obtained by the two-sample t-tests of the rCBF, GM, and WM volumes, and ALFF in the whole brain between MSA-c and MSA-p.
Then, a partial correlation analysis was performed with age, and gender as nuisance covariates, to evaluate the associations of the clinical variables with the rCBF, GM, and WM volumes, and ALFF values in the patients with MSA-c and MSA-p type.
Finally, we use receiver operating characteristic (ROC) analysis with SPSS20.0 to obtain a sensitivity and specificity imaging biomarker for the differential diagnosis of patients with MSA-c and MSA-p type.
Twenty-four patients with MSA-c and 13 patients with MSA-p type completed the sMRI, ASL, and fMRI scans. Demographic and clinical data for all the participants were shown in Table 1. No statistically significant differences were found between patients with MSA-c and MSAp type in age and gender (p > 0.05).
Compared to the patients with MSA-p type, the patients with MSA-c type showed significantly decreased GM volumes (right cerebellum_1, cerebellum_6 and cerebellum_8, left cerebellum_2, cerebellum_1 and cerebellum_7b, left cerebellum_4_5, vermis_4_5, and vermis_3), and WM volumes (bilateral cerebellum_9 and left cerebellum). When compared with patients with MSA-p type, the patients with MSA-c type presented decreased rCBF in bilateral cerebellum_4_5 and vermis_4_5. In addition, we also found the decreased ALFF values in the right lingual gyrus (LG) and fusiform (FFG) in the patients relative to patients. The peak voxels within those significantly different clusters were shown in Figure 1 and Table 2.
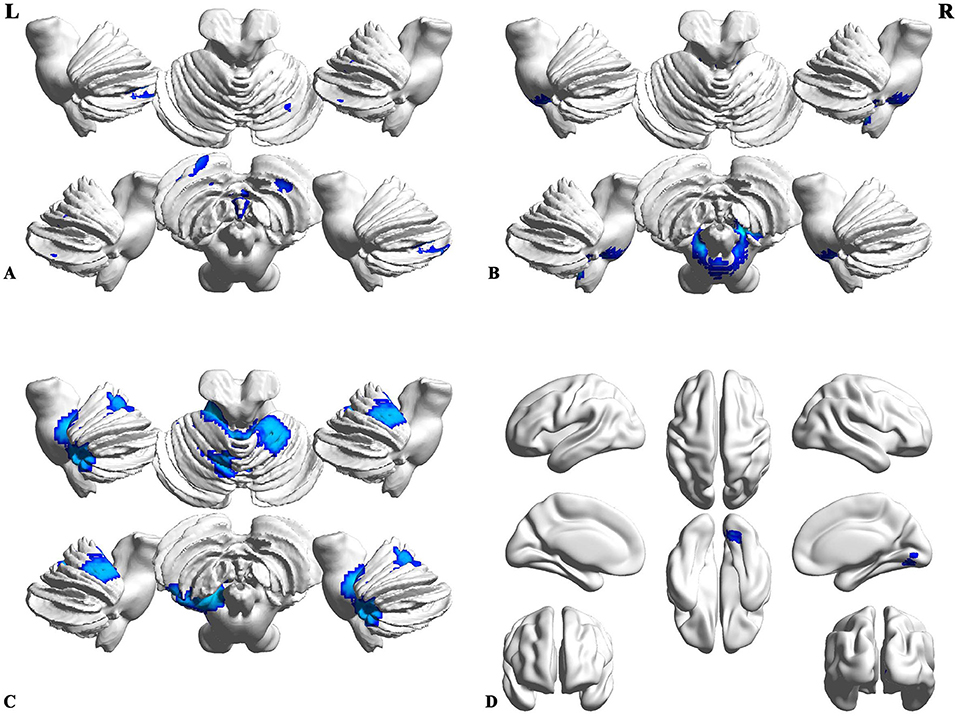
Figure 1. Differences of structure, regional cerebral blood flow (rCBF), and function between the patients with MSA-c and MSA-p. (A) Compared to the patients with Parkinson-type of multiple system atrophy (MSA-p type), patients with data of cerebellum-type of MSA (MSA-c type) showed significantly decreased gray matter (GM) volumes in right cerebellum_1, cerebellum_6 and cerebellum_8, left cerebellum_2, cerebellum_1, cerebellum_7b, cerebellum_4_5, vermis_4_5, and vermis_3; (B) MSA-c presented significantly decreased white matter (WM) volumes in bilateral cerebellum_9 and left cerebellum; (C) MSA-c presented decreased rCBF in the bilateral cerebellum_4_5 and vermis_4_5. (D) Decreased amplitude of low-frequency fluctuations (ALFF) values were found in the right lingual gyrus (LG) and fusiform (FFG).
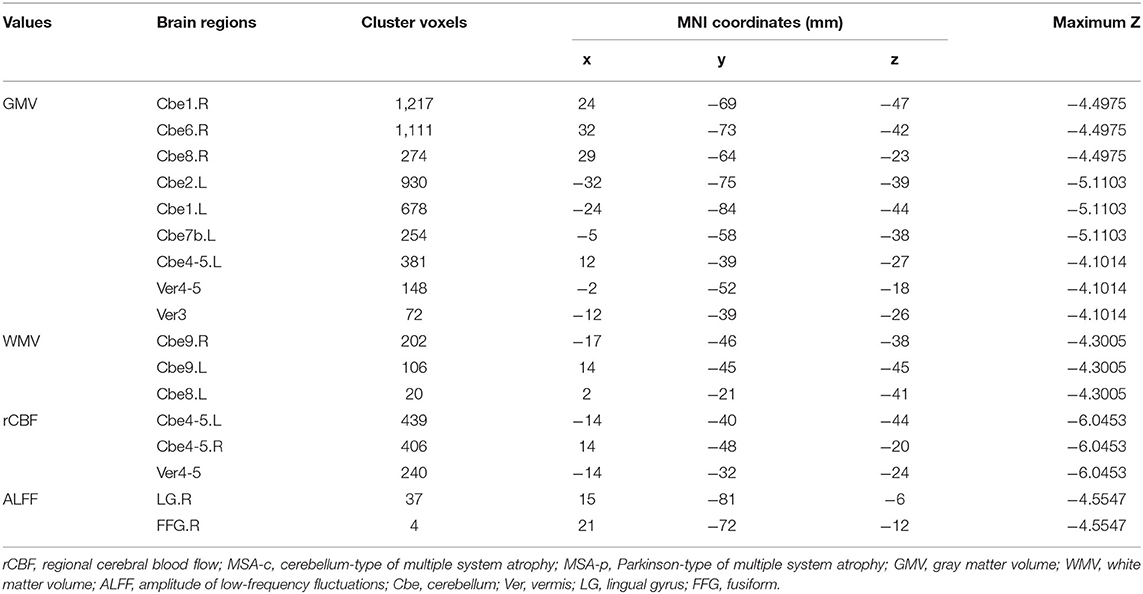
Table 2. Structural, rCBF, and functional changes between the MSA-c and MSA-p patients.
For the patients with MSA-c type, we found the positive correlations within the structure changes (cerebellum and vermis subregions). Furthermore, there were also positive correlations between the decreased rCBF (bilateral cerebellum_4_5, vermis_4_5) and decreased GM volumes (right cerebellum_1, cerebellum_6, cerebellum_8) in patients with MSA-c type. There were negative correlations between the ALFF (right LG/FFG) and GM volumes (left cerebellum_2, cerebellum_1, cerebellum_7b) in patients with MSA-c type (P < 0.05, Figure 2). For patients with MSA-p type, we found positive correlations within the structure changes (cerebellum and vermis subregions) (P < 0.05, Figure 3).
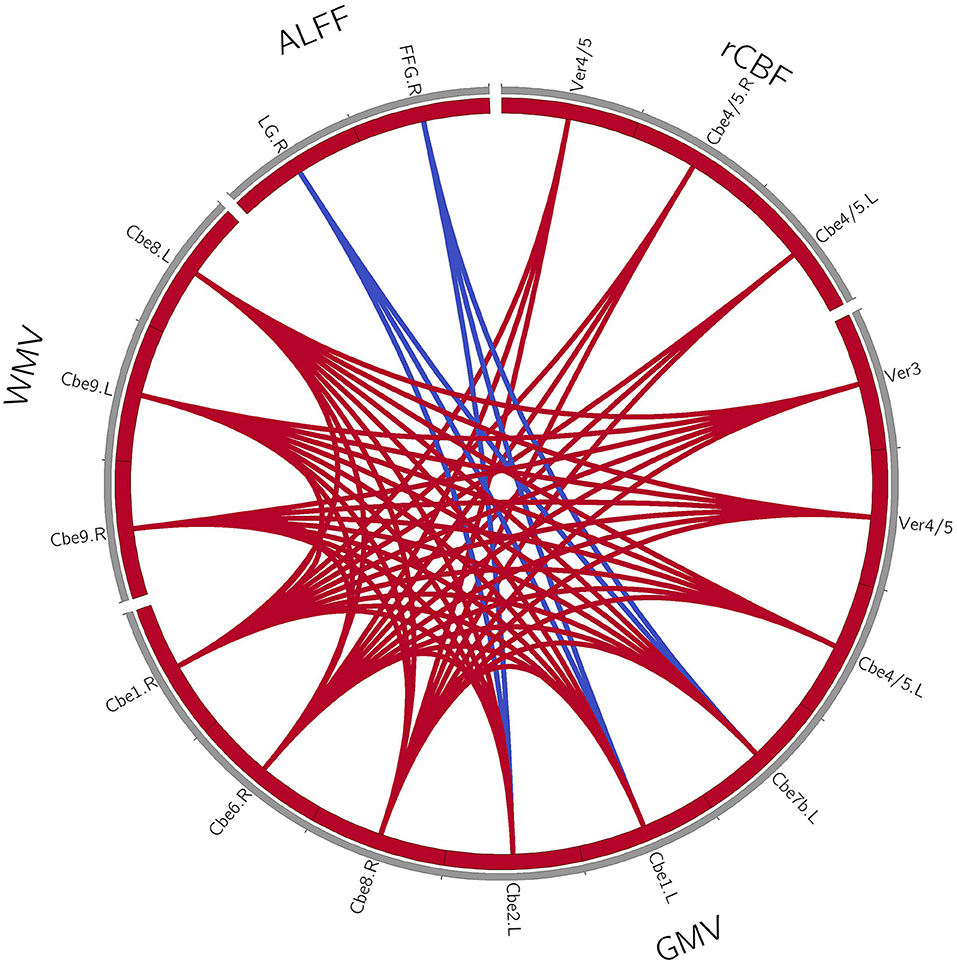
Figure 2. Coupling relationships among perfusion, structure, and function in patients with MSA-c type. For patients with MSA-c type, we found positive correlations within the structure changes, and positive correlations between the decreased rCBF and decreased GM volumes. Furthermore, negative correlations between the ALFF and GM volumes were found. The red line denotes the increased correlations, and the blue line denotes the decreased correlations. GMV, gray matter volume; WMV, white matter volume; rCBF, regional cerebral blood flow; ALFF, amplitude of low-frequency fluctuations; L, left; R, right; Cbe, cerebellum; Ver, vermis; LG, lingual gyrus; FFG, fusiform.
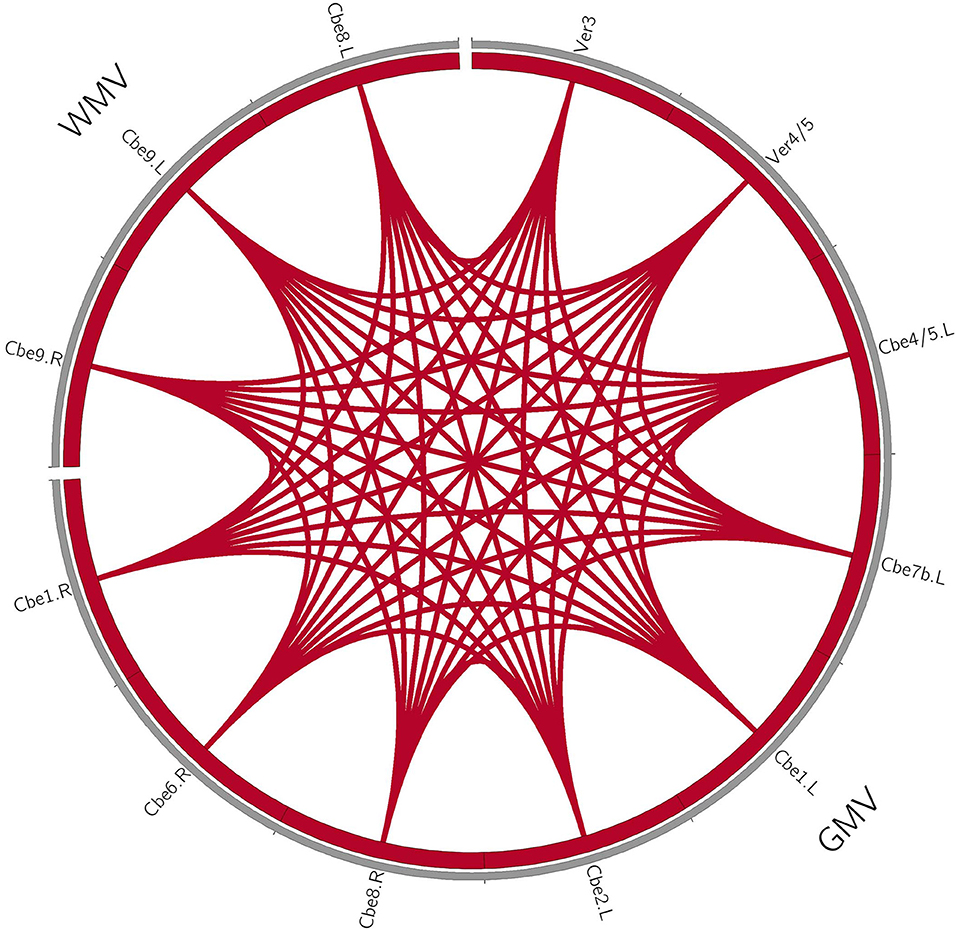
Figure 3. Coupling relationships among perfusion, structure, and function in patients with MSA-p type. For patients with MSA-p type, we only found positive correlations within the structure changes. The red line denotes the increased correlations. GMV, gray matter volume; WMV, white matter volume; L, left; R, right; Cbe, cerebellum; Ver, vermis.
In the MSA-c type group, we have found significant negative correlations between the UMSARS-II scores and structure changes (P < 0.05, Figure 4A). In the MSA-p type group, we have found a negative correlation between the UMSARS -I scores and WM changes (P < 0.05, Figure 4B).
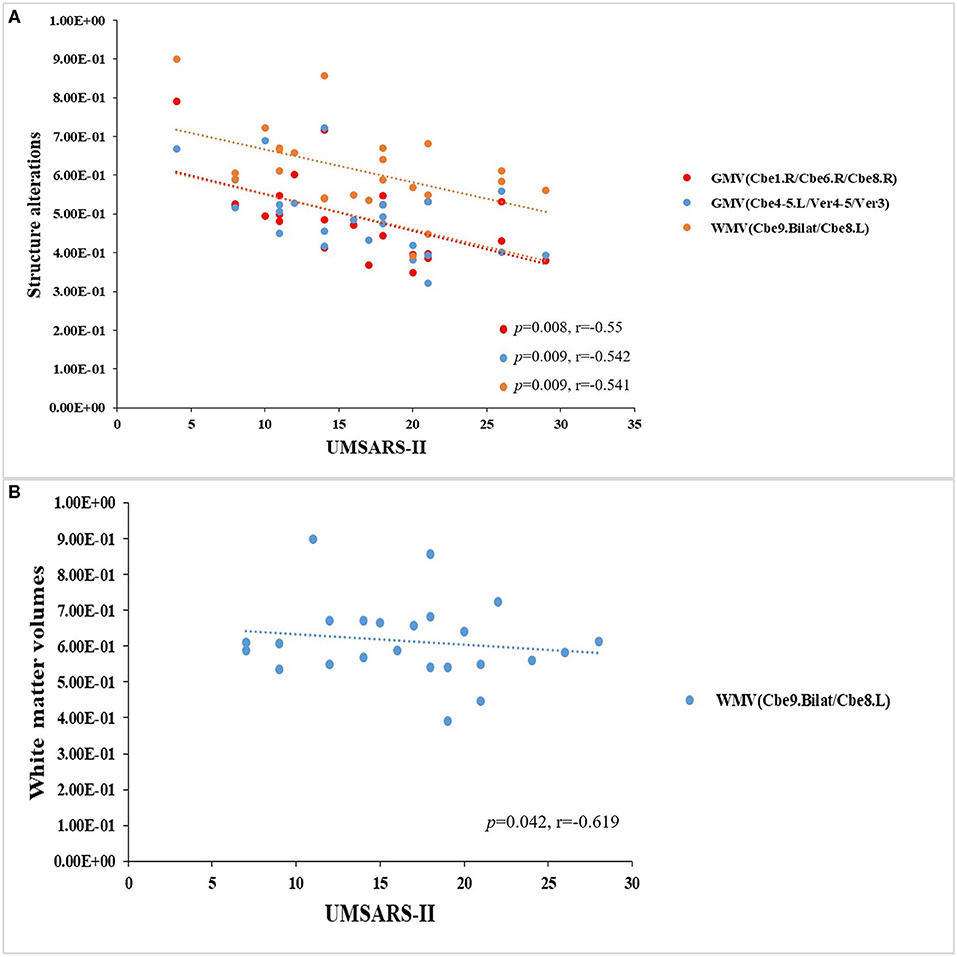
Figure 4. Relationships between clinical variables and multimode MRI parameters in patients with MSAc and MSA-p type, respectively. (A) In the MSA-c type group, we found significant negative correlations between the UMSARS -II scores and structure changes. (B) In the MSA-p type group, we found a negative correlation between the UMSARS -I scores and WM changes.
Figure 5 and Table 3 showed the sensitivity and specificity of the rCBF, structural, and functional changes in MSA-c and MSA-p patients. We differentiated the two groups with a sensitivity of 100% and specificity of 79.2% by using the rCBF values in bilateral cerebellum_4_5/vermis_4_5, the area under the curve (AUC) of the rCBF biomarker was 0.936. By using the GM volume changes in cerebellum and vermis subregions (right cerebellum_1/ cerebellum_6/cerebellum_8, left cerebellum_2/cerebellum_1/cerebellum_7b, and left cerebellum_4_5/vermis_4_5/vermis_3), sensitivities reached 92.3%/84.6%/84.6% and specificities reached 79.2%/83.3%/79.2%, the AUC was 0.880/0.864/0.833, respectively. By using the WM volume changes in bilateral cerebellum_9/ left cerebellum_8, sensitivity reached 76.9% and specificity reached 91.7%, the AUC was 0.851. By using the functional change in LG/FFG, sensitivity reached to 0.6% and specificity reached 75%. The AUC of the function biomarker was 0.845.
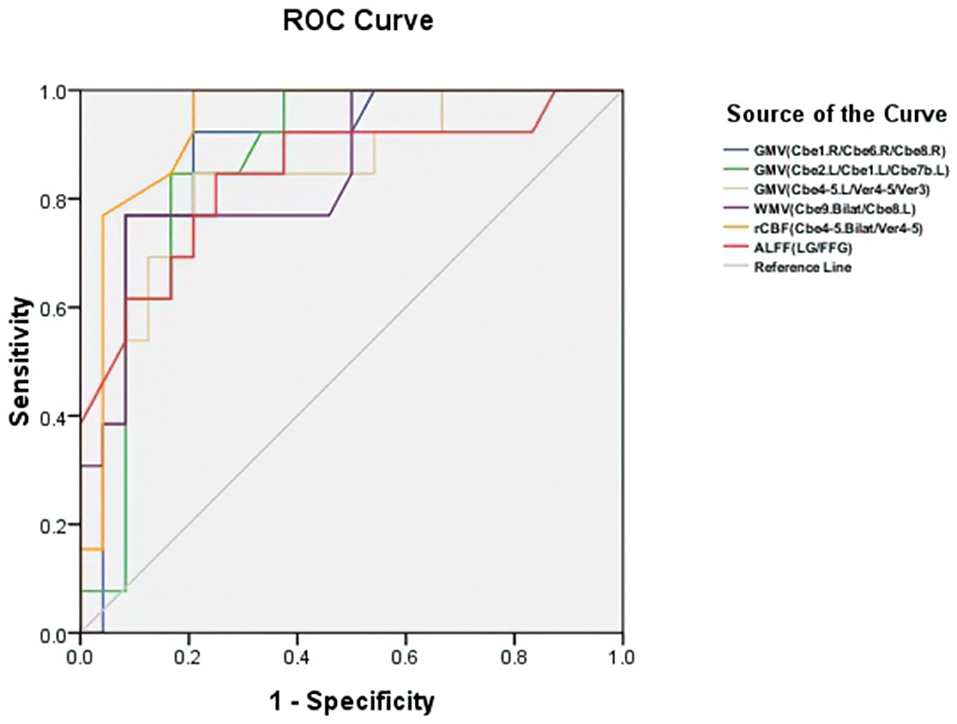
Figure 5. Receiver operating characteristic (ROC) curve for structure, rCBF, and functional alterations in patients with MSA-c and MSA-p. The two groups can be differentiated with a sensitivity of 100% and specificity of 79.2% by using the rCBF values in cerebellum subregions (bilateral cerebellum_4_5) and vermis_4_5, the area under the curve (AUC) of rCBF biomarker was 0.936. By using the GM volume changes in cerebellum and vermis subregions (right cerebellum_1/ cerebellum_6/cerebellum_8, left cerebellum_2/cerebellum_1/cerebellum_7b, and left cerebellum_4_5/vermis_4_5/vermis_3), sensitivities reached 92.3%/84.6%/84.6% and specificities reached 79.2%/83.3%/79.2%, the AUC was 0.880/0.864/0.833, respectively. By using the WM volume changes in bilateral cerebellum_9/ left cerebellum_8, sensitivity reached 76.9% and specificity reached 91.7%, the AUC was 0.851. By using the functional change in right LG/FFG, sensitivity reached 84.6% and specificity reached 75%. The AUC of the function biomarker was 0.845. GMV, gray matter volume; WMV, white matter volume; rCBF, regional cerebral blood flow; ALFF, amplitude of low-frequency fluctuations; L, left; R, right; Bilat, bilateral; Cbe, cerebellum; Ver, vermis; LG, lingual gyrus; FFG, fusiform.
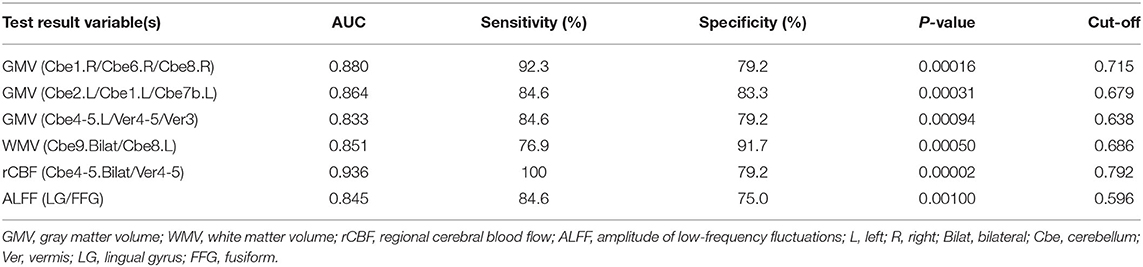
Table 3. Receiver operating characteristic (ROC) curve for structure, rCBF, and functional alterations in MSA-c and MSA-p patients.
By applying VBM, ASL, and ALFF analysis to the resting state data acquired from patients with MSA-c and MSA-p, we observed significant structure atrophy in several cerebellum and vermis subregions decreased perfusion in bilateral cerebellum_4_5/vermis_4_5, and decreased ALFF values in the right LG/FFG in patients with MSA-c type, relative to patients with MSA-p type. Subsequent analyses revealed the close correlations among structure, perfusion, and function in patients with MSA-c or MSA-p type. Then, we found significant negative correlations between the UMSARS scores and structure changes in patients with both MSA-c and MSA-p type. Finally, according to the ROC analysis, we found the rCBF value of bilateral cerebellum_4_5/vermis_4_5 could be used as a sensitive biomarker to differentiate MSA-c from patients with MSA-p, with a sensitivity of 100% and specificity of 79.2%. These findings may improve the understanding of the neural pathophysiology mechanisms of different types of MSA from the perspective of perfusion-structure-function coupling.
The cerebellum plays an important role in sensorimotor circuits, which receives information from the spinal cord, trigeminal nerve, vestibule, cerebral cortex, parietal tectum, and sends it to the motor-related regions to regulate movement (Timmann and Daum, 2010). As we knew from the cerebello-cortical circuit, the afferent fibers of the cerebellum form the middle and lower cerebellar peduncles, transferring information mainly from the opposite cerebello-pontine nucleus and the inferior olivary nucleus to the neocerebellum and the efferent fibers of the cerebellum form the main body of the superior cerebellar peduncles, sending information from the neocerebellum to the contralateral thalamus and cerebral cortex. From the view of this process, many cerebella subregions played important roles in the sensorimotor network, which were responsible for the balance, planning, and coordination of motor functions. Early studies believed that the main function of the cerebellum was motor control (Andermann et al., 1975; Takagi et al., 1998). In recent years, many neuroanatomies, neuroimaging, and clinical studies have shown that different subregions of the cerebellum and vermis participate in the different functions, including learning, cognition, emotions, and behaviors (Strick et al., 2009; Gruol et al., 2012; Reeber et al., 2013).
In this study, we observed significant structure atrophy and decreased rCBF in several cerebellum and vermis subregions in patients with MSA-c type relative to patients with MSA-p type. Typical histopathological findings of MSA-c type have been observed predominantly in the cerebellum. Structurally, a recent study revealed the disrupted structural atrophy in the cerebellum of the MSA-c type, including GM loss and WM degeneration (Dash et al., 2019), which was consistent with the current study. Interestingly, we found that the brain areas with reduced perfusion overlapped most of the brain areas with structural atrophy, indicating that decreased perfusion may contribute to the structural impairment in patients with MSA. Specifically, the decreased perfusion of patients with MSA-c type may disrupt the vascular clearance ability, which promotes accumulation of alpha synuclein-positive GCIs and generate neurotoxic matter, finally leading to neurodegeneration of cerebellum (Brettschneider et al., 2017). Therefore, we speculated that the vascular dysfunction of the cerebellum caused by disrupted perfusion might lead to the abnormalities of structure in the patients with MSA-c type. Compared to the patients with MSA-p type, the structure atrophy and reduced perfusion of the cerebellum and vermis subregions were more prominent in patients with MSA-c type, which were consistent with the clinical main symptom of cerebellar ataxia of the MSA-c type disease.
In the present study, we found decreased ALFF in the right LG/FFG in patients with MSA-c type relative to patients with MSA-p. The LG/FFG, as visual association cortex, were responsible for making visual associations, episodic memory consolidation, processing visual imagery, and verbal declarative memory (Bremner et al., 2004; Malhi et al., 2007; Fusar-Poli et al., 2009; Tao et al., 2013; Kukolja et al., 2016). Previous studies have shown that visual and memory participated in regulating sensory and motor function (Dault et al., 2003; Cheng et al., 2004; Ramachandran and Altschuler, 2009; Sayenko et al., 2010; Anguera et al., 2011; Seidler and Carson, 2017; Fisher et al., 2019). In one of the previous studies, we also found functional changes in visual-related regions in patients with MSA-c type relative to healthy controls (Zheng et al., 2019). The direct comparison between the two MSA subtype groups suggested that the visual association cortex may be involved in regulating motor function and present significant ALFF differences in the two groups. The exact mechanism remains unclear.
A recent study revealed the coupling relationships between structure and function in the human brain (Baum et al., 2020). Another study assessed baseline associations among perfusion and brain structure using linear regression and found that greater whole-brain perfusion loss was associated with worsening brain structure in aging (Staffaroni et al., 2019). In a study combining ASL and fMRI, researchers found that functional brain hubs were identified primarily in the default-mode, insula, and visual regions, which showed striking spatial correlation with rCBF (Liang et al., 2013). These results revealed a close relationship among structure, rCBF, and brain function, which may be helpful to reveal the basic physiological mechanism of human brain interaction.
In this study, according to the correlation analyses among perfusion-structure-function coupling, we found positive correlations within the structure changes in patients with MSAc and MSA-p type separately. Additionally, we found positive correlations between the decreased rCBF and structure atrophy in patients with MSA-c type, which was consistent with the neurovascular coupling hypothesis (Kuschinsky, 1991; Liang et al., 2013; Venkat et al., 2016), indicating that the rCBF changes may contribute to altered structure in the patients with MSA-c type. Besides, negative correlations between the decreased ALFF and structure atrophy in patients with MSA-c were found, which was consistent with the previous studies (Honey et al., 2010; Dacosta-Aguayo et al., 2014). Several studies explored the structure and function interaction and found that the coupling strength may be intrinsically a reflection of mental states (Wang et al., 2015; Huang and Ding, 2016). In the current study, the negative correlations between structure and function suggest the plastic ability of the functional reorganization to resist the structural damage in patients with MSA.
In this study, we found close associations between clinical performances (UMSARS-I/UMSARS-II scores) and structure atrophy in several cerebellum and vermis subregions, suggesting clinical relevance of structural atrophy in different types of MSA. The altered structural atrophy in these regions might be used as imaging markers for tracking disease progression and classification.
In the previous study, several researchers used structure changes as biomarkers to differentiate the MSA-c type and healthy controls. For example, a previous study used the “hot cross bun” sign as a biomarker to diagnose MSA-c type, yielding a high specificity of 97%, but its sensitivity was only 50% (Yekhlef et al., 2000). In the current study, we first employed the VBM, ASL, and ALFF analyses on different subtypes of patients with MSA, and then used different parameters to classify the two groups. Results showed that the rCBF of bilateral cerebellum_4_5/ vermis_4_5 could differentiate the two groups at relatively high accuracy, yielding the sensitivity of 100%, specificity of 79.2%, and the AUC value of 0.936. It could be used as a valuable imaging biomarker for the differentiation between patients of MSA-c and MSA-p type.
First, in this study, we mainly focused on the motor function changes of MSA, as measured by UMSARS. Some patients with MSA might present cognitive dysfunction with the disease progresses. In the future, we will collect more subjects to evaluate cognitive performances. Second, in addition to the VBM protocol, the current evaluation of neurodegenerative diseases (NNDs) include the use of diffusion MRI (dMRI) techniques that allow the assessment of more detailed microstructural architecture and parameters in brain tissue (Gatto et al., 2019, 2021). We will add this imaging technique in the future work. Furthermore, it is more clinically meaningful to add the genetic and molecular biomarkers to help diagnosis MSA-c from MSA-p, and it is useful to make a more longitudinal and dynamic context, including adaptive and neuroplasticity mechanisms in the context of MSA and other NDDs (Gatto, 2020), we will consider all relevant studies in the future work. Finally, the sample size is relatively small and the two sample size is imbalanced, in the future, a large sample of multimodal MRI data need to be collected to test the current findings and a longitudinal design including the pre-symptomatic patients (which is of great significance for the progress of MSA research) would be performed to elucidate the progressive changes of the different types of patients with MSA.
In conclusion, by simultaneously applying VBM, ASL, and ALFF analysis to differentiate MSA-c from patients with MSA-p type, we observed significant structure atrophy and perfusion reduced in several cerebellum and vermis subregions and decreased ALFF in visual-related regions in patients with MSA-c type, compared to patients with MSA-p type. In addition, we found coupling relationships among perfusion, structure and function, as well as significant negative correlations between the UMSARS scores and structure atrophy in patients with MSA. Finally, we found the rCBF value of bilateral cerebellum_4_5/-vermis_4_5 could be used as a sensitive biomarker to differentiate MSA-c from MSA-p. These findings have important implications for understanding the underlying neurobiology of different types of MSA and added the new evidence for the disrupted rCBF, structure and function of MSA, which may provide the potential biomarker for accurately detecting different types of MSA and new ideas for the treatment of different types of MSA in the future.
The datasets presented in this article are not readily available because this data set involves the privacy of the subjects, so it is not convenient to share the data without the consent of the subjects. Requests to access the datasets should be directed to d2FuZ3poaXF1bkAxMjYuY29t.
The studies involving human participants were reviewed and approved by Medical Research Ethical Committee of Dongfang Hospital of Beijing University of Chinese Medicine. The patients/participants provided their written informed consent to participate in this study.
ZC and ZW carried out the research project and conceived the study. SR organized the study. BC and WZ executed the results and wrote the first draft of the manuscript. WZ carried out the statistical analysis and designed the study. BC executed the results. ZW reviewed and critiqued the manuscript. All authors contributed to the article and approved the submitted version.
This study was supported by the Beijing Municipal Natural Science Foundation of China (No. 7182105), the National Natural Science Foundation of China (No. 81571648), the Capital Special Funds for Health Improvement and Research (No. 2018-2-4202), Dongfang Hospital of Beijing University of Traditional Chinese Medicine 1166 Talent Training Project (No. 030903010321), Dongfang Hospital of Beijing University of Chinese Medicine Independent Selection Project (No. 2018-JYBZZ-JS124), Aerospace Center Hospital Youth Innovation Fund (No. 2020QN03), a scientific research fund of Aerospace Center Hospital (No. YN201901), a scientific research fund of China Aerospace Science & Industry Corp (No. 2019-LCYL-010), and the USA NIH grant (No. AG067024). This study received funding from China Aerospace Science & Industry Corp. The funder was not involved in the study design, collection, analysis, interpretation of data, the writing of this article or the decision to submit it for publication.
The authors declare that the research was conducted in the absence of any commercial or financial relationships that could be construed as a potential conflict of interest.
All claims expressed in this article are solely those of the authors and do not necessarily represent those of their affiliated organizations, or those of the publisher, the editors and the reviewers. Any product that may be evaluated in this article, or claim that may be made by its manufacturer, is not guaranteed or endorsed by the publisher.
Andermann, E., Andermann, F., Joubert, M., Melançon, D., Karpati, G., and Carpenter, S. (1975). Three familial midline malformtion syndromes of the central nervous system: agenesis of the corpus callosum and anterior horn-cell disease; agenesis of cerebellar vermis; and atrophy of the cerebellar vermis. Birth Defects Orig. Artic. Ser. 11, 269–293.
Anguera, J. A., Reuter-Lorenz, P. A., Willingham, D. T., and Seidler, R. D. (2011). Failure to engage spatial working memory contributes to age-related declines in visuomotor learning. J. Cogn. Neurosci. 23, 11–25. doi: 10.1162/jocn.2010.21451
Baum, G. L., Cui, Z., Roalf, D. R., Ciric, R., Betzel, R. F., Larsen, B., et al. (2020). Development of structure-function coupling in human brain networks during youth. Proc. Natl. Acad. Sci. USA. 117, 771–778. doi: 10.1073/pnas.1912034117
Bremner, J. D., Vythilingam, M., Vermetten, E., Vaccarino, V., and Charney, D. S. (2004). Deficits in hippocampal and anterior cingulate functioning during verbal declarative memory encoding in midlife major depression. Am. J. Psychiatry 161, 637–645. doi: 10.1176/appi.ajp.161.4.637
Brettschneider, J., Irwin, D. J., Boluda, S., Byrne, M. D., Fang, L., and Lee, E. B. (2017). Progression of alpha-synuclein pathology in multiple system atrophy of the cerebellar type. Neuropathol. Appl. Neurobiol. 43, 315–329. doi: 10.1111/nan.12362
Chelban, V., Bocchetta, M., Hassanein, S., Haridy, N. A., Houlden, H., and Rohrer, J. D. (2019). An update on advances in magnetic resonance imaging of multiple system atrophy. J. Neurol. 266, 1036–1045. doi: 10.1007/s00415-018-9121-3
Cheng, P., Wang, C., Chung, C., and Chen, C. (2004). Effects of visual feedback rhythmic weight-shift training on hemiplegic stroke patients. Clin. Rehabil. 18, 317–321. doi: 10.1191/0269215504cr778oa
Dacosta-Aguayo R. Graña M. Savio A. Fernández-Andújar M. Millán M. López-Cancio E. . (2014). Prognostic value of changes in resting-state functional connectivity patterns in cognitive recovery after stroke: a 3T fMRI pilot study. Hum. Brain Mapp. 35, 3819–3831. doi: 10.1002/hbm.22439
Dash, S. K., Stezin, A., Takalkar, T., George, L., Kamble, N. L., and Netravathi, M. (2019). Abnormalities of white and grey matter in early multiple system atrophy: comparison of parkinsonian and cerebellar variants. Eur. Radiol. 29, 716–724. doi: 10.1007/s00330-018-5594-9
Dault, M. C., Haart, M., Geurts, A. C. H., and Nienhuis, B. (2003). Effects of visual center of pressure feedback on postural control in young and elderly healthy adults and in stroke patients. Hum. Mov. Sci. 22, 221–236. doi: 10.1016/S0167-9457(03)00034-4
Deguchi, K., Ikeda, K., Kume, K., Takata, T., Kokudo, Y., and Kamada, M. (2015). Significance of the hot-cross bun sign on T2*-weighted MRI for the diagnosis of multiple system atrophy. J. Neurol. 262, 1433–1439. doi: 10.1007/s00415-015-7728-1
Erro, R., Ponticorvo, S., Manara, R., Barone, P., Picillo, M., and Scannapieco, S. (2020). Subcortical atrophy and perfusion patterns in Parkinson disease and multiple system atrophy. Parkinsonism Relat. Disord. 72, 49–55. doi: 10.1016/j.parkreldis.2020.02.009
Fisher, Y. E., Lu, J., Alessandro, L., and Wilson, R. L. (2019). Sensorimotor experience remaps visual input to a heading-direction network. Nature 576, 121–125. doi: 10.1038/s41586-019-1772-4
Fusar-Poli, P., Placentino, A., Carletti, F., Allen, P., Landi, P., Abbamonte, M., et al. (2009). Laterality effect on emotional faces processing: ALE meta-analysis of evidence. Neurosci. Lett. 452, 262–267. doi: 10.1016/j.neulet.2009.01.065
Gatto, R. G. (2020). Molecular and microstructural biomarkers of neuroplasticity in neurodegenerative disorders through preclinical and diffusion magnetic resonance imaging studies. J. Integr. Neurosci. 19, 571–592. doi: 10.31083/j.jin.2020.03.165
Gatto, R. G., Amin, M., Finkielsztein, A., Weissmann, C., Barrett, T., Lamoutte, C., et al. (2019). Unveiling early cortical and subcortical neuronal degeneration in ALS mice by ultra-high field diffusion MRI. Amyotroph. Lateral Scler. Frontotemporal Degener. 20, 549–561. doi: 10.1080/21678421.2019.1620285
Gatto, R. G., Weissmann, C., Amin, M., Angeles-López, Q. D., García-Lara, L., Castellanos, L. C. S., et al. (2021). Evaluation of early microstructural changes in the R6/1 mouse model of Huntington's disease by ultra-high field diffusion MR imaging. Neurobiol. Aging 102, 32–49. doi: 10.1016/j.neurobiolaging.2021.02.006
Gilman, S., Wenning, G. K., Low, P. A., Brooks, D. J., Mathias, C. J., Trojanowski, J. Q., et al. (2008). Second consensus statement on the diagnosis of multiple system atrophy. Neurology 71, 670–676. doi: 10.1212/01.wnl.0000324625.00404.15
Gruol, D., Manto, M., and Haines, D. (2012). Ca2+ signaling in cerebellar Purkinje neurons–editorial. Cerebellum 11, 605–608. doi: 10.1007/s12311-012-0404-4
Haller, S., Zaharchuk, G., Thomas, D. L., Lovblad, K. O., Barkhof, F., and Golay, X. (2016). Arterial spin labeling perfusion of the brain: emerging clinical applications. Radiology 281, 337–356. doi: 10.1148/radiol.2016150789
Hartkamp, N. S., Petersen, E. T., De Vis, J. B., Bokkers, R. P., and Hendrikse, J. (2013). Mapping of cerebral perfusion territories using territorial arterial spin labeling: techniques and clinical application. NMR Biomed. 26, 901–912. doi: 10.1002/nbm.2836
Honey, C. J., Thivierge, J. P., and Sporns, O. (2010). Can structure predict function in the human brain?. Neuroimage 52, 766–776. doi: 10.1016/j.neuroimage.2010.01.071
Huang, H., and Ding, M. (2016). Linking functional connectivity and structural connectivity quantitatively: a comparison of methods. Brain Connect. 6, 99–108. doi: 10.1089/brain.2015.0382
Krismer, F., Seppi, K., Wenning, G. K., Papapetropoulos, S., Abler, V., Goebel, G., et al. (2019). Abnormalities on structural MRI associate with faster disease progression in multiple system atrophy. Parkinsonism Relat. Disord. 58, 23–27. doi: 10.1016/j.parkreldis.2018.08.004
Krismer, F., and Wenning, G. K. (2017). Multiple system atrophy: insights into a rare and debilitating movement disorder. Nat. Rev. Neurol. 13, 232–243. doi: 10.1038/nrneurol.2017.26
Kukolja, J., Göreci, D. Y., Onur, Ö. A., Riedl, V., and Fink, G. R. (2016). Resting-state fMRI evidence for early episodic memory consolidation: effects of age. Neurobiol. Aging 45, 197–211. doi: 10.1016/j.neurobiolaging.2016.06.004
Kuschinsky, W. (1991). Coupling of function, metabolism, and blood flow in the brain. Neurosurg. Rev. 14, 163–168. doi: 10.1007/BF00310651
Liang, X., Zou, Q., He, Y., and Yang, Y. (2013). Coupling of functional connectivity and regional cerebral blood flow reveals a physiological basis for network hubs of the human brain. Proc. Natl. Acad. Sci. USA. 110, 1929–1934. doi: 10.1073/pnas.1214900110
Malhi, G. S., Lagopoulos, J., Owen, A. M., Ivanovski, B., Shnier, R., and Sachdev, P. (2007). Reduced activation to implicit affect induction in euthymic bipolar patients: an fMRI study. J. Affect. Disord. 97, 109–122. doi: 10.1016/j.jad.2006.06.005
Matsusue, E., Fujii, S., Kanasaki, Y., Kaminou, T., Ohama, E., and Ogawa, T. (2009). Cerebellar lesions in multiple system atrophy: postmortem MR imaging-pathologic correlations. AJNR Am. J. Neuroradiol. 30, 1725–1730. doi: 10.3174/ajnr.A1662
Ramachandran, V. S., and Altschuler, E. L. (2009). The use of visual feedback, in particular mirror visual feedback, in restoring brain function. Brain 132, 1693–1710. doi: 10.1093/brain/awp135
Reeber, S. L., Otis Tom, S., and Sillitoe Roy, V. (2013). New roles for the cerebellum in health and disease. Front. Syst. Neurosci. 7:83. doi: 10.3389/fnsys.2013.00083
Ren, S., Zhang, H., Zheng, W., Liu, M., Gao, F., Wang, Z., et al. (2019). Altered functional connectivity of cerebello-cortical circuit in multiple system atrophy (cerebellar-type). Front. Neurosci. 12:996. doi: 10.3389/fnins.2018.00996
Sayenko, D., Alekhina, M., Masani, K., Vette, A., Obata, H., Popovic, M., et al. (2010). Positive effect of balance training with visual feedback on standing balance abilities in people with incomplete spinal cord injury. Spinal Cord. 48, 886–893. doi: 10.1038/sc.2010.41
Seidler, R. D., and Carson, R. G. (2017). Sensorimotor learning: neurocognitive mechanisms and individual differences. J. Neuroeng. Rehabil. 14:74. doi: 10.1186/s12984-017-0279-1
Staffaroni, A. M., Cobigo, Y., Elahi, F. M., Casaletto, K. B., Walters, S. M., Wolf, A., et al. (2019). A longitudinal characterization of perfusion in the aging brain and associations with cognition and neural structure. Hum. Brain Mapp. 40, 3522–3533. doi: 10.1002/hbm.24613
Strick, P. L., Dum Richard, P., and Fiez Julie, A. (2009). Cerebellum and nonmotor function. Annu. Rev. Neurosci. 32, 413–434. doi: 10.1146/annurev.neuro.31.060407.125606
Takagi, M., Zee, D. S., and Tamargo, R. J. (1998). Effects of lesions of the oculomotor vermis on eye movements in primate: saccades. J. Neurophysiol. 80, 1911–1931. doi: 10.1152/jn.1998.80.4.1911
Tao, H., Guo, S., Ge, T., Kendrick, K. M., Xue, Z., Liu, Z., et al. (2013). Depression uncouples brain hate circui. Mol. Psychiatry 18, 101–111. doi: 10.1038/mp.2011.127
Timmann, D., and Daum, I. (2010). How consistent are cognitive impairments in patients with cerebellar disorders? Behav. Neurol. 23, 81–100. doi: 10.1155/2010/401048
Venkat, P., Chopp, M., and Chen, J. (2016). New insights into coupling and uncoupling of cerebral blood flow and metabolism in the brain. Croat. Med. J. 57, 223–228. doi: 10.3325/cmj.2016.57.223
Wang, N., Edmiston, E. K., Luo, X., Yang, H., Chang, M., Wang, F., et al. (2017). Comparing abnormalities of amplitude of low-frequency fluctuations in multiple system atrophy and idiopathic Parkinson's disease measured with resting-state fMRI. Psychiatry research. Neuroimaging 269, 73–81. doi: 10.1016/j.pscychresns.2017.09.002
Wang, Z., Dai, Z., Gong, G., Zhou, C., and He, Y. (2015). Understanding structural-functional relationships in the human brain: a large-scale network perspective. Neuroscientist 21, 290–305. doi: 10.1177/1073858414537560
Xu, G., Rowley, H. A., Wu, G., Alsop, D. C., Shankaranarayanan, A., Dowling, M., et al. (2010). Reliability and precision of pseudo-continuous arterial spin labeling perfusion MRI on 3.0 T and comparison with 15O-water PET in elderly subjects at risk for Alzheimer's disease. NMR Biomed. 23, 286–293. doi: 10.1002/nbm.1462
Yan C. G, and Zang, Y. F. (2010). DPARSF: A MATLAB toolbox for “pipeline” data analysis of resting-state fMRI. Front. Syst. Neurosci. 4:13. doi: 10.3389/fnsys.2010.00013
Yekhlef, F., Ballan, G., Macia, F., Delmer, O., Sourgen, C., Vital, C., et al. (2000). Differentiation of atypical parkinsonian syndromes with routine MRI. Neurology 55, 1239–1240. doi: 10.1212/WNL.55.8.1239-a
You, H., Wang, J., Wang, H., Zang, Y. F., Zheng, F. L., Meng, C. L., et al. (2011). Altered regional homogeneity in motor cortices in patients with multiple system atrophy. Neurosci. Lett. 502, 18–23. doi: 10.1016/j.neulet.2011.07.015
Zang, Y. F., He, Y., Zhu, C. Z., Cao, Q. J., Sui, M. Q., Liang, M., et al. (2007). Altered baseline brain activity in children with ADHD revealed by resting-state functional MRI. Brain Dev. 29, 83–91. doi: 10.1016/j.braindev.2006.07.002
Zhang, J. (2016). How far is arterial spin labeling MRI from a clinical reality? Insights from arterial spin labeling comparative studies in Alzheimer's disease and other neurological disorders. J. Magn. Reson. Imaging 43, 1020–1045. doi: 10.1002/jmri.25022
Zheng, W., Ren, S., Zhang, H., Liu, M., Zhang, Q., Chen, Z., et al. (2019). Spatial patterns of decreased cerebral blood flow and functional connectivity in multiple system atrophy (cerebellar-type): a combined arterial spin labeling perfusion and resting state functional magnetic resonance imaging study. Front. Neurosci. 13:777. doi: 10.3389/fnins.2019.00777
Keywords: cerebellum-type of multiple system atrophy, Parkinson-type of multiple system atrophy, voxel-based morphology, regional cerebral blood flow, amplitude low frequency fluctuation
Citation: Cui B, Zheng W, Ren S, Chen Z and Wang Z (2021) Differentiation of Cerebellum-Type and Parkinson-Type of Multiple System Atrophy by Using Multimodal MRI Parameters. Front. Aging Neurosci. 13:687649. doi: 10.3389/fnagi.2021.687649
Received: 29 March 2021; Accepted: 29 June 2021;
Published: 03 August 2021.
Edited by:
Bogdan O. Popescu, Carol Davila University of Medicine and Pharmacy, RomaniaReviewed by:
Drozdstoy Stoyanov Stoyanov, Plovdiv Medical University, BulgariaCopyright © 2021 Cui, Zheng, Ren, Chen and Wang. This is an open-access article distributed under the terms of the Creative Commons Attribution License (CC BY). The use, distribution or reproduction in other forums is permitted, provided the original author(s) and the copyright owner(s) are credited and that the original publication in this journal is cited, in accordance with accepted academic practice. No use, distribution or reproduction is permitted which does not comply with these terms.
*Correspondence: Zhigang Chen, Y2hlbnpoaWdhbmc2NEAxMjYuY29t; Zhiqun Wang, d2FuZ3poaXF1bkAxMjYuY29t
†These authors have contributed equally to this work
Disclaimer: All claims expressed in this article are solely those of the authors and do not necessarily represent those of their affiliated organizations, or those of the publisher, the editors and the reviewers. Any product that may be evaluated in this article or claim that may be made by its manufacturer is not guaranteed or endorsed by the publisher.
Research integrity at Frontiers
Learn more about the work of our research integrity team to safeguard the quality of each article we publish.