- Department of Psychology, Dalhousie University, Halifax, NS, Canada
Ishigami and Klein (2010) showed that scores of the three attention networks (alerting, orienting, and executive control) measured with the two versions of the Attention Network Test (ANT; Fan et al., 2002; Callejas et al., 2005) were robust over 10 sessions of repeated testing even though practice effects were consistently observed especially in the executive network when young adults were tested. The current study replicated their method to examine robustness, stability, reliability, and isolability of the networks scores when older adults were tested with these ANTs. Ten test sessions, each containing two versions of the ANT, were administered to 10 older adults. Participants were asked to indicate the direction of a target arrow, flanked by distractors, presented either above or below the fixation following auditory signals or/and visual cue. Network scores were calculated using orthogonal subtractions of performance in selected conditions. All network scores remained highly significant even after nine previous sessions despite some practice effects in the executive and the alerting networks. Some lack of independence among the networks was found. The relatively poor reliability of network scores with one session of data rises to respectable levels as more data is added.
Introduction
Posner and Petersen (1990) proposed three networks of attention – alerting, orienting, and executive control. These networks are defined in anatomical and functional terms by finding correspondence between areas of activation in the brain and in performance on attention tasks that measure different functions of attention. Alerting involves a change in mental state as well as in physiological state, and prepares the organism for fast reactions. These changes follow the presentation of a signal that provides information that a task-relevant event will occur soon (Posner, 1978). Thalamic, frontal, and parietal areas are involved in alerting (e.g., Posner and Petersen, 1990; Coull et al., 1996; Marrocco and Davidson, 1998). Orienting involves selective allocation of attention to a source of signals in space (Posner, 1980). The superior parietal lobe, temporal–parietal junction, and frontal eye fields have been associated with this function (Corbetta and Shulman, 2002). Executive attention involves conflict resolution and control over decision-making, error detection, and habitual response inhibition (Norman and Shallice, 1986). The anterior cingulate and prefrontal areas have been associated with this function (e.g., Bush et al., 2000; Casey et al., 2000; MacDonald et al., 2000).
Attention has been of interest in the literature on aging because aging in humans includes a multidimensional process of attentional changes. However, the precise empirical relationship between aging and attention remains somewhat inconclusive (for reviews, see Kok, 1999, 2000; Groth and Allen, 2000; Rogers, 2000). We will begin by briefly reviewing how aging affects the three components of attention (alerting, orienting, and executive control) proposed by Posner and Petersen (1990) above. Then, we will describe the Attention Network Test (ANT), originally developed by Fan et al. (2002) to measure the efficacy of these networks and a modification of this test developed by Callejas et al. (2005). We will then present an empirical investigation using these two versions of the ANT to explore how stable, isolable, robust1, and reliable are the measures they provide when they are administered to elderly participants on 10 separate occasions.
Alerting
Alertness can be subdivided into phasic and tonic alertness. Tonic alertness or sustained attention is a state of general wakefulness or vigilance and refers to one’s ability to sustain attention over a period of time. Phasic alertness involves a rapid change in mental state and physiological state following a presentation of a warning signal, and prepares the individual for fast reactions (Posner, 1978). Alerting, as discussed in the context of the ANT (Fan et al., 2002; Callejas et al., 2005; see below), is phasic alertness. Phasic alertness is typically examined by comparing performance with warning signals and without warning signals. Previous studies show that aging has relatively little effect on phasic alertness (e.g., Rabbitt, 1984; Nebes and Brady, 1993; Tales et al., 2002a) when the stimulus onset asynchrony (SOA) between the warning signal and the target was fixed. However, when SOA was varied within a block, Festa-Martino et al. (2004) reported that older adults showed smaller alerting effects than younger adults.
Orienting
Orienting, which can be controlled by primarily exogenous or endogenous means, involves selective allocation of attention to a source of signals in space (Posner, 1980). The standard paradigm for studying orienting is the Posner spatial cueing task (Posner, 1980). Benefits and costs in performance associated with valid and invalid cues or cueing effects associated with these cues (e.g., invalid minus valid reaction time, RT) are examined. Previous studies show that aging may have relatively little effect on exogenous or automatic orienting to peripheral cues regardless of their predictability regarding the targets (Hartley et al., 1990; Greenwood et al., 1993; Brodeur and Enns, 1997; Tales et al., 2002b; Festa-Martino et al., 2004, E3; Waszak et al., 2010)2. However, results regarding endogenous or voluntary orienting are mixed in literature3. Some studies report that the older adults show larger cueing effects (Nissen and Corkin, 1985; Hartley et al., 1990; Folk and Hoyer, 1992, E1; Greenwood et al., 1993, E2) while other studies report that these effects are similar for the older and the young adults (Hartley et al., 1990; Brodeur and Enns, 1997, E3; Lincourt et al., 1997; Tales et al., 2002b).
Executive Control
Executive attention involves conflict resolution and control over decision-making, error detection, and habitual response inhibition (Norman and Shallice, 1986). One of the typical “interference” paradigms used to examine conflict resolution is the flanker task (Eriksen and Eriksen, 1974). In this task, filtering out irrelevant information is required to perform the task efficiently (e.g., ignoring flanking distractors in the flanker task). Whereas congruency effects (incongruent distractor trials minus congruent distractor trials) for young and older adults are generally similar when ignoring irrelevant letter identities was required (e.g., Kramer et al., 1994; Madden and Gottlob, 1997), Waszak et al. (2010) found greater congruency effects for older adults when ignoring irrelevant colors was required. Further, Zeef et al. (1996) found greater congruency effects for older adults, but only when the smallest distance between targets and distractors was tested. D’Aloisio and Klein (1990) also found a similar pattern in their analysis of RT. When D’Aloisio and Klein (1990) took accuracy into account, however, they reported that the difference between the young and the older adults diminished.
Typically, the different components of attention have been examined using different paradigms. Thus, three different experiments may be conducted to examine these attention components within the same individuals. In that case, it is not possible to examine how these components interact. The ANT, however, enables us to examine these attention components all at once and to examine how they interact. The original ANT was developed by Fan et al. (2002) to measure three attention networks: alerting, orienting, and executive control. Later, the Attention Network Test-Interaction (ANT-I) was developed by Callejas et al. (2005) to improve the ANT (see Ishigami and Klein, 2009, 2010, for detailed methods and differences between the ANT and the ANT-I).
Essentially, the ANT (and the ANT-I) is a combination of the Posner spatial cueing task (Posner, 1980) and the Eriksen flanker task (Eriksen and Eriksen, 1974). On each trial, different types of warning cues precede a central target arrow, pointing either left or right, that is often flanked by irrelevant (distracting) arrows (Figures 1A,B). The participants’ task is to indicate the direction of the target arrow as quickly and accurately as possible. Specific subtraction scores are used to measure the efficiency of three different attention networks (Table 1).
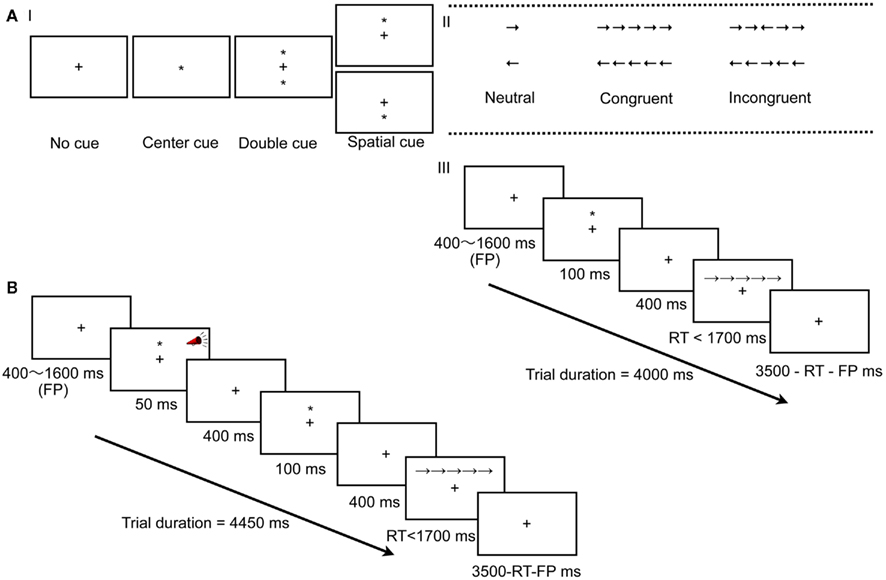
Figure 1. (A) Experimental procedure of the ANT (Fan et al., 2002). (I) The six stimuli used in the present experiment. And (III) an example of the procedure; a spatial cue is presented followed by a target (central) arrow. (B) Experimental procedure of the ANT-1 (Callejas et al., 2005). An example of the procedure; an auditory signal is presented, followed by a valid cue, and a target (central) arrow flanked by congruent arrows.
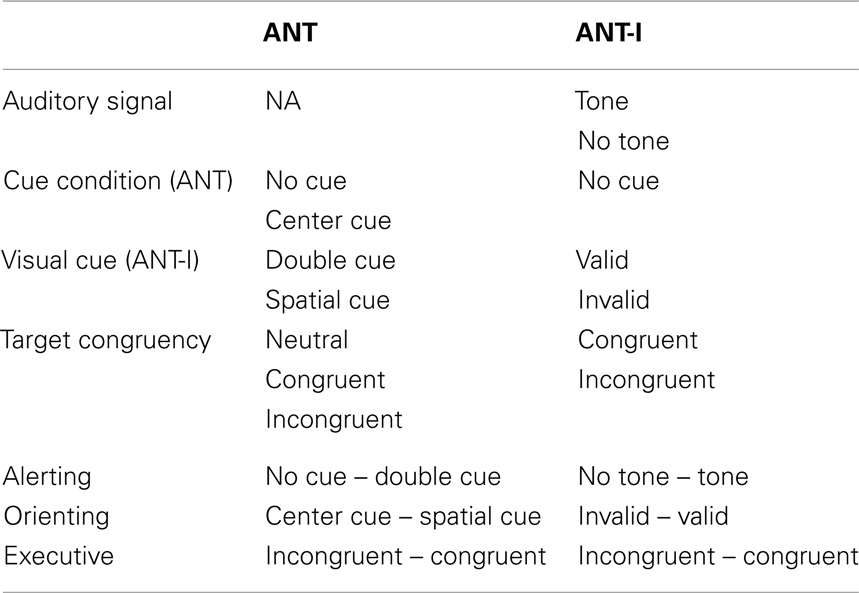
Table 1. Conditions and their levels (top) and subtractions (bottom) for each network for the ANT and the ANT-I.
Studies of aging using the ANTs are limited. Jennings et al. (2007) examined age effects on the alerting, orienting, and executive networks. The ANT was administered to 63 older adults and 60 young adults. They found an interaction between cue condition (center cue, double cue, spatial cue, and no cue) and target congruency (congruent, incongruent, and neutral; see also Fan et al., 2002; Ishigami and Klein, 2009, 2010). The interactions between age and alerting and between age and executive control were significant, reflecting that the older adults showed smaller alerting effects and greater executive effects than the young adults4.
Fernandez-Duque and Black (2006) administered a modified version of the ANT to 13 undergraduate students, 13 older adults, and 13 Alzheimer’s disease (AD) patients. The key difference from the original ANT was the use of invalidly cued target trials which constituted 25% of the trials following a spatial cue. This allowed the authors to define the orienting component as the difference in performance between valid and invalid trials. With regard to differences related to aging, they found that (1) the executive network was affected by the alerting network both with the students and the older adults (i.e., the congruency effects were larger in the presence of the alerting cue; see also Callejas et al., 2005; Ishigami and Klein, 2009, 2010), (2) the executive network was affected by the orienting network only with the older adults (i.e., the congruency effects were larger in the presence of the valid cue; see Callejas et al., 2005; Ishigami and Klein, 2009, 2010 for the opposite interaction), (3) the alerting network score was greater for the older adults than for the students, (4) the orienting network did not differ between the two groups, and (5) the executive network of the older adults was as efficient as that of the students.
These studies using the ANT do not support observations in literature that aging has relatively little effect on phasic alertness (e.g., Rabbitt, 1984; Nebes and Brady, 1993). In contrast, studies using the ANT support the observation that the aging has little effect on endogenous orienting (Hartley et al., 1990; Brodeur and Enns, 1997, E3; Lincourt et al., 1997; Tales et al., 2002b) and on executive control (Wright and Elias, 1979; D’Aloisio and Klein, 1990; Kramer et al., 1994; Madden and Gottlob, 1997, but see Waszak et al., 2010).
These studies show an importance and usefulness of the ANT for studying and comparing the attention networks with wide range of populations. One class of situation for which the ANT might be useful is when repeated testing is required. Researchers, for example, may be interested in developing training programs to overcome age-related impairments in attention. To assess the efficiency of such a program, repeated testing would be required. Researchers have also been interested in evaluating the effects of attention training or rehabilitation on the specific components of attention in clinical populations (e.g., Robertson et al., 1995; Sturm et al., 1997, 2006; Sohlberg et al., 2000; Pero et al., 2006; Thimm et al., 2006; Serino et al., 2007) and in healthy older populations (e.g., Bherer et al., 2008). Thus, it is important to understand how performance of each network score changes when the ANT is repeatedly administered over time.
Despite the use of the ANT in pre-/post-testing (Jha et al., 2007; Tang et al., 2007) and its potential use in clinical and aging studies (e.g., Robertson et al., 1995), little is known about how performance of the three attention networks changes over time with repeated administrations and whether performance in the two versions the ANT (i.e., the ANT and the ANT-I) changes in the same way. The only exception comes from a recent study of the performance of young adults on these tests by Ishigami and Klein (2010). They tested 10 young adults with the ANT and the ANT-I over 10 different sessions. Although participants became better at ignoring irrelevant information and at disengaging from attended locations over time, all network scores measured by both ANTs remained robust even after 10 sessions. The scores measured with the ANT-I were generally more reliable than with the ANT. Both the ANT and the ANT-I were suggested to be a potential tool to measure the attention networks when tested repeatedly.
Replicating the method used by Ishigami and Klein (2010), the objective of the current study is to examine the stability, robustness, and reliability of the attention networks derived from both versions of the ANT over repeated testing in older adults. In addition, isolability of the network scores derived from each version will be examined. Then, two versions of the ANT will be compared to determine if there were any substantial differences in their utility and whether they tap the same three components of attention. As in Ishigami and Klein (2010): the temporal stability of the scores will be examined by analysis of variances (ANOVAs) with session as a factor to determine whether the magnitude of the score was changing with practice on the task; the robustness of the scores will be examined using one sample t-tests to evaluate the significance of each component’s score in the different testing sessions; reliability (or intra-participant stability) will be examined by computing for each network the correlation across different combinations of sessions (as will be described in more detail later); and, isolability will be examined by determining whether there are significant interactions among the measures of the networks in the ANOVAs and whether there are significant correlations among the three networks.
Materials and Methods
Participants
Ten participants (four females and six males) took part in the current experiment. They were recruited from the local community paid for their participation ($10.00/session). The participants ranged in age from 65 to 76 (mean = 69.1 and SD = 3.6). All participants self-reported to be physically and mentally healthy (i.e., not having received a diagnosis of any mental disorders by a health practitioner) and to have normal or corrected-to-normal vision. All participants completed an informed consent form and the study was approved by the Dalhousie Sciences and Humanities Human Research Ethics Board.
Apparatus
We used the program written in Python programming language by Michael A Lawrence. A 17″ MacBook Pro controlled stimulus presentation and response collection. The ANT is based on a program developed by researchers at the Sackler Institute for Developmental Psychology. The ANT-I is based on a program developed by Callejas et al. (2005).
Stimuli and Design
The sequence of events for both tests can be seen in Figures 1A,B. For more specific details we refer the reader to the original papers by Fan et al. (2002), Callejas et al. (2005), or to Ishigami and Klein (2009). The experiment contained four blocks for the ANT and seven blocks for the ANT-I. A practice block (24 trials) was followed by experimental blocks (three 96 trials/block for the ANT and six 48 trials/block for the ANT-I). Cue and target congruency conditions for the ANT and auditory signal, cue condition, and target congruency conditions for the ANT-I were orthogonally crossed in the experimental blocks. The 12 possible combinations from each condition were pseudo-randomly presented so that there were eight trials and four trials for each combination in a block for the ANT and the ANT-I, respectively.
Procedure
The instructions (both oral and written) emphasized the importance of quick and accurate responding. The participants were told to maintain fixation at the fixation cross all the time. They were encouraged to attend when and where indicated by the cues in the ANT. The experimenter was present only at the beginning of each session in the testing room to start the experiment and to answer participants’ questions regarding the instructions. In both the ANT and the ANT-I, feedback following errors was given visually only in the practice blocks. Participants performed both versions of the ANT in each session, which lasted about an hour and this was repeated 10 times (i.e., 10 days). The ANT and the ANT-I were administered in an alternating order across sessions. In addition, the order of the ANTs was counterbalanced across the participants. Intervals between consecutive sessions were not fixed and the mean interval was 6.7 days (SD = 5.1).
Results
ANT
For each participant, trials with improper responses (e.g., responses made before the target was presented) or trials with no responses were excluded (2.0%). Then, mean correct RT after eliminating extreme values (less than 200 ms) and more than 1700 ms: less than 0.1% of the total analyzable data) and mean error rate were computed and subjected to analyses. Table 2 shows mean correct RT and error rate collapsed across session, and Figures 2A-1,A-2 show mean correct RT and error rate for cue condition and target congruency as a function of session.
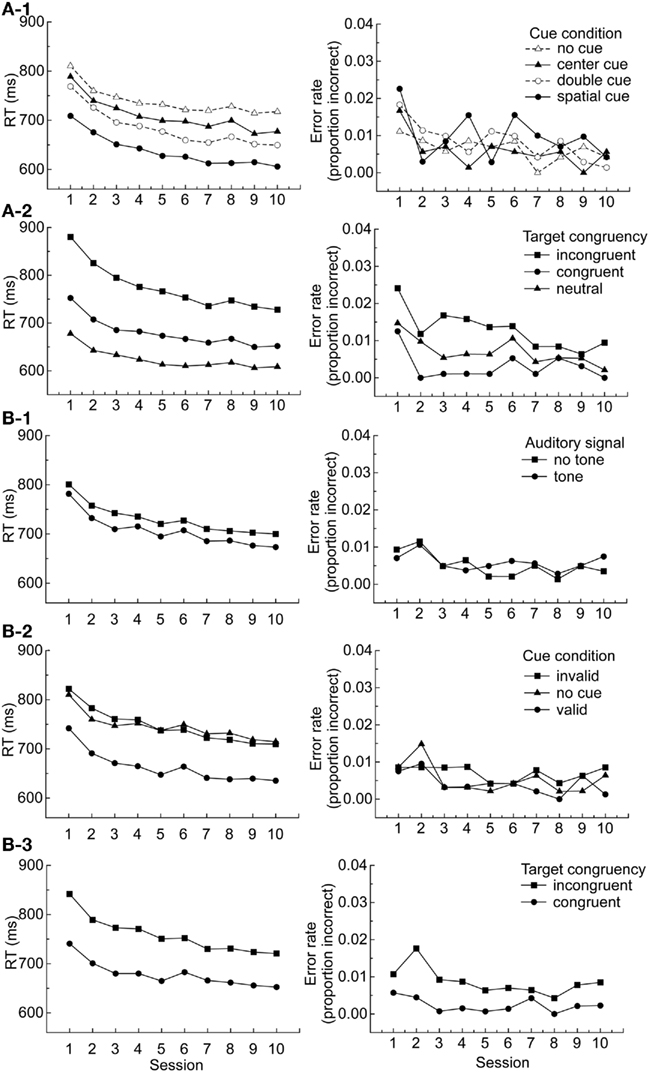
Figure 2. (A) Mean correct RT and error rate on the ANT as a function of cue condition and session (1) and target congruency and session (2), (B) Mean correct RT and error rate on the ANT-I as a function of auditory signal and session (1), cue condition and session, and target congruency and session (3).
Stability and isolability of the network scores
To permit comparison with the literature (which typically only has one session) analyses were done separately for Session 1 and Sessions 1–10. ANOVAs were used to examine stability (Do effects change over the 10 sessions?) and isolability (Do conditions interact?), and isolability was also analyzed using correlation.
ANOVAs. The mean correct RT and the mean error rate were submitted to ANOVAs with cue condition (central, spatial, double, and no cues), and target congruency (neutral, congruent, and incongruent) as repeated-measures factors; Session (1–10) was also a factor for the Sessions 1–10 analyses.
Session 1 (Figure 3A-1): For RT, the main effects of cue condition, F (3, 27) = 63.08, p < 0.0001, and target congruency, F (2, 18) = 171.43, p < 0.0001, were significant. The interaction between cue condition and target congruency was marginally significant, F (6, 54) = 2.12, p = 0.066. Here it can be seen that the congruency effect was greater when participants were alerted by non-spatial cues (double cue). For error rate, the main effect of target congruency was significant, F (2, 18) = 3.66, p < 0.05. No other effects or interactions were significant.
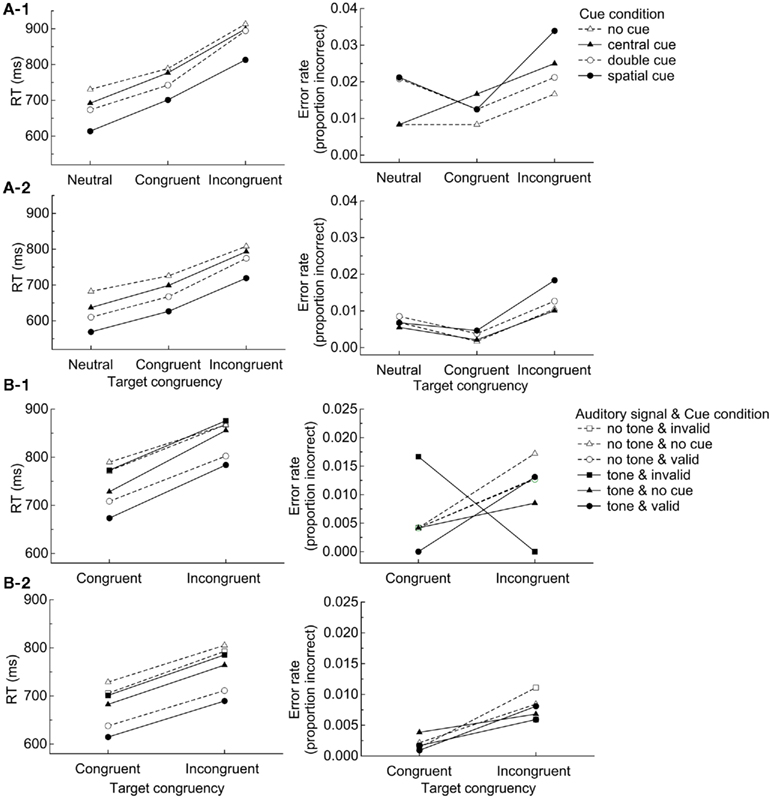
Figure 3. (A) Mean correct RT and error rate on the ANT as a function of cue condition and target congruency for session 1 (1) and sessions 1–10 (2), (B) Mean correct RT and error rate on the ANT-I as a function of target congruency and auditory signal and validity for session 1 (1) and sessions 1–10 (2).
Sessions 1–10 (Figure 3A-2): For RT, the main effect of session was significant, F (9, 81) = 12.54, p < 0.0001, reflecting decreasing RT over time (see Figure 2A). The main effects of cue condition, F (3, 27) = 94.00, p < 0.0001, and target congruency, F (2, 18) = 108.021, p < 0.0001, were significant. The interaction between cue condition and target congruency was significant, F (6, 54) = 4.85, p < 0.001, reflecting some lack of independence among the networks. In addition, the interactions between session and cue condition and session and target congruency were significant, F (27, 243) = 1.59, p < 0.05 and F (18, 162) = 6.69, p < 0.0001, respectively. These patterns reflect practice effects that were due mainly to greater improvements over sessions in the double cue condition (Figure 2A-1) and the incongruent condition (Figure 2A-2). The three-way interaction between cue condition, target congruency, and session was not significant, F (45, 486) = 0.87. The practice effects for the alerting (no cue minus double cue) and the executive (incongruent minus congruent) networks were examined by running separate ANOVAs. The mean alerting network scores and the mean executive network scores in RT were submitted to ANOVAs with session as a repeated-measures factor to examine quantitative patterns of performance in each network across the sessions. The main effect of session was significant, F (9, 81) = 2.62, p < 0.05, F (9, 81) = 5.64, p < 0.0001, for the alerting and the executive networks, respectively; the alerting scores increased and the executive scores decreased as the sessions progressed. For error rate, the main effect of congruency, F (2, 18) = 8.04, p < 0.01 was significant. The interaction between session and cue condition was marginally significant, F (27, 243) = 1.49, p = 0.062. No other effects were significant.
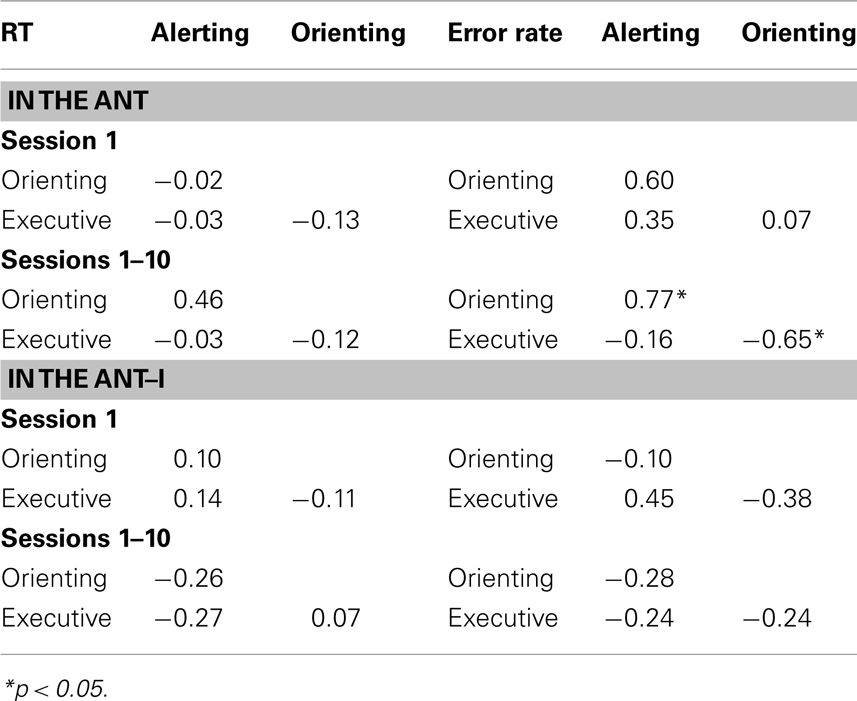
Correlational analyses. Session 1: Table 3 shows the correlations among the alerting, orienting, and executive networks. There were no significant correlations in the analysis of either the RT or error network scores, ps > 0.05. The lack of significant relationships was not surprising due to the small number of trials included in the analysis of just one session combined with the small number of participants.
Sessions 1–10: Means from the 10 sessions were entered in the correlation analyses. There were no significant correlations in the analysis of the RT network scores, ps > 0.05 (Table 3). In the analysis of the error rate the positive correlation between the alerting and the orienting network scores and the negative correlation between the orienting and the executive network scores were significant; participants with greater orienting effects showed greater alerting effects and smaller congruency effects. Gaining more power when all the sessions were combined, the correlation analyses in error rate5 suggest that the three networks may operate interactively. However, these results should be interpreted with caution due to the small number of participants in the analyses, the large number of relationships examined, and the confinement of the significant relationship to error rate.
Robustness of the network scores
Figure 4A summarizes scores of each attentional network for RT and error rate as a function of session. To examine robustness of the network scores, one sample t-tests were conducted one each score for each session. Despite the practice effects described above for the alerting and the executive networks, the tests on the RT data revealed that all the network scores were significantly different from zero in all 10 sessions, ps < 0.01. These results (see Figure 4A) confirm that RTs from the ANT provide a robust index of each network in RT. For error rate, none of the alerting network scores was significantly different from zero across the sessions. The orienting network score was different from zero only in Session 9 (p < 0.05). The executive network score was significantly different from zero in Sessions 1, 2, 3, 4, 5, and 10 (ps < 0.05).
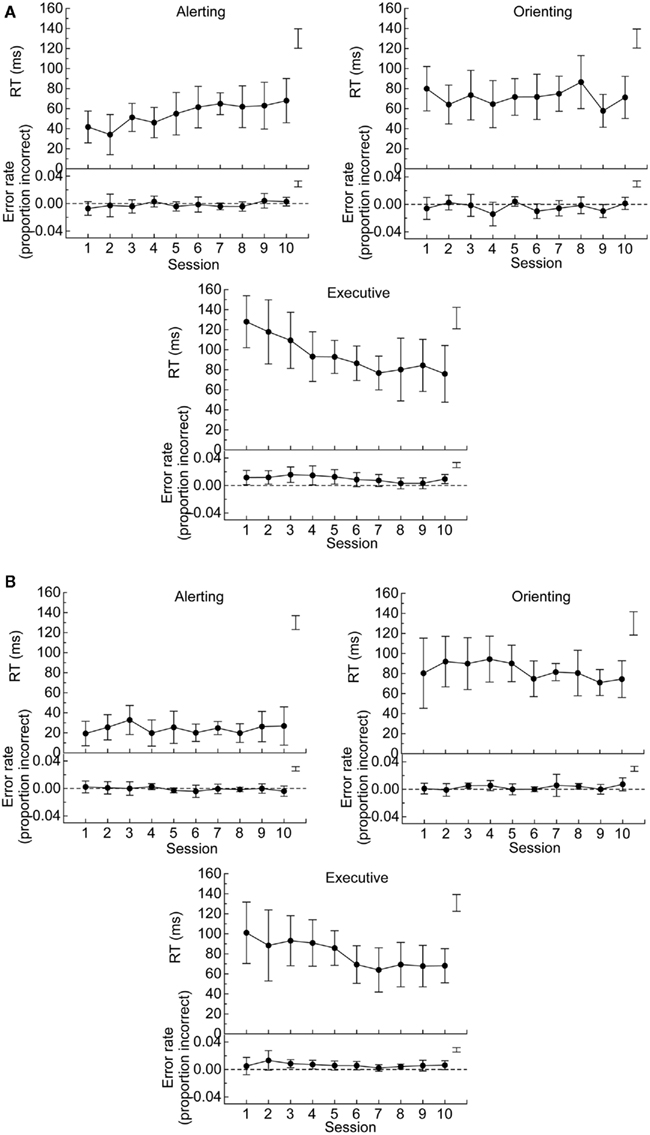
Figure 4. (A) Mean of network scores (i.e., difference scores) in RT (top panels) and error rate (bottom panels) for alerting (no cue – double cue), orienting (center cue – spatial cue), and executive (incongruent – congruent) networks in the ANT, (B) Mean of network scores in RT and error rate for alerting (no tone – tone), orienting (invalid – valid), and executive (incongruent – congruent) networks in the ANT-I. The error bars are 95% confidence intervals, which can be used to compare scores against zero. Free standing error bars at the top right of each figure are LSDs to compare scores across the sessions.
Reliability of the network scores
First, reliability was examined by correlating the first two sessions to allow comparison with the original ANT study’s correlation analysis between Sessions 1 and 2 (Fan et al., 2002). Then, reliability including different numbers of consecutive sessions was examined using a modified split-half correlation. In this permutation method6, trials were randomly split into two halves 10,000 times, a correlation was computed for each split, and reliability was the mean of the 10,000 correlations.
With RT, the correlation between Sessions 1 and 2 was significant for the alerting and the orienting networks (Table 4), and marginally significant for the executive network (p = 0.08, by a non-directional t-test). These results are very similar to Fan et al. (2002) who, reported that the correlations between Sessions 1 and 2 were significant for all three network scores. None of the correlations between Sessions 1 and 2 for error rate were significant in the current study.
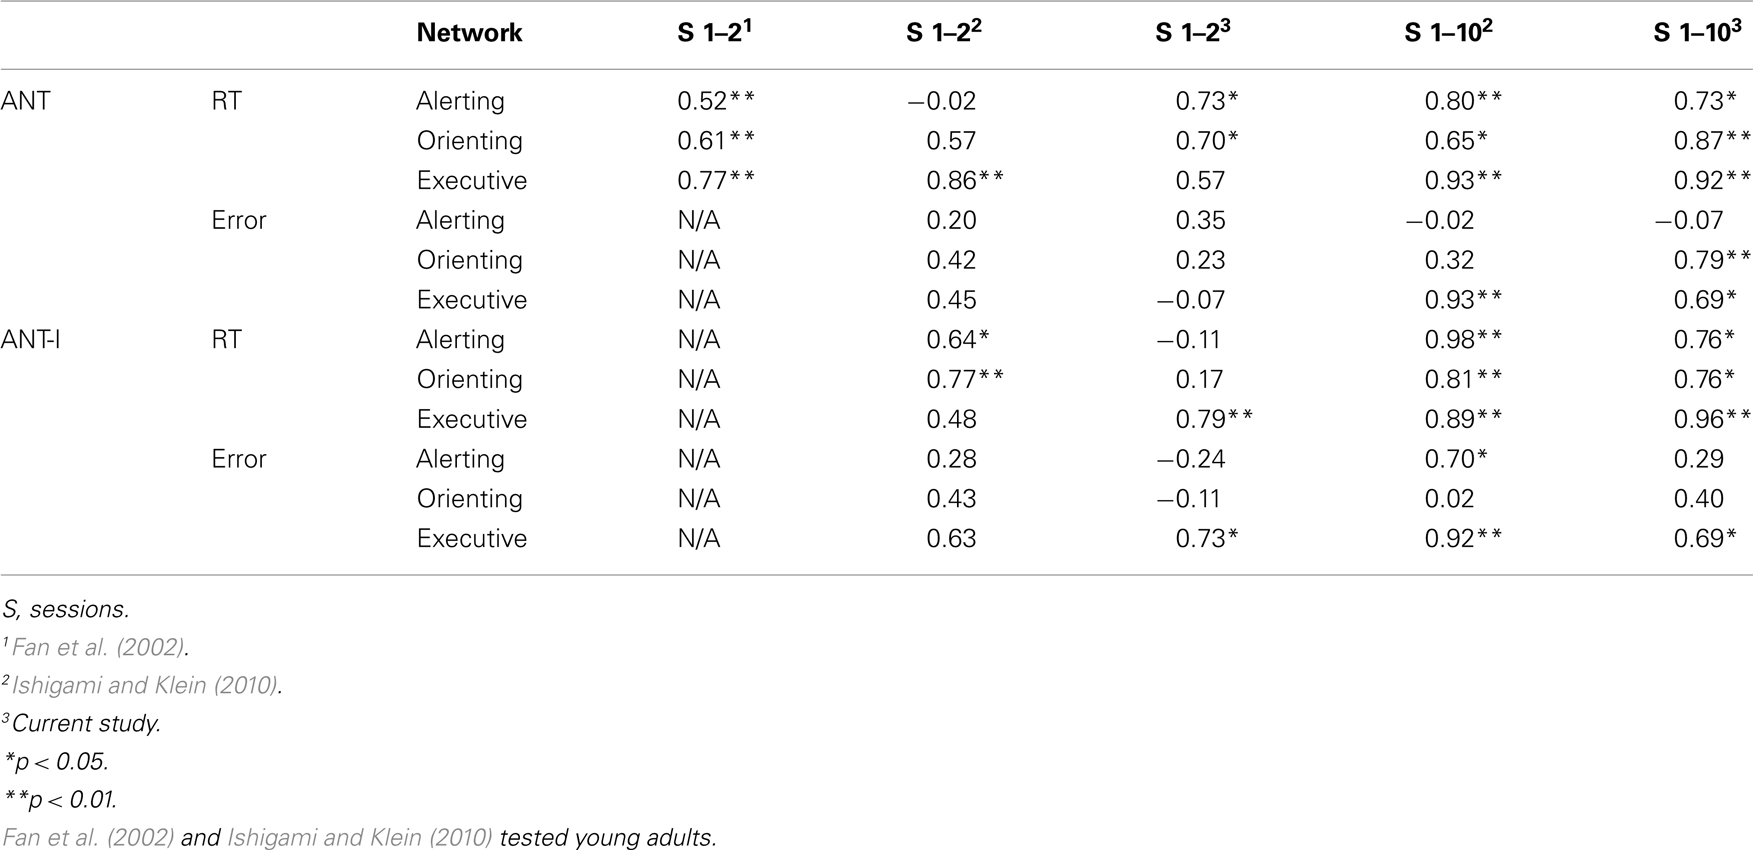
Table 4. Reliability of the three attention networks from a correlation analysis between sessions 1 and 2 (Fan et al., 2002; Ishigami and Klein, 2010, and current study) and from a variation of a split-half correlation analyses including all the sessions (Ishigami and Klein, 2010, and current study).
Results of the modified split-half reliability analyses as a function of number of consecutive sessions included in the analysis can be seen in Figure 5A7. The alerting network was significantly reliable (i.e., correlated) for RT when more than the first six sessions were included, but not for error rate regardless of the number of the sessions included. The orienting network was significantly reliable when more than the first three and four sessions were included for RT and error rate, respectively. The executive network was significantly reliable when more than the first two and six sessions were included for RT and error rate, respectively. It can be seen from Figure 5A that reliability is better in general when more data were included.
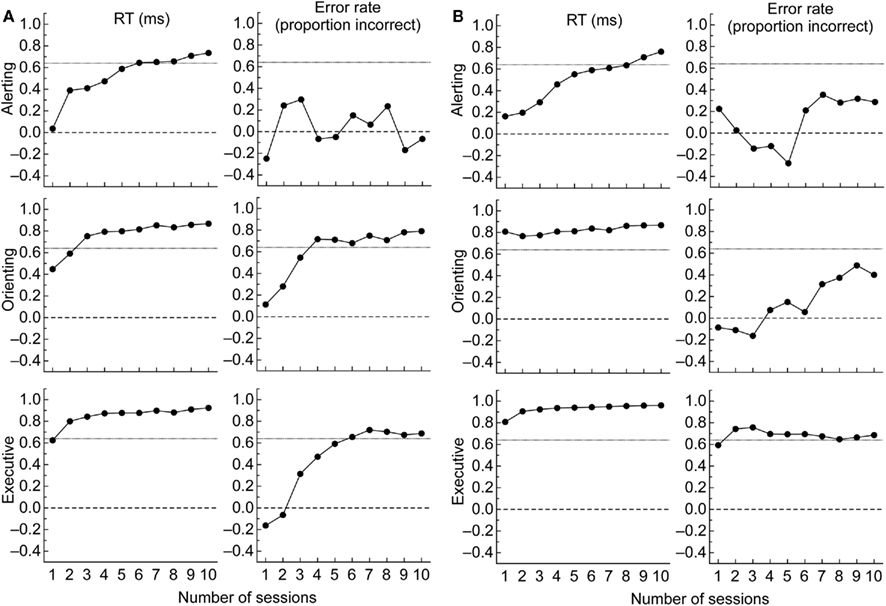
Figure 5. (A) Reliability of each network scores as a function of number of consecutive sessions included in the analysis (always beginning with session 1) in the ANT. (B) Reliability of each network scores as a function of number of consecutive sessions included in the analysis in the ANT-I. Reliability was examined using a modified split-half correlation (permutation approach). With a permutation approach, trials were randomly split into two halves 10,000 times. A correlation was computed for each split, and reliability was the mean of the 10,000 correlations. Correlation is significant at the 0.05 level if r ≥ 0.64 and significant at the 0.01 level if r ≥ 0.77 given N = 10.
ANT–I
For each participant, trials with improper responses (e.g., responses made before the target was presented) or trials with no responses were excluded (1.8%). Then, mean correct RT after eliminating extreme values (less than 200 ms and more than 1700 ms: less than 0.1% of the total analyzable data) and mean error rate were computed and subjected to analyses. Table 5 shows mean correct RT and error rate collapsed across session, and Figures 2B-1,B-2,B-3 show mean correct RT and error rate for auditory signal, cue condition, and target congruency as a function of session for the ANT-I.
Stability and isolability of the network scores
ANOVAs. The mean correct RT and the mean error rate were submitted to ANOVAs with auditory signal (tone and no tone), cue condition (valid, invalid, and no cue), target congruency (congruent and incongruent) as repeated-measures factors and Session (1–10) for the Sessions 1–10 analyses.
Session 1 (Figure 3B-1): For RT, the main effects of auditory signal, F (1, 9) = 12.95, p < 0.01, cue condition, F (2, 18) = 22.10, p < 0.0001, and target congruency, F (1, 9) = 55.65, p < 0.0001, were significant. Here it can be seen that participants were faster to respond in the presence of auditory signals, valid cues, and congruent distractors. Interactions were analyzed excluding data from the no cue trials (cue condition) because the orienting network is measured by subtracting performance in the valid cued condition from that in the invalid cue condition (Callejas et al., 2005). The interaction between auditory signal and cue condition was marginally significant, F (1, 9) = 4.38, p = 0.066, reflecting that the cueing effect was greater in the tone (97 ms) than no tone (64 ms) conditions. No other effects were significant. The pattern of interactions did not replicate what has been reported with young adults by Callejas et al. (2005) and Ishigami and Klein(2009, 2010) both of whom found that the executive score was larger when participants had been alerted (see also Posner, 1994; Fernandez-Duque and Black, 2006) and when the targets were invalidly cued (see also Funes et al., 2007; but see Fernandez-Duque and Black, 2006).
For error rate, the interaction between cue condition and target congruency was marginally significant, F (1, 9) = 3.83, p = 0.082 and the three-way interaction between auditory signal, cue condition, and target congruency was marginally significant, F (1, 9) = 3.70, p = 0.087, reflecting that the congruency effect with the invalid condition was different for the tone and the no tone conditions. No other effects were significant.
Sessions 1–10 (Figure 3B-2): Session (1–10) was included in the analyses as a repeated-measures factor. For RT, the main effect of session was significant, F (9, 81) = 10.43, p < 0.0001, reflecting decreasing RT over time (see Figure 2B). The main effects of auditory signal, F (1, 9) = 47.11, p < 0.0001, cue condition, F (2, 18) = 150.83, p < 0.0001, and target congruency, F (1, 9) = 79.98, p < 0.0001, were significant. Here it can be seen that participants were faster to respond in the presence of auditory signals, valid cues, and congruent distractors. The interaction between cue condition and target congruency was significant, F (1, 9) = 6.75, p < 0.05, reflecting that the congruency effect was greater for the invalid (86 ms) than for the valid (74 ms) conditions. This is different from the results with older adults in Fernandez-Duque and Black (2006) who reported the opposite interaction between the executive network and the orienting network (congruency effects were 125 and 67 ms for the valid and invalid condition, respectively). Note, however, that their peripheral cue was informative (75% valid) while ANT-I’s peripheral cue was uninformative, suggesting another possible difference between endogenous and exogenous orienting (see Klein, 2009). The interaction between auditory signal and cue condition was significant, F (1, 9) = 24.03, p < 0.001, reflecting the greater cueing effect in the tone (91 ms) than the no tone (74 ms) conditions. The interaction between target congruency and session, F (9, 81) = 5.18, p < 0.0001, was significant. Consistent with the ANT, it can be seen from Figure 2B-3 that the practice effect in the executive network was due mainly to an improvement in the incongruent condition. The interaction between auditory signal and target congruency was not significant, F (1, 9) = 0.05. The lack of the interaction between alerting signal and target congruency is inconsistent with the results with older adults in Fernandez-Duque and Black (2006) who reported a presence of such interaction. Note, however, that their alerting signal was visual and the ANT-I’s was auditory. Thus, the difference may not be a direct inconsistency. No other effects were significant. The practice effects for the executive network were examined by running a separate ANOVA. The mean executive network scores in RT were submitted to an ANOVA with session as a repeated-measures factor to examine quantitative patterns of performance across the sessions. The main effect of session was significant, F (9, 81) = 5.01, p < 0.0001; the executive effects decreased as the sessions progressed.
For error rate, the main effect of session was significant, F (9, 81) = 2.12, p = 0.037. The main effect of target congruency, F (1, 9) = 12.56, p < 0.01, was significant. Here it can be seen that participants were more accurate in the presence of congruent distractors. The three-way interaction between cue condition, target congruency, and session was significant, F (9, 81) = 2.06, p < 0.05, reflecting that the congruency effect with the invalid condition was different for different sessions. The four-way interaction between session, auditory signal, cue condition, and target congruency was marginally significant, F (9, 81) = 1.80, p = 0.081. No other interactions were significant.
Correlational analysis8. Sessions 1: There were no significant correlations in the network scores in RT and error rate (Table 3).
Sessions 1–10: There were no significant correlations in the RT and error network scores (Table 3).
Robustness of the network scores
Figure 4B summarizes scores of each attentional network for RT and error rate as a function of session. Despite the practice effects described above for the executive network, one sample t-tests on the RT data revealed that all the network scores were significantly different from zero across all 10 sessions, ps < 0.05. For error rate, none of the alerting effects were significantly different from zero across the 10 sessions. The orienting and executive effects were significantly different from zero only in Sessions 3 and 8, and Sessions 3, 4, and 8 (ps < 0.05), respectively.
Reliability of the network scores
The correlation between Sessions 1 and 2 was significant only for the executive network with RT and error rate (Table 4). The correlation was not significant for the alerting and the orienting networks.
Results of the modified split-half reliability analyses as a function of number of consecutive sessions included in the analysis can be seen in Figure 5B9. For the alerting network in RT, the reliabilities seem to increase with increasing number of sessions. However, reliabilities were significant only when more than nine sessions were included. For error rate, regardless of the number of sessions included the alertness reliability did not achieve significance. For the orienting network in RT, reliabilities were stable from the first session and were significant regardless of the number of sessions included. For error rate, the reliabilities seem to increase with increasing numbers of sessions, but regardless of the number of sessions included, they were not significant. For the executive network in RT, reliabilities were stable from the first session and were significant regardless of the number of sessions included. For error rate, reliabilities were significant so long as more than two sessions were included.
Comparing the Network Scores Generated by the Two Tests
In this section we will compare the magnitudes of the network scores measured by the two tests and we will explore the correlation between corresponding scores (Table 6). At the start, we should remind the reader that alerting and orienting are measured somewhat differently (see Introduction) by the ANT and the ANT-I, while the two tests assess executive control in the same manner. For RT, the alerting network scores generated by the ANT and ANT-I were significantly different when all trials were included with the ANT-I, but not different when only the no cue trials (cue condition) were included with the ANT-I. The correlation between these scores, while moderate (r = 0.38), was not significant. The difference between the orienting network scores measured with the two tests was not significant. The correlation between these scores was not significant and very close to zero. The executive network scores from the two tests were significantly different with the ANT generating larger scores than the ANT-I. The correlation between these scores (r = 0.96) was significant. For error rate, the alerting, orienting, and executive network scores measured with the two tests were not significantly different. The correlations between the two tests were not significant for the alerting and the orienting network scores while the correlation was significant for the executive network scores.
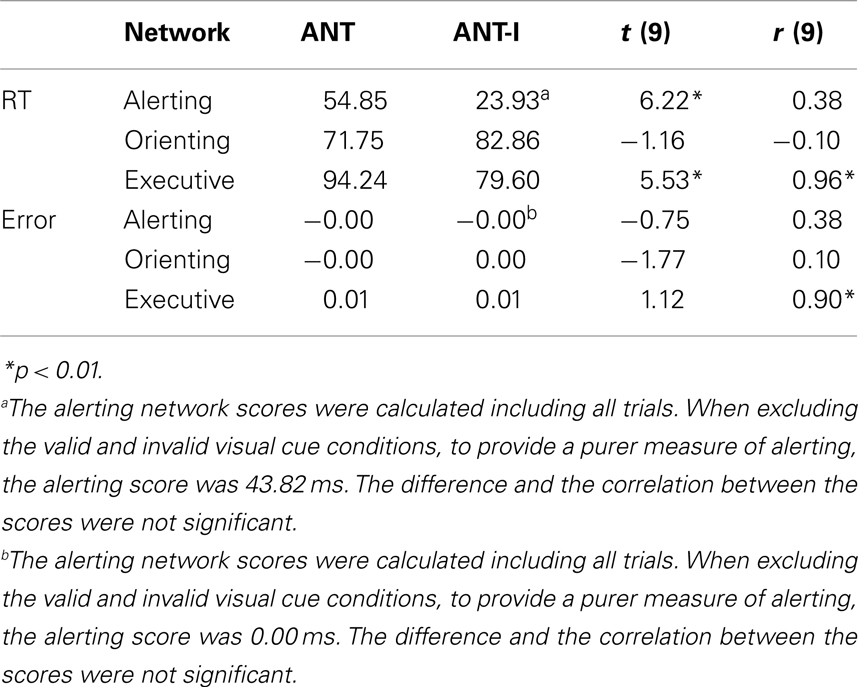
Table 6. Network scores generated by the ANT and the ANT-I, their difference, and the correlation between the scores from the two different versions of the ANT.
Discussion
The present experiment was conducted to examine, in older adults, the stability, isolability, robustness, and reliability of the measures of attention network (alerting, orienting, and executive) derived from two versions of the ANT over repeated testing and difference between the two versions of the ANTs.
Psychometric Properties of the ANTs with the Older Adults
We observed practice effects for the executive network scores with both the ANT and the ANT-I and practice effects for the alertness scores in the ANT (Figures 4A,B). Despite these practice effects, both the ANT and the ANT-I produced a robust index of each attention network even after the 10 sessions of each test. Consistent with literature, there was some lack of independence among the networks in both tests. Overall, the reliability of the network scores was found to be slightly greater with the ANT-I than the ANT.
The practice effects for the executive network in RT in the ANT and ANT-I are clearly apparent. A close examination of Figures 2A-2,B-3 shows that the decreases in the executive scores across the sessions are due mainly to a greater decrease in RT in the incongruent condition than in the congruent condition. Thus, as the participants practice the task (across sessions) they learn how to ignore the irrelevant flanking arrows (see also Ishigami and Klein, 2010).
Practice effects for alerting were also observed in the ANT; the alertness network score increased as the sessions progressed. The alerting network in the ANT is defined by the double cue and no cue conditions. A close examination of Figure 2A-1 shows that the decrease in RT for the double cue condition is steeper than for the no cue condition. The participants seemed to learn to pay attention to the cues and thus to respond more quickly in the presence of the warning signals.
Our data largely replicate previous studies of the attention networks (Fan et al., 2002; Callejas et al., 2005; Jennings et al., 2007; Ishigami and Klein, 2009, 2010) in showing that the three attention networks do not operate independently in all situations. Consistently, the cueing effect was greater in the presence of auditory warning signals. The congruency effects were smaller in the presence of valid cues. The reliability of the network scores is generally greater with the ANT-I than with the ANT when only one session is included. However, this difference in the reliability attenuates as more sessions are included in the analyses.
The network scores generated by the two tests were found to be significantly related to each other only in the executive network. This significant relation was expected because the executive effects are measured by the two tests using essentially the same conflicting and congruent arrows. Although the network scores for the alerting network were not significantly correlated, the correlation was moderate (r = 0.38). Correlations between effects are limited by their reliabilities, and the reliabilities of the alertness scores for the older adults were considerably lower than those of the younger adults (Ishigami and Klein, 2010, Table 4). While the actual correlation (r = 0.38) is moderate and not significant, when corrected for attenuation (Spearman, 1904) the correlation is substantially larger (0.51). The network scores for orienting were not significantly related and the relationship was insubstantial. The orienting component of attention is measured quite differently in the two tests; whereas the 100% valid peripheral cue used in the ANT allows both endogenous and exogenous control to be operating, with the uninformative peripheral cues of the ANT-I orienting depends on the degree to which the cue captures attention exogenously. Not surprisingly, there appears to be no relation, whatsoever, between the orienting scores from the two tests.
Effects of Aging on the Components of Attention: Older Adults vs. Young Adults
Examining effects of aging was not our objective in the current study. Nevertheless, such a comparison between older and young adults is made possible because we tested young adults in a previous study (Ishigami and Klein, 2010) under essentially identical conditions. Although we plan to present comparisons across the lifespan in some detail in an entirely different manuscript (Ishigami and Klein, in preparation), here we will simply summarize what we found when we subjected these data to statistical analyses. The most consistent difference, regardless of the version of the ANT, is that the older adults were slower to respond but responded more accurately than the young adult. The older participants also showed greater improvements in RT and error rate with practice. Perhaps relatedly, the older adults had greater cueing effects in RT than the young adults, but the young adults had greater cueing effects in error rate than the older adults. The same pattern was found with the congruency effects. These patterns could be interpreted as follows; age has no effect on the orienting and the executive networks, per se, but the older adults focused on accuracy while the young adults focused on speed. It is difficult to determine whether aging has some effects on phasic alertness because the patterns were different between the two tests. The older adults may be differently motivated for the ANT and the ANT-I because of the different meanings attached to the cues in the two tests (see Ishigami and Klein, in preparation) for more discussion and detailed comparison between the older and the young adults.)
Limitations of the Present Study
As noted in the results, the sample size in the current study is relatively small and makes it necessary to be cautious in interpreting the correlational analyses. However, it should be also noted that results from only Session 1 (i.e., less power) were similar to those when all 10 sessions were included (i.e., more power).
Health status was based on self-report rather than on objective measures. While the latter might be more reliable, self-report is quite typical in studies like this. Moreover, the older adults in the current study appeared to be mentally and physically healthy to the experimenter (Ishigami): being able to come to the lab by themselves and sit in front of the computer for an hour, not needing to rest excessively during the experiments, having no problems in hearing and understanding the experimenter, and remembering to come to the lab on scheduled days without being reminded in advance.
Conclusion
With older adults, both ANTs are useful tools to measure attention components, namely alerting, orienting, and executive functions, within one session, which takes less than 30 min. The current study shows that scores of these attention components remain robust even after 10 sessions. This enables either ANT to be used in applications that require repeated testing. It is important to note, however, that executive control scores with both ANTs decrease, and alerting with the ANT increases with practice. Therefore, an untreated control group would be warranted in some designs. While the network scores are robust against practice, their reliability is generally lower than is ideal for many purposes.
Conflict of Interest Statement
The authors declare that the research was conducted in the absence of any commercial or financial relationships that could be construed as a potential conflict of interest.
Acknowledgments
This research was made possible by a Natural Sciences and Engineering Research Council Discovery grant to Raymond M. Klein and scholarship support to Yoko Ishigami from the Killam Trust and Multiple Sclerosis Society of Canada. The research reported here is drawn from a thesis by Yoko Ishigami in partial fulfillment of requirements for a PhD degree at the Dalhousie University.
Footnotes
- ^“Robust” means that network scores remain significantly different from zero with repeated testing.
- ^Although these studies report statistical non-significance between the young and the older adults, the older adults in these studies (except Tales et al., 2002 when the task was identification) show numerically greater orienting effects.
- ^A comprehensive picture of the patterns of endogenous orienting is difficult to draw; task (identification and detection), type of endogenous cue (central arrow and informative peripheral stimulus), and SOA (50–3000 ms) vary across the studies. It appears, however, that studies showing age differences in orienting effects typically use longer SOAs.
- ^When these data were analyzed using a Z-score transformation only the interaction between age and alerting remained significant. It is debatable, however, whether RTs should be transformed when assessing additivity and interactions.
- ^Even though errors are not normally distributed, we report the results with untransformed data because the literature on inter-network correlations has more often than not analyzed them untransformed. However, we did transform the errors (arcsine-transformation) and repeat the correlational analyses with the ANT and the ANT-I. Patterns are similar except for two correlations; correlation between the alerting and the orienting networks, r (8) = 0.41, and correlation between the orienting and the executive networks, r (8) = −0.01, when all sessions were included, were not significant with the transformed data with the ANT.
- ^We thank Michael A. Lawrence for proving us with R scripts for the modified split-half correlational analysis.
- ^The same analysis was conducted for each network for each session in a separate analysis. Reliability fluctuated across session. The alerting and the orienting network scores were not reliable for any of the sessions both in RT and error rate. The executive network scores were reliable only for Sessions 2, 3, 8, 9, and 10 in RT.
- ^The alerting network scores in the correlational analyses were calculated including all trials. As with the ANOVA analyses above, to provide a purer measure of alerting, analyses were also carried out excluding the valid and invalid cue conditions. Significance of the correlations involving the networks was the same as those including all trials.
- ^The same analysis was conducted for each network for each session in a separate analysis. Reliability fluctuated across the sessions. The alerting network scores were reliable only for Session 10 in RT. The orienting network scores were reliable for Sessions 1, 2, 3, 4, and 8 with RT and for Session 7 in error rate. In RT, the executive network scores were reliable for all the sessions except Sessions 5 and 10.
References
Bherer, L., Kramer, A. F., and Peterson, M. S. (2008). Transfer effects in task-set cost and dual-task cost after dual-task training in older and younger adults: further evidence for cognitive plasticity in attentional control in late adulthood. Exp. Aging Res. 34, 188–219.
Brodeur, D. A., and Enns, J. T. (1997). Covert visual orienting across the lifespan. Can. J. Exp. Psychol. 51, 20–35.
Bush, G., Luu, P., and Posner, M. (2000). Cognitive and emotional influences in anterior cingulate cortex. Trends Cogn. Sci. (Regul. Ed.) 4, 215–222.
Callejas, A., Lupianez, J., Funes, M. J., and Tudela, P. (2005). Modulations among the alerting, orienting and executive control networks. Exp. Brain Res. 167, 27–37.
Casey, B. J., Thomas, K. M., Welsh, T. F., Badgaiyan, R. D., Eccard, C. H., Jennings, J. R., and Crone, E. A. (2000). Dissociation of response conflict, attentional selection, and expectancy with functional magnetic resonance imaging. Proc. Natl. Acad. Sci. U.S.A. 97, 8728–8733.
Corbetta, M., and Shulman, G. L. (2002). Control of goal-directed and stimulus-driven attention in the brain. Nat. Rev. Neurosci. 3, 201–215.
Coull, J. T., Frith, C. D., Frackowiak, R. S. J., and Grasby, P. M. (1996). A fronto-parietal network for rapid visual information processing: a PET study of sustained attention and working memory. Neuropsychologia 34, 1085–1095.
D’Aloisio, A., and Klein, M. R. (1990). “Aging and the deployment of visual attention,” in The Development of Attention: Research and Theory, ed. J. T. Enns (New York: North-Holland), 447–466.
Eriksen, B. A., and Eriksen, C. W. (1974). Effects of noise letters upon the identification of a target letter in a nonsearch task. Percept. Psychophys. 16, 143–149.
Fan, J., McCandliss, B. D., Sommer, T., Raz, A., and Posner, M. I. (2002). Testing the efficiency and independence of attentional networks. J. Cogn. Neurosci. 14, 340–347.
Fernandez-Duque, D., and Black, S. E. (2006). Attentional networks in normal aging and Alzheimer’s disease. Neuropsychology 20, 133–143.
Festa-Martino, E., Ott, B. R., and Heindel, W. C. (2004). Interactions between phasic alerting and spatial orienting: effects of normal aging and Alzheimer’s disease. Neuropsychology 18, 258–268.
Folk, C. L., and Hoyer, W. J. (1992). Aging and shifts of visual spatial attention. Psychol. Aging 7, 453–465.
Funes, M. J., Lupianez, J., and Milliken, B. (2007). Separate mechanisms recruited by exogenous and endogenous spatial cues: evidence from a spatial Stroop paradigm. J. Exp. Psychol. Hum. Percept. Perform. 33, 348–362.
Greenwood, P. M., Parasuraman, R., and Haxby, J. V. (1993). Changes in visuospatial attention over the adult life-span. Neuropsychologia 31, 471–485.
Hartley, A. A., Kieley, J. M., and Slabach, E. H. (1990). Age-differences and similarities in the effects of cues and prompts. J. Exp. Psychol. Hum. Percept. Perform. 16, 523–537.
Ishigami, Y., and Klein, R. M. (2009). Are individual differences in absentmindedness correlated with individual differences in attention? J. Individ. Differ. 30, 220–237.
Ishigami, Y., and Klein, R. M. (2010). Repeated measurement of the components of attention using two versions of the attention network test (ANT): stability, insolubility, robustness, and reliability. J. Neurosci. Methods 190, 117–128.
Jennings, J. M., Dagenbach, D., Engle, C. M., and Funke, L. J. (2007). Age-related changes and the attention network task: an examination of alerting, orienting, and executive function. Neuropsychol. Dev. Cogn. B Aging Neuropsychol. Cogn. 14, 353–369.
Jha, A. P., Krompinger, J., and Baime, M. J. (2007). Mindfulness training modifies subsystems of attention. Cogn. Affect. Behav. Neurosci. 7, 109–119.
Kok, A. (1999). Varieties of inhibition: manifestations in cognition, event-related potentials and aging. Acta Psychol. (Amst.) 101, 129–158.
Kok, A. (2000). Age-related changes in involuntary and voluntary attention as reflected in components of the event-related potential (ERP). Biol. Psychol. 54, 107–143.
Kramer, A. F., Humphrey, D. G., Larish, J. F., Logan, G. D., and Strayer, D. L. (1994). Aging and inhibition – beyond a unitary view of inhibitory processing in attention. Psychol. Aging 9, 491–512.
Lincourt, A. E., Folk, C. L., and Hoyer, W. J. (1997). Effects of aging on voluntary and involuntary shifts of attention. Aging Neuropsychol. Cogn. 4, 290–303.
MacDonald, A. W., Cohen, J. D., Stenger, V. A., and Carter, C. S. (2000). Dissociating the role of the dorsolateral prefrontal and anterior cingulate cortex in cognitive control. Science 288, 1835–1838.
Madden, D. J., and Gottlob, L. R. (1997). Adult age differences in strategic and dynamic components of focusing visual attention. Aging Neuropsychol. Cogn. 4, 185–210.
Marrocco, R. T., and Davidson, M.C. (1998). “Neurochemistry of attention,” in The Attentive Brain, ed. R. Parasuraman (Cambridge, MA: MIT), 35–50.
Nebes, R. D., and Brady, C. B. (1993). Phasic and tonic alertness in Alzheimers-disease. Cortex 29, 77–90.
Nissen, M. J., and Corkin, S. (1985). Effectiveness of attentional cueing in older and younger adults. J. Gerontol. 40, 185–191.
Norman, D. A., and Shallice, T. (1986). “Attention to action: willed and automatic control of behavior,” in Consciousness and Self-Pregulation, eds R. J. Davidson, G. E. Schwartz, and D. Shapiro (New York, NY: Plenum Press), 1–18.
Pero, S., Incoccia, C., Caracciolo, B., Zoccolotti, P., and Formisano, R. (2006). Rehabilitation of attention in two patients with traumatic brain injury by means of “attention process training.” Brain Inj. 20, 1207–1219.
Posner, M. I. (1994). Attention: the mechanisms of consciousness. Proc. Natl. Acad. Sci. U.S.A. 91, 7398–7403.
Posner, M. I., and Petersen, S. E. (1990). The attention system of the human brain. Annu. Rev. Neurosci. 13, 25–42.
Rabbitt, P. (1984). “How old-people prepare themselves for events which they expect,” in Attention and Performance X, eds H. Bouma and D. G. Bouwhuis (Hillsdale, NJ: Lawrence Erlbaum Associates), 515–527.
Robertson, I. H., Tegner, R., Tham, K., Lo, A., and Nimmosmith, I. (1995). Sustained attention training for unilateral neglect – theoretical and rehabilitation implications. J. Clin. Exp. Neuropsychol. 17, 416–430.
Rogers, W. A. (2000). “Attention and aging,” in Cognitive Aging, eds D. C. Park and N. Schwarz (Philadelphia, PA: Psychology Press), 57–73.
Serino, A., Ciaramelli, E., Di Santantonio, A., Malagu, S., Servadei, F., and Ladavas, E. (2007). A pilot study for rehabilitation of central executive deficits after traumatic brain injury. Brain Inj. 21, 11–19.
Sohlberg, M. M., McLaughlin, K. A., Pavese, A., Heidrich, A., and Posner, M. I. (2000). Evaluation of attention process training and brain injury education in persons with acquired brain injury. J. Clin. Exp. Neuropsychol. 22, 656–676.
Spearman, C. (1904). The proof and measurement of association between two things. Am. J. Psychol. 15, 72–101.
Sturm, W., Thimm, A., Kuest, J., Karbe, H., and Fink, G. R. (2006). Alertness-training in neglect: behavioral and imaging results. Restor. Neurol. Neurosci. 24, 371–384.
Sturm, W., Willmes, K., Orgass, B., and Hartje, W. (1997). Do specific attention deficits need specific training? Neuropsychol. Rehabil. 7, 81–103.
Tales, A., Muir, J. L., Bayer, A., Jones, R., and Snowden, R. J. (2002a). Phasic visual alertness in Alzheimer’s disease and ageing. Neuroreport 13, 2557–2560.
Tales, A., Muir, J. L., Bayer, A., and Snowden, R. J. (2002b). Spatial shifts in visual attention in normal ageing and dementia of the Alzheimer type. Neuropsychologia 40, 2000–2012.
Tang, Y. Y., Ma, Y. H., Wang, J., Fan, Y. X., Feng, S. G., Lu, Q. L., Yu, Q. B., Sui, D., Rothbart, M. K., Fan, M., and Posner, M. I. (2007). Short-term meditation training improves attention and self-regulation. Proc. Natl. Acad. Sci. U.S.A. 104, 17152–17156.
Thimm, M., Fink, G. R., Kust, J., Karbe, H., and Sturm, W. (2006). Impact of alertness training on spatial neglect: a behavioural and fMRI study. Neuropsychologia 44, 1230–1246.
Waszak, F., Li, S. C., and Hommel, B. (2010). The development of attentional networks: cross-sectional findings from a life span sample. Dev. Psychol. 46, 337–349.
Wright, L. L., and Elias, J. W. (1979). Age-differences in the effects of perceptual noise. J. Gerontol. 34, 704–708.
Keywords: attention, alerting, orienting, executive control, older adults, attention network test, aging
Citation: Ishigami Y and Klein RM (2011) Repeated measurement of the components of attention of older adults using the two versions of the Attention Network Test: stability, isolability, robustness, and reliability. Front. Ag. Neurosci. 3:17. doi: 10.3389/fnagi.2011.00017
Received: 03 November 2010;
Accepted: 03 October 2011;
Published online: 15 November 2011.
Edited by:
Gemma Casadesus, Case Western Reserve University, USAReviewed by:
Marcia Chaves, Federal University of Rio Grande do Sul, BrazilAna M. Coto-Montes, University of Oviedo, Spain
Ekrem Dere, University Pierre and Marie Curie Paris 6, France
Copyright: © 2011 Ishigami and Klein. This is an open-access article subject to a non-exclusive license between the authors and Frontiers Media SA, which permits use, distribution and reproduction in other forums, provided the original authors and source are credited and other Frontiers conditions are complied with.
*Correspondence: Yoko Ishigami, Department of Psychology, Life Science Centre, Dalhousie University, 1355 Oxford Street, Halifax, NS, Canada B3H 4R2. e-mail:aXNoaWdhbWlAZGFsLmNh


