 Aditi Sengupta
 Abhijeet Guha
- Department of Mechanical Engineering, Indian Institute of Technology Dhanbad, Dhanbad, Jharkhand, India
Natural laminar flow airfoils are essential technologies designed to reduce drag and significantly enhance aerodynamic performance. A notable example is the SHM1 airfoil, created to meet the requirements of the small-business jet by Honda R&D. This airfoil has undergone extensive testing across various operational conditions, including low-speed wind tunnel tests and flight tests across a range of Reynolds numbers and free-stream Mach numbers. Additionally, investigations into drag-divergence behavior have been conducted using a transonic wind tunnel, with subsequent studies focusing on transonic shock boundary layer interactions through both experimental and numerical approaches. This study employs a series of numerical simulations to analyze the flow physics and aerodynamic performance across different free-stream Mach numbers in the subsonic and transonic regimes. The analysis offers a comprehensive overview of the aerodynamic performance by making use of instantaneous and time-averaged load and pressure distributions, highlighting the different flow structures (trailing edge vortices, Kutta waves, shock waves - both normal and oblique) and associated time scales in the unsteady flow field and how these impact the performance and extent of separated flow on the SHM1 airfoil. This is achieved by examining computed instantaneous numerical Schlieren for various design conditions (such as low speed, climb, and cruise) and off-design scenarios (including transonic shock emergence, drag-divergence, and shock-induced separation). The dominant time scales, the time-averaged load distributions and boundary layer parameters are compared to provide a comprehensive overview of the SHM1’s aerodynamics, establishing benchmark results for optimization of various flow separation and shock control techniques.
1 Introduction
With the growing demand for innovative aircraft and aerial designs to combat climate change, there is an increasing focus on environmentally responsible commercial aviation, as reported by Coder and Maughmer (2014). The primary objectives are to enhance fuel efficiency and reduce aerodynamic drag, which can be achieved by maintaining laminar boundary layer flow. This approach offers a potential tenfold reduction in friction drag compared to turbulent boundary layers (Krishnan et al., 2017). Since friction drag can account for nearly 50% of the total drag experienced by aircraft during cruise, delaying the transition to turbulence in the boundary layer is crucial for developing fuel-efficient designs (Karpuk and Mosca, 2024). Natural laminar flow airfoils present a viable strategy for achieving higher fuel efficiency. Recent studies by Halila et al. (2020) have demonstrated that integrating natural laminar flow technology with flow separation control or control of shock waves in the transonic regime (Chakraborty et al., 2022) can reduce total drag by 15% or more for typical jetliners at cruise conditions. As a result, natural laminar flow designs, once conceived as strictly experimental and/or conceptual, have gained relevance in modern commercial aircraft, business jets (Fujino et al., 2003), and unmanned aerial vehicles. This resurgence of interest in natural laminar flow technology can be attributed to recent advancements in high-fidelity simulations that accurately predict laminar-turbulent transitions (Halila et al., 2019) and effectively capture unsteady shock structures (Sengupta et al., 2021) in transonic aerodynamics. Accurate forecasting of transition onset and shock locations significantly influences boundary layer development, flow separation, friction drag, and maximum lift coefficients (Campbell and Lynde, 2017), all of which are critical to the design and performance of aerodynamic bodies.
Shock boundary layer interactions take place when shock waves interact unfavorably with the boundary layer producing large undesirable local fluctuations in properties such as pressure, shear stress and the rate of heat transfer. This is particularly significant in the transonic flow regime, as these off-design events can substantially affect both aerodynamic and thermodynamic properties, altering the flow field in notable ways. Such modifications lead to changes in parameters like pressure distribution and boundary layer characteristics, resulting in increased unsteadiness and higher drag (Cole and Cook, 2012). A thorough investigation of this dynamic phenomenon requires solving the compressible Navier-Stokes equations to accurately capture critical parameters such as shock location and strength, unsteady aerodynamic forces, and potential strategies for reducing the effect of shock waves. While some canonical numerical (Larsson et al., 2013) and experimental (Barre et al., 1996) studies have explored the interaction between shock waves and turbulence, the flow over an airfoil at varying angles of attack presents a more complex scenario due to the presence of variable streamwise pressure gradients, even in laminar flows. Transonic flows are characterized by unsteady shock wave systems. To better understand this intricately time-dependent behavior, researchers have analyzed the effects of downstream periodic pressure perturbations on shock waves (Bruce and Babinsky, 2010), shedding light on the complex nature of shock-boundary layer interactions.
Previous studies by Touré and Schuelein (2018), Gross and Lee (2018), Quadros and Bernardini (2018) on transonic shock boundary layer interactions did not address efforts to modify or control the interactions between shock waves and the underlying boundary layer. Typically, these transient behaviors exhibit large-amplitude normal or near-normal shocks accompanied by low-frequency motion, as seen by (Dussauge and Piponniau, 2008). Such behavior is problematic due to the resulting unsteady pressure fluctuations on the airfoil, which can lead to increased aerodynamic loads (Giannelis et al., 2017). Another notable aspect of transonic shock boundary layer interactions is the presence of upstream-propagating Kutta waves interacting with the shock system, which includes both oblique and normal shocks (Lee, 2001). The low-frequency motion of these shock waves induces similar low-frequency pressure fluctuations on the airfoil surface, a phenomenon referred to as “transonic buffeting”. This buffeting can intensify airfoil vibrations and ultimately pose risks of structural failure (Giannelis et al., 2017).
The preceding discussion underscores the necessity for a comprehensive assessment of the aerodynamic performance of a natural laminar flow airfoil under both design and off-design conditions. This assessment will serve as a benchmark for future validation efforts and establish a foundation for strategies aimed at controlling flow separation and shocks to minimize friction drag. Additionally, a thorough investigation into boundary layer characteristics and unsteady separation will contribute to the design of optimized natural laminar flow airfoils. In this study, we will simulate a range of free-stream Mach numbers, Reynolds numbers, and operational conditions for the SHM1 airfoil, which is integral to the design of the Honda business jet (Fujino et al., 2003). To accurately capture pressure waves, shock structures, and boundary layer interactions, we will employ dispersion relation-preserving compact schemes (Sagaut et al., 2023), which are effective in resolving both temporal and spatial scales within the flow. We ensure the integrity of our numerical approach by implementing an error-free non-overlapping parallelization strategy, which maintains the same level of accuracy as sequential computing (Sundaram et al., 2023) through global spectral analysis. This strategy has previously demonstrated its capability in effectively capturing shock boundary layer interactions in compressible transonic flow, as in Chakraborty et al. (2022), Sengupta et al. (2022), with results validated against flight test data from Fujino et al. (2003) as well as benchmark wind tunnel results of Harris (1981).
The structure of the paper is as follows: The next section outlines the problem formulation for simulating flow around the SHM1 airfoil, detailing the governing equations and test cases. Section 3 describes the numerical methods employed and the validation efforts with experimental data. In Section 4, we present the results and discussions, including instantaneous Schlieren visualizations under various design and off-design conditions, vorticity spectra, and coefficients of pressure and skin friction. Finally, we evaluate the aerodynamic performance by comparing lift and drag coefficients across the different operating conditions. The paper concludes with a summary and final remarks in Section 5.
2 Problem formulation of the SHM1 airfoil
Figure 1 depicts the schematic of the computational domain, which employs an O-grid topology. This grid was generated using a hyperbolic technique in Pointwise, featuring 1,251 points in the azimuthal
where the conservative variables are given as,
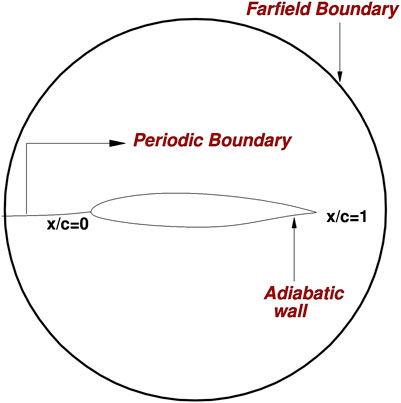
Figure 1. Schematic of computational domain and boundary conditions for the natural laminar flow airfoil, the SHM1.
and the viscous flux vectors are given as,
In the given expressions,
where
The components of the symmetric Newtonian viscous stress tensors,
The equations from the Cartesian space (
with the state variables and flux vectors, given as
Here
The grid metrics,
The viscous stress components in the transformed plane are given by
On the airfoil surface, a no-slip wall boundary condition is applied to the velocity components, specified as
3 Numerical methodology and validation
The current simulations utilize highly accurate dispersion relation preserving compact schemes for the spatial discretization and time integration of the governing equations (Sagaut et al., 2023). Convective flux derivatives in Equations 1, 2 are computed using an optimized upwind compact scheme,
The study includes six test cases, detailed in Table 1, each initiated with free-stream conditions relevant to various design (Cases 1–3) and off-design (Cases 4–6) scenarios for the SHM1 airfoil (Fujino et al., 2003). The simulated free-stream Mach numbers, Reynolds numbers and angles of attack have been chosen carefully to replicate the flow conditions from Fujino et al. (2003). The free-stream temperature and density are set as:
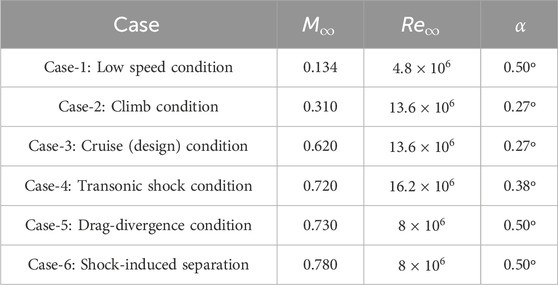
Table 1. Numerical parameters used and description of the test cases reported.
Figure 2 compares the numerically computed time-averaged coefficient of pressure,
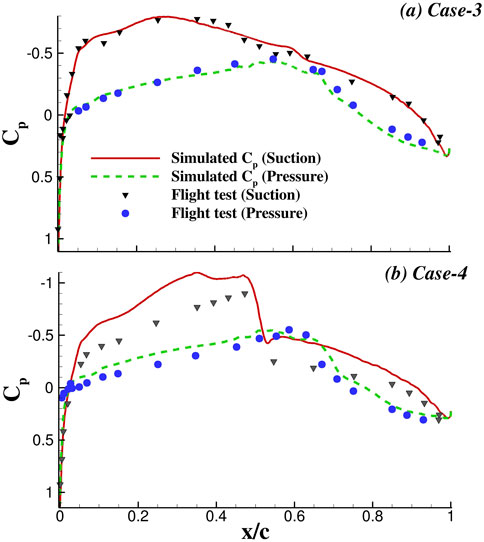
Figure 2. Comparison of simulated time-averaged
4 Results and discussion
In this section, we compare the numerical Schlieren for the different operating conditions outlined in Table 1, emphasizing the varying flow physics and associated features. We also discuss the dominant time scales for these various design and off-design conditions, along with the aerodynamic performance of the SHM1 airfoil. These insights serve as supplementary benchmark datasets to the experimental data provided by Fujino et al. (2003).
4.1 Comparing low speed, climb and cruise (design) conditions with transonic shock boundary layer interactions (off-design)
Following the design requirements of the Honda jet, the SHM1 airfoil has been optimized to operate for the design conditions of Cases 1–3 of Table 1. Transonic operation and the ensuing shock boundary layer interactions are investigated using Cases 4–6 of Table 1. The flow features for these various operating conditions are explored via the instantaneous numerical Schlieren contours in Figures 3–5.
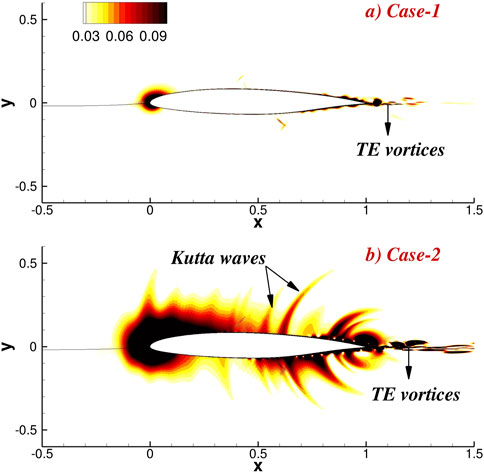
Figure 3. Comparison of numerical Schlieren contours for low speed operation in (A) Case-1 and for climb condition in (B) Case-2 of Table 1.
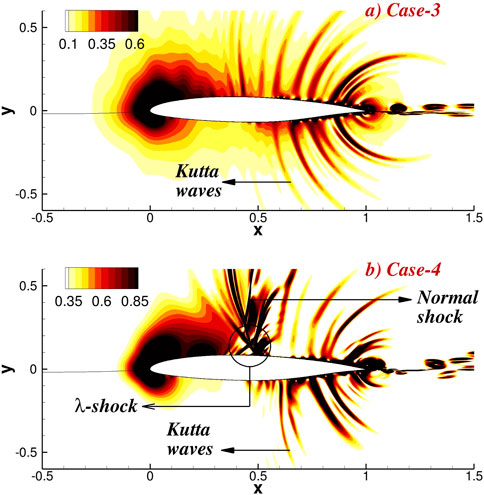
Figure 4. Comparison of numerical Schlieren contours for design condition in (A) Case-3 and for transonic shock appearance depicted in (B) Case-4 of Table 1, respectively.
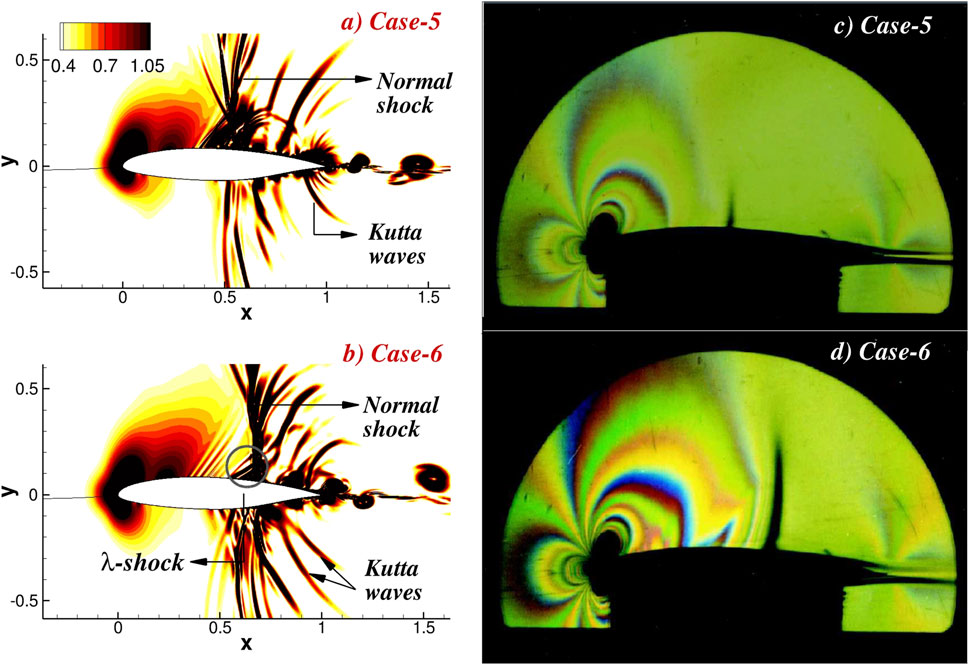
Figure 5. Comparison of numerical Schlieren contours for drag divergence condition in (A) Case-5 with shock-induced separation in (B) Case-6 of Table 1. Fujino et al. (2003)’s Schlieren visualizations are also shown for (C) Case-5 and (D) Case-6.
Visualization of flow features in experiments with the Schlieren technique depict optical effects using density gradients. This has been extended in creating numerical Schlieren (Samtaney et al., 2000) where the authors numerically plotted
In Figure 4, we compare the numerical Schlieren corresponding to two completely varied flight conditions: for
The transonic shock boundary layer interactions on the SHM1 are compared using the flow visualizations in Figure 5 for two operational regimes: at the drag divergence Mach number in Figure 5A and during shock-induced separation for
The transonic SBLI is highly unsteady and thus, the shock location oscillates along the suction surface in one time-period of the SBLI event. The instantaneous Schlieren demonstrated in Figures 4, 5 provide a basis for qualitative comparison of the flow field under different
Figure 6 compares the time-series of vorticity in frames (a to c) for low speed, climb, and cruise conditions, respectively. The probe location
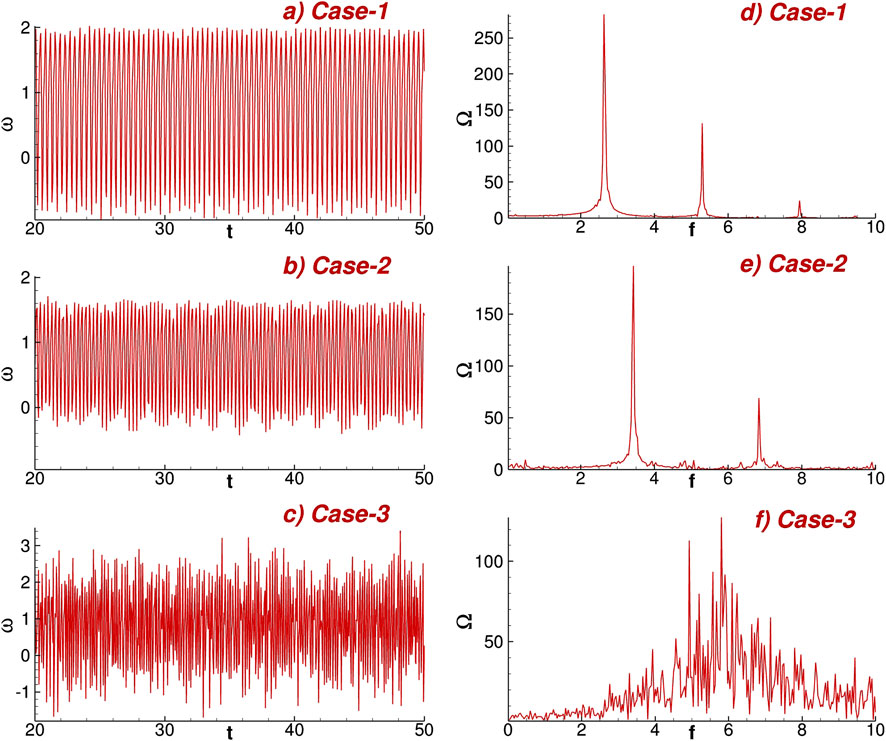
Figure 6. Time-series of vorticity probed near the trailing edge of the suction surface for (A) Case-1, (B) Case-2 and (C) Case-3 of Table 1. The corresponding FFT are shown in frames (D–F).
Figure 7 compares the time-series of vorticity in frames (a to c) for the first appearance of transonic shock boundary layer interactions, drag-divergence operation and shock-induced separation conditions, respectively. The probe location is along the aft portion of the suction surface for these off-design conditions of the SHM1 airfoil. The corresponding spectra of the time series are shown in frames (d to f) for Cases 4–6 of Table 1. After the appearance of the normal shock, apart from nonlinear interactions among Kutta waves and with the boundary layer, transonic shock boundary layer interactions evoke multiple time-periods in the flow. This is evidenced by the chaotic multi-periodic nature of the spectra in Figures 7D–F. This behavior of the frequency spectrum is typical of transitional and turbulent flows, as in the case of internal flows - lid-driven cavity flows (Joshi et al., 2023), flow inside a low pressure turbine passage, hydrodynamic instabilities; or external flows - flow over a flat plate, flow over an airfoil.
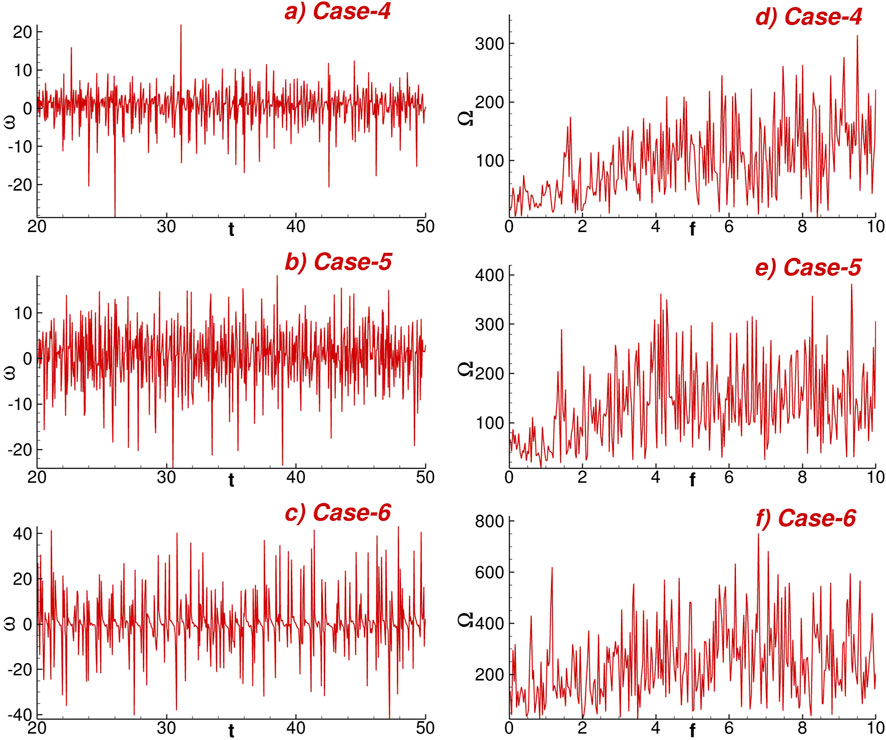
Figure 7. Time-series of vorticity probed near the trailing edge of the suction surface for (A) Case-4, (B) Case-5 and (C) Case-6 of Table 1. The corresponding FFT are shown in frames (D–F).
Compared to the design conditions in Figure 6, the magnitude of vorticity generated is higher. The associated Fourier amplitude is also greater due to the transonic shock boundary layer interactions. A higher value of Fourier amplitude implies higher vorticity generation (or rotationality in the flow). Among the off-design conditions also, as the free-stream
The multi-periodic nature of the flow with elevated free-stream
4.2 Characterization of the boundary layer and aerodynamic performance
In this section, we examine the time-averaged flow field for design and off-design conditions of the SHM1 airfoil, described in Table 1. This exploration involves the computation of coefficients of pressure and skin friction. Furthermore, the integrated
Figure 8 shows the time-averaged streamwise
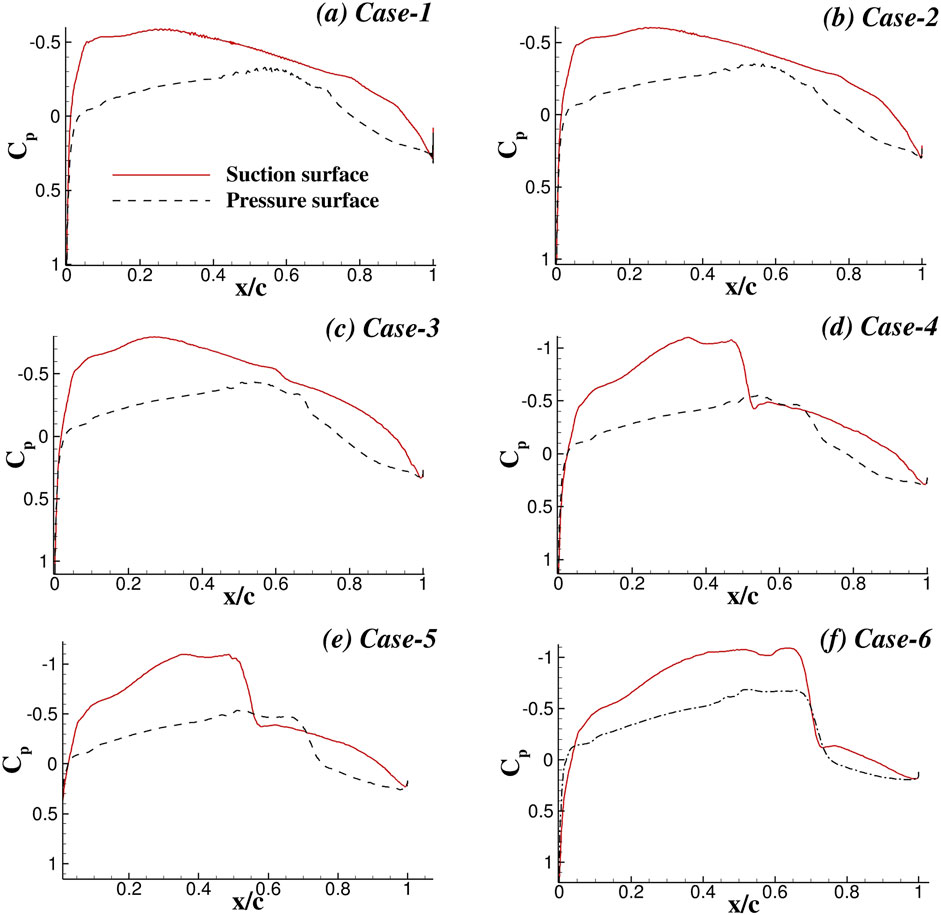
Figure 8. Streamwise variation of time-averaged
In Figure 9, time averaged streamwise variation of skin-friction coefficient
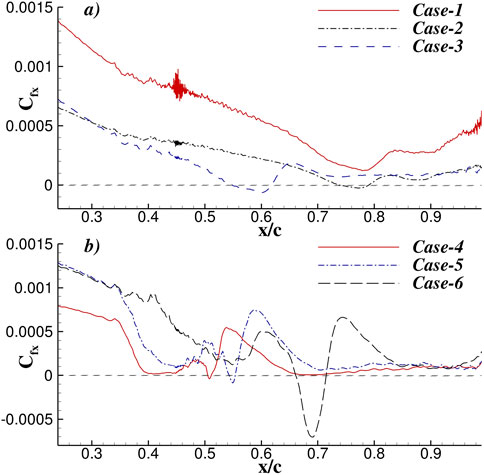
Figure 9. Streamwise variation of time-averaged
Table 2 quantifies the aerodynamic performance of the SHM1 airfoil in its design and off-design conditions. The computed values of
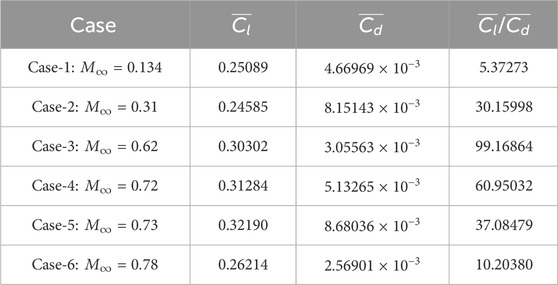
Table 2. Computed mean coefficients of lift, drag, and aerodynamic efficiency for flow over the SHM-1 airfoil. Time-averaging is done from
5 Summary and conclusion
The present study investigates the aerodynamic performance of the SHM1 airfoil (depicted in Figure 1) across various design and off-design conditions, with a focus on understanding flow physics and associated dominant time-scales. For the off-design cases, in particular, the effects of transonic shock boundary layer interactions as a function of increasing free-stream Mach number is also explored. Utilizing dispersion relation preserving highly accurate compact schemes for discretization of the governing compressible Navier-Stokes equations, six implicit large eddy simulations are performed for a range of free-stream Mach numbers. The numerics are validated against the experiments of (Fujino et al., 2003), revealing a good agreement of the computed pressure distribution with that in the flight test in Figure 2. The instantaneous flow features, spectra, pressure distributions, skin friction coefficients, and overall aerodynamic efficiency provide critical insights into the operation of the SHM1 for the following design scenarios: (i) low speed operation, (ii) climb conditions, (iii) cruise conditions; and the following off-design operation points: (i) first appearance of the near-normal transonic shock, (ii) drag-divergence condition, and (iii) shock-induced separation.
The various flow features are traced via density gradients in the numerical Schlieren plots in Figures 3–5. For low-speed operation, vortex shedding from the trailing edge follows the characteristic shedding frequency of Kelvin-Helmholtz eddies (Sengupta et al., 2024). Upon increasing the free-stream Mach number to that in the climb condition, in addition to the trailing edge vortices, upstream propagating pressure pulses are noted in the inviscid part of the flow, termed as Kutta waves (Lee, 2001). These undergo nonlinear interaction with each other and the underlying boundary layer at the cruise condition, leading to a perfect symmetric arrangement on the pressure and suction surfaces of the SHM1 airfoil. For a free-stream Mach number of 0.72, a near-normal shock (Zierep, 2003) is obtained on the suction surface which locally alters the supersonic flow to a subsonic one. At the drag-divergence Mach number, a stronger normal shock with a larger spread across the suction surface is observed. A weaker shock is obtained on the pressure surface also. For the shock-induced separation,
The dominant time-scales in the flow are identified by examining the spectrum of vorticity for the six computed cases in Figures 6, 7. While the low-speed and climb conditions reveal distinct peaks in the frequency plane at sub-harmonics of the Kelvin-Helmholtz shedding frequency, the transonic shock boundary layer interactions evoke multi-periodicity, which follows the typical chaotic behavior displayed by other fluid dynamical systems exhibiting transition to turbulence. The associated spectra are chaotic with no discernible peak along the frequency plane. The time-averaged streamwise pressure coefficient computed in Figure 8 demonstrate characteristic plateaus along the suction surface indicative of natural laminar airfoils. Pressure spikes were identified at shock locations for off-design conditions along both suction and pressure surfaces (for free-stream Mach numbers of 0.73 and 0.78). A concave pressure recovery is noted on the pressure surface beyond
The aerodynamic performance of the SHM1 airfoil was quantified in Table 2 by computing the integrated coefficients of lift and drag. The ratio of lift and drag coefficient is a metric for the aerodynamic efficiency, which has also been compared for the six test cases. It has been highlighted that Case-6 (shock-induced separation) has the least drag but also suffers from a significant loss of lift. Conversely, Case-5 (drag-divergence) exhibited the highest lift, although this was offset by substantial drag, resulting in low aerodynamic efficiency. The cruise condition emerged as the most aerodynamically efficient, achieving the best ratio of
The present work suggests that the operating conditions of the Honda jet determine the range of load and pressure distribution on the suction and pressure surfaces, which in turn affect the aerodynamic performance. The free stream Mach number, Reynolds number, and angle of attack, are important design parameters which demarcate the range of operation into design and off-design regimes. These are furthermore subdivided into subsonic and transonic flow regimes, with the best aerodynamic efficiency observed at transonic conditions. For the Honda jet, specifically designed as a natural laminar flow airfoil, efficient transonic aerodynamic performance can be achieved with higher
In conclusion, this work enhances our understanding of the SHM1 airfoil’s performance across different operating conditions. The results provide valuable benchmarks for future optimization efforts, particularly in managing shock-induced separations and enhancing overall aerodynamic efficiency in transonic flight regimes. The insights gained from this study are essential for improving the design and operational strategies of lightweight business jets and other aircraft utilizing similar airfoil configurations.
Data availability statement
The raw data supporting the conclusions of this article will be made available by the authors, without undue reservation.
Author contributions
AS: Conceptualization, Formal Analysis, Investigation, Methodology, Supervision, Visualization, Writing–original draft. AG: Data curation, Formal Analysis, Investigation, Visualization, Writing–review and editing.
Funding
The author(s) declare that no financial support was received for the research, authorship, and/or publication of this article.
Acknowledgments
The authors acknowledge the use of the high-performance computing facility, ARYABHATA at IIT (ISM) Dhanbad for computing all the cases reported here.
Conflict of interest
The authors declare that the research was conducted in the absence of any commercial or financial relationships that could be construed as a potential conflict of interest.
Generative AI statement
The author(s) declare that no Generative AI was used in the creation of this manuscript.
Publisher’s note
All claims expressed in this article are solely those of the authors and do not necessarily represent those of their affiliated organizations, or those of the publisher, the editors and the reviewers. Any product that may be evaluated in this article, or claim that may be made by its manufacturer, is not guaranteed or endorsed by the publisher.
References
Barre, S., Alem, D., and Bonnet, J. (1996). Experimental study of a normal shock/homogeneous turbulence interaction. AIAA J. 34, 968–974. doi:10.2514/3.13175
Bruce, P., and Babinsky, H. (2010). An experimental study of transonic shock/boundary layer interactions subject to downstream pressure perturbations. Aerosp. Sci. Technol. 14, 134–142. doi:10.1016/j.ast.2009.11.006
Campbell, R. L., and Lynde, M. N. (2017). “Building a practical natural laminar flow design capability,” in 35th AIAA applied aerodynamics conference, 3059.
Chakraborty, A., Roy, A. G., Sundaram, P., Sengupta, A., and Sengupta, T. K. (2022). Controlling transonic shock–boundary layer interactions over a natural laminar flow airfoil by vortical and thermal excitation. Phys. Fluids 34. doi:10.1063/5.0104299
Coder, J. G., and Maughmer, M. D. (2014). Computational fluid dynamics compatible transition modeling using an amplification factor transport equation. AIAA J. 52, 2506–2512. doi:10.2514/1.j052905
Dussauge, J.-P., and Piponniau, S. (2008). Shock/boundary-layer interactions: possible sources of unsteadiness. J. Fluids Struct. 24, 1166–1175. doi:10.1016/j.jfluidstructs.2008.06.003
Fujino, M., Yoshizaki, Y., and Kawamura, Y. (2003). Natural-laminar-flow airfoil development for a lightweight business jet. J. Aircr. 40, 609–615. doi:10.2514/1.168
Garbaruk, A., Shur, M., Strelets, M., and Spalart, P. R. (2003). Numerical study of wind-tunnel walls effects on transonic airfoil flow. AIAA J. 41, 1046–1054. doi:10.2514/2.2071
Giannelis, N., Vio, G., and Levinski, O. (2017). A review of recent developments in the understanding of transonic shock buffet. Prog. Aerosp. Sci. 92, 39–84. doi:10.1016/j.paerosci.2017.05.004
Gross, A., and Lee, S. (2018). “Numerical analysis of laminar and turbulent shock-wave boundary layer interactions,” in 2018 fluid dynamics conference, 4033.
Halila, G. L., Martins, J. R., and Fidkowski, K. J. (2020). Adjoint-based aerodynamic shape optimization including transition to turbulence effects. Aerosp. Sci. Technol. 107, 106243. doi:10.1016/j.ast.2020.106243
Halila, G. L. O., Antunes, A. P., Da Silva, R. G., and Azevedo, J. L. F. (2019). Effects of boundary layer transition on the aerodynamic analysis of high-lift systems. Aerosp. Sci. Technol. 90, 233–245. doi:10.1016/j.ast.2019.04.051
Harris, C. D. (1981). Two-dimensional aerodynamic characteristics of the NACA 0012 airfoil in the Langley 8 foot transonic pressure tunnel. Tech. Rep. Available at: https://ntrs.nasa.gov/citations/19810014503
Joshi, B., Sengupta, A., and Sundaram, P. (2023). Exploring role of aspect ratio for compressible flow in a rectangular lid-driven cavity with a vertical temperature gradient. Phys. Fluids 35. doi:10.1063/5.0155851
Karpuk, S., and Mosca, V. (2024). Investigation of hybrid laminar flow control capabilities from the flight envelope perspective. J. Aircr. 61, 1629–1654. doi:10.2514/1.c037744
Krishnan, K., Bertram, O., and Seibel, O. (2017). Review of hybrid laminar flow control systems. Prog. Aerosp. Sci. 93, 24–52. doi:10.1016/j.paerosci.2017.05.005
Larsson, J., Bermejo-Moreno, I., and Lele, S. K. (2013). Reynolds-and mach-number effects in canonical shock–turbulence interaction. J. Fluid Mech. 717, 293–321. doi:10.1017/jfm.2012.573
Lee, B. (2001). Self-sustained shock oscillations on airfoils at transonic speeds. Prog. Aerosp. Sci. 37, 147–196. doi:10.1016/s0376-0421(01)00003-3
Pulliam, T. H. (1986). Implicit solution methods in computational fluid dynamics. Appl. Numer. Math. 2, 441–474. doi:10.1016/0168-9274(86)90002-4
Quadros, R., and Bernardini, M. (2018). Numerical investigation of transitional shock-wave/boundary-layer interaction in supersonic regime. AIAA J. 56, 2712–2724. doi:10.2514/1.j056650
Sagaut, P., Suman, V. K., Sundaram, P., Rajpoot, M. K., Bhumkar, Y. G., Sengupta, S., et al. (2023). Global spectral analysis: review of numerical methods. Comput. and Fluids 261, 105915. doi:10.1016/j.compfluid.2023.105915
Samtaney, R., Morris, R., Cheeseman, P., Sunelyansky, V., Maluf, D., and Wolf, D. (2000). “Visualization, extraction and quantification of discontinuities in compressible flows,” in International conference on computer vision and pattern recognition.
Selig, M. S., Maughmer, M. D., and Somers, D. M. (1995). Natural-laminar-flow airfoil for general-aviation applications. J. Aircr. 32, 710–715. doi:10.2514/3.46781
Sengupta, A., Gupta, N., and Ubald, B. (2024). Separation-induced transition on a T106A blade under low and elevated free stream turbulence. Phys. Fluids 36. doi:10.1063/5.0189358
Sengupta, A., and Shandilya, N. (2024). Thermal optimization of shock-induced separation in a natural laminar airfoil operating at off-design conditions. Phys. Fluids 36. doi:10.1063/5.0202482
Sengupta, T. K., Bhole, A., and Sreejith, N. (2013). Direct numerical simulation of 2d transonic flows around airfoils. Comput. and Fluids 88, 19–37. doi:10.1016/j.compfluid.2013.08.007
Sengupta, T. K., Chakraborty, A., Roy, A. G., Sengupta, A., and Sundaram, P. (2022). Comparative study of transonic shock–boundary layer interactions due to surface heating and cooling on an airfoil. Phys. Fluids 34. doi:10.1063/5.0088362
Sengupta, T. K., Roy, A. G., Chakraborty, A., Sengupta, A., and Sundaram, P. (2021). Thermal control of transonic shock-boundary layer interaction over a natural laminar flow airfoil. Phys. Fluids 33. doi:10.1063/5.0075692
Somers, D. M. (1992). “Subsonic natural-laminar-flow airfoils,” in Natural laminar flow and laminar flow control (Springer), 143–176.
Sundaram, P., Sengupta, A., and Sengupta, T. K. (2022). A non-overlapping high accuracy parallel subdomain closure for compact scheme: onset of Rayleigh-Taylor instability by ultrasonic waves. J. Comput. Phys. 470, 111593. doi:10.1016/j.jcp.2022.111593
Sundaram, P., Sengupta, A., Suman, V. K., and Sengupta, T. K. (2023). Non-overlapping high-accuracy parallel closure for compact schemes: application in multiphysics and complex geometry. ACM Trans. Parallel Comput. 10, 1–28. doi:10.1145/3580005
Tijdeman, H. (1977). Investigations of the transonic flow around oscillating airfoils. TU Delft University. PhD thesis.
Touré, P., and Schuelein, E. (2018). “Numerical and experimental study of nominal 2-D shock-wave/turbulent boundary layer interactions,” in 2018 fluid dynamics conference, 3395.
Keywords: SHM1 airfoil, Kutta waves, SBLI, λ-shock, Kelvin-Helmholtz shedding frequency, pressure recovery, drag-divergence Mach number
Citation: Sengupta A and Guha A (2025) A numerical study of design and off-design operations of SHM1 airfoil. Front. Aerosp. Eng. 4:1531916. doi: 10.3389/fpace.2025.1531916
Received: 22 November 2024; Accepted: 29 January 2025;
Published: 20 February 2025.
Edited by:
Roi Gurka, Coastal Carolina University, United StatesReviewed by:
Giuseppe Gibertini, Polytechnic University of Milan, ItalyWaqar Asrar, International Islamic University Malaysia, Malaysia
Copyright © 2025 Sengupta and Guha. This is an open-access article distributed under the terms of the Creative Commons Attribution License (CC BY). The use, distribution or reproduction in other forums is permitted, provided the original author(s) and the copyright owner(s) are credited and that the original publication in this journal is cited, in accordance with accepted academic practice. No use, distribution or reproduction is permitted which does not comply with these terms.
*Correspondence: Aditi Sengupta, YWRpdGlAaWl0aXNtLmFjLmlu