 Mick Carter
 David L. Blunck*
- School of Mechanical, Industrial, and Manufacturing Engineering, Oregon State University, Corvallis, OR, United States
Detonation-based combustion cycles have the potential to have higher thermodynamic efficiencies than the more common deflagration-based combustion cycles because the pressure of the products is higher than that of the reactants. The geometry to which a detonation is confined can have a strong influence on the detonation’s behavior, or even prevent a detonation from occurring. A key measurement that can be used to design detonation-based engines is the cell size of the mixture. The cell size is a characteristic length scale of a chemical mixture. For the first time, this study compares two methods of collecting cell size measurements within a single tube. This approach controls for the effects of tube geometry and surface roughness, which may confound studies whose schlieren and soot foil measurements have been collected from different tubes. This study indicates that measurements taken using the two measurement techniques agree to within experimental uncertainty (a difference of 1.3 mm, or 7%). Soot foil methods are generally preferable for detonation cell size measurements because soot foils provide larger triple point sample sizes per detonation and lower instrumentation costs relative to schlieren methods. Various sources of uncertainty are extensively analyzed and reported for the two techniques.
1 Introduction
Practical combustion processes generally involve the use of deflagration, which is a subsonic mode of combustion. This mode of combustion is used to generate electricity, provide propulsion for cars and aircraft, and heat homes, to name just a few applications. Modern deflagration-based combustion devices have been highly optimized for efficiency, while detonations are generally avoided due to their destructive nature. However, detonation-based engine cycles have the potential to allow for even higher thermodynamic efficiencies due to the coupling of reactions and shock waves at the detonation front (Coleman, 2001; Roy et al., 2004). This coupling causes the pressure of the products to increase relative to the reactants rather than decreasing, as is the case for deflagration. The pressure gain associated with detonations can potentially allow cycles that are 30–50% more thermodynamically efficient than conventional cycles (Coleman, 2001; Nikolaev et al., 2003).
Detonation waves are unsteady, highly three-dimensional structures comprised of three types of compression waves: incident, Mach, and transverse (Lee, 2008; Fickett and Davis, 2011). The locus of intersections between the three wave types is called a triple point in the detonation community (Lee, 2008; Fickett and Davis, 2011). The triple points within a detonation front create a roughly diamond shaped structure as the front advances. These structures are known as detonation cells (Lee, 2008; Fickett and Davis, 2011). The size of detonation cells is correlated with the thickness of the reaction zone, which is driven by the rate at which energy is released (Lee, 2008; Fickett and Davis, 2011). This means that cell sizes are inversely related to detonability. A more detonable mixture will have smaller cells, which permit it to detonate in smaller chambers than mixtures with larger cells. Therefore, the characteristic cell size of a mixture is an important parameter in the design of detonation devices (Roy et al., 2004; Ciccarelli and Dorofeev, 2008) as well as in the prevention of inadvertent detonations in applications such as nuclear power generation and mining (Stamps and Tieszen, 1991). Cell sizes typically range between several millimeters, such as with hydrogen-oxygen mixtures, to 300 + millimeters in methane-air mixtures (Kaneshige and Shepherd, 1997).
The sizes of detonation cells have historically been measured from the tracks left by detonations passing over soot-covered metal sheets (i.e., foils) (Lee, 2008), (Stamps and Tieszen, 1991), (Strehlow, 1968; Bull et al., 1982; Shepherd et al., 1988; Lee et al., 1993). Soot foil measurements can be collected either from the side walls or the end of a detonation tube. Both locations are reported to give similar measurements, although Lee (Lee, 2008) notes that side-wall soot foils tend to be more accurate than end-wall soot foils, particularly in detonations with irregular cells. Cell sizes are determined by identifying paths taken by triple points along the soot foil. These paths, which mark the boundaries between the cells in each of the major directions are traced to create cell size measurements (Lee, 1984).
In more recent years, the use of high-speed schlieren photography techniques to non-invasively measure detonation cell sizes has been proposed and applied (Babbie et al., 2015; Stevens et al., 2015; Babbie et al., 2016). Schlieren photography works because changes in density cause variations in the refractive index of a gas (Settles, 2001). Shocks cause large changes in the density of the gases in extremely short distances, thus schlieren can be used to visualize a detonation front with a high degree of fidelity. Using such measurements, cell sizes are determined by visually inspecting the wave structure in images for the locations of triple points.
Schlieren measurements of cell sizes provide some important improvements over soot foil measurements, as well as some drawbacks. Schlieren measurements are non-intrusive, and are also not limited to the tube wall (i.e., can be applied within the flow). Schlieren measurements remove the need for a soot coating, which can complicate the process of determining the location of cell boundaries or even render entire soot foils useless if the soot is unevenly deposited on the foil. In addition, using schlieren to measure detonations does not require disassembling and reassembling a tube between shots, as is required when collecting soot foil measurements. As for disadvantages or limitations, the use of schlieren to measure detonation cells comes with increased cost due to the need for a high-speed camera and the associated optics (i.e., mirrors or lenses for collimination/decollimation of light), lower image resolution (in the absence of further expensive optics), and potentially increased data collection times (due to both lower image resolution and the smaller sampling areas required for window integrity). Furthermore it is not clear what are typical uncertainties associated with schlieren based cell size measurements. Rigorous uncertainty analyses are often not reported.
Stevens et al. (2015) performed a study comparing focused schlieren and soot foil measurements of H2-O2 and ethylene-air detonations; however, they compared their schlieren measurements to soot foil measurements collected by other researchers in other tubes. They observed ratios of cell sizes measured using the two techniques,
In light of the need for cell size measurements to support the design of detonation based devices, as well as gaps in the assessment of cell size measurements collected using focused schlieren techniques, the objective of this study is to perform a comparison of soot foil and focused schlieren methods using measurements taken in the same tube. In addition, an uncertainty analysis is reported for focused schlieren and soot foil techniques. This work is intended to better inform researchers so that they may appropriately select which technique to apply in their experiments.
2 Materials, Equipment, and Methods
All detonations in this study are conducted in a mixture of CH4-N2O with an equivalence ratio of ϕ = 1.07 and diluted with 38.5% molar N2. The initial temperature and pressure of the mixtures was 290 K and 101 kPa, respectively. This mixture and initial state was selected to align with testing requirements for another study. Sets of 15 detonation images (one per detonation) were used for each measurement method in order to evaluate them over a constant number of detonation events. The tube diameter for this study was larger than measured cell sizes by a factor of approximately 8, which allowed for more regular (although still mildly irregular) detonation cells, and thus meaningful measurements. Figure 1 provides examples of more vs. less regular detonation cells. Detonation cells can become more irregular when the cell size approaches the diameter of the tube (Fickett and Davis, 2011).
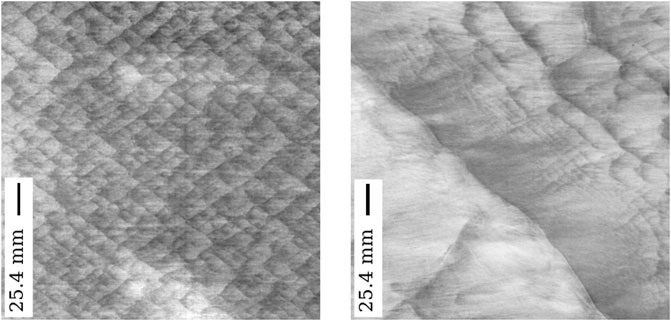
FIGURE 1. More regular detonation cells from this study (left panel) compared to less cells observed during a previous study (right panel). For reference, the less regular detonation cells were observed in a stoichiometric mixture of C3H8-Air with 2% molar CO2 dilution.
2.1 Experimental Setup
A closed-end detonation tube with optical access, as illustrated in Figure 2, was used to collect data regarding the detonation behavior. The tube was 6 m in length, and was built of seamless 14.6 cm ID (NPS 6) schedule 80 pipe made from 316L stainless steel. The viewing section had four windows, two each on the vertical and horizontal axes. Each window was made from 25.4 mm thick quartz and provides a 143 × 63.5 mm visible area allowing for two simultaneous orthogonal views of the detonation front. Any windows not being used for a given experiment were replaced with steel blanks. A vacuum pump was used to evacuate the tube prior to each detonation. Reactant and diluent gases were fed in through the manifold using measured pressures to obtain the desired mole fractions of reactants. A brushless DC fan circulated the gas mixture throughout the length of the tube to ensure that reactants were well mixed. Deflagration was initiated using an automotive spark plug immediately after a 180 s mixing period, which was assumed to be sufficiently long due to the observed repeatability of detonation wave speed measurements observed during preliminary testing. A 2.4 m long spiraled series of blockages with a blockage ratio of 45% facilitated the deflagration-to-detonation transition (DDT). The voltage responses from two sequential photodiodes located just prior to the viewing section were used to determine the detonation wave speed for each test. Typical measured detonation speeds in these tests were within 2% of the Chapman-Jouguet (CJ) detonation velocity of 2030 m/s.
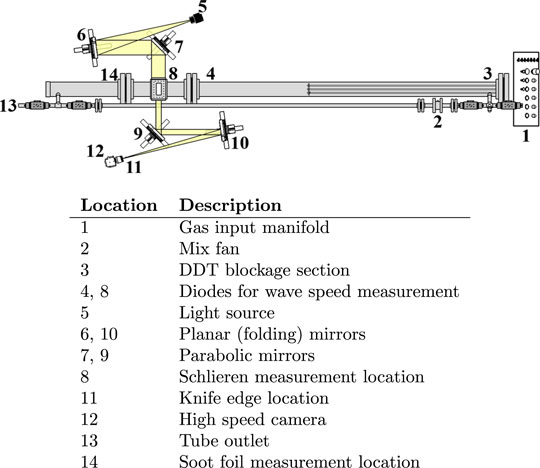
FIGURE 2. Illustration of the detonation tube and schlieren system used during data collection.
2.2 Schlieren Measurements
Schlieren photography has been used in the study of detonations since the 1960s (Lee, 2008). However, the use of focused schlieren to identify triple points and measure cell sizes is relatively new (Stevens et al., 2015). Triple points appear as “pinched” regions on the detonation front where Mach, incident, and transverse shocks join together (Lee, 2008), (Fickett and Davis, 2011). The presence of transverse waves located at the detonation front also serves to indicate triple point locations. Figure 3 shows the anatomy of a detonation wave as observed via focused schlieren, and is instructive as to what to consider in determining triple point locations. In particular, the triple points are evident from the “pinching” and variation in the detonation front’s curvature between adjacent incident and Mach shocks, as well as the presence of transverse shocks extending rearward from the front. An example of a schlieren image of a detonation front and the resulting triple point locations from the present study is shown in Figure 4. Note that triple point location in this manner, as with soot foils, is a subjective task relying on the judgement of the researcher. Stamps et al. noted an average difference of 16% between two independent measurements collected on a single soot foil between two researchers (Stamps et al., 1991); it is likely safe to assume that schlieren measurement variability between individual researchers varies similarly.
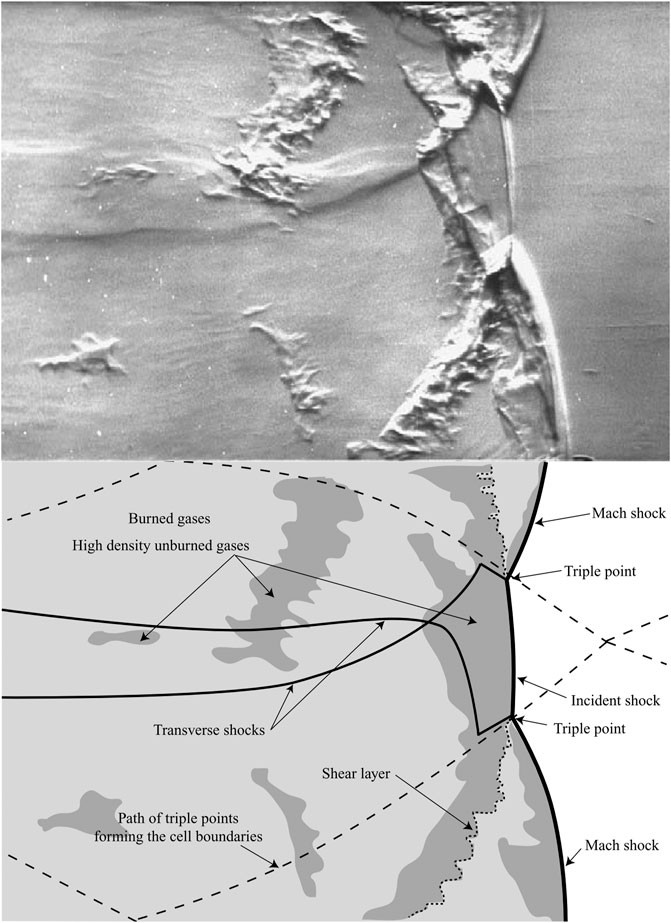
FIGURE 3. Anatomy of a detonation front as observed using a schlieren method similar to the present study, included with permission from reference (Radulescu et al., 2007).
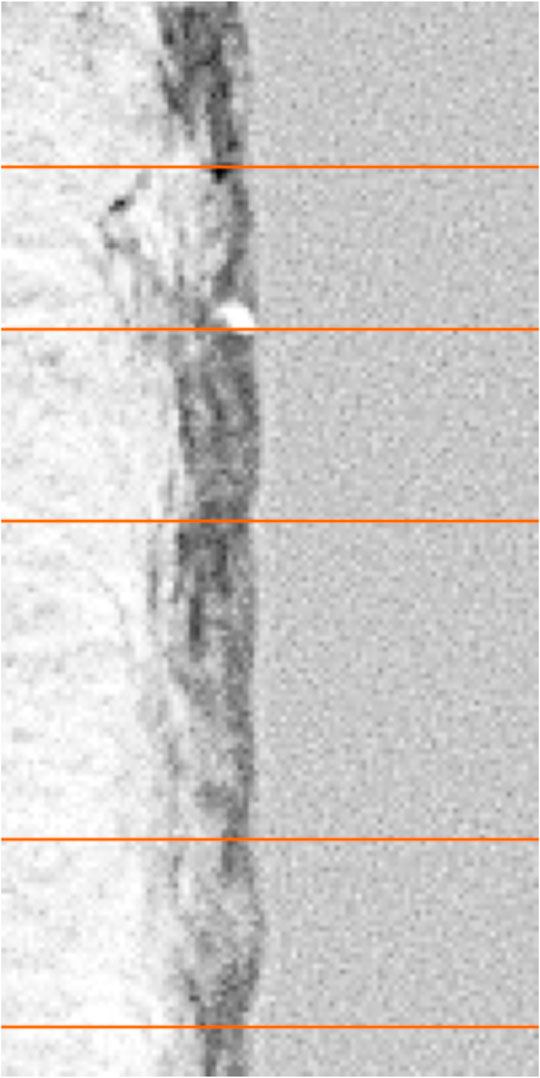
FIGURE 4. Schlieren image of a detonation front in an N2 diluted mixture of CH4-N2O with selected triple point locations. Background emissions were subtracted from the images. The detonation shown in the image is propagating from left to right. An average of 9.27 triple points were identified per frame during this study. The possible presence of an unmarked triple point within the lower third of the image provides a good example of the subjective nature of the measurements.
A Lowel DP 1000 W lamp was used as broad-band light source for schlieren measurements. The light was collimated by a 25.4 cm f/5 parabolic mirror before being folded by a planar mirror. The beam path was folded due to spatial constraints; the folding occurs in a Z-shape to counteract optical errors that would otherwise arise from the resultant path-length differences (Settles, 2001). Once folded, the beam passed through the viewing section, where the increase in gas density caused by the detonation front bent the light before it was folded again, decollimated, partially blocked by a knife edge, and collected by a Phantom Veo 710 high-speed camera equipped with a f/1.4 50 mm lens attached to a 2x rear mount teleconverter in order to increase the window size (total focal length 100 mm). Images were collected at 36 kHz with a 256 × 560 pixel window. This allowed for one (or, rarely, two) frames per detonation event. The typical spatial resolution of the images was 0.25 mm/pixel. A lens aperture of f/1.4 (f/2.8 after the teleconverter) was used in order to maximize the amount of light reaching the sensor.
A reference object was placed in front of each window (i.e., front and back) and photographed before each day’s testing. The mean pixel pitch of both images was averaged to spatially calibrate each schlieren photograph at the center plane of the tube, where measurements were collected. The average of 101 images captured immediately prior to each detonation were used for background subtraction in order to make the detonation front more apparent. Triple point locations in each frame were manually identified in each image, as shown in Figure 4.
The number of pixels between consecutive triple points in a schlieren image are recorded and converted to length via the spatial calibration. Distances between consecutive triple point locations can be averaged to determine the characteristic cell size of a mixture. Any two sequential triple points can be separated by a minimum of 0 mm (i.e., two triple points have collided) and a maximum of one cell width. However, for a single schlieren image, the location of a set of triple points within a cell (i.e., horizontal position in Figure 5) is unknown. As a result, the cell size of a schlieren dataset is estimated by doubling the mean distance between triple points (Stevens et al., 2015). This approach is necessary because any two consecutive triple points may be located at position a, b, c, d, or any other potential location, as illustrated in Figure 5. The evolution of the median distance between triple points relative to the total number of triple point delta measurements is shown in Figure 6. The cell size determined from schlieren measurements converged within the measurement uncertainty within approximately 30 individual triple point deltas.
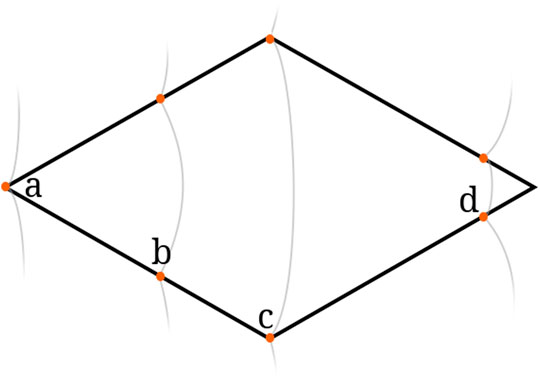
FIGURE 5. Illustration of some potential triple point locations within a single detonation cell for a schlieren image.
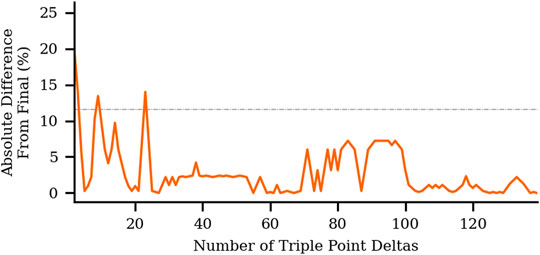
FIGURE 6. Variation in cell size determined from schlieren measurements as a function of the total number of measured distances between triple points. Grey dashed line represents relative measurement uncertainty.
Stevens et al. (2015) found that the distribution of triple point deltas (i.e., distances between consecutive triple points) was asymmetric, and recommended using the median distance as an estimator for cell size computation. Figure 7 shows a kernel density estimate of the set of distances between triple points, and confirms the skewed nature of the measured triple point distances (and thus the median as the preferred estimator for cell size). The estimated cell size, λschlieren, is therefore calculated as twice the median triple point distance
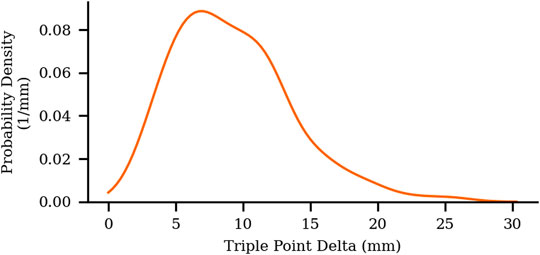
FIGURE 7. Distribution of measured triple points in the schlieren dataset.
Here δpx,i is the ith measurement (in pixels) between triple points, ℓmm,i is the physical calibration distance of the corresponding length scale, and ℓpx,i is the calibration distance in pixels. Note that a single set of calibration images was taken for each day of testing, therefore the subscripts i on the calibration distances are meant to indicate that a particular calibration applies to a set of triple points; they do not indicate that each set of triple points has its own unique spatial calibration.
2.3 Soot Foil Measurements
The soot foil technique was used to measure detonation cell sizes in another set of experiments that matched the conditions used for the schlieren based measurements. For these tests 445 mm (width) × 508 mm (length) sections of galvanized steel flashing were coated with soot using the method described by Akbar et al. (2000). Each foil was coated with soot by inserting the flashing into a partially closed vertical cylinder with a kerosene-soaked rag at the base. The rag was ignited, causing soot to be produced and deposited onto the foil. Once coated, the foil was installed downstream of the viewing section of the detonation tube. The tube was sealed, and a single detonation test was initiated. The soot foil was removed from the tube after the detonation was completed, coated with clear spray enamel to prevent deterioration, photographed, and the image was post-processed.
Each soot foil was photographed with a Canon EOS Rebel camera. A ruler was placed along the factory-cut edge of the foil to provide a spatial calibration. Typical spatial calibration was 0.13 mm/pixel. During image post processing the soot foil image was aligned, contrast enhanced to highlight the cellular patterns, and spatial calibration information was collected. Cellular patterns were subsequently manually traced in GIMP for each of the two major directions using a 1 pixel white line (Lee et al., 1993). An example of this process is shown in Figure 8. The traced lines represent the paths of triple points as the detonation wave passes over the soot foil, and correspond to the triple point locations identified in Figures 3–5. Therefore, spacing between the traced pixels (i.e., white) can be used to determine cell sizes.
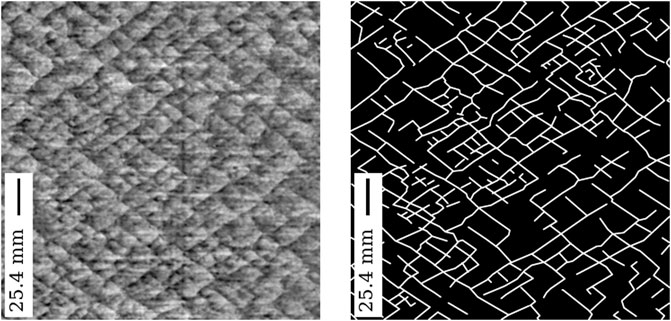
FIGURE 8. Soot foil photograph before (left) and after tracing (right). Note that tracing lines have been thickened and both directions have been overlaid for clarity; the actual lines used for measurement are 1 pixel thick, and are directionally resolved as shown in Figure 9. The images are oriented such that the direction that the detonation front propagates is left to right.
Soot foil measurements provide a complete, directionally resolved history of triple-point locations, unlike schlieren measurements. Therefore triple point distances can be determined directly without the need for doubling (as in schlieren measurements). Using soot foil measurements, triple point trajectories in each of the two major propagation directions are separated as shown in Figure 8; the distances between adjacent triple point trajectories are used to determine cell sizes. Distances between triple points are identified on a row-by-row basis (for example the blue arrows in Figure 9 indicate a single row of measurements), and these distances are used to determine the measured cell size using Eq. 2. The distribution of all soot foil deltas (i.e., distances between white lines) collected within this study is shown in Figure 10. As with the schlieren measurements, the skewed nature of this distribution indicates that the median is a more representative estimator of cell size than the mean. The cell size λfoil is therefore estimated as
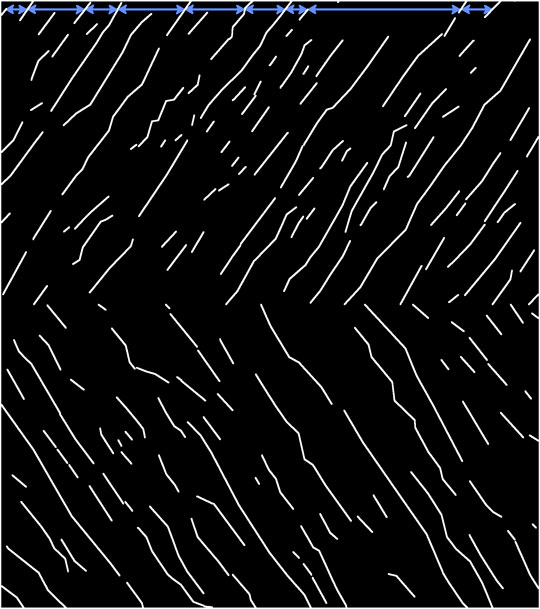
FIGURE 9. A subsection of triple point tracks in each of the two main propagation directions. Note that tracing lines have been thickened for clarity; the actual lines used for measurement are 1 pixel thick. The image is oriented such that the direction of detonation front propagation is left to right. A single row of triple point deltas is indicated in blue. Overlaying the top and bottom sets of lines gives the traced image shown in Figure 8.
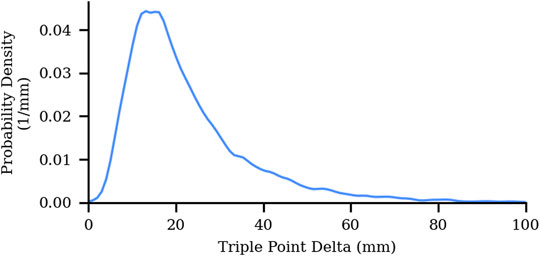
FIGURE 10. Distribution of measured distances between triple points in the soot foil dataset.
Figures 11, 12 illustrate how soot foil measurements converge as a function of the total number of triple points as well as the number of soot foils collected, respectively. Figure 11 shows that the soot foil measurements converge after approximately 100,000 triple point deltas have been measured. With an average of 28,504 triple point distances per detonation this corresponds to a requirement of approximately 3-4 soot foils to arrive at a converged measurement (i.e., within uncertainty). This analysis was done by pooling all triple point distances into a single dataset and analyzing. However, Figure 12 illustrates that similar values are obtained when the results from the images are pooled for analysis or analyzed separately.
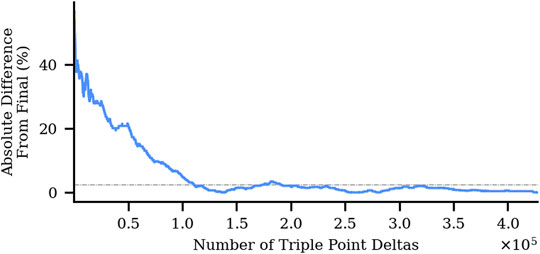
FIGURE 11. Soot foil measurement convergence with pooled data. Grey dashed line represents relative measurement uncertainty.
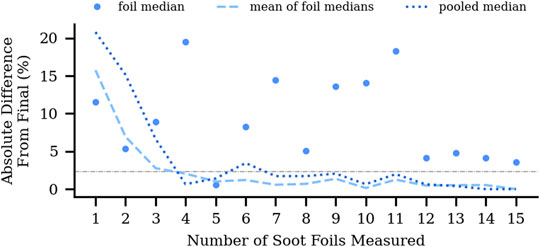
FIGURE 12. A comparison of soot foil measurement convergence using pooled and unpooled (per-image) data. Grey dashed line represents relative measurement uncertainty.
3 Results and Uncertainty
3.1 Results
The cell sizes measured using the schlieren and soot foil methods are reported in Table 1. The ratio of cell sizes measured using soot foils to that using schlieren is λfoil/λschlieren = 1.07 ± 0.13. The measurements agree within experimental uncertainty. Measurement distributions of schlieren and soot foil data along with median values and uncertainty bands are shown in Figure 13. Figure 14 shows the current measurements alongside measurements of similar mixtures (Kaneshige and Shepherd, 1997), (Akbar et al., 2000). The significance of the similarity of the results using the two approaches is twofold. First, the results suggest that either measurement approach can be used to obtain statistically similar measurements. As a result, the selection of either measurement approach can be guided by the research requirements (e.g., whether direct imaging of the detonation front is necessary) and the facilities or equipment. The second impact of this work is that the results suggest that the cell sizes in the center of a duct or along the boundary layer are similar. This finding is important because it means that measurements collected along the boundary (i.e., using soot foils) can be used to understand cell sizes throughout the flow. In turn, these measurements can be used with greater confidence by detonation engine designers or those performing simulations.
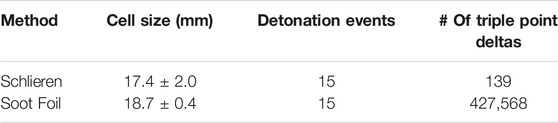
TABLE 1. Measured soot foil and schlieren cell sizes in a N2 diluted mixture of CH4-N2O. Each measurement method used 15 images. Schlieren and soot foil images had approximately 10 and 28,506 triple points on average, respectively.
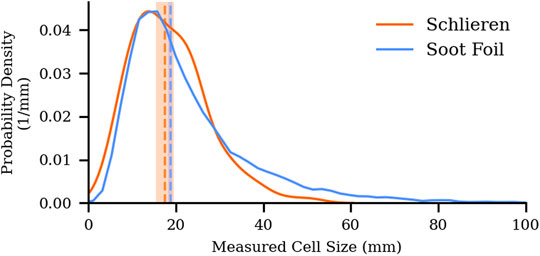
FIGURE 13. Comparison of schlieren and soot foil measurement distributions with medians and uncertainty bands.
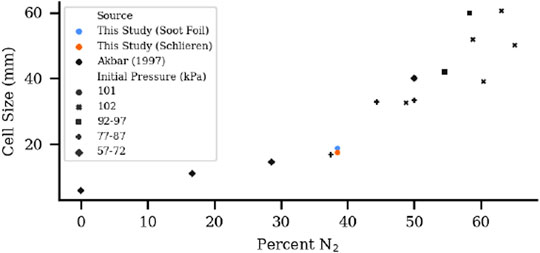
FIGURE 14. Measurements from the present study (ϕ = 1.07) shown alongside existing cell width measurements in stoichiometric CH4-N2O with varying amounts of N2 dilution (Kaneshige and Shepherd, 1997; Akbar et al., 2000).
Advantages and limitations of the two measurement techniques are now discussed. Both methods reported in this study use 15 shots of detonation data, however the soot foil dataset (427,568 triple point deltas) is three orders of magnitude larger than the schlieren dataset (139 triple point deltas). The difference in the number of measurements collected for each dataset stems from the different resolutions in both space and time. Schlieren measurements are time-resolved (i.e. they capture the detonation front at a specific instant in time) and therefore require high-speed image acquisition. Soot foil measurements, in contrast, are not time-resolved, which allows the entire (spatial) history of the detonation front to be captured. Furthermore, soot foils allow researchers to estimate cell regularity in a single shot, whereas schlieren measurements do not (see Figure 1 for examples of varying degrees of regularity within detonation cells). Therefore, for the purposes of cell size measurement alone, the soot foil method is recommended. However, in instances where optical access is required (e.g., PLIF studies) or where soot foil measurement is not feasible for technical reasons (e.g., due to liquid fuel sprays), schlieren measurements of detonation cell sizes can be considered equivalent to soot foil measurements. Finally, regardless of the measurement technique used, it is recommended that a preliminary study using soot foils be performed, if possible, to allow the characteristic regularity of the mixture to be estimated.
3.2 Uncertainty
This section describes the sources of uncertainties for the measurement techniques with special attention devoted to identifying and analyzing various sources of instrument uncertainty. Quantifying sources of uncertainty for techniques to measure cell sizes has been limited in literature. Furthermore, sources and quantities of uncertainty for cell sizes measured using focused schlieren images have not been reported previously (to our knowledge). Instrument, precision, and total uncertainties are shown in Table 2. Further discussions of the sources of uncertainty are included in subsections 3.2.1 and 3.2.2.

TABLE 2. Reported measurement uncertainties (in mm) for each measurement technique.
In the present study, uncertainties in independent variables were propagated through to dependent variables using the Kline-McClintock linear propagation method via the uncertainties python package (Lebigot, 2019). In both schlieren and soot foil analyses, some instrument uncertainties were estimated using repeated measurement tests in order to account for factors such as human error/variability. In these repeated measurement tests, 10 repetitions of each measurement (i.e., calibration distance, triple point location, etc.) were performed. Precision uncertainties were estimated using a 95% confidence interval over the measured values. The sources of uncertainty considered are detailed in the following sections. Note that the measurements presented here were collected by a single researcher, and although repeatability testing was done to estimate the level of uncertainty due to the subjective nature of triple point location, this estimate only applies to the measurements of a single researcher. It is worthwhile to consider applying an additional amount of uncertainty, such as the 16% average difference between researchers noted by Stamps et al. (1991).
The instrument uncertainties considered were approximately equal in both schlieren and soot foil measurements, however the final total uncertainties were not. The observed difference between the final uncertainty values is due to three factors. First, the typical spatial calibration factor (mm/px) for schlieren measurements was approximately double that of the soot foil measurements. Second, the factor of 2 in Eq. 1 which is not present in Eq. 2. Recall that this term arises due to schlieren triple point measurements varying from 0 mm to one full cell size apart. This factor is not needed for measuring soot foil triple point deltas, which are all one cell size apart by virtue of the directionally resolved measurement technique. Third, the difference in the number of triple point deltas measured within 15 detonation events drives the difference in precision uncertainties between the two measurement methods. In both measurement approaches, instrument uncertainty dominated the total uncertainty.
3.2.1 Schlieren
The total instrument uncertainty for schlieren measurements was ±1.895 mm. Precision uncertainty was estimated to be ±0.730 mm (95% confidence). Total uncertainty for schlieren measurements was ±2.031 mm. The following sources of instrument uncertainty for the schlieren-based measurements were considered in the analysis.
• Distance between triple points (px)
Two sources of instrument uncertainty were estimated with regards to identifying distances between triple points in schlieren images. First, the uncertainty arising from the subjective nature of identifying triple point locations was considered. Second, the uncertainty caused by pixel resolution of the images was considered.
Uncertainty is induced into the schlieren based measurements by the process of identifying the location of triple point on the images. This source of uncertainty was estimated by comparing 10 repeated measurements taken from a single schlieren image. The median distance between triple points was calculated for each replicate, and the set of 10 median values was used to estimate the uncertainty, ± 3.789px (95% confidence).
Instrument uncertainty in the location of a single triple point due to pixel resolution is ±0.500px, therefore the uncertainty in the distance between triple points was estimated to be ±0.707px.
The total uncertainty in pixel distance between triple points, therefore, was estimated to be ±3.854px. Uncertainty from the subjective location of triple points dominates the total uncertainty in the distance between triple points.
• Calibration distance (mm)
Two sources of instrument uncertainty were considered with regards to the calibration distance in schlieren measurements. First, the uncertainty associated with distance between increments on the measurement standard was considered. Second, the thickness of the lines on the calibration device was considered.
The calibration device used for schlieren data collection was a 5.08 mm square grid. Spatial calibrations were taken along a single edge, and over an integer number of grid squares. The actual number of grid squares used in each calibration varied as needed due to window and lighting conditions. The uncertainty of distances on the calibration device was estimated using a 10 sample repeatability test. A set of 18 grid squares were measured repeatedly using digital calipers. The resulting uncertainty was ±0.004 mm (95% confidence).
Ten measurements of the width of a line on the calibration grid were collected because measurements were taken line-to-line (i.e., not in the middle of a grid square). The resulting uncertainty was estimated to be half of the mean line thickness, ± 0.017 mm (95% confidence).
The total uncertainty in physical calibration distance was therefore estimated to be ±0.017 mm. Error introduced due to the thickness of the grid lines is the main source of uncertainty in the calibration grid.
• Calibration distance (px)
Two sources of instrument uncertainty were estimated with regards to the pixel calibration distance for schlieren images. First, the uncertainty due to the manual selection of a calibration distance in images was considered. Second, the uncertainty caused by pixel resolution was considered.
The uncertainty associated with a user determining the number of pixels in an image corresponding to the spatial calibration was estimated by performing 10 trials of a pixel calibration on a single schlieren calibration image. The resulting uncertainty was ±0.414px (95% confidence).
Uncertainty in pixel calibration distance due to pixel resolution was estimated to be ±0.707px (i.e., plus or minus a half pixel on either end of the span).
The total uncertainty of the schlieren pixel calibration distance was estimated to be ±0.819px based on the pixel resolution of the image and the user determination of calibration distance.
3.2.2 Soot Foil
The total instrument uncertainty for soot foil measurements was ±0.442 mm. Precision uncertainty was estimated to be ±0.044 mm (95% confidence). The total uncertainty for soot foil measurements was ±0.444 mm. The following sources of instrument uncertainty for the soot-foil-based measurements were considered in the analysis.
• Distance between triple points (px)
Two sources of instrument uncertainty were considered with regards to the pixel distance between triple points in soot foil images. First, the uncertainty arising from the subjective nature of triple point location was considered. Second, the uncertainty caused by pixel resolution of the images was considered.
Uncertainty is induced into the soot foil based measurements by the process of identifying the location of triple point on the images. This source of uncertainty was estimated by comparing 10 sets of cell boundary measurements taken from a single section of a soot foil. The variation in position of each measured edge pixel throughout the 10 measurements was used to estimate the uncertainty in a single triple point location. The estimated uncertainty was applied to each cell boundary, and the total uncertainty in triple point distance was thus ±3.302px (95% confidence).
The uncertainty in the location of a single triple point due to pixel resolution is ±0.500px, therefore the uncertainty in the distance between triple points was estimated to be ±0.707px.
The total instrument uncertainty in triple point pixel distance was estimated to be ±3.377px. As with the schlieren measurements, uncertainty from the subjective location of triple points is the main source of uncertainty.
• Calibration distance (mm)
The calibration device used for soot foil data collection was a metal ruler with 1 mm resolution. Therefore, the uncertainties in the physical location at either end of each physical calibration distance were estimated to be ±0.500mm, giving a total uncertainty of ±0.707 mm per calibration distance.
• Calibration distance (px)
Two sources of instrument uncertainty were estimated with regards to the pixel calibration distance for soot foil images. First, the uncertainty due to the manual selection of a calibration distance was considered. Second, the uncertainty caused by pixel resolution was considered.
The uncertainty associated with determining the number of pixels in the spatial calibration images was estimated by performing 10 trials of a pixel calibration on a single soot foil image. The resulting uncertainty was ±0.624px (95% confidence).
Uncertainty in the pixel location at the start and end of each calibration distance was estimated to be ±2.000px due to the thickness of the lines on the ruler within the image, resulting in an uncertainty of ±2.828px per calibration distance.
Based on the aforementioned values, the total uncertainty in the soot foil pixel calibration distance was estimated to be ±2.896px.
4 Summary and Discussion
In this study, detonation cell size measurements taken via schlieren and soot foil methods were compared. Prior work has compared measurements collected using the two techniques, but the measurements were collected using different detonation tubes. Using the same tube for both sets of measurements allowed for control of the effects of tube geometry and surface finish on the detonation cells, which may have presented a confounding factor in previous studies. Schlieren and soot foil measurements agreed to within 1.27 mm (∼7%). The measurement uncertainties were estimated to be ±2.031 mm and ±0.444 mm for schlieren and soot foil measurements, respectively. The results from this work indicate that cell sizes measured via schlieren and soot foils are statistically similar when taken within the same apparatus. The higher sample size per detonation and lower overall equipment cost of applying the soot foil method makes this approach preferable for measuring cell sizes when experimental conditions permit its use.
Data Availability Statement
The raw data supporting the conclusion of this article will be made available by the authors.
Author Contributions
All authors listed have made a substantial, direct, and intellectual contribution to the work and approved it for publication.
Funding
This work is supported by the Office of Naval Research, contract N000141612429.
Conflict of Interest
The authors declare that the research was conducted in the absence of any commercial or financial relationships that could be construed as a potential conflict of interest.
Publisher’s Note
All claims expressed in this article are solely those of the authors and do not necessarily represent those of their affiliated organizations, or those of the publisher, the editors and the reviewers. Any product that may be evaluated in this article, or claim that may be made by its manufacturer, is not guaranteed or endorsed by the publisher.
Acknowledgments
The authors would like to thank the Detonation Group at the Air Force Research Laboratory for providing access to a detonation tube, as well as for their invaluable input and technical advice during the design process. The help from Torin Christensen in editing the manuscript is gratefully acknowledtged.
References
Akbar, R., Kaneshige, M., Schultz, E., and Shepherd, J. (2000). “Detonations in H2-N2O-CH4-NH3-O2-N2 Mixtures,” in Tech. Rep. (Pasadena: Los Alamos National Laboratory). [Online]. Available at: https://shepherd.caltech.edu/EDL/publications/r%7B%5C_%7Dakba97b/rep3.pdf.
Babbie, C. A., King, P., Hoke, J., and Schauer, F. (2016). “Effect of Elevated Mixture Pressure and Equivalence Ratio on Hydrogen-Air Detonation Cell Size,” in 54th AIAA Aerospace Sciences Meeting. doi:10.2514/6.2016-0442978-1-62410-393-3
Babbie, C. A., King, P., Stevens, C. A., Hoke, J., and Schauer, F. (2015). “Experimental Measurement of Detonation Cell Size in a Two-Dimensional Facility at High Pressures,” in 53rd AIAA Aerospace Sciences Meeting (Reston, Virginia: American Institute of Aeronautics and Astronautics). doi:10.2514/6.2015-0634978-1-62410-343-8
Bull, D. C., Elsworth, J. E., Shuff, P. J., and Metcalfe, E. (1982). Detonation Cell Structures in Fuel/air Mixtures. Combust. Flame 45, 7–22. 00102180. doi:10.1016/0010-2180(82)90028-1
Ciccarelli, G., and Dorofeev, S. (2008). Flame Acceleration and Transition to Detonation in Ducts. Prog. Energy Combust. Sci. 34 (4), 499–550. 03601285. doi:10.1016/j.pecs.2007.11.002
Coleman, M. (2001). “Overview of Pulse Detonation Propulsion Technology,” in Tech. Rep (Columbia, MD: Chemical Propulsion Information Agency). [Online]. Available at: http://www.dtic.mil/dtic/tr/fulltext/u2/a390257.pdf.
Fickett, W., and Davis, W. C. (2011). Detonation: Theory and Experiment. Mineola, NY, USA: Dover Publications. 978-0486414560.
Kaneshige, M., and Shepherd, J. E. (1997). “Detonation Database: Explosion Dynamics Laboratory Report FM97-8,” in Tech. Rep. (Pasadena: California Institute of Technology).
Lebigot, E. O. (2019). Uncertainties: A Python Package for Calculations with Uncertainties Version 3.1.2. [Online]. Available at: http://pythonhosted.org/uncertainties/.
Lee, J. H. S. (1984). Dynamic Parameters of Gaseous Detonations. Annu. Rev. Fluid Mech. 16 (1), 311–336. 00664189. doi:10.1146/annurev.fl.16.010184.001523
Lee, J. H. S. (2008). The Detonation Phenomenon. Cambridge: Cambridge University Press. 9780521897235.
Lee, J. J., Frost, D. L., Lee, J. H. S., and Knystautas, R. (1993). “Dynamic Aspects of Detonations,” in Dynamic Aspects of Detonations. Editors A. R. Seebass, A. L. Kuhl, J. C. Leyer, A. A. Borisov, and W. A. Sirignano (Washington, DC: American Institute of Aeronautics and Astronautics), 182–202. 978-1-60086-626-5. ch. 2. doi:10.2514/4.866265
Nikolaev, Y. A., Vasil'ev, A. A., and Ul'yanitskii, B. Y. (2003). Gas Detonation and its Application in Engineering and Technologies (Review). Combust. Explos. Shock Waves 39 (4), 382–410. 00105082. doi:10.1023/A:1024726619703
Pintgen, F., and Shepherd, J. E. (2003). “Simultaneous Soot Foil and PLIF Imaging of Propagating Detonations,” in 19th International Colloquium on the Dynamics of Explosions and Reactive Systems, Hakone, Japan, 1–4. [Online]. Available at: https://shepherd.caltech.edu/EDL/publications/reprints/ICDERS03soot%7B%5C_%7Drevised.pdf.
Radulescu, M. I., Sharpe, G. J., Law, C. K., and Lee, J. H. S. (2007). The Hydrodynamic Structure of Unstable Cellular Detonations. J. Fluid Mech. 580 (2007), 31–81. 0022-1120. doi:10.1017/S0022112007005046
Roy, G. D., Frolov, S. M., Borisov, a. a., and Netzer, D. W. (2004). Pulse Detonation Propulsion: Challenges, Current Status, and Future Perspective. Prog. Energy Combust. Sci. 30 (6), 545–672. 03601285. doi:10.1016/j.pecs.2004.05.001
Settles, G. S. (2001). Schlieren and Shadowgraph Techniques. Berlin, Heidelberg: Springer Berlin Heidelberg. 978-3-642-63034-7. doi:10.1007/978-3-642-56640-0
Shepherd, J. E., Moen, I. O., Murray, S. B., and Thibault, P. A. (1988). Analyses of the Cellular Structure of Detonations. Symposium Int. Combust. 21 (1), 1649–1658. 00820784. doi:10.1016/S0082-0784(88)80398-9
Stamps, D., Benedick, W., and Tieszen, S. (1991). “Hydrogen–air–diluent Detonation Study for Nuclear Reactor Safety Analyses,” in Tech. Rep. NUREG/CR-5525 (Albuquerque, NM: Sandia National Laboratories).
Stamps, D. W., and Tieszen, S. R. (1991). The Influence of Initial Pressure and Temperature on Hydrogen-Air-Diluent Detonations. Combust. Flame 83 (3-4), 353–364. 00102180. doi:10.1016/0010-2180(91)90082-M
Stevens, C. A., Hoke, J., and Schauer, F. (2015). “Optical Measurement of Detonation with a Focusing Schlieren Technique,” in 53rd AIAA Aerospace Sciences Meeting (Reston, Virginia: American Institute of Aeronautics and Astronautics). doi:10.2514/6.2015-1350978-1-62410-343-8
Keywords: detonation, soot foil technique, schlieren, measurement, cell size
Citation: Carter M and Blunck DL (2022) Direct Comparison of Schlieren and Soot Foil Measurements of Detonation Cell Sizes. Front. Aerosp. Eng. 1:892330. doi: 10.3389/fpace.2022.892330
Received: 08 March 2022; Accepted: 21 April 2022;
Published: 09 June 2022.
Edited by:
Leonid Tartakovsky, Technion Israel Institute of Technology, IsraelReviewed by:
Gabriel Ciccarelli, Queen’s University, CanadaBrent Rankin, Air Force Research Laboratory, United States
Andy Thawko, Princeton University, United States
Copyright © 2022 Carter and Blunck. This is an open-access article distributed under the terms of the Creative Commons Attribution License (CC BY). The use, distribution or reproduction in other forums is permitted, provided the original author(s) and the copyright owner(s) are credited and that the original publication in this journal is cited, in accordance with accepted academic practice. No use, distribution or reproduction is permitted which does not comply with these terms.
*Correspondence: David L. Blunck, ZGF2aWQuYmx1bmNrQG9yZWdvbnN0YXRlLmVkdQ==