 Wei Guo1†
 Yifei Zhou
- 1Department of Computer Science, George Washington University, Washington, DC, United States
- 2Department of Mechanical and Aerospace Engineering, George Washington University, Washington, DC, United States
Deep Reinforcement Learning (DRL) has demonstrated promising performance in maintaining safe separation among aircraft. In this work, we focus on a specific engineering application of aircraft separation assurance in structured airspace with high-density air traffic. In spite of the scalable performance, the non-transparent decision-making processes of DRL hinders human users from building trust in such learning-based decision making tool. In order to build a trustworthy DRL-based aircraft separation assurance system, we propose a novel framework to provide stepwise explanations of DRL policies for human users. Based on the different needs of human users, our framework integrates 1) a Soft Decision Tree (SDT) as an online explanation provider to display critical information for human operators in real-time; and 2) a saliency method, Linearly Estimated Gradient (LEG), as an offline explanation tool for certification agencies to conduct more comprehensive verification time or post-event analyses. Corresponding visualization methods are proposed to illustrate the information in the SDT and LEG efficiently: 1) Online explanations are visualized with tree plots and trajectory plots; 2) Offline explanations are visualized with saliency maps and position maps. In the BlueSky air traffic simulator, we evaluate the effectiveness of our framework on case studies with complex airspace route structures. Results show that the proposed framework can provide reasonable explanations of multi-agent sequential decision-making. In addition, for more predictable and trustworthy DRL models, we investigate two specific patterns that DRL policies follow based on similar aircraft locations in the airspace.
1 Introduction
Many real-world decision making and control tasks face challenges from dynamic environments and complex state spaces. In addition, there are often competitions or collaborations when there is a multiple-agent environment. These practical factors make it challenging to design planning and control algorithms. Aircraft separation assurance is one example of these real-world control tasks. It aims to maintain safe separation distances among all aircraft in a given airspace region and guarantee that every aircraft exits the airspace region without conflict. In this work, we focus on aircraft separation assurance provided through speed advisories.
In recent years, Deep Reinforcement Learning (DRL) has been recently explored in aircraft separation assurance. Our group solves this problem in structured airspace with DRL (Brittain and Wei, 2019; Brittain and Wei, 2021; Brittain et al., 2021; Guo et al., 2021). Different DRL approaches have been applied to aircraft separation assurance task. Deep Q-network (Mnih et al., 2013; Van Hasselt et al., 2016) is a very popular solution in this field because of its generalization ability (Wulfe, 2017; Wang et al., 2019; Ribeiro et al., 2020; Isufaj et al., 2021). Proximal Policy Optimization (PPO) (Schulman et al., 2017) is also widely used because it provides stable and outstanding performance (Brittain and Wei, 2019; Brittain and Wei, 2021; Brittain et al., 2021; Ghosh et al., 2021; Guo et al., 2021). Though DRL models show good performances in collision avoidance problems, they make decisions in a non-transparent way, which makes it hard to build trust in such a safety-critical system.
The non-transparency issue can be addressed by providing explanations regarding the model decisions and recommendations. For example, displaying the key factors, such as position and airspeed, that lead to a speed change advisory will help human users understand DRL policies better. In our work, users of DRL-based aircraft separation assurance systems refer to human operators such as pilots and air traffic controllers, and certification agencies such as the Federal Aviation Administration. Apart from the critical information for the decision at each time step, analysts from certification agencies also need to reason whether or not the speed advisories follow any patterns given specific aircraft locations and speeds in the airspace. If such pattern is identified, DRL policies will become more predictable to users, resulting in a more trustworthy aircraft separation assurance system for human operators.
In order to aid human users in capturing the key factors in the decisions of DRL models, it is important to quantify the influence of input states on output policies. One popular approach is to build Soft Decision Trees (SDTs) (Frosst and Hinton, 2017) by distilling the knowledge from DRL models into shallow, more explainable trees. The distilled SDT works as a surrogate model. Its decision path and feature weights can be leveraged to present critical state information behind one recommended decision. Another promising branch of methods are saliency methods (Simonyan et al., 2013; Selvaraju et al., 2017; Sundararajan et al., 2017). Instead of building a surrogate model, saliency methods typically leverage the neural network’s gradients to compute saliency scores of input features. Higher scores imply more important features.
We propose a novel framework that integrates an SDT and a saliency method called linearly estimated gradient (LEG) (Luo et al., 2021), to provide stepwise explanations for human users, as shown in Figure 1. The SDT serves as an online explanation provider to display critical information for human operators in real-time, while LEG is an offline explanation tool for certification agencies to conduct more comprehensive analyses. Specifically, the SDT transfers knowledge from complex network representation to tree-structured representation with clear decision paths. We visualize the transferred knowledge with 1) a tree plot showing feature importance and the decision path and 2) a trajectory plot highlighting critical state information for a recommended decision. In addition, LEG computes saliency scores of the DRL model’s input features. We visualize these scores with a saliency map. Offline explanations are provided by combining it and a position map showing the airspace route structure and all aircraft. Furthermore, we utilize LEG to explain two specific patterns that speed advisories follow. We refer to our framework as “Stepwise Explainable Separation Assurance MEthod” (SESAME).
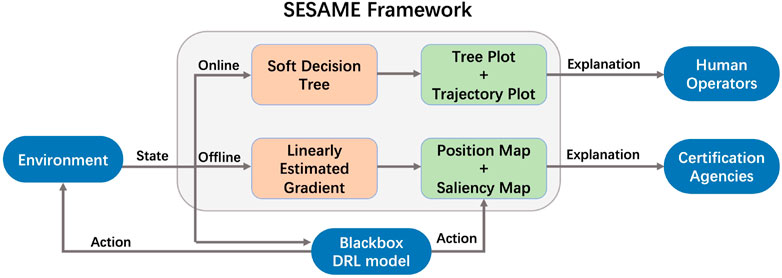
FIGURE 1. The structure of the SESAME explanation framework. The framework observes the state vectors of the simulation environment and generates the decision path with the SDTs in distillation module at each time step. The decision path is fed to the visualization module. The visualization module generates tree plot and trajectory plot to provide online explanations for human operators. LEG computes saliency scores of input features. The scores are fed to the visualization module. The visualization module generates saliency maps and position maps to provide offline explanations for certification agencies.
Our contributions can be summarized as follows:
• We extend the application of LEG from deep learning based computer vision models to DRL-based decision-making models.
• To the best of our knowledge, our work is the first to build explainable DRL-based aircraft separation assurance systems.
• Our proposed framework provides online explanations for human operators via an SDT and decision path visualization, and provides offline explanations for certification agencies via LEG and decision reasoning visualization.
2 Related works
Many works on Explainable DRL have been proposed to provide model explanations. Representation learning is applied to generating compact and explainable representations (Jonschkowski and Brock, 2015; Jarrett et al., 2021). Human-understandable rules from DRL models are extracted by logic rule methods to provide behavior explanations (Verma et al., 2018). Neural language models are trained to generate explanations for agent behaviors in text form (Cideron et al., 2019; Kim et al., 2020).
SDT is a popular model for behavior explanations, which integrates the traditional hard decision trees (Quinlan, 1986) and perceptrons. SDTs can distill knowledge from complex DRL models and work as surrogate models. The tree structure in SDT provides a decision path and detailed feature weights, which can then be used to provide explanations. The first SDT model was implemented to solve an image classification problem (Frosst and Hinton, 2017). To build SDT models for DRL models, state-action pairs are first generated by DRL models and then used to train SDT models in a supervised-learning paradigm. The knowledge from a PPO network was distilled to explain the behaviors of agents playing the Super Mario game (Karakovskiy and Togelius, 2012). To further improve the performance of DRL-based SDTs, a linear model U-tree is proposed by approximating Q functions (Liu et al., 2018). Univariate nodes are introduced to discretize SDTs for better interpretability (Silva et al., 2020). A feature learning tree is integrated with the standard SDT to improve model expressivity (Ding et al., 2020). A series of novel metrics are proposed for a comprehensive evaluation (Dahlin et al., 2020).
Another promising branch of explanation methods is saliency methods. They typically leverage the neural network’s gradients to compute saliency scores of input features. Features with higher scores are more relevant to the network prediction. Saliency methods are widely used to determine the regions in an image that contribute the most to the classification result (Simonyan et al., 2013; Zeiler and Fergus, 2014; Selvaraju et al., 2017; Smilkov et al., 2017; Sundararajan et al., 2017; Ancona et al., 2018). Similarly, they are used to capture the key factors that lead to the decisions of DRL agents. Jacobian saliency is visualized on the images of Atari games to highlight the most important pixels (Wang et al., 2016; Zahavy et al., 2016). A perturbation method is proposed to generate saliency maps that are more human-interpretable (Greydanus et al., 2018). Object saliency maps are explored to explain DRL-based object recognition (Iyer et al., 2018). Specificity and relevance are introduced as two criteria for more accurate saliency maps (Gupta et al., 2020). In this work, we integrate a saliency method, LEG (Luo et al., 2021), into our framework as an offline explanation tool for certification agencies.
Our work is different from the previous works in the following ways: 1) Our framework provides both online explanations with SDTs and offline explanations with saliency methods. In contrast, the previous papers only focus on one specific method. 2) Our work concentrates on the aircraft separation assurance task with a complex high-dimensional input space. But the previous works mainly focus on tasks with simple low-dimensional input [e.g., CartPole (Ding et al., 2020), LunarLander (Silva et al., 2020)] or tasks with pixel-based input [e.g., Mario AI Benchmark (Coppens et al., 2019), Wildfire Tracking (Haksar and Schwager, 2018)]. 3) Our work focuses on a complex multi-agent problem so the proposed methods need to consider the cooperation among all agents in the system. However, the previous works mainly explain the tasks with only a single agent. 4) Our work explores the general patterns that DRL policies follow. In contrast, previous works on explaining DRL policies with saliency methods mainly focus on extracting important information from a particular state.
3 Background
3.1 Markov decision process
Sequential decision-making problems can be formalized as Markov Decision Processes (MDPs). The important Markov assumption here is that the transition between two states depends only on the current state and action but not the history. An MDP can then be modeled with tuple
The agent interacts with the environment based on the policy π. The solution of MDP is an optimal policy π* that maximizes the expected utility. The optimal policy can be found recursively by:
3.2 Deep reinforcement learning
DRL is a solution to solve the Reinforcement Learning problems. A policy π is represented as a neural network in DRL models. Policy-based DRL is a family of algorithms designed to learn stochastic policies. PPO is a gradient-based DRL method (Schulman et al., 2017) that implements a neural network to approximate the policy and the value function. In this work, a PPO network is first trained and then used to generate offline transitions for the explainable models.
3.3 Soft decision tree
SDT is a classification model that integrates perceptrons with traditional hard decision trees together. SDT is recently explored in explainable classification problems. A single-layer neural network parameterized by weight wk is built in each non-leaf node k. Given all possible classes c′ and the target class c, a fixed classification distribution parameterized by vector ϕl is learned by each leaf node l as:
The traversal probability is defined as the probability of traversing from the parent node k to its left child node. Given input state s, weight vector wk, the sigmoid function σ, and inverse temperature parameter β, the traversal probability can be calculated as:
A decision path is formed by the traversal from the root node to another node (e.g., a leaf node). The decision is made hierarchically in an SDT along the decision path. The path probability p is defined as the overall product of all probabilities leading from the root to the last node in this traversal. Given the input state s, the traversal probabilities are calculated on each none-leaf node along the decision path. Finally, one leaf node is reached and the classification distribution ϕl is used to guide the output selection.
The loss function of SDT mainly has two parts: entropy loss foc classification and the regularization loss to penalize unequal use of non-leaf nodes. All non-leaf and leaf nodes are optimized during the training process.
3.4 Linearly estimated gradient
Linearly Estimated Gradient (LEG) (Luo et al., 2021) is a saliency method that recovers the gradient of a neural network by perturbing its input features. Features that contribute more to the network output will have gradients with larger magnitudes. In our setting, we treat the DRL model as a non-linear function whose policy output is π(a|s), where s is the input state and a is the action. The perturbations are sampled from a continuous distribution F. The gradients to be recovered are denoted as g. If the current state is s0, g can be written as:
LEG approximates the function π(a|s) based on the first-order Taylor series expansion around the point s0:
LEG is defined as:
It minimizes a squared error. The distribution F is chosen based on the range of points to be considered.
It can be proved that LEG has an analytical solution under certain conditions [Lemma 1 in Luo et al. (2021)]. Specifically, let Z be a vector of random variables which obeys a centered distribution F, i.e., Z ∼ F and
Therefore, LEG can be approximated by an empirical mean. We randomly sample s1, …, sn from F + s0, and then computey1, …, yn, where yi = π(a|si). If we denote the difference between the original and perturbed value as
4 Problem formulation
The target of aircraft separation assurance is to maintain a safe distance or prevent loss of separation among all aircraft in an airspace region. Specifically, we formulate it as a decentralized decision-making process, so each aircraft needs to coordinate with other aircraft. In this paper, our proposed framework provides explanations of all aircraft behaviors. The BlueSky (Hoekstra and Ellerbroek, 2016) is used as the air traffic simulator.
To evaluate the performance of the proposed framework, two challenging case studies are implemented with multiple intersections and high-density air traffic. Each case study has a dynamic simulation environment and the aircraft enter the sector stochastically. So the proposed explainable framework cannot just remember the correct behaviors but has to understand the dynamic strategies based on varying scenarios. This problem setting further increases the difficulty of behavior explanations.
4.1 Multi-agent reinforcement learning
The aircraft separation assurance problem is formalized as a multi-agent reinforcement learning problem. Each aircraft is treated as an agent and needs to coordinate with all other aircraft. The same DRL model and explainable framework are implemented on each aircraft to maintain safety separation and provide explanations during execution.
4.2 Action space
Since the radar surveillance system updates the en route position every 12 s, the agent is allowed to select an action per 12 s. The action space is simplified with three available actions: deceleration a−, acceleration a+, and maintaining the current speed a0.
4.3 State space
Both information of ownship and intruders is included in the state space. Since the information needs to be shared among all aircraft, we proposed the functions of communication and coordination. Specifically, the following features are contained in ownship state: location, current speed, acceleration information, route identifier, and the distance to sector exit. Extra information is included in intruder state: Distance between ownship and intruders, distance between ownship and intersections, and the distance between intruders and intersections.
4.4 Termination
Aircraft will be generated and fly following the routes in each simulation episode. The termination happens when all aircraft either 1) exit the sector without conflict or 2) have collisions with other aircraft.
4.5 Reward
The same reward function is implemented on all aircraft. To sum up, the reward function penalizes the local collisions and the speed changes of all aircraft agents. The collision reward Rc penalizes only the two or more aircraft in conflict. The speed-change reward Rs is implemented because speed changes should be avoided unless necessary in the real world. Specifically, the collision reward function Rc and the speed-change reward function Rs are defined as follows:
Here
5 Proposed methods
Our objective is to provide explanations of the DRL agent behaviors in aircraft separation assurance. In order to achieve this goal, we propose an explanation framework with both online and offline modules to pair with the given DRL model.
5.1 Distillation module
This module distills the knowledge from a DRL model into a shallow SDT. The DRL model controls the agent to perform aircraft separation assurance task. It also generates transitions consisting of state-action pairs (s, a) to train the SDT model. a is the predicted action for state s from the DRL model.
SDTs are fitted with the above-mentioned transitions using supervised learning. During the execution phase, SDT generates a decision path for input state s. And each state variable (e.g., velocity, acceleration) in state s from DRL model is treated as a feature in SDT. The feature weights and the decision path in SDT are then utilized in the visualization module to support behavior explanations.
Because the feature scales may vary greatly, we further implement a Batch Normalization (BN) layer in front of the SDT to normalize the input. BN operator subtracts the mean value of mini-batch and subsequently divides the centered input by the standard deviation of mini-batch during training. The mean and standard deviation are calculated per dimension over the mini-batches during the training phase. In the evaluation phase, the estimated population statistics are then used for normalization. Therefore, BN helps normalize the input and provide more meaningful interpretations.
5.2 Visualization of distillation module
The distillation module is not sufficient to help users understand the agent behaviors because there is too much redundant information in the SDT model. Therefore, we implement a visualization module that provides visual explanations efficiently. The visualization module offers the explanation information extracted from the distillation module with a graphical interface to human users. Specifically, the visualization module contains 1) a tree plot showing feature weights of each node and decision path in a tree-structured image and 2) a trajectory plot showing the trajectories of all aircraft in the structured airspace with precise explanations. A sample tree plot and trajectory plot is shown in Figure 2.
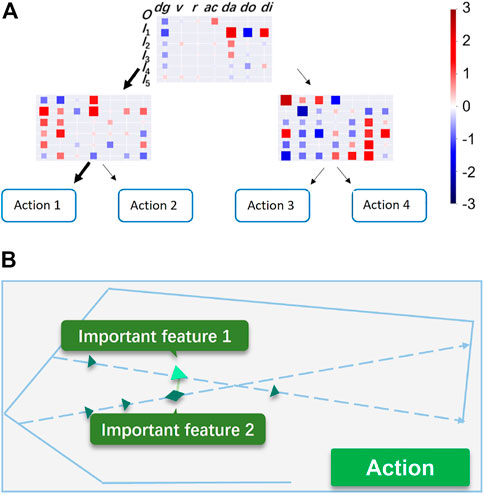
FIGURE 2. Sample tree plot and trajectory plot. (A) Sample tree plot, (B) Sample Trajectory Plot.
5.2.1 Tree plot
Each non-leaf node in SDT processes all input features with a one-layer network, so the feature weights give the information on how features influence the decision in that node. The feature weights and output values of nodes along the decision path can provide the behavior explanations on how the hierarchical decisions are made.
The tree plot illustrates feature weights of all SDT nodes in a tree-structured image. Feature weights of each node are visualized as a heatmap. The decision path is demonstrated with dense arrows connecting nodes along the decision path.
The explanation information is projected into the tree plot following these rules:
• Each feature weight is represented as a colored square in the heatmap.
• Feature weights of the same aircraft are drawn in the same row of heatmap.
• The higher the absolute value of weight is, the larger the size and the deeper the color is of the square. This also implies that the feature is more influential on the decision in the current layer.
• Red color and blue color represent positive and negative influences respectively.
5.2.2 Trajectory plot
While the tree plot gives a comprehensive explanation of behaviors, the trajectory plot only shows the most influential features for decision-making with both visual symbols and text. The simple structure of trajectory plot provides users with the most important information to understand the agent behaviors.
There are three main components in a trajectory plot: 1) all aircraft flying along routes, 2) highlighted influential factors, and 3) text boxes showing action information and ownship behavior explanations. Following rules are applied to demonstrate vital information in the trajectory plot:
• For each node in decision path, the feature with the largest absolute value will be selected as the important feature. For an SDT with depth m, there will be m important features in the trajectory plot. Their icons will be emphasised in the trajectory plot.
• Different symbols are used to emphasize features. For example, distance feature will be drawn as an green solid line.
5.3 Saliency module
LEG works as the saliency module to recover the gradient of a neural network by perturbing its input features (in our case, input states). In this work, we utilize two state variables, location and speed, for the purpose of offline explanations. The location of an aircraft is represented by its longitude given the assigned route1, and we assume that latitude of longitude is monotonic all along the route. Therefore, the gradient of the DRL model is recovered by perturbing the longitude and speed of each aircraft. We reduce the input state space in order to save computational costs. Since all the distance features can be computed from location, we preserve location as a high-level feature of aircraft. We also keep the speed feature as the dynamics information of aircraft. Additionally, the route identifier of each aircraft is a fixed value. Acceleration reflects the decision at the previous time step, and its absolute value is fixed. So route identifier and acceleration are not included in the reduced state space.
As mentioned above, the gradient of the DRL model is recovered by perturbing the longitude and speed of each aircraft, so we need to determine the perturbation structure, namely F in the definition of LEG. According to Brittain and Wei (2019) and Brittain et al. (2021), intruders of an ownship are selected based on intersections and conflicting routes. If the ownship or any intruders pass an intersection after perturbation, the dimension of the ownship’s state space may change. To avoid this change, we define the following rules of perturbation:
• The ownship must not pass an intersection after perturbation.
• Intruders on conflicting routes must not pass any intersection after perturbation.
• Aircraft must stay on their routes.
Considering the first two rules, we need the values of state features to be bounded, so we independently sample perturbations of each feature from uniform distributions. Since aircraft must stay on their routes, we are then able to compute latitudes from the perturbed longitudes.5.4 Visualization of saliency module
We visualize LEG with saliency maps that show the importance of locations and speeds to DRL policies. Additionally, position maps showing airspace and aircraft are used to pair with saliency maps. A sample saliency map and position map is shown in Figure 3.
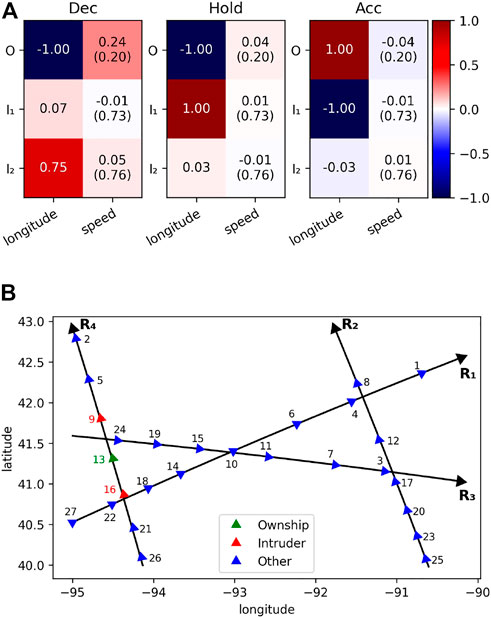
FIGURE 3. Sample saliency map and position map. (A) Sample saliency map, (B) Sample position map.
5.4.1 Saliency map
A saliency map consists of three heatmaps that illustrate the importance of locations and speeds to the three actions: acceleration, deceleration, and maintaining the current speed, respectively. Each heatmap follows similar rules to tree plots:
• The saliency score of each feature is displayed in a colored square.
• Saliency scores of the same aircraft are drawn in the same row.
• Normalized speed values are displayed alongside corresponding saliency scores.
• Higher absolute values of saliency scores imply more important features.
• The red and blue colors represent positive and negative influences respectively.
5.4.2 Position map
For online explanations, trajectory plots integrate the most influential features with the information on airspace and aircraft. Similarly, for offline explanations, we need a graphical interface showing airspace and aircraft to pair with the saliency map. We implement a position map for this purpose. While a trajectory plot shows one ownship and its intruders, a position map shows all aircraft in the current airspace to provide a more comprehensive view. Analysts may take different aircraft as the ownship based on their needs.
Position maps follow these rules:
• Each aircraft is represented as a triangle.
• Each aircraft is indexed by order of entering the airspace.
• Green color represents the ownship focused by the current analysis, red color represents intruders, and blue color represents other aircraft in the airspace.
5.5 Integration of modules
To provide explanations of agent behaviors for aircraft separation assurance, we integrate the distillation module, saliency module, and their visualization modules together. We illustrate the architecture of the integrated framework in Figure 1.
At each time step, one forward pass for input state s is executed by the SDTs in distillation module. The decision path p is generated and transited to the visualization module. Based on the feature weights and decision path, visualization module draws tree plots and trajectory plots to provide online explanations of agent behaviors.
At the same time, LEG in the saliency module recovers the estimates of the gradient of the DRL models γ by perturbing input state s. Based on γ, the visualization module draws saliency maps and position maps to provide offline explanations of agent behaviors.
6 Experiments
6.1 Settings
In this work, SESAME framework distills knowledge for aircraft separation assurance from two DRL models: D2MAV-A (Brittain et al., 2021) and D2MAV-NC (Brittain and Wei, 2019). This further increases the difficulty because now SESAME has to generalize well with different DRL models. The number of intruders in D2MAV-A is fixed to make the performances of two models comparable. All SDTs in the SESAME framework are trained with the transitions from the same amount of episodes. No other validation phase is implemented.
We use BlueSky (Hoekstra and Ellerbroek, 2016) as the air traffic simulator. In BlueSky, We evaluate the SESAME framework on two challenging case studies, A and B, with multiple intersections and high-density air traffic. Each of them is a dynamic simulation environment where aircraft enter the airspace stochastically. Figure 4 shows these two case studies.
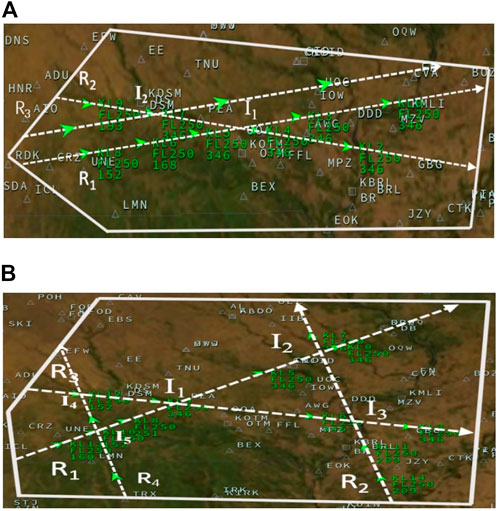
FIGURE 4. Case Studies for evaluation in the BlueSky air traffic simulator. Specifically, the green triangles, dotted lines, solid lines represent the aircraft, flight routes, and sector boundaries respectively. Symbol Ri and Ij stand for the ith route and jth intersection. The green numbers are the aircraft IDs. (A) Case study A, (B) Case study B.
6.2 Fidelity of soft decision trees
Since the SDTs in SESAME framework are considered as surrogate models for the DRL models, one important property is whether the predictions of SDT models match those of the original DRL models. Specifically, the fidelity score is defined as:
Here S is the set of all states resulting from evaluated transitions. YSDT and YDRL are the output actions of SDTs and original DRL models. Therefore, a higher fidelity score means that the behaviors of SDT and DRL models match better. The training batch size is 1,280. And transitions from 100 episodes are generated for evaluation.
The fidelity scores of different models for case A and case B are reported in Table 1 and Table 2. SDTs trained with D2MAV-A and D2MAV-NC are named as SDT-A and SDT-NC respectively. SDTs with a BN layer on the top of tree are named as SDT-BN. To give a comprehensive comparison, the traditional hard decision trees are also trained as baseline models and named as HDTs. The other baseline is random policy, whose fidelity score is 33.33%.
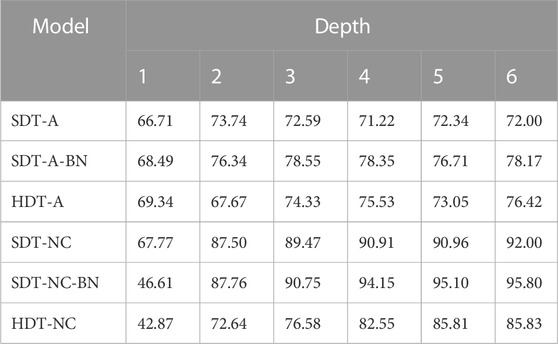
TABLE 1. Fidelity scores (%) in case A.
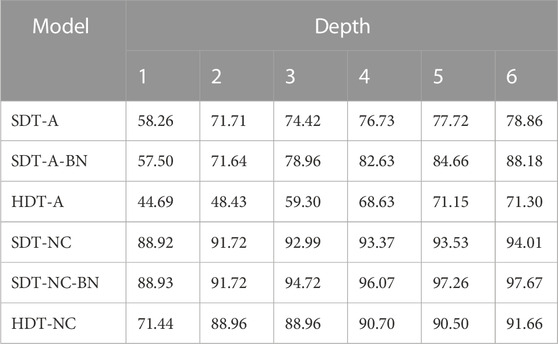
TABLE 2. Fidelity scores (%) in case B.
Comparing the fidelity scores from the same column, we see that the SDTs get higher fidelity scores in almost all cases than baseline models given the same model depth. This shows that our proposed SDT models work better than both hard decision tree models or random policy baselines in most cases except for some cases based on D2MAV-A and the outputs of proposed SDTs match those of DRL models. Based on results in the same row, we notice that a tree with more layers does not always perform better in terms of model fidelity given the same tree structure. The reason may be that the deeper models can have too many parameters to learn and the training process does not cover all of them perfectly. We also notice that our SESAME framework is not devoted to a specific DRL model because the SDTs gain high fidelity scores in both D2MAV-A and D2MAV-NC cases. We compare the performances of SDTs trained with the same DRL model and find that SDTs with a BN layer have higher scores. The results show that batch normalization helps improve the fidelity of SDTs. Fidelity has also been evaluated on other case studies in our previous paper (Guo and Wei (2022). The previous results are consistent with the analysis in this paper.
6.3 Tree plots for explanation
In this subsection, we demonstrate how the tree plot can be used to explain the agent behaviors since the feature weights of non-leaf nodes along the decision path offer the explanations on how each feature influences the agent decisions. The tree plot based on a transition in case A with model SDT-NC-BN is drawn in Figure 5.
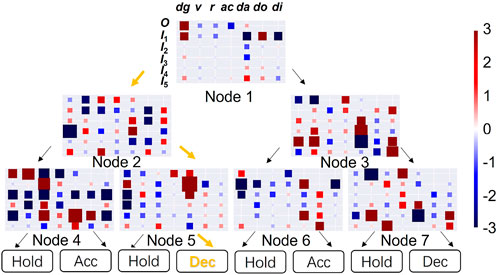
FIGURE 5. Tree plot using model SDT-NC-BN with depth 3 for case A in one step. The same state is used as input in all non-leaf nodes. The heatmaps are drawn based on the feature weights of all non-leaf nodes. Specifically, each feature is represented as a cell in the heatmap. The information of ownship O is in the first row. The information of five intruders I1, …, I5 is in the second to the sixth rows. Each column shows the values of the same feature for all six aircraft: distance to goal dg, current speed v, route identifier r, current acceleration ac, distance between ownship and the intruder da, distance between ownship and the intersection do, and distance between intruder and intersection di. The dense orange arrows represent the decision path. The leaf nodes show the prediction actions. Hold stands for maintaining the current speed. Acc stands for acceleration. Dec stands for deceleration.
Starting from the root node, we find that the node concentrates on the feature at cell (1, 1), which is the distance from ownship to the destination. This makes sense because the ultimate goal of the aircraft is to reach the destination and it should focus on the goal. When this feature value becomes larger, the SDT tends to traverse to its left child node.
In the second layer, we find that the left node focuses on the distance from the third intruder to the destination. This shows that our SDT models have comprehensive understanding of the case and do not only concentrate on the closest intruder. At the same time, the right node focuses on the distance between intruders and the ownship. This shows that the child nodes can concentrate on different features given the output of the parent node.
Along the decision path, the second non-leaf node on the third layer focuses on the distance between the closest intruder and the ownship. The distance between intruders and ownship is of great importance because it is very likely to have a collision if the distance is small. Among all intruders, the closest intruder is the most urgent. Finally, the deceleration action is selected.
6.4 Trajectory plots for explanation
We demonstrate how precise behavior explanations can be provided by trajectory plots in this subsection. Here a trajectory plot is drawn based on the SDT-NC-BN model for case A in Figure 6. Figures 5, 6 show the explanations for the same state.
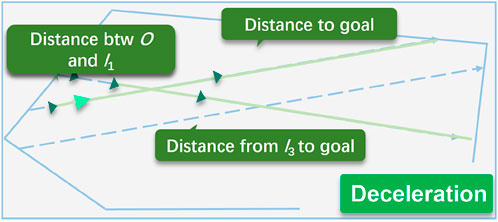
FIGURE 6. Trajectory plot using model SDT-NC-BN with depth 3 for case A. The light green ownship decelerates to avoid the potential collision at the near intersection. Three important features are emphasized in this case: 1) The distance from ownship O to goal, 2) the distance from the third intruder I3 to goal, and 3) the distance between ownship O and the closest intruder I1. The distance information is highlighted as orange dense lines. The explanations and the advisory speed are also provided in text.
The ownship near the intersection decides to decelerate in this case to avoid the potential collision at the near intersection. The important features are defined as the features having the highest absolute value in each node along the decision path. Here the important features are 1) distance from ownship to goal, 2) distance from the third intruder to goal, and 3) distance between ownship and the closest intruder. We have introduced the importance of these features in the previous subsection. Solid green lines are used to emphasize the distance information.
So compared with the tree plot, the trajectory plot only shows the most influential factors that explain the agent behaviors. By integrating the tree plot and trajectory plot, our proposed SESAME framework can provide precise explanation in trajectory plot and supplemental details in tree plot.
6.5 Saliency map and position map for explanation
While human operators need real-time and precise explanations, certification agencies are responsible for conducting more comprehensive analyses. In this subsection, we demonstrate how saliency maps and position maps can be used to provide offline explanations. The saliency map and position map based on a transition in case B with model D2MAV-A are drawn in Figures 7, 8 respectively. They show the explanations for the same state. In this subsection and the following subsection, Hold stands for maintaining the current speed, Acc stands for acceleration, and Dec stands for deceleration. The sample size used for computing LEG is 1,000, namely n = 1,000 in Eq. (1).
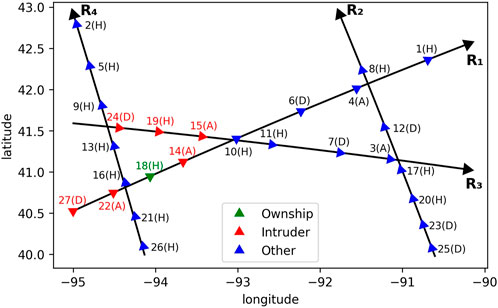
FIGURE 7. Position map using model D2MAV-A for case B in one transition. There are 27 aircraft in the airspace, each with an index indicating the order of entering the airspace. In parentheses are the speed advisories provided by the D2MAV-A model: H stands for maintaining the current speed; A stands for acceleration; D stands for deceleration. We focus on aircraft 18.
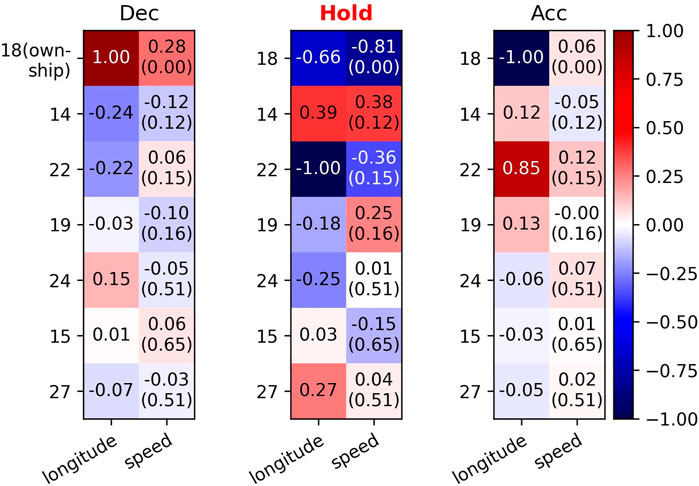
FIGURE 8. Saliency map using normalized LEG values for the decision of aircraft 18. The intruders are sorted by distance to the ownship in ascending order: 14, 22, 19, 24, 15, 27. Larger absolute values imply more important features, and the sign implies the direction of influence. In parentheses are min-max normalized speed values.
First, we focus on the most important location (i.e., longitude) features2, namely the locations of aircraft 18 and aircraft 22. Aircraft 18s location has a negative influence on Acc. So if the longitude value of aircraft 18 decreases, which means that it moves closer to aircraft 22, the speed advisory for it will be more likely to be acceleration in order for maintaining a safe distance. On the contrary, aircraft 22s location has a positive influence on Acc. So if the longitude value of aircraft 22 increases, which also means that the distance between aircraft 22 and aircraft 18 becomes closer, the speed advisory for aircraft 18 will be more likely to be acceleration. Therefore, we can conclude from the above consistent observations that one major cause of the Hold decision is the safe distance between aircraft 18 and aircraft 22.
Second, we focus on aircraft 14, the closest intruder to aircraft 18. Despite being closest to the ownship, the absolute values of its saliency scores are relatively small. A possible reason is that the speed of ownship is lower than those of all its intruders. In this circumstance, aircraft behind the ownship (aircraft 22) should be given more attention than those ahead (aircraft 14). We also notice that the speed advisory for aircraft 14 is acceleration, which will further assure the safe separation. This may imply a certain cooperation scheme that the D2MAV-A model learns to make reasonable decisions.
6.6 Decision patterns of deep reinforcement learning models
Apart from the critical state features for the decision at each time step, analysts from certification agencies also need to determine whether or not the speed advisories follow any patterns given specific aircraft locations in the airspace. In this subsection, we study two kinds of aircraft’s relative locations and discover some similar decisions and corresponding explanations.
First, we focus on three adjacent aircraft on the same route, and the ownship is in the middle. In the transition shown in Figure 7, aircraft 18, aircraft 14 and aircraft 22 are adjacent and all located on route R1. We still take aircraft 18 as the ownship. According to the previous discussion, if the distance between aircraft 18 and aircraft 22 decreases, the speed advisory for aircraft 18 will be more likely to be acceleration. On the contrary, we can conclude from Figure 8 that the speed advisory will be more likely to be deceleration if the distance between aircraft 18 and aircraft 14 decreases. Furthermore, the location of aircraft 14 has more influence on Dec than Acc, while the location of aircraft 22 has more influence on Acc than Dec. The difference shows that the D2MAV-A model is able to encode the order information for the purpose of attributing different importance to the intruders behind and in front of the ownship respectively.
The same conclusions can be drawn from aircraft 13 (ownship), aircraft 16 and aircraft 9. The saliency map shown in Figure 9 suggests that the speed advisory tends to acceleration when the ownship becomes closer to the intruder behind it (aircraft 16) and tends to deceleration when the ownship becomes closer to the intruder in front of it (aircraft 9). Additionally, the location of aircraft 16 has substantially more influence on Acc than Dec, while the location of aircraft 9 has substantially more influence on Dec than Acc. These consistent results provide insights into the decisions of aircraft that are on the same route.
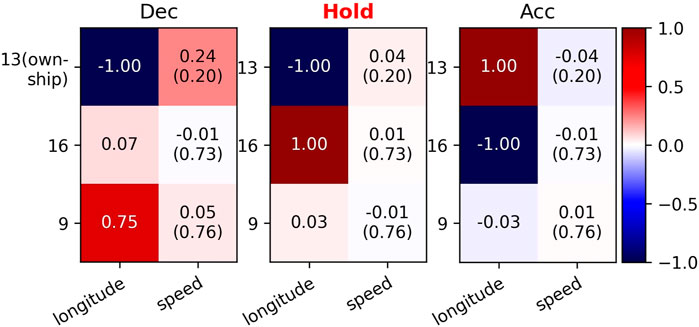
FIGURE 9. Saliency map using normalized LEG values for the decision of aircraft 13. The intruders are sorted by distance to the ownship in ascending order: 16, 9. Larger absolute values imply more important features, and the sign implies the direction of influence. In parentheses are min-max normalized speed values.
Second, we focus on two aircraft that are on different routes and about to pass the same intersection. One of them is closer to the intersection than the other. Aircraft (22, 21), Aircraft (3, 17), Aircraft (4, 12), and Aircraft (15, 14) are four examples. In the first three pairs, aircraft closer to the intersection (22, 3, 4) decide to accelerate, while others decide to maintain the current speed or decelerate. These decisions show the cooperation between two aircraft that the closer one passes the intersection first. However, aircraft 15 and aircraft 14 both select the acceleration action. The reason why aircraft 14 does not choose to maintain the current speed or decelerate is that its surrounding air traffic situation is more complex. Figure 10 shows that besides aircraft 15, aircraft 18 and aircraft 19 are also highly important to aircraft 14s decision. Therefore, aircraft 14 chooses to accelerate in order to keep ahead of aircraft 18 and aircraft 19, which again suggests the ability of the D2MAV-A model to encode order information.
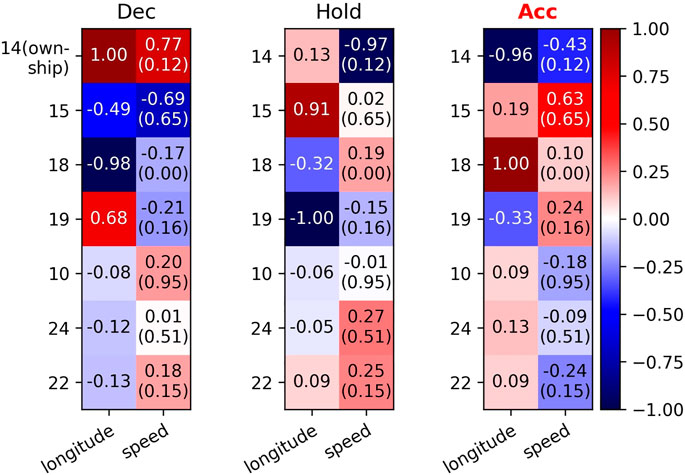
FIGURE 10. Saliency map using normalized LEG values for the decision of aircraft 14. The intruders are sorted by distance to the ownship in ascending order: 15, 18, 19, 10, 24, 22. Larger absolute values imply more important features, and the sign implies the direction of influence. In parentheses are min-max normalized speed values.
7 Conclusion
In this paper, we propose a novel framework to explain DRL-based aircraft separation assurance models. Our framework provides both online explanations to human operators and offline explanations to certification agencies. Through numerical experiments in the BlueSky air traffic simulator, our results show that the proposed framework is capture crucial factors in the decisions of DRL models. In addition, we explain two specific patterns that DRL policies follow using the proposed framework, which suggests that the decision-making processes of DRL models can be more predictable and trustworthy. The promising results encourage us to further explore the effectiveness of the framework and its extensions for other safety-critical applications in the future.
Data availability statement
The original contributions presented in the study are included in the article/supplementary material, further inquiries can be directed to the corresponding author.
Author contributions
WG and YZ implemented the algorithms and conducted experiments. The writing of the manuscript was done by WG and YZ. PW led the project and helped revise manuscript.
Funding
This project is supported by the NASA Grant 80NSSC21M0087 under the NASA System-Wide Safety (SWS) program.
Acknowledgments
This work is an extension of a previous work published in WG and PW, Explainable Deep Reinforcement Learning for Aircraft Separation Assurance. 2022 IEEE/AIAA 41st Digital Avionics Systems Conference (DASC).
Conflict of interest
The authors declare that the research was conducted in the absence of any commercial or financial relationships that could be construed as a potential conflict of interest.
Publisher’s note
All claims expressed in this article are solely those of the authors and do not necessarily represent those of their affiliated organizations, or those of the publisher, the editors and the reviewers. Any product that may be evaluated in this article, or claim that may be made by its manufacturer, is not guaranteed or endorsed by the publisher.
Footnotes
1The location of an aircraft can also be represented by its latitude
2When we analyze the change of one feature, other features are assumed to be fixed.
References
Ancona, M., Ceolini, E., Öztireli, C., and Gross, M. (2018). “Towards better understanding of gradient-based attribution methods for deep neural networks,” in International Conference on Learning Representations, Vancouver, BC, Canada, April 30–May 3, 2018.
Brittain, M., and Wei, P. (2019). “Autonomous separation assurance in an high-density en route sector: A deep multi-agent reinforcement learning approach,” in 2019 IEEE Intelligent Transportation Systems Conference (ITSC), Auckland, New Zealand, October 27–30, 2019 (IEEE), 3256–3262.
Brittain, M. W., and Wei, P. (2021). “One to any: Distributed conflict resolution with deep multi-agent reinforcement learning and long short-term memory,” in AIAA Scitech 2021 Forum. 1952, January 11–15 & 19–21, 2021. Virtual event.
Brittain, M. W., Yang, X., and Wei, P. (2021). Autonomous separation assurance with deep multi-agent reinforcement learning. J. Aerosp. Inf. Syst. 18, 890–905. doi:10.2514/1.i010973
Cideron, G., Seurin, M., Strub, F., and Pietquin, O. (2019). “Self-educated language agent with hindsight experience replay for instruction following,” in Visually Grounded Interaction and Language (ViGIL), NeurIPS 2019 Workshop, Vancouver, Canada, December 13, 2019.
Coppens, Y., Efthymiadis, K., Lenaerts, T., Nowé, A., Miller, T., Weber, R., et al. (2019). “Distilling deep reinforcement learning policies in soft decision trees,” in Proceedings of the IJCAI 2019 workshop on explainable artificial intelligence, Macao, China, August 10–16, 2019, 1–6.
Dahlin, N., Kalagarla, K. C., Naik, N., Jain, R., and Nuzzo, P. (2020). Designing interpretable approximations to deep reinforcement learning with soft decision trees. arXiv preprint arXiv:2010.14785.
Ding, Z., Hernandez-Leal, P., Ding, G. W., Li, C., and Huang, R. (2020). Cdt: Cascading decision trees for explainable reinforcement learning. arXiv preprint arXiv:2011.07553.
Frosst, N., and Hinton, G. (2017). Distilling a neural network into a soft decision tree. arXiv preprint arXiv:1711.09784.
Ghosh, S., Laguna, S., Lim, S. H., Wynter, L., and Poonawala, H. (2021). “A deep ensemble method for multi-agent reinforcement learning: A case study on air traffic control,”. (virtual) in Proceedings of the Thirty-First International Conference on Automated Planning and Scheduling, Guangzhou, China, August 2-13, 2021 (AAAI Press), 468–476. ICAPS 2021.
Greydanus, S., Koul, A., Dodge, J., and Fern, A. (2018). “Visualizing and understanding atari agents,” in International Conference on Machine Learning, Stockholm, Sweden, July 10–15, 2018 (PMLR), 1792–1801.
Guo, W., Brittain, M., and Wei, P. (2021). “Safety enhancement for deep reinforcement learning in autonomous separation assurance,” in 2021 IEEE International Intelligent Transportation Systems Conference (ITSC), Indianapolis, IN, United States, September 19–22, 2021, 348–354. doi:10.1109/ITSC48978.2021.9564466
Guo, W., and Wei, P. (2022). “Explainable deep reinforcement learning for aircraft separation assurance,” in 2022 IEEE/AIAA 41st Digital Avionics Systems Conference (DASC), Portsmouth, VA, United States, September 18–22, 2022 (IEEE), 1–10.
Gupta, P., Puri, N., Verma, S., Kayastha, D., Deshmukh, S., Krishnamurthy, B., et al. (2020). “Explain your move: understanding agent actions using specific and relevant feature attribution,” in International Conference on Learning Representations (ICLR), Addis Ababa, Ethiopia, April 26–30, 2020.
Haksar, R. N., and Schwager, M. (2018). “Distributed deep reinforcement learning for fighting forest fires with a network of aerial robots,” in 2018 IEEE/RSJ International Conference on Intelligent Robots and Systems (IROS), Madrid, Spain, October 1–5, 2018 (IEEE), 1067–1074.
Hoekstra, J. M., and Ellerbroek, J. (2016). “Bluesky ATC simulator project: an open data and open source approach,” in Proceedings of the 7th International Conference on Research in Air Transportation (ICRAT), Philadelphia, PA, June 20–24, 2016 (FAA/Eurocontrol USA/Europe), 132.
Isufaj, R., Aranega Sebastia, D., and Piera, M. A. (2021). “Towards conflict resolution with deep multi-agent reinforcement learning,” in Proceedings of the 14th USA/Europe Air Traffic Management Research and Development Seminar (ATM2021), New Orleans, LA, USA, September 20–23, 2021, 20–24.
Iyer, R., Li, Y., Li, H., Lewis, M., Sundar, R., and Sycara, K. (2018). “Transparency and explanation in deep reinforcement learning neural networks,” in Proceedings of the 2018 AAAI/ACM Conference on AI, New Orleans, LA, United States, February 02–03, 2018, 144–150. Ethics, and Society.
Jarrett, D., Hüyük, A., and Van Der Schaar, M. (2021). “Inverse decision modeling: Learning interpretable representations of behavior,” in International Conference on Machine Learning (PMLR), 4755–4771.
Jonschkowski, R., and Brock, O. (2015). Learning state representations with robotic priors. Auton. Robots 39, 407–428. doi:10.1007/s10514-015-9459-7
Karakovskiy, S., and Togelius, J. (2012). The mario ai benchmark and competitions. IEEE Trans. Comput. Intell. AI Games 4, 55–67. doi:10.1109/tciaig.2012.2188528
Kim, J., Moon, S., Rohrbach, A., Darrell, T., and Canny, J. (2020). “Advisable learning for self-driving vehicles by internalizing observation-to-action rules,” in Proceedings of the IEEE/CVF Conference on Computer Vision and Pattern Recognition, Seattle, WA, United States, June 13–19, 2020, 9661–9670.
Liu, G., Schulte, O., Zhu, W., and Li, Q. (2018). “Toward interpretable deep reinforcement learning with linear model u-trees,” in Joint European Conference on Machine Learning and Knowledge Discovery in Databases, Dublin, Ireland, September 10–14, 2018 (Springer), 414–429.
Luo, S., Barut, E., and Jin, F. (2021). “Statistically consistent saliency estimation,” in Proceedings of the IEEE/CVF International Conference on Computer Vision (ICCV), Montreal, QC, Canada, October 10–17, 2021, 745–753.
Mnih, V., Kavukcuoglu, K., Silver, D., Graves, A., Antonoglou, I., Wierstra, D., et al. (2013). “Playing atari with deep reinforcement learning,” in NIPS Deep Learning Workshop.
Ribeiro, M., Ellerbroek, J., and Hoekstra, J. (2020). “Determining optimal conflict avoidance manoeuvres at high densities with reinforcement learning,” in Proceedings of the Tenth SESAR Innovation Days, Virtual Conference, December 7–10, 2020, 7–10. Virtual Conference.
Schulman, J., Wolski, F., Dhariwal, P., Radford, A., and Klimov, O. (2017). Proximal policy optimization algorithms. arXiv preprint arXiv:1707.06347.
Selvaraju, R. R., Cogswell, M., Das, A., Vedantam, R., Parikh, D., and Batra, D. (2017). “Grad-cam: Visual explanations from deep networks via gradient-based localization,” in Proceedings of the IEEE international conference on computer vision, Venice, Italy, October 22–29, 2017, 618–626.
Silva, A., Gombolay, M., Killian, T., Jimenez, I., and Son, S.-H. (2020). “Optimization methods for interpretable differentiable decision trees applied to reinforcement learning,” in International conference on artificial intelligence and statistics, Palermo, Sicily, Italy (Online), August 26–28, 2020 (PMLR), 1855–1865.
Simonyan, K., Vedaldi, A., and Zisserman, A. (2013). Deep inside convolutional networks: Visualising image classification models and saliency maps. arXiv preprint arXiv:1312.6034.
Smilkov, D., Thorat, N., Kim, B., Viégas, F., and Wattenberg, M. (2017). Smoothgrad: removing noise by adding noise. arXiv preprint arXiv:1706.03825.
Sundararajan, M., Taly, A., and Yan, Q. (2017). “Axiomatic attribution for deep networks,” in International conference on machine learning, Sydney, NSW, Australia, August 6–11, 2017 (PMLR), 3319–3328.
Van Hasselt, H., Guez, A., and Silver, D. (2016). “Deep reinforcement learning with double q-learning,” in Proceedings of the AAAI conference on artificial intelligence, Phoenix, AZ, United States, February 12–17, 2016.
Verma, A., Murali, V., Singh, R., Kohli, P., and Chaudhuri, S. (2018). “Programmatically interpretable reinforcement learning,” in International Conference on Machine Learning, Stockholm, Sweden, July 10–15, 2018 (PMLR), 5045–5054.
Wang, Z., Li, H., Wang, J., and Shen, F. (2019). Deep reinforcement learning based conflict detection and resolution in air traffic control. IET Intell. Transp. Syst. 13, 1041–1047. doi:10.1049/iet-its.2018.5357
Wang, Z., Schaul, T., Hessel, M., Hasselt, H., Lanctot, M., and Freitas, N. (2016). “Dueling network architectures for deep reinforcement learning,” in International conference on machine learning (PMLR), 1995–2003.
Wulfe, B. (2017). Uav collision avoidance policy optimization with deep reinforcement learning. arXiv preprint paper [Dataset].
Zahavy, T., Ben-Zrihem, N., and Mannor, S. (2016). “Graying the black box: Understanding dqns,” in International conference on machine learning, New York City, NY, United States, June 19–24, 2016 (PMLR), 1899–1908.
Keywords: multi-agent deep reinforcement learning, soft decision tree, saliency method, safety-critical system, aircraft separation assurance, explainable AI
Citation: Guo W, Zhou Y and Wei P (2022) Exploring online and offline explainability in deep reinforcement learning for aircraft separation assurance. Front. Aerosp. Eng. 1:1071793. doi: 10.3389/fpace.2022.1071793
Received: 16 October 2022; Accepted: 24 November 2022;
Published: 13 December 2022.
Edited by:
Li Weigang, University of Brasilia, BrazilReviewed by:
Donald Sofge, United States Naval Research Laboratory, United StatesJean-Loup Farges, Office National d’Études et de Recherches Aérospatiales, Palaiseau, France
Copyright © 2022 Guo, Zhou and Wei. This is an open-access article distributed under the terms of the Creative Commons Attribution License (CC BY). The use, distribution or reproduction in other forums is permitted, provided the original author(s) and the copyright owner(s) are credited and that the original publication in this journal is cited, in accordance with accepted academic practice. No use, distribution or reproduction is permitted which does not comply with these terms.
*Correspondence: Yifei Zhou, eXpob3U4N0Bnd3UuZWR1
†These authors have contributed equally to this work