 Meiyun Cao
 Gennadi Saiko
 Alexandre Douplik
94% of researchers rate our articles as excellent or good
Learn more about the work of our research integrity team to safeguard the quality of each article we publish.
Find out more
ORIGINAL RESEARCH article
Adv. Opt. Technol., 07 March 2025
Sec. Optical Imaging
Volume 14 - 2025 | https://doi.org/10.3389/aot.2025.1536415
Introduction: Several population-based clinical studies suggest that increased Pulse Wave Velocity (PWV) is highly associated with increased cardiovascular disease (CVD) mortality, which is one of the leading causes of death worldwide. Current methods for CVD detection are invasive, expensive, and contact methods, which are not friendly for skin-sensitive patients.
Methods: In this study, we investigated the use of remote photoplethysmography (rPPG) on the neck region using a high-speed camera (2000 frames per second (fps)) to resolve the drawbacks of CVD detection and overcome the limitations of current PWV measurement techniques. Pearson correlation and cross-correlation were used for signal processing and generating the projection map of potential major vessels. A reference signal is selected for the region of interest based on peak value and modulation depth variation. The signal distance and pulse transit time (PPT) between the local and reference signals were calculated using the cross-correlation method and then fitted into a linear regression model for PWV calculation.
Results: The results revealed areas on the neck that positively and negatively correlated with the selected reference signals, potentially representing the distribution of the main neck vessels - carotid artery and jugular vein- and, consequently, the upstream and downstream blood circulation directions.
Discussion: This research implies the feasibility of touchless estimation of local PWV using a high-speed camera, expanding the potential applications of remote photoplethysmography in aiding the diagnosis of CVD.
Cardiovascular disease (CVD) is one of the leading causes of death worldwide (Gaidai et al., 2023). It encompasses a range of conditions that affect the heart and blood vessels, including coronary artery disease (Tang et al., 2020), cerebrovascular disease (Sobieszczyk and Beckman, 2006), aortic atherosclerosis (Burton et al., 2023; Ahn, 2013; Barbagini et al., 2022), and peripheral artery disease (Criqui et al., 2008). CVD represents a significant global health challenge, marked by its increasing prevalence and substantial impact on mortality, disability, and economic costs (Amini et al., 2021). Current diagnostic tests play a significant role but have limitations in predicting future cardiovascular risk. Early detection based on multi-parameters of the pathological condition is the key to patient survival (Wu et al., 2004; Umaña Perea et al., 2015). Several studies have focused on identifying biomarkers for predicting CVD, such as blood pressure, arterial stiffness, and pulse wave velocity (PWV) (Fagundes et al., 2020).
PWV, the speed of the pressure wave originating from the heartbeat, is a critical indicator of arterial wall elasticity (Mitchell et al., 2010). PWV increases with arterial stiffness increases, making it a valuable tool in assessing vascular health. Numerous studies have identified PWV as one of the most reliable measures of arterial stiffness, linking it directly to cardiovascular risk. Its role as a predictor of CVD has gained recognition, with various measures of arterial stiffness and wave reflection being proposed as strong markers for assessing long-term cardiovascular risk (Mitchell et al., 2010; Tillin et al., 2007). In addition, cardiovascular risk factors, including diabetes mellitus, hyperlipidemia, smoking, and increased body mass index, contribute to arterial stiffness and elevated PWV (Nyhan et al., 2011; Yamashina et al., 2003; Kim, 2006; Spronck et al., 2021). Consequently, PWV has been established as a reliable prognostic marker for cardiovascular morbidity and mortality (Ghosh et al., 2019; Lim and Lip, 2008).
PWV can be measured noninvasively by several techniques such as echo-tracking Ultrasound (Tang et al., 2020; Zhang and Greenleaf, 2006), Doppler Ultrasound (Eriksson et al., 2002; Jiang et al., 2008), Ultrasound elastography, Magnetic Resonance Imaging (MRI) (van der Meer et al., 2007), and Contact Photoplethysmography (cPPG) (Byfield et al., 2022; Nabeel et al., 2017).
Ultrasound with ECG synchronization has been used widely for PWV verification. As pressure waves propagate through the vessels, the ultrasound captures the dynamic changes in arterial diameter, such as the heartbeat. At the same time, ECG signals provide a timing reference to determine specific phases of the cardiac cycle. Synchronizing ultrasound measurements with ECG ensures precise timing when recording arterial diameter changes at two different points. The time delay between these waveforms can be used to calculate parameters like PWV (Zhang and Greenleaf, 2006). However, this method relies heavily on the quality of both ultrasound and ECG signals, making it susceptible to errors from noise or artifacts. Moreover, this operator-dependent procedure requires significant skill for accurate probe placement and alignment. Challenges arise in imaging small or deeply situated vessels due to limited ultrasound resolution. Additionally, the procedure is time-intensive, and patient movement can compromise measurement accuracy, making it less practical in high-volume settings (Counseller and Aboelkassem, 2023; Nurmohamed et al., 2024).
Unlike the traditional 2D ultrasound that uses the echo-tracker that follows the movement of arterial walls, Doppler Ultrasound tracks the displacement of arterial walls caused by the propagation of the pulse wave. It does not require synchronizing ECG devices. Instead, it measures multiple positions almost simultaneously to track arterial wall motion along the artery and detect the short delays between arrival times at adjacent segments (Eriksson et al., 2002). However, with this Doppler Ultrasound method, in addition to being a contact method and requiring specialized operators, it also requires precise measurement of the distance and exact time delay between adjacent segments, and the sensitivity can be greatly affected due to arterial wall motion artifacts (Vallée et al., 2020; Scarsini et al., 2023).
Ultrasound elastography employs ultrafast ultrasound pulses to indirectly measure arterial stiffness by assessing the arterial wall’s mechanical properties (Schaafs et al., 2019; Marais et al., 2019). However, contact methods and complex post-processing algorithms are needed to relate arterial stiffness to PWV, and it has limited availability of the devices (Schaafs et al., 2019).
As a non-invasive, non-contact, and highly accurate method for measuring artificial stiffness and cardiovascular health, MRI measures blood flow velocity changes along arteries by encoding flow-related phase shifts into the MR signal. By capturing time-resolved images of blood flow at two arterial locations, the transit time of the pulse wave can be calculated, allowing PWV to be determined as the distance between measurement sites divided by the transit time. However, the cost of MRI is high, and it has limited accessibility to the public as it is used in specialized centers. Moreover, scanning is time-intensive, requiring patient cooperation to minimize motion artifacts. Furthermore, its resolution may be less effective for assessing small or deeply located arteries than other modalities (El Khouli et al., 2009; Bryant et al., 2012).
cPPG uses light to detect changes in blood volume in the microvascular bed of tissue. It can be synchronized with ECG to enhance the accuracy of PWV measurements, especially in peripheral arteries (Mejía-Mejía et al., 2021; Charlton and Marozas, 2021). cPPG is a contact-based optical technique using an optical sensor placed on the skin that operates on the principle of light interaction with biological tissue, where the amount of absorbed or reflected light varies based on the blood flow dynamics. This method estimates the time delay between arterial pulse waveforms recorded at two points along an artery. It calculates PWV by dividing the distance between these two-point pixels by the time delay of their corresponding signals. This can result in great variations of the measures PWV at a local area with different point pixel pairs. Moreover, the pressure exerted by the contact sensor can alter arterial behavior, affecting the reliability of PWV measurements.
As a result, the non-contact, robust, and easy-to-use Remote Photoplethysmography (rPPG) has emerged as a superior alternative (Moco et al., 2018; Zieff et al., 2023). rPPG is a technique that extends reflection mode photoplethysmography (PPG) to a contactless mode using a camera placed at a distance from the patient. This approach eliminates the need for direct skin contact, simplifies clinical workflow, and benefits patients with sensitive or damaged skin, avoiding applying any pressure on the blood vessels and affecting blood circulation. Unlike cPPG, rPPG can simultaneously collect signals from larger skin areas, enabling mapping analysis of spatiotemporal characteristics, including PWV, and creating a tissue health index map (Burton et al., 2023; Cao et al., 2023). Recent studies show that rPPG can measure the local or average PWV across the body (Nakano et al., 2018; Moco et al., 2018). These studies have demonstrated imaging of pulse transit time across the head and in the inferior and superior limbs. However, the estimation of PWV in more localized peripheral vessels, such as the carotid artery and jugular vein, remains relatively unexplored.
This study aimed to study the PWV of the vessels on the neck, where the carotid artery and jugular vein are located close to the skin’s surface. As such, this area is promising for clinical use and monitoring due to the accessibility of these vessels. A color camera is used for the rPPG signals capturing from neck vessels using RGB channels Lapitan and Andrey, 2019; Burton et al., 2023).
According to Rabben et al. (Rabben et al., 2004), the local carotid artery PWV for healthy subjects ranges from 4 m/s to 9 m/s. To capture the signal of a pulse wave traveling at 4 m/s between two points 1 cm apart, a minimum frame rate of 400 fps is required. Therefore, the camera’s frame rate should be greater than 400 fps, which is essential to achieve the goal in this study.
This study extends the signal processing approach developed in the previous work (Cao et al., 2023) to predict the distribution of certain major vessels around the neck, which can be a practical alternative to traditional methods. The novelty of this work is the use of the quality indicators for signal selection and local reference signals to identify the major vessels on the neck and to calculate the local PWV for each of them. This work not only consolidates the findings of our previous work but also paves the way for the use of rPPG for local PWV measurement and potentially as a tool for early CVD screening, detection and diagnosis.
The experimental setup for this study can be referred to in an earlier publication (Cao et al., 2023). As Figure 1 shows, the subject sits straight with back and head support, facing one of the lights. Their chin tilted for approximately 45° to fully expose the left neck. The distance between the left neck and the camera is about 85 ± 2.5 cm due to the variation in body thickness of different subjects, and the area of the neck detected will be around 10 ± 2 cm and 19 ± 2 cm for width and height, respectively. To ensure a uniform light distribution in the neck area, this study utilizes two 232 × 200 mm light panels with 600 LEDs per panel (NEEWER LED Video Light, Shenzhen, China), a fast-speed Mikrotron EoSense 1.1CPX2 camera (Mikrotron, Unterschleißheim, Germany), and a Canon EF 50 mm f/2.5 STM lens (Canon, Tokyo, Japan). The camera was placed on a 60-inch lightweight tripod (Amazone Basis, Seattle, United States). Based on the literature, the green, blue, and red light is well balanced at the light temperature of 4600K. To avoid underexposure under a high-speed camera, the light intensity used was 100%. The LED intensity and the RGB quantum efficiency data are plotted in Figure 2. The imaging frequency used in this study is 2000 frames per second (fps). This camera has a maximum frequency offset of 15 parts per million. A 10s video is collected for each subject with a frame size of 512 × 312 pixels using GR8 format (Cao et al., 2023). This study had 10 fair-skin participants between 18 and 60 years old with no known cardiovascular-related diseases. This study was approved by the Toronto Metropolitan University Research Ethical Board.
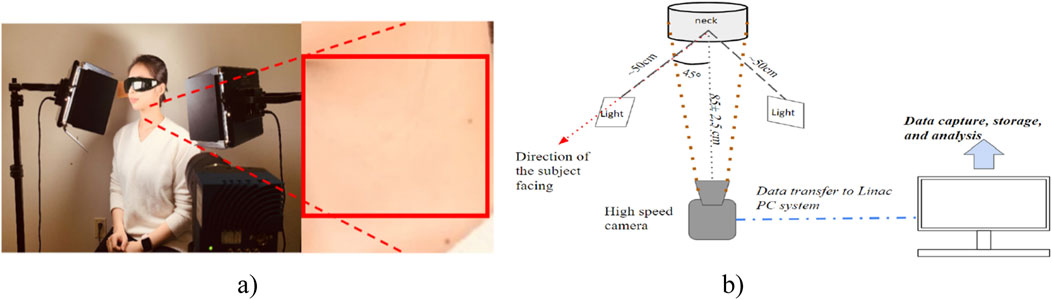
Figure 1. Experimental setup. (A) The physical position of the subject and ROI were selected from the left neck for video signal analysis. (B) Schematic of the rPPG imaging system (Cao et al., 2023).
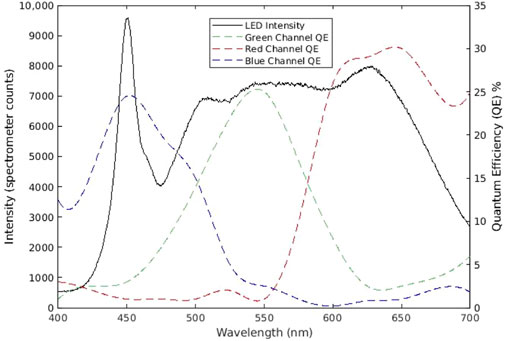
Figure 2. LED light intensity and the quantum efficiency of the camera sensor. The light intensity was measured by Aurora 4000 Spectrometer (Changchun New Industries Optoelectronics Technology, Changchun, China), and the camera’s quantum efficiency data was obtained from the manufacturer) (Cao et al., 2023).
The signal processing pipeline is illustrated in Figure 3. It consists of two major steps: pre-processing and signal processing. The data acquisition and pre-signal processing steps are described in our previous paper, where the effectiveness of signal filtering and frequency domain selection in producing clear pulse signals are validated (Cao et al., 2023).
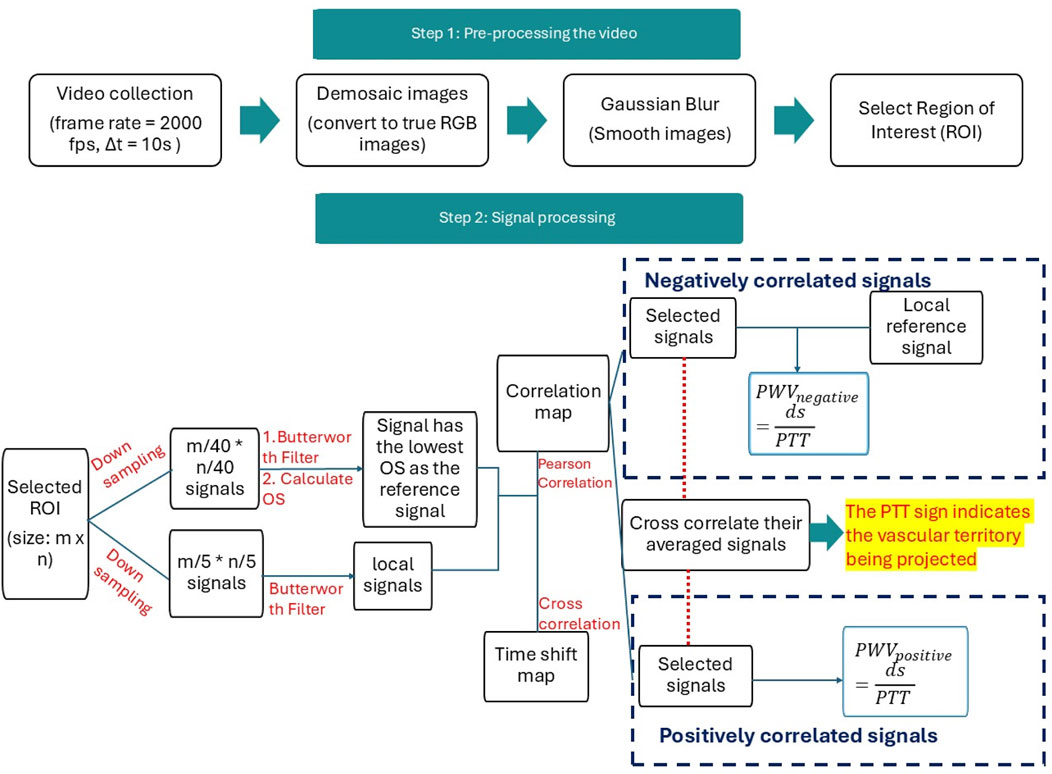
Figure 3. Flowchart for data processing. There are two steps for data processing. Step 1 pre-processing returns the images into true color images with the Demosaic method in MATLAB and denoises the image using the standard Gaussian blurring method in MATLAB. ROI was selected in step 1. Step 2 focuses on signal processing for the reference signal and local signals.
During the data acquisition phase, videos in the “.npy” format were transformed into a 4D dataset encompassing frame height, width, color channels, and time. Utilizing MATLAB 2022b, the images were first decoded into accurate RGB color images using MATLAB’s “demosaic” function with the “grbg” Bayer pattern. Subsequently, a Gaussian blur filter was applied to all images with a 5 × 5 pixel kernel and a standard deviation of 0.5 to diminish minor pixel noise.
All raw images were denoised in the pre-processing stage using the Gaussian blur filter. Gaussian blur is used to reduce the noise using a Gaussian function to smoothen the image (Misra and Wu, 2020). It filters the high-amplitude map with the Gaussian kernel that preserves the low spatial frequency and reduces noise and negligible details in an image. Moreover, a region of interest (ROI) was manually selected for each subject in the central neck region, avoiding hairy areas for males.
In the signal processing stage, the green channel was used for PPG signal analysis due to its stronger signal strength than the blue channel and greater stability than the red channel (Tuttolomondo et al., 2010). These advantages may be attributed to the strong blood absorption in the green range of the spectrum and the fact that half of the Bayer pattern camera sensor consists of green channels, enhancing its intensity and sensitivity (Tuttolomondo et al., 2010). Additionally, green light penetrates deeper into the skin than blue light, where blood vessels are more evenly distributed, which may contribute to a larger modulation depth (Giannarelli et al., 2012) and resistance to motion artifacts (Chen et al., 2017). The Butterworth filter, coupled with MATLAB’s “findpeak” method, facilitates an objective method of assessing signal quality and ensuring that all crests and troughs are accurately located, which can be referred to in a previous publication (Cao et al., 2023). We apply MATLAB’s second-order Butterworth filter within a 0.5–3.5 Hz frequency range to keep the subtle variations of the rPPG waveform, followed by “filtfilt” to mitigate phase delay. Compared to other MATLAB methods, this approach is superior in retaining the signal’s pulsatility while attenuating high-frequency noise and minimizing amplitude distortion.
According to our experimental setup, for a PWV at 10 m/s (van der Vliet et al., 2020), a minimum detectable resolution for every 1 cm physically is every 40 pixels on the image. MATLAB’s “find peaks” function was used to select signal peaks, accommodating pulse rates between 50 and 110 beats per minute (bpm). Reference signal selection is based on the periodicity of the PPG signal, which should match the cardiac cycle for reliable analysis (Kim et al., 2011), ensuring waveform peaks are consistent for reliable signal analysis. In this case, the reference signal is chosen from the averaged signals of 40 × 40-pixel clusters within the ROI. The signal’s quality is gauged by the OS index, which integrates the peak amplitude variation (
After the reference signal is determined, the signals in ROI are also downsampled by averaging every 5 × 5 pixels to improve signal quality. This signal is referred to as a local signal. Pearson correlation was applied between all local and reference signals to identify the positively and negatively correlated areas. The Pearson correlation between the local signal
where
While the reference signal effectively represents signals in the positively correlated area due to their similarity, it may not represent the phase characteristics of the signals in the negatively correlated area well. Additionally, these two distinct regions in the correlation map may correspond to different vascular structures. To better understand the negatively correlated region, a secondary reference signal was selected based on the smallest correlation coefficient within the negative region of the correlation map. This approach ensures that the phase characteristics of the most representative signals in both the positively and negatively correlated regions are identified. Furthermore, the reference signal for the negatively correlated area will be utilized in the PWV calculation specific to this region.
In the positive and negatively correlated areas, we selected the highly correlated and low-correlated areas based on the top and bottom 10% of correlation scores, which were also used as signal quality and quantity selection methods for all subjects in this study. The pulse transit time (PTT) is measured as the time the pressure wave takes to travel from the heart to peripheral vessels (Pitson et al., 1995). The selected signals from positively and negatively correlated areas were averaged to determine the projected vessels. Cross-correlation was then applied to these averaged signals to analyze their temporal relationship. A positive PTT sign from the cross-correlation indicates that the positively correlated area is projecting the carotid artery. This step ensures the identification of vascular projections accurately by leveraging the correlation characteristics between signal regions.
The selected top and bottom 10% of signals are cross-correlated with their corresponding reference signals to determine PTT at each correlated region. Therefore, we can obtain the relationship between the distance and PTT of each local signal in the selected 10% threshold and the reference signal, which generates a linear relationship between the vertical distance and the PTT of two signals, where PWV is the slope of the trendline.
For an artery pulse wave, assuming the pulse wave goes vertically up while the subject is sitting straight up. As it propagates from an inferior location A at
The PTT is calculated by applying the MATLAB cross-correlation function –“xcorr (A, B)” (where A, B represent the signals at designated locations), which calculates a positive PTT for a pulse wave that goes from A to B. The 10% of the signal with the highest positive values and 10% of the signals with the lowest correlation coefficient values are selected to calculate the PTT with their corresponding reference signal. The distance between the local and reference signals was calculated based on the difference in their y-axis positions within the ROI, measured perpendicular to the ground. Considering the varying location of local signals, linear regression was applied to the scatter plot with PTT on the y-axis and
where
For the major vessels on the neck, blood propagates vertically either upward (from heart to head) for the carotid artery or the opposite for the jugular vein (Grefkes et al., 2020; Volz et al., 2016). Also, as the pressure wave propagates through the blood vessels, the speed, amplitude, and phase of the PWV are influenced not only by the location within the vascular system but also by the biological properties of the vessels, such as stiffness, elasticity, and wall thickness. This study analyzed these differences by comparing phase shifts and the highest power, calculated using Fast Fourier Transformation (FFT) (Cerna and Harvey, 2000), to generate the phase shift and power spectrum amplitude maps.
In this study, the phase shift of the rPPG signal was computed at the primary frequency, which is the maximum amplitude of the frequency between [0.7, 2] Hz and converted into degrees.
These phase shifts and the highest power calculated from FFT were converted into 2D heat maps and then used for result comparisons at the end of this study. At the final stage of this study, the correlation map drawn between the reference signal and local signals was also compared with the power spectrum amplitude map and phase shift map, providing an integrative view of the signal processing and analysis outcomes.
The PPG signal enhancement process begins with local signal filtering, leveraging an 18% gray card to measure system noise and adopting a 5 × 5 pixel binning strategy for optimal noise reduction and detail preservation, shown in Figure 4. This method effectively averages the central signal with 24 adjacent signals, smoothing out the physiological signal and diminishing noise and artifacts. With increasing the number of pixels for averaging, the square grid size increases, and the average standard deviation across the whole ROI decreases with increased grid size, as shown in Figure 5. From Figure 5, an optimal grid size of 5 × 5 will be used to downsampling the signals with the best balance of signal quality and the averaging number of signals for the next step analysis in this study.
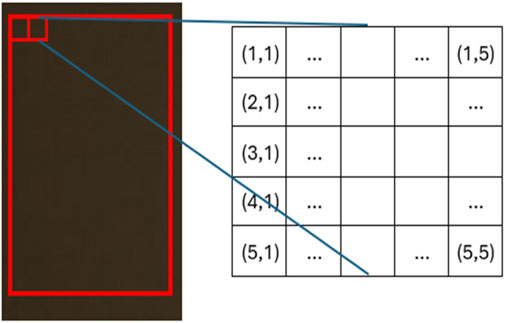
Figure 4. Grid with square size of 5 × 5 across the region of interest for 18% gray card.
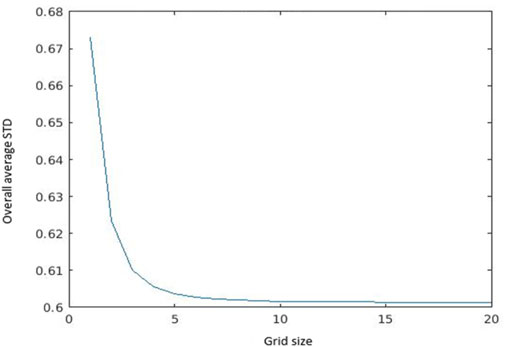
Figure 5. The average standard deviation of the whole area of interest.
Cross-correlation assesses the similarity between two signals across different time lags (Derrick and Thomas, 2004; Zucker, 2003). It measures the strength and alignment of the signals by sliding one signal over the other at different time shifts and computing the correlation coefficient at each shift. This analysis reveals the presence of any delayed or shifted similarities between the al and reference signals. The highest value in the cross-correlation function at a specific time lag indicates the alignment and synchronization of the two signals. This information is particularly useful for identifying signal delays or disturbances, which may impact the accuracy of local PPG signal lag measurements. Equation 4 shows the cross-correlation calculation between the reference signal (
where
A recap from the previously published result shown in Figure 6, where a reference signal was selected with a clear pulse, demonstrates the effectiveness of the reference signal selection process. Figure 7 shows the correlation and cross-correlation results between the down-sampled local signals and the reference signal and the two distinct areas found in the correlation and cross-correlation maps. To better understand the signals in the positively and negatively correlated areas, we selected the top 10% of the positively correlated and 10% of the most negatively correlated signals. They are presented in Figures 7B, C, and their corresponding averaged signals are plotted in Figure 8A. The time shifts between these two averaged signals are calculated in Table 1. The average absolute time shift between the average signals in Figure 8A is 341.5
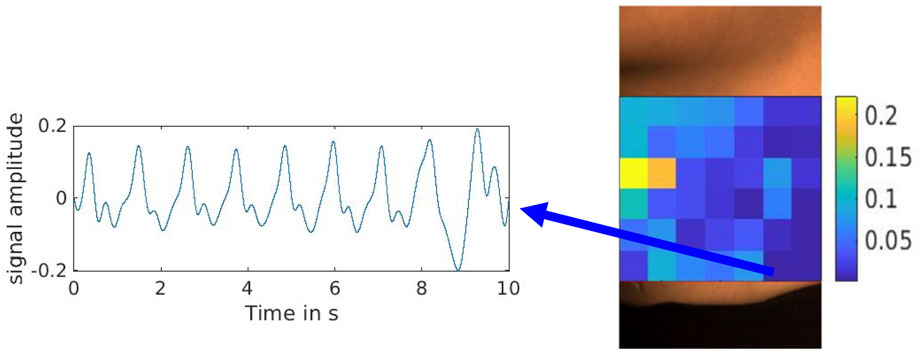
Figure 6. Reference signal selected with the lowest overall evaluation index from the overall evaluation score (OS) map (Cao et al., 2023).
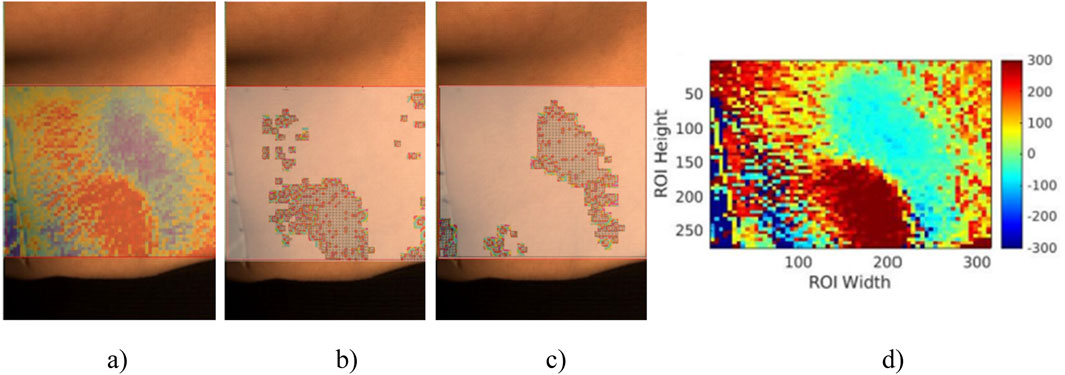
Figure 7. (A) The overlap image between ROI and correlation map. (B) The 10% most positively correlated signals in (A). (C) The 10% most negatively correlated signals in (A). (D) The time shift map is calculated using all local and reference signals in
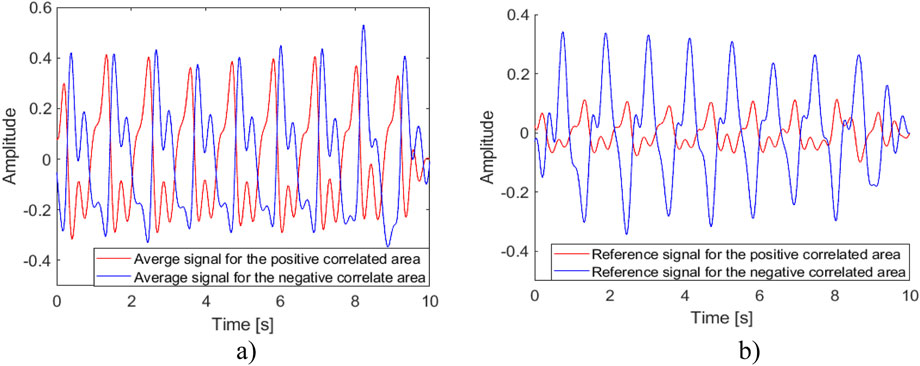
Figure 8. Average and reference signals for positively and negatively correlated areas. (A) The average signals for Figures 7B, C. (B) The reference signals for the positively and negatively correlated areas.
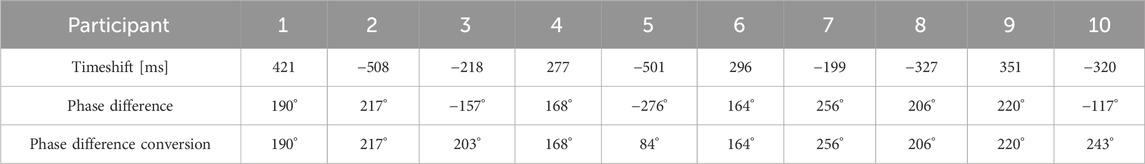
Table 1. The time shift between the average signal from the high-correlated and the low-correlated area and the phase difference between the average signal from the top 10% of the positively correlated and bottom 10% of the negatively correlated area.
Figure 8B shows the previously selected reference signal and the local reference signal for the negatively correlated area. In this study, 8 out of 10 subjects exhibited positively and negatively correlated areas on their necks. This may be influenced by the location of the reference measurement and the spatial relationship between the carotid artery and the jugular vein. The box plot in Figure 9 shows the mean pulse wave velocity for the carotid artery and jugular vein are 2.07
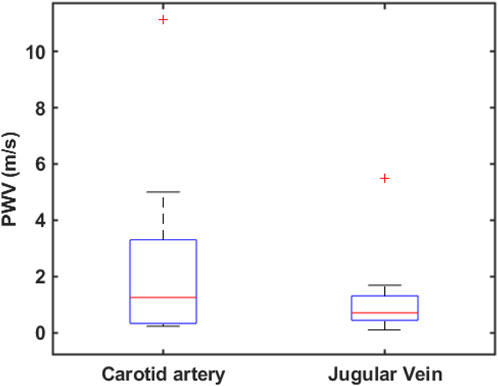
Figure 9. Box plot for pulse wave velocity calculated from the slope of the scatter plot (not shown here) for the projected artery and vein on the neck across ten subjects.
The time shifts and phase shifts between the average signals from the 10% most positively correlated and most negatively correlated areas are calculated in degrees and shown in Table 1. The average absolute time shift and phase difference are 341.5
To test the sensitivity in blood vessel reflection, we compared our results with two other methods: the power spectrum amplitude map and the time shift map from FFT. The highest power in a power spectrum corresponds to the dominant frequency component of a signal, which not only corresponds to the dominant periodic activity of the heart but also reflects the primary oscillatory pattern of the arterial pulse. Meanwhile, the time shift map shows phase information for signals in the frequency domain. Figures 10B, C are created by obtaining the peak power spectrum amplitude and the phase shift information for down-sampled signals with the same frequency selection range of [0.7, 2] Hz, respectively. These two maps are compared with Figure 10A, which is the correlation map in Figure 7A, for neck vessel projection. As shown in Figure 10, two distinct areas were observed in the time shift map but not the power spectrum amplitude map. This indicates that the time shift map may have higher sensitivity in detecting neck vessel distributions.
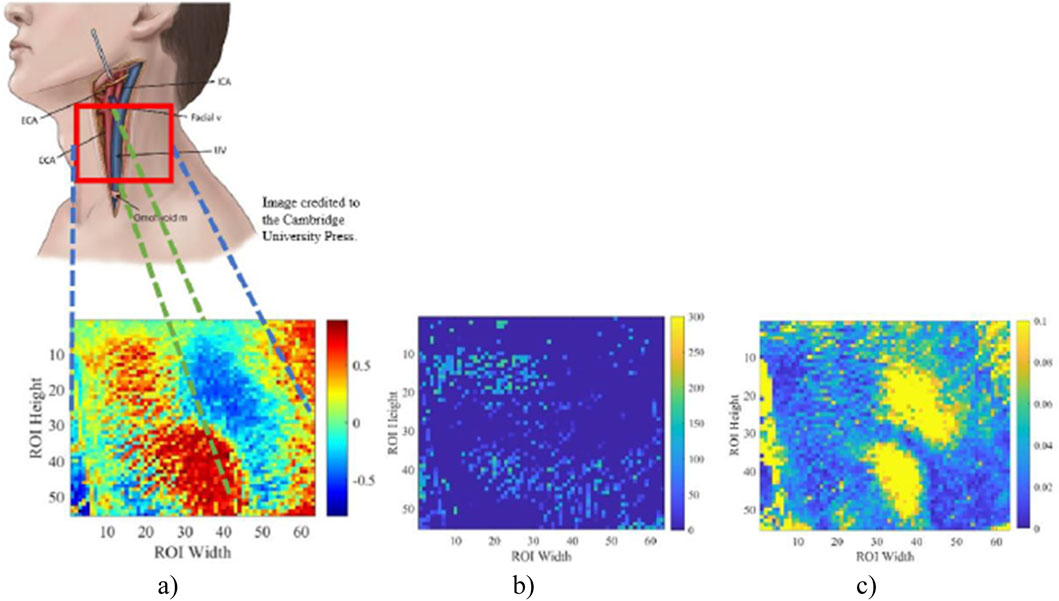
Figure 10. Correlation map between all local signals on ROI with the selected reference signal (A). The phase shift map was calculated from FFT (B). Power spectrum amplitude map with frequency domain of [0.7 2] Hz (C). This figure compares the sensitivity of 3 methods used for neck vessel detection.
In this study, 8 out of 10 subjects show distinct positively and negatively correlated areas in the correlation maps. Specifically, the correlation maps for all female subjects displayed a distinct pattern of positive and negative correlated areas, while the findings were less clear for some male subjects. These discrepancies may be attributed to the stronger muscular system in the male neck, particularly the sternocleidomastoid muscle, and the deeper location of the larger vessels, which potentially attenuates the signal originating from the carotid artery and jugular vein pulse. The discrepancy in ROI selection and individual anatomy differences can also cause inconsistent correlation results. Umaña et al. (2015) found that about 41.1% of the observations show that the internal jugular vein was significantly overlapped with a carotid artery on the left side of the neck. The lateral position of the internal jugular vein was approximately 26.5% on the left side of the neck (Umaña et al., 2015). On the other hand, the small sample size for male participants (n = 5) limits the reliability of the observed correlation map patterns, as the presence of two desirable results may be due to chance. Increasing the sample size for male and female participants in future studies would help mitigate the influence of individual cases and provide a more robust validation of these findings.
For the correlation map, the degree of correlation, whether positive or negative, can give insights into the distribution and behavior of various biological signs of those from blood vessels. This correlation reflects the distribution and behavior of various biological signals associated with blood vessels. Areas exhibiting high positive correlation suggest that the signals from these regions strongly align with the reference, indicating similar physiological factors or mechanisms likely influence them. Such areas may represent blood vessels experiencing uniform biological conditions, such as consistent blood flow or pressure patterns. Conversely, negatively correlated areas reflect regions where the signals deviate in opposite directions from the reference, suggesting the influence of distinct biological factors. These areas might correspond to vessels subjected to contrasting physiological states or external influences, highlighting the heterogeneity in vascular behavior and its relationship to the surrounding biological environment. In addition, given that the pressure wave propagates on the same vessel and counts for the maximum physical distance of the neck measured in this study, which is 12 cm. Assuming a lower bond of carotid artery PWV of 5.25
In this study, the mean carotid pulse wave is recalculated as 2.07
Additionally, the distance between the subject and the camera is manually measured, and individual variations in body thickness and hair coverage can impact the available ROI and the signals used for analysis. These factors contribute to variability in the results across subjects. Increasing the frame rate could help mitigate these differences by reducing the required ROI size, allowing for a more standardized selection across subjects, minimizing noise, and improving overall measurement reliability.
Although the cross-correlation method used in PTT calculation demonstrates a high sensitivity of 96.21%, it is also highly susceptible to signal quality issues, such as artifacts and morphological distortions (Karlen et al., 2012). This susceptibility can introduce significant variability in PWV calculations derived from PTT, resulting in a high standard deviation, as observed in Figure 9. Moreover, as the pressure wave propagates from the heart to the brain via the carotid artery and is returned to the heart via the jugular vein, the pulse wave characteristics may differ even within the same vessels. These differences arise due to variations in vascular structure and pulsatile pressure flow, which can influence the accuracy of PTT calculations.
The average jugular vein pulse wave velocity was calculated as 1.99
When the heart pumps, a pressure wave propagates along the carotid artery to the brain, delivering blood. Upon reaching the brain, this wave reflects toward the heart through various vascular pathways, including the jugular vein. This reflection generates secondary pulse waves that interact with the primary wave. These waves travel through distinct vessels with unique properties, resulting in speed, amplitude, and phase variations. Therefore, the methodology of finding reference signal for the correlation map was juxtaposed with the amplitude map from the power spectrum, possessing a frequency band cut-off between 0.7 Hz and 2 Hz, and the time shift map calculated from FFT. As shown in Figure 10C, the power spectrum amplitude map demonstrates its ability to distinguish the distribution of neck vessels, aligning with the areas identified in our study. However, since Figure 10C focuses on areas with the highest amplitude of signal power distribution, further analysis is required to understand these regions and their corresponding vessels fully. Moreover, the phase shift map yields less consistent results than the correlation and power spectrum maps. While it reveals vessel distribution in some participants, its sensitivity is notably lower than the other two methods.
The average heart rate in this study ranged from 60 to 95 bpm across the 10 subjects, with a mean of 78 bpm, equivalent to 1.3 pulses per second (Hz). The average full wave period is approximately 769 ms. In this study, the average absolute phase shift in Table 1 is 195.2° ± 48.75°, and it represents approximately 54.2% of the full pulse period at an average pulse rate of 78 bpm, which represents a time difference between the two pressure waves of 415 ± 104 ms. Compared to the time shift in Table 1, where the average time difference between the two averaged signals is 341.5 ± 106.4 ms, it represents 44.4% of an average full-cycle heat rate. The difference between the two calculations is about 9.8%. This difference may be caused by how they are calculated and the method’s sensitivity to the signal quality. The results also suggest the existence of a threshold phase difference between the positively and negatively correlated areas. If these areas represent the carotid artery and jugular vein, this threshold phase shift could be a potential marker for predicting blood flow status during pulse wave propagation between the two vessels. A phase shift within the threshold range may indicate normal pulse wave propagation, while a shift beyond this threshold could signal abnormal blood flow dynamics.
The selection of the reference signal based on signal peak variation may pose limitations for patients experiencing premature ventricular contractions (PVC), a cardiac arrhythmia characterized by irregular heartbeats originating from the ventricles that have a prevalence of 40%–70% of the population in a Holter study (Ahn, 2013). These abnormal electrical impulses trigger premature contractions or depolarizations that disrupt the regular heartbeat cycle. Consequently, these PVCs manifest as skipped heartbeats accompanied by delayed and high-amplitude pulses, rendering the reference signal based on peak variation less effective for such patients. The distance between two signals was calculated with vertical distance, which increases distance variation when vessels do not travel vertically. Moreover, the work distance between the neck and camera was manually measured, which increases the uncertainty of the distance used for PWV calculation.
Future work needs to overcome the overlap of PPG and ECG signals for pulse wave validation. Ultrasound with Doppler Anemometry will be needed to validate the positions and PWV of vessels under selected areas and help study the distorted signals and correlation map. As for Figure 7A, even though the areas with positive and negative correlations are successfully detected, the correlation gradient—the rate at which the correlation values change between these areas—is hardly recognizable. This limitation arises from the resolution of the signal, which is constrained by the current frame rate. A higher frame rate might improve the resolution and allow for better visualization of the time shift change, making distinguishing the transitions between areas of varying correlation easier. Moreover, a higher frame rate, such as 3000–5000 fps, can improve signal detection within a much shorter pulse transit distance, create a pulse transit time map, allow a smaller ROI for all subjects, and increase data collection and analysis robustness. The results can also be improved with better signal-to-noise ratio and signal quality, such as by analyzing the signal’s spectral entropy or applying the dynamic time wrapping method to extract each pulse that matches a running template for signal quality assessment (Pereira et al., 2020).
It is a preliminary study, requiring further experiments with more participants. A more rigorous and objective approach to ROI selection is required. It can be based, for example, on referencing some anatomical features (e.g., earlobe).
This study developed a non-contact method that detects pulse wave velocity distribution in the neck vessel using the rPPG method with a high-speed camera. The proposed approach can benefit clinical screening by identifying individuals at high risk of developing CVD. It is a novel method to monitor the neck area to detect the carotid artery and jugular vein, which shows promising potential for simultaneous PWV estimation for the neck vessels. This study successfully developed an rPPG system for pulse wave detection and PWV calculation. The results show that the rPPG technique can be used to visualize the major neck vessel distribution and potentially for carotid artery PWV calculation. However, the local PWV found in this study for the carotid artery is lower than previously published local carotid PWV measurements. Hence, the sensitivity and accuracy of the current method need to be verified and validated using cPPG and US. This non-contact method enhances patient comfort and holds promise for wider clinical use. Over time, remotely estimating PWV through rPPG could play a crucial role in the early detection and risk assessment of cardiovascular disease (CVD), offering a more accessible and preventative approach to managing long-term cardiovascular health.
The raw data supporting the conclusions of this article will be made available by the authors, without undue reservation.
The studies involving humans were approved by the Toronto Metropolitan Research Ethical Board. The studies were conducted in accordance with the local legislation and institutional requirements. The participants provided their written informed consent to participate in this study. The studies involving humans were approved by Toronto Metropolitan Research Ethical Board. The studies were conducted in accordance with the local legislation and institutional requirements. The participants provided their written informed consent to participate in this study.
MC: Data curation, Investigation, Methodology, Writing–original draft, Writing–review and editing. GS: Conceptualization, Data curation, Formal Analysis, Investigation, Methodology, Project administration, Supervision, Validation, Visualization, Writing–review and editing. AD: Conceptualization, Data curation, Formal Analysis, Funding acquisition, Investigation, Methodology, Project administration, Resources, Software, Supervision, Validation, Visualization, Writing–review and editing.
The author(s) declare that financial support was received for the research, authorship, and/or publication of this article. The authors would like to thank Timothy Burton for providing training and technical support to set up this project. The authors acknowledge NSERC Alliance (AD) funding and NSERC Personal Discovery [AD (2022-2024)].
The authors declare that the research was conducted in the absence of any commercial or financial relationships that could be construed as a potential conflict of interest.
The author(s) declare that no Generative AI was used in the creation of this manuscript.
All claims expressed in this article are solely those of the authors and do not necessarily represent those of their affiliated organizations, or those of the publisher, the editors and the reviewers. Any product that may be evaluated in this article, or claim that may be made by its manufacturer, is not guaranteed or endorsed by the publisher.
Ahn, M.-S. (2013). Current concepts of premature ventricular contractions. J. Lifestyle Med. 3 (1), 26–33.
Amini, M., Zayeri, F., and Salehi, M. (2021). Trend analysis of cardiovascular disease mortality, incidence, and mortality-to-incidence ratio: results from global burden of disease study 2017. BMC Public Health 21 (1), 401. doi:10.1186/s12889-021-10429-0
Barbagini, A., Ermini, L., Pertusio, R., Ferraresi, C., and Roatta, S. (2022). A portable device for the measurement of venous pulse wave velocity. Appl. Sci. Switz. 12 (4), 2173. doi:10.3390/app12042173
Bryant, J. A., Peebles, C., Hanson, M. A., Crozier, S., Inskip, H., Robinson, S., et al. (2012). Magnetic resonance imaging of pulse wave velocity in children aged 9 Years to assess maternal influences on aortic stiffness in the offspring. J. Cardiovasc. Magnetic Reson. 14 (Suppl. 1), T8–T2. doi:10.1186/1532-429X-14-S1-T8
Burton, T., Saiko, G., Cao, M., and Douplik, A. (2023). Remote photoplethysmography with consumer smartphone reveals temporal differences between glabrous and nonglabrous skin: pilot in vivo study. J. Biophot. 16 (1), e202200187–e202200189. doi:10.1002/jbio.202200187
Byfield, R., Miller, M., Miles, J., Guidoboni, G., and Lin, J. (2022). Towards robust blood pressure estimation from pulse wave velocity measured by photoplethysmography sensors. IEEE Sensors J. 22 (3), 2475–2483. doi:10.1109/JSEN.2021.3134890
Cao, M., Saiko, G., Burton, T., and Douplik, A. (2023). “Remote physiological monitoring of neck blood vessels,” in Remote Physiological Monit. Neck Blood Vessels, 12673, 26. doi:10.1117/12.2680679
Charlton, P. H., and Marozas, V. (2021). in Wearable photoplethysmography devices. Editors P. A. Kyriacou, and J. Allen (Elsevier).
Chen, Y., Shen, F., Liu, J., and Yang, G. Y. (2017). Arterial stiffness and stroke: de-stiffening strategy, a therapeutic target for stroke. Stroke Vasc. Neurology 2 (2), 65–72. doi:10.1136/svn-2016-000045
Counseller, Q., and Aboelkassem, Y. (2022). Recent technologies in cardiac imaging. Front. Med. Technol. 4 (January), 984492–984517. doi:10.3389/fmedt.2022.984492
Criqui, M. H., Ninomiya, J. K., Wingard, D. L., Ji, M., and Fronek, A. (2008). “Progression of peripheral arterial disease predicts cardiovascular disease morbidity and mortality.” J. Am. Coll. Cardiol. 52 (21): 1736–1742. doi:10.1016/j.jacc.2008.07.060
Derrick, T. R., and Thomas, J. M. (2004). Time series analysis: the cross-correlation function. Available at: https://api.semanticscholar.org/CorpusID:265951764.
El Khouli, R. H., Macura, K. J., Barker, P. B., Habba, M. R., Jacobs, M. A., and Bluemke, D. A. (2009). Relationship of temporal resolution to diagnostic performance for dynamic contrast enhanced MRI of the breast. J. Magnetic Reson. Imaging 30 (5), 999–1004. doi:10.1002/jmri.21947
Eriksson, A., Greiff, E., Loupas, T., Persson, M., and Pesque, P. (2002). Arterial pulse wave velocity with tissue Doppler imaging. Ultrasound Med. and Biol. 28 (5), 571–580. doi:10.1016/S0301-5629(02)00495-7
Fagundes, R. R., Vitorino, P. V. O., Lelis, E. de S., Jardim, P. C. B. V., Souza, A. L. L., Jardim, T. de S. V., et al. (2020). Relação entre Velocidade de Onda de Pulso e Biomarcadores Cardiovasculares em Pacientes com Fatores de Risco. Arq. Bras. Cardiol. 115 (6), 1125–1132. doi:10.36660/ABC.20190348
Gaidai, O., Cao, Yu, and Loginov, S. (2023). “Global cardiovascular diseases death rate prediction.” Curr. Problems Cardiol. 48 (5): 101622. doi:10.1016/j.cpcardiol.2023.101622
George, N. R., Manoj, R., Raj, K. V., Nabeel, P. M., Sivaprakasam, M., and Joseph, J. (2023a). “Ultrasound for venous local pulse wave velocity: comparison of pulse transit time methods,” in 2023 45th annual international conference of the IEEE engineering in medicine and biology society (EMBC), 1–4. doi:10.1109/EMBC40787.2023.10340269
George, N. R., Raj Kiran, V., Nabeel, P. M., Sivaprakasam, M., and Joseph, J. (2023b). “Assessment of local venous pulse wave velocity: a pilot feasibility study,” in 2023 IEEE international symposium on medical measurements and applications, MeMeA 2023 - conference proceedings, 1–6. doi:10.1109/MeMeA57477.2023.10171902
Germanoska, B., Coady, M., Ng, S., Fermanis, G., and Miller, M. (2018). The reliability of carotid ultrasound in determining the return of pulsatile flow: a pilot study. Ultrasound 26 (2), 118–126. doi:10.1177/1742271X17753467
Ghosh, A., Dharmarajan, A., Swain, P. K., Das, D., Verma, P., and Tripathy, P. R. (2019). Impact of cardiovascular factors on pulse wave velocity and total vascular resistance in different age group patients with cardiovascular disorders. Curr. Aging Sci. 11 (4), 261–268. doi:10.2174/1874609812666190226151500
Giannarelli, C., Bianchini, E., Bruno, R. M., Magagna, A., Landini, L., Faita, F., et al. (2012). Local carotid stiffness and intima-media thickness assessment by a novel ultrasound-based system in essential hypertension. Atherosclerosis 223 (2), 372–377. doi:10.1016/j.atherosclerosis.2012.05.027
Grefkes, C., Fink, G. R., Fink, G. R., and Fink, G. R. (2020). Recovery from stroke: current concepts and future perspectives. Neurological Res. Pract. 2 (1), 17. doi:10.1186/s42466-020-00060-6
Jiang, B., Liu, B., McNeill, K. L., and Chowienczyk, P. J. (2008). Measurement of pulse wave velocity using pulse wave Doppler ultrasound: comparison with arterial tonometry. Ultrasound Med. and Biol. 34 (3), 509–512. doi:10.1016/j.ultrasmedbio.2007.09.008
Karlen, W., Kobayashi, K., Ansermino, J. M., and Dumont, G. A. (2012). Photoplethysmogram signal quality estimation using repeated Gaussian filters and cross-correlation. Physiol. Meas. 33 (10), 1617–1629. doi:10.1088/0967-3334/33/10/1617
Kim, J., Cha, M. J., Lee, D. H., Lee, H. S., Nam, C.Mo, Nam, H. S., et al. (2011). The association between cerebral atherosclerosis and arterial stiffness in acute ischemic stroke. Atherosclerosis 219 (2), 887–891. doi:10.1016/j.atherosclerosis.2011.09.013
Kim, Y. K. (2006). Impact of the metabolic syndrome and its components on pulse wave velocity. Korean J. Intern. Med. 21 (2), 109–115. doi:10.3904/kjim.2006.21.2.109
Lapitan, D. G., and Andrey, P. T. (2019). “Analytical assessment of the modulation depth of photoplethysmographic signal based on the modified beer-lambert law,” in Proceedings of the international conference on advanced Optoelectronics and lasers, CAOL 2019-septe (september), 103–106. doi:10.1109/CAOL46282.2019.9019552
Li, R. X., Luo, J., Balaram, S. K., Chaudhry, F. A., Shahmirzadi, D., and Konofagou, E. E. (2013). Pulse wave imaging in normal, hypertensive and aneurysmal human aortas in vivo: a feasibility study. Phys. Med. Biol. 58 (13), 4549–4562. doi:10.1088/0031-9155/58/13/4549
Lim, H. S., and Lip, G. Y. H. (2008). Arterial stiffness: beyond pulse wave velocity and its measurement. J. Hum. Hypertens. 22 (10), 656–658. doi:10.1038/jhh.2008.47
Marais, L., Pernot, M., Khettab, H., Tanter, M., Messas, E., Zidi, M., et al. (2019). Arterial stiffness assessment by shear wave elastography and ultrafast pulse wave imaging: comparison with reference techniques in normotensives and hypertensives. Ultrasound Med. and Biol. 45 (3), 758–772. doi:10.1016/j.ultrasmedbio.2018.10.032
Mejía-Mejía, E., Allen, J., Budidha, K., El-Hajj, C., Kyriacou, P. A., and Charlton, P. H. (2021). “Photoplethysmography signal processing and synthesis,” in Photoplethysmography: Technology, signal analysis and applications. doi:10.1016/B978-0-12-823374-0.00015-3
Misra, S., and Wu, Y. (2020). “Chapter 10 - machine learning assisted segmentation of scanning electron microscopy images of organic-rich shales with feature extraction and feature ranking.” In Machine learning for subsurface characterization, edited by S. Misra, H. Li, and J. He, 289–314. Gulf Professional Publishing. doi:10.1016/B978-0-12-817736-5.00010-7
Mitchell, G. F., Hwang, S. J., Vasan, R. S., Larson, M. G., Pencina, M. J., Hamburg, N. M., et al. (2010). Arterial stiffness and cardiovascular events: the framingham heart study. Circulation 121 (4), 505–511. doi:10.1161/CIRCULATIONAHA.109.886655
Moco, A., Sander, S., Gastel, M. V., and Gerard, De H. (2018). “Impairing factors in remote-PPG pulse transit time measurements on the face,” in IEEE computer society Conference on computer Vision and pattern recognition workshops 2018-june: 1439–47. doi:10.1109/CVPRW.2018.00184
Nabeel, P. M., Karthik, S., Joseph, J., and Sivaprakasam, M. (2017). “Experimental validation of dual PPG local pulse wave velocity probe,” in 2017 IEEE international symposium on medical measurements and applications, MeMeA 2017 - proceedings, 408–413. doi:10.1109/MeMeA.2017.7985911
Nakano, K., Ohnishi, T., Nishidate, I., and Haneishi, H. (2018). “Non-contact sphygmomanometer based on pulse-wave transit time between the face and hand,”Opt. Diagnostics Sens. XVIII Toward Point-of-Care Diagnostics, Editor L. C. Gerard, doi:10.1117/12.2289349
Nyhan, D., Jochen, S., Viachaslau, B., and Dan, E. B. (2011). Vascular stiffness and increased pulse pressure in the aging cardiovascular system. Cardio. Resea. Practic. 1 (1). doi:10.4061/2011/263585
Nurmohamed, N. S., van Rosendael, A. R., Danad, I., Ngo-Metzger, Q., Taub, P. R., Ray, K. K., et al. (2024). Atherosclerosis evaluation and cardiovascular risk estimation using coronary computed tomography angiography. Eur. Heart J. 45 (20), 1783–1800. doi:10.1093/eurheartj/ehae190
Pereira, T., Correia, C., and Cardoso, J. (2015). Novel methods for pulse wave velocity measurement. J. Med. Biol. Eng. 35 (5), 555–565. doi:10.1007/s40846-015-0086-8
Pereira, T., Gadhoumi, K., Ma, M., Liu, X., Xiao, R., Colorado, R. A., et al. (2020). A supervised approach to robust photoplethysmography quality assessment. IEEE J. Biomed. Health Inf. 24 (3), 649–657. doi:10.1109/JBHI.2019.2909065
Pitson, D. J., Sandell, A., Van Den Hout, R., and Stradling, J. R. (1995). Use of pulse transit time as a measure of inspiratory effort in patients with obstructive sleep apnoea. Eur. Respir. J. 8 (10), 1669–1674. doi:10.1183/09031936.95.08101669
Ramnarine, K. V., Tim, H., Yvonne, S., May, N., Joanne, A., Ross Naylor, F., et al. (2003). Tissue Doppler imaging of carotid plaque wall motion: a pilot study. Cardiovasc. Ultrasound 1, 1–15. doi:10.1186/1476-7120-1-1
Rabben, S. I., Stergiopulos, N., Hellevik, L. R., Smiseth, O. A., Slørdahl, S., Urheim, S., et al. (2004). An ultrasound-based method for determining pulse wave velocity in superficial arteries. J. Biomechanics 37 (10), 1615–1622. doi:10.1016/j.jbiomech.2003.12.031
Scarsini, R., Portolan, L., Della Mora, F., Marin, F., Mainardi, A., Ruzzarin, A., et al. (2023). Angiography-derived and sensor-wire methods to assess coronary microvascular dysfunction in patients with acute myocardial infarction. JACC Cardiovasc. Imaging 16 (7), 965–981. doi:10.1016/j.jcmg.2023.01.017
Schaafs, L. A., Tzschätzsch, H., Reshetnik, A., Van Der Giet, M., Braun, J., Hamm, B., et al. (2019). Ultrasound time-harmonic elastography of the aorta: effect of age and hypertension on aortic stiffness. Investig. Radiol. 54 (11), 675–680. doi:10.1097/RLI.0000000000000590
Sobieszczyk, P., and Beckman, J. (2006). Carotid artery disease. Circulation 114 (7), 244–247. doi:10.1161/CIRCULATIONAHA.105.542860
Spronck, B., Tan, I., Reesink, K. D., Georgevsky, D., Delhaas, T., Avolio, A. P., et al. (2021). Heart rate and blood pressure dependence of aortic distensibility in rats: comparison ofmeasured and calculated pulse wave velocity. J. Hypertens. 39 (1), 117–126. doi:10.1097/HJH.0000000000002608
Tang, C.Ju, Lee, Po Y., Chuang, Yi H., and Huang, C. C. (2020). “Measurement of local pulse wave velocity for carotid artery by using an ultrasound-based method,”Ultrasonics, 102. doi:10.1016/j.ultras.2020.106064
Tillin, T., Chambers, J., Malik, I., Coady, E., Byrd, S., Mayet, J., et al. (2007). Measurement of pulse wave velocity: site matters. J. Hypertens. 25 (2), 383–389. doi:10.1097/HJH.0b013e3280115bea
Tuttolomondo, A., Di Sciacca, R., Di Raimondo, D., Serio, A., D’Aguanno, G., Pinto, A., et al. (2010). Arterial stiffness indexes in acute ischemic stroke: relationship with stroke subtype. Atherosclerosis 211 (1), 187–194. doi:10.1016/j.atherosclerosis.2010.02.010
Umaña, M., García, A., Bustamante, L., Castillo, J. L., and Sebastián Martínez, J. (2015). Variations in the anatomical relationship between the common carotid artery and the internal jugular vein: an ultrasonographic study. Colomb. Medica Cali, Colomb. 46 (2), 54–59.
Umaña Perea, M., Martínez Collazos, J. S., García, A. F., Castillo García, J. L., and Bustamante Cristancho, L. A. (2015). Variations in the anatomical relationship between the common carotid artery and the internal jugular vein: an ultrasonographic study. Colomb. Medica 46: 54–59. doi:10.25100/cm.v46i2.1652
Vallée, A., Cinaud, A., Protogerou, A., Zhang, Yi, Topouchian, J., Safar, M. E., et al. (2020). Arterial stiffness and coronary ischemia: New aspects and paradigms. Curr. Hypertens. Rep. 22 (1), 5. doi:10.1007/s11906-019-1006-z
van der Meer, R. W., Diamant, M., Westenberg, J. J. M., Doornbos, J., Bax, J. J., De Roos, A., et al. (2007). Magnetic resonance assessment of aortic pulse wave velocity, aortic distensibility, and cardiac function in uncomplicated type 2 diabetes mellitus. J. Cardiovasc. Magnetic Reson. 9 (4), 645–651. doi:10.1080/10976640601093703
van der Vliet, R., Selles, R. W., Andrinopoulou, E.-R., Nijland, R., Ribbers, G. M., Frens, M. A., et al. (2020). Predicting upper limb motor impairment recovery after stroke: a mixture model. Ann. Neurology 87 (3), 383–393. doi:10.1002/ana.25679
Volz, L. J., Rehme, A. K., Michely, J., Nettekoven, C., Eickhoff, S. B., Fink, G. R., et al. (2016). Shaping early reorganization of neural networks promotes motor function after stroke. Cereb. Cortex 26 (6), 2882–2894. doi:10.1093/cercor/bhw034
Wang, Z., Yang, Y., Yuan, Li J., Liu, J., Duan, Y. Y., and Cao, T. S. (2015). Non-invasive method for measuring local pulse wave velocity by dual pulse wave Doppler: in vitro and in vivo studies. PLoS ONE 10 (3), 01204822–e120513. doi:10.1371/journal.pone.0120482
Wu, H.-T., Ho, C.-S., Weng, J.-S., Tsai, W.-C., and Wang, M.-C. (2004). “A novel method for measurement of pulse wave velocity by dual-channel photoplethysmography.” In IEEE international workshop on biomedical circuits and systems, S2/6–8. doi:10.1109/BIOCAS.2004.1454164
Yamashina, A., Tomiyama, H., Arai, T., Hirose, K. I., Koji, Y., Hirayama, Y., et al. (2003). Brachial-ankle pulse wave velocity as a marker of atherosclerotic vascular damage and cardiovascular risk. Hypertens. Res. 26 (8), 615–622. doi:10.1291/hypres.26.615
Yin, L.-X., Ma, C.-Y., Wang, S., Wang, Y.-H., Meng, P.-P., Pan, X.-F., et al. (2021). “Reference values of carotid ultrafast pulse-wave velocity: a prospective, multicenter, population-based study.” J. Am. Soc. Echocardiogr. 34 (6): 629–641. doi:10.1016/j.echo.2021.01.003
Zhang, X., and Greenleaf, J. F. (2006). Measurement of wave velocity in arterial walls with ultrasound transducers. Ultrasound Med. and Biol. 32 (11), 1655–1660. doi:10.1016/j.ultrasmedbio.2006.04.004
Zieff, G., Stone, K., Paterson, C., Fryer, S., Diana, J., Blackwell, J., et al. (2023). Pulse-wave velocity assessments derived from a simple photoplethysmography device: agreement with a referent device. Front. Cardiovasc. Med. 10 (February), 1–10. doi:10.3389/fcvm.2023.1108219
Keywords: remote photoplethysmography (rPPG), remote physiological imaging, pulse propagation, pulse wave velocity (PWV), carotid artery, jugular vein
Citation: Cao M, Saiko G and Douplik A (2025) Remote physiological monitoring of neck blood vessels with a high-speed camera. Adv. Opt. Technol. 14:1536415. doi: 10.3389/aot.2025.1536415
Received: 28 November 2024; Accepted: 14 February 2025;
Published: 07 March 2025.
Edited by:
Robert Brunner, Ernst-Abbe-Hochschule Jena, GermanyReviewed by:
Junsuo Qu, Institute of Cytology, Russian Academy of Sciences, RussiaCopyright © 2025 Cao, Saiko and Douplik. This is an open-access article distributed under the terms of the Creative Commons Attribution License (CC BY). The use, distribution or reproduction in other forums is permitted, provided the original author(s) and the copyright owner(s) are credited and that the original publication in this journal is cited, in accordance with accepted academic practice. No use, distribution or reproduction is permitted which does not comply with these terms.
*Correspondence: Meiyun Cao, bWVpeXVuLmNhb0B0b3JvbnRvbXUuY2E=
Disclaimer: All claims expressed in this article are solely those of the authors and do not necessarily represent those of their affiliated organizations, or those of the publisher, the editors and the reviewers. Any product that may be evaluated in this article or claim that may be made by its manufacturer is not guaranteed or endorsed by the publisher.
Research integrity at Frontiers
Learn more about the work of our research integrity team to safeguard the quality of each article we publish.