 Julien Ari
 Maxime Cavillon
 Matthieu Lancry
 Bertrand Poumellec
- Institut de Chimie Moléculaire et des Matériaux d’Orsay (ICMMO), Université Paris-Saclay, Centre National de la Recherche Scientifique (CNRS), Orsay, France
Femtosecond (fs) laser writing is a flexible way to induce three-dimensional local structural modifications inside glass materials, such as crystallization. The latter is a function of both glass composition, hence properties, and laser parameters. Previous works have shown that a glass composition of 33Li2O–33Nb2O5–13SiO2–21B2O3 (LNSB) mol% yields to crystallization of laser polarization orientable LiNbO3 nanocrystals upon irradiation with a 1,030 nm fs laser. In this paper, we present the effects of rare earth incorporation in the glass composition [i.e., europium (0.5, 1, and 2 mol%)] on the crystallization process of LiNbO3 nanocrystals induced by fs laser irradiation. The embedding of Eu3+ ions into these nanostructures has an interest in developing new integrated and miniaturized optical lasers and amplifiers in visible wavelengths. The influence of laser parameters, such as repetition rate (RR), pulse energy, and polarization, has been studied. Irradiated areas are investigated using optical and electron microscopy techniques. The effect of Eu3+ concentration on the crystallization behavior (crystal formation and morphology) is discussed, as Eu2O3 is not acting as a nucleation agent in LNSB glass up to 2 mol%.
1 Introduction
Femtosecond (fs) laser direct writing is a powerful and versatile tool for fabricating a large variety of passive optical components inside amorphous materials, such as glasses (e.g., Bragg gratings, waveguides, graded index lenses, and birefringent optics) (Smelser et al., 2005; Fernandes et al., 2011; Shimotsuma et al., 2013; Cavillon et al., 2019; Lei et al., 2019). Its use has been expanding in recent years in materials sciences to produce size-controlled three-dimensional (3D) local modifications by focusing a laser beam inside a large variety of materials, including glasses (Eaton et al., 2008; Gildenburg and Pavlichenko, 2019; Lei et al., 2019; Stoian, 2020; Orazi et al., 2021). This method has proven to be an important technology, opening the way to active optical applications, such as laser amplifiers, Pockels cells, and frequency converters, by triggering a crystallization process inside glass systems to produce nanocrystals where their sizes can depend on fs laser parameters. Nanostructuring of a targeted region in volume is a unique feature enabled by ultrafast lasers and is an active research field even in well-known materials such as silica or sapphire (Yamada et al., 2003; Dai et al., 2012; Xu et al., 2021; Zhai et al., 2021).
By controlling the fs laser parameters, it also becomes possible to generate permanent and oriented nanostructures in volume inside different glass families (Ahsan et al., 2011; Asai et al., 2015; Beresna, 2016; Shimotsuma et al., 2020). As an example of this approach, we consider LiNbO3 nanocrystals, having properties such as piezoelectricity and ferroelectricity, that can be photo-crystallized in Li2O–Nb2O5–SiO2 (LNS) glasses and recently extended to Li2O–Nb2O5–SiO2–B2O3 (LNSB) glasses using a 1,030 nm fs laser (Cao et al., 2016a; Cao et al., 2019; Muzi et al., 2021a). A unique feature of this light–matter interaction is the possibility to control the direction of the polar axis (c-axis) of LiNbO3 nanocrystals, not simply along the scanning direction but rather by tuning the laser polarization during the irradiation of the glass material (Cao et al., 2015; Muzi et al., 2021b). Indeed, it has already been reported using electron backscatter diffraction (EBSD) that the c-axis of LiNbO3 nanocrystals can be oriented at 90° from the laser polarization (Muzi et al., 2021a; Muzi et al., 2021b). This also gives the possibility of tuning the orientation of the nanocrystals during the laser writing process, which can make a 90° rotation in the xy plane of irradiation (z is the laser beam propagation axis). By adding B2O3 to the LNS glass matrix, Muzi et al. (2021a) demonstrated that LiNbO3 crystallizes faster and thus allows higher writing speeds, typically up to ∼240 µm/s, where it is limited to ∼30 µm/s in LNS glasses under the experimental conditions provided (Muzi et al., 2021a; Muzi et al., 2021b). This gives the opportunity to inscribe laser-written components at a faster rate (typ. an order of magnitude faster), which is an important parameter for the foreseen industrial development. Following these findings, the potential of making active-based materials [i.e., through the incorporation of rare earth (RE) ions into the glass matrix (Ari et al., 2022)] would contribute to developing new kinds of integrated optic materials (laser sources, miniaturized sensors, or high-density optical storage) that will combine both non-linear optics with RE spectroscopic properties. It is of interest for photonic integrated circuits (PIC) to not only enable waveguiding, but also amplifier/emitting waveguiding. Finally, the addition of other rare earth elements, such as Gd2O3, can be foreseen for magneto-optic effects to permit integrated magneto-optic isolators and sensors.
In this context, the objective of this paper is to investigate the effect of the fs laser-induced crystallization process on RE-doped LNSB glasses. For this work, we choose the europium (Eu3+) ion because it does not show any absorption band at the laser wavelength (1,030 nm), thus making it a good candidate for the 1,030 nm fs laser irradiation of LNSB-doped glasses (Binnemans, 2015). The birefringence induced by the nanoscale phase separation arranged in regular arrays formed of nanocrystals and the residual glass matrix allows us to study the effect of both laser parameters and glass composition (Cao et al., 2016b). A set of characterization techniques is employed to study the crystallization and structural modifications associated: birefringence, differential scanning calorimetry (DSC), differential thermal analysis/thermogravimetry analysis (DTA/TGA), optical microscopy, and scanning transmission electron microscopy (STEM) coupled with elemental analysis. The evolution of the induced birefringence from LiNbO3/glass nanogratings is monitored as a function of various laser parameters [pulse energy, repetition rate (RR), and polarization] and Eu3+ content. It also includes the effect of fs laser parameters and Eu3+ concentration on the photocrystallization of LiNbO3 nanocrystals in LNSB:Eu3+-doped glasses and the determination of transformation regimes. Complementary work to characterize the photoluminescence properties was provided by Ari et al. (2022).
2 Glass synthesis, irradiation process, and characterization methods
2.1 Glass sample preparation
Four glasses have been prepared from the raw elements of SiO2 (Alfa, 4N), Li2CO3 (Alfa 5N), H3BO3 (Alfa, 4N), Nb2O5 (Alfa, 3N), and Eu2O3 (Alfa, 4N) using the conventional melt-quenching method in a regular electrical resistance oven. The glass molar composition 33Li2O–33Nb2O5–13SiO2–21B2O3 (LNSB) mol% is doped at different concentrations of europium (0.5, 1, and 2 mol%) and, respectively, labeled LNSB0.5Eu, LNSB1Eu, and LNSB2Eu. They are compared with the undoped LNSB glass, which serves as a reference. To synthesize the glass samples, 20 g of raw element powders are first weighed in atmospheric conditions and crushed together before a drying step at 150°C for 15 min. Then, the temperature is raised to 1,200°C at 10°C/min and kept at this temperature for a decarbonation step of Li2CO3 for 30 min. Subsequently, the mixture is brought up to 1,400°C for 1 h, and the glass is quenched between two stainless steel plates preheated at 350°C. Finally, the obtained glass is quickly transferred to the annealing oven preheated at 350°C and annealed for 3 h before slow cooling to room temperature with the thermal inertia of the oven. Following the fabrication step, a few sample pieces of ∼1 mm thickness are collected, cut using a diamond saw, and polished to optical quality (typ. to 0.03 µm).
2.2 Fs laser irradiation process
The irradiation is made on a motorized translation stage with three-directional displacements (x, y, z). The sample is irradiated using fs laser Satsuma from Amplitude Systèmes (Pessac, France) operating at 1,030 nm with an 800 fs pulse duration. The fs laser is focused inside the glass using an aspheric lens with a numerical aperture (NA) of 0.6. The inscription depth is fixed at 300 µm (in air) under the surface for all the irradiations. The lines are written using two polarizations for each set of energies (0° for parallel or 90° for perpendicular to the writing direction) to observe the nanostructure orientation in the textured region (Cao et al., 2016a; Cao et al., 2017a; Muzi et al., 2021b). The inscription is performed along the x-axis for the 1 mm long lines, with a 20 µm gap separation between two successive lines in the y direction. Linear polarization is controlled using a half waveplate placed in the laser path before the aspheric lens. The RR varies between 100 and 500 kHz. The laser pulse energy (Ep) also varies between 0.01 and 3 µJ. The writing speed is fixed at 10 µm/s for all experiments. The crystallization effects are investigated in the (RR, Ep) landscape. The product of the two corresponds to the mean laser power delivered by the laser beam. The four glasses (LNSB, LNSB0.5Eu, LNSB1Eu, and LNSB2Eu) are irradiated following the same procedure.
Frequency-doubled light signal (λ = 515 nm) is detected during laser irradiation, corresponding to second harmonic generation (SHG). In the following experiments, this signal is assumed to be characteristic of the formation of non-centrosymmetric LiNbO3 crystals (Muzi et al., 2021b). All the irradiated lines have been written after a static step of 40 s to initiate the growth of LiNbO3 crystals (Muzi et al., 2021b); 40 s in static mode is enough time to observe the SHG for the laser powers used. Following the irradiation, the cross section of the glass is polished to bring the laser tracks to the surface for imaging characterizations.
The transmitted power through the sample has been measured using an Ophir thermopile power meter placed just under the glass sample during the irradiation to investigate the potential effect of the laser power absorption on the kinetics of crystallization. In this view, the incident power, Pin, is collected without the sample along the optical path at different energies. Pout is measured at the same energies by inserting the sample, with the focal point situated inside the glass. Each power measurement is made after a waiting time of 10 s in static mode and corresponds to integrated measurements over time (opposite to time-resolved measurements). Pin and Pout are used to calculate the non-transmitted power ratio by the sample using the relation
2.3 Characterization methods
First, the samples are investigated using an Olympus BX60F5 optical microscope under natural light to observe the laser track morphologies. The birefringence is characterized using the de Sénarmont compensator technique under polarized light to measure the retardance (R) along the neutral axes of the induced nanostructures. The slow and fast axes of the birefringent lines are determined using a full waveplate (λ) and the sample placed at 45° from the polarizer and cross polarizer. Then, the azimuth angle α is measured using a quarter waveplate (λ/4) and a green filter centered at 546 nm. The retardance R is deduced from R = (546/180)α. The values of α are taken in the center of each line. The birefringence B is calculated with the relation B = R/L, where L is the thickness of the irradiated line in the z-axis direction. L values are measured on the polished cross section because there is no birefringence from the pristine glass matrix. The maximum estimated fluctuation of R is approximately ±10 nm due to inhomogeneities observed along the irradiated line.
The onset glass transition temperature Tg and onset crystallization temperature Tx of the glasses are measured using both Setaram DTA/TGA 92 and DSC Setaram Setsys Evolution. DSC is measured under argon between 25°C and 750°C with a heating rate of 10°C/min on powdered glass samples of approximately 100 mg in an alumina crucible. Both DSC and DTA/TGA measurements are performed under the same experimental conditions. DTA/TGA signals are recorded simultaneously as a function of the temperature. The experimental error from the measurement is ±1°C.
Quantitative phase microscopy (QPM, Iatia Vision Sciences) is performed to investigate the optical phase shift ΔΦ at 546 nm related to a refractive index variation where no crystallization occurs, using a Physik Instrumente piezoelectric P-721.SL2 attached at the ×20 microscope objective (NA 0.45) to image the sample. The software solves the transport equation through a Fourier transform method. The phase image is retrieved from three images collected at the focal point, 3 µm below, and 3 µm above. Irradiation without crystallization is characterized by QPM to classify the physical transformation observed at low pulse energy, with the focal point localized on the measured lines.
The laser track cross section has been imaged using a scanning electron microscope/energy dispersive spectroscopy (SEM/EDS) Carl Zeiss Microscopy GmbH–Field emission gun (FEG) SEM ZEISS SUPRA 55 VP at 1 kV with the In-lens detector for imaging and an energy-dispersive X-ray analysis (EDXA)/EDS detector for elemental analysis. In addition, STEM has been performed using a high-resolution Titan3 G2 80–300 STEM (FEI Thermo Fisher Scientific) at 200 kV. Beforehand, a thin layer of 100 nm thickness of the laser track has been extracted from the cross section of a bulk sample using a focus ion beam (FIB) SEM Helios 660 microscope in the direction of the laser propagation to observe the nanostructuring for LNSB1Eu irradiated at 200 kHz, 1 µJ, and 0° writing polarization. Nanoscale chemical compositions are determined using energy-dispersive X-ray (EDX) and electron energy loss spectroscopy (EELS) analyses coupled with STEM.
3 Results
3.1 Aspect and thermal characterization of LNSB-doped glasses
A picture of the four-glass compositions prepared in this article is presented in Figure 1 after polishing. This photo shows that the glass color becomes more amber when increasing the Eu3+ concentration from LNSB1Eu to LNSB2Eu. This aspect is unclear from undoped to 1 mol% Eu3+, as the color of the glass looks relatively the same for LNSB, LNSB0.5Eu, and LNSB1Eu.
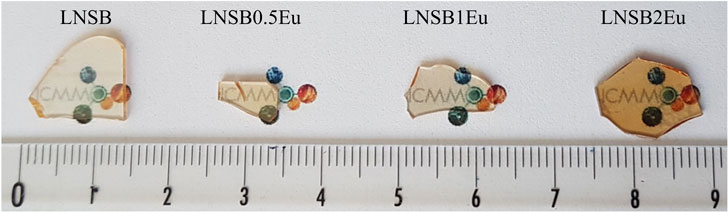
FIGURE 1. Photograph of the as-prepared LNSB glasses after polishing. Graduation is in centimeters.
The measurement and calculation of characteristic temperatures are realized using the DSC curves. DTA/TGA measurements are made to confirm the DSC results and detect a potential mass variation during heating. Table 1 summarizes the characteristic temperatures of the four LNSB: x Eu3+ glasses (with x = 0, 0.5, 1, and 2 mol% Eu3+), including Tg and Tx measured, the thermal stability against crystallization ΔT, the Hruby factor KH, and the reduced glass transition temperature Trg. The measured values for LNSB undoped are in agreement with the literature (Muzi et al., 2021a), so the melting temperature Tm taken from the publication is 1,257°C for the calculation of Trg.
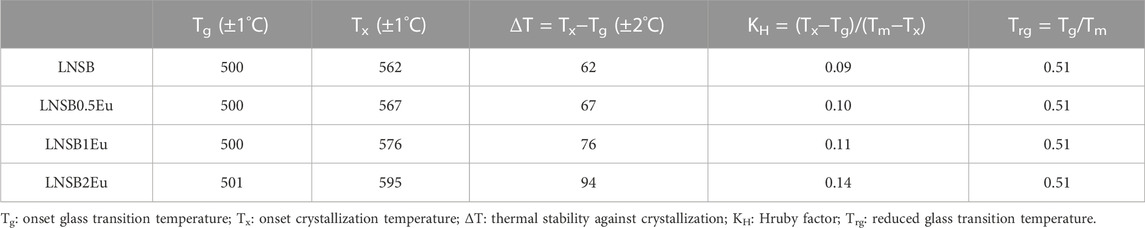
TABLE 1. Characteristic temperatures of the four glasses LNSB: x Eu3+ (with x = 0, 0.5, 1, and 2 mol%).
Table 1 shows that Tx increases from 562°C to 595°C with increasing the Eu3+ concentration from 0 to 2 mol%. Tg for the four glasses is measured at approximately 500°C ± 1°C. Simultaneous DTA/TGA analysis does not show any gain or loss of mass during heating. The maximum mass variation observed is approximately 0.1% from room temperature to 750°C, suggesting no weight change (moisture absorption or evaporation) happens during heating.
The experimental characteristic temperatures determined with both DTA and DSC measurements are identical. DSC measurements revealed that ΔT increases with the amount of Eu3+ in the glass (i.e., 62°C–94°C from LNSB to LNSB2Eu). The same trend is observed for KH, which is found to increase from 0.09 to 0.14 for, respectively, LNSB to LNSB2Eu. Trg remains constant at 0.51 for the four glasses.
3.2 Nanoscale elemental characterization of the irradiated area
Transmission electron microscopy is used to investigate the structure and elemental composition at the nanoscale level in the irradiated region. The experiment is performed on a single irradiated area in LNSB1Eu made at 200 kHz, 1 µJ, and 0° polarization. STEM analysis is presented in Figure 2. Preliminary EDS results performed during SEM imaging confirm the initial stoichiometry for the Nb/Si ratio in the glass and show the presence of Eu in both the glass matrix (not irradiated) and irradiated area in a similar quantity. One notable difference is the increase in Nb concentration in some regions of the irradiated area compared to the glass matrix, which suggests a chemical separation of the element during the fs laser irradiation. This aspect is explored in Figures 2, 3 using STEM analysis at the nanoscale.
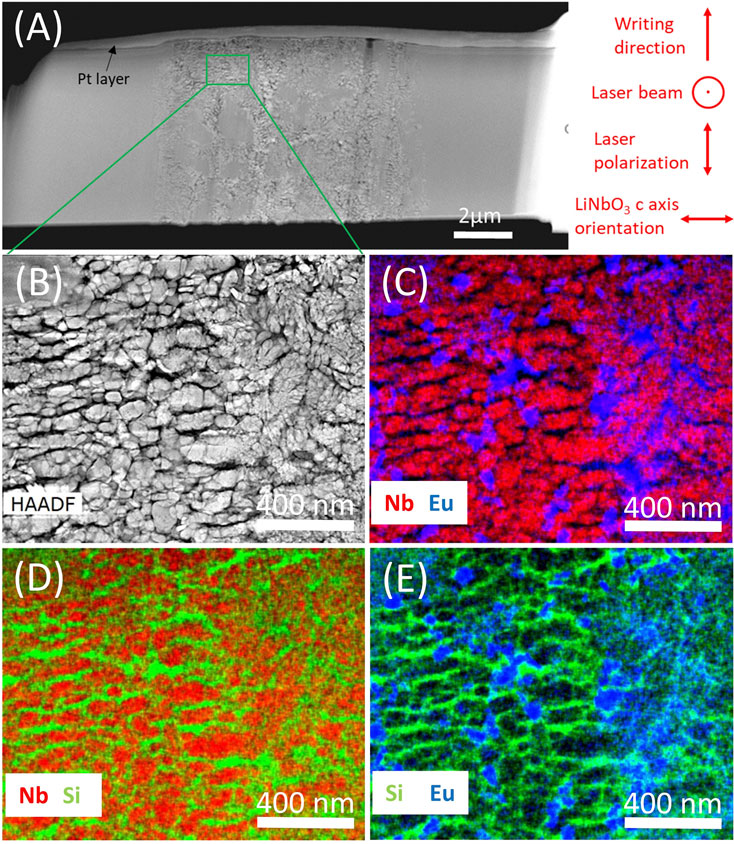
FIGURE 2. STEM/EDX analysis of the irradiated area in LNSB1Eu at 200 kHz/800 fs/1 µJ/0°. (A) STEM image of the thin film prepared using FIB. (B) High-angle annular dark field (HAADF) image of the nanocrystals. (C) EDX mapping of Nb and Eu. (D) EDX mapping of Nb and Si. (E) EDX mapping of Si and Eu. Color code: Nb (red), Si (green), and Eu (blue).
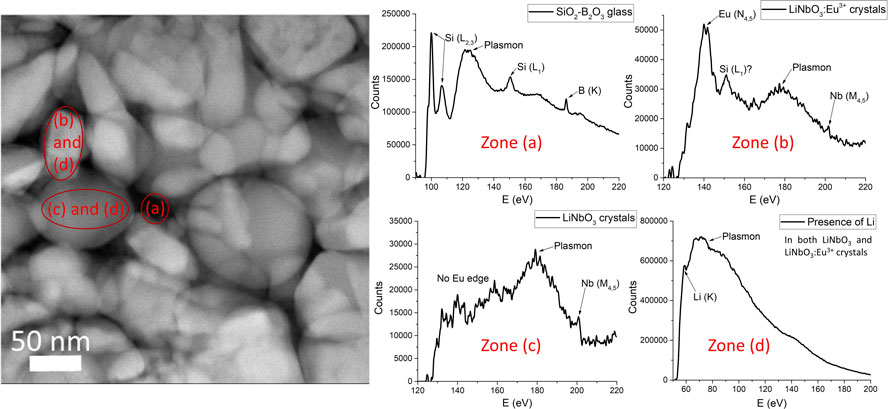
FIGURE 3. STEM/EELS analysis of the disordered irradiated area in LNSB1Eu. This figure shows the image of the analyzed zones by EELS with their associated spectra. Laser parameters: 200 kHz/800 fs/1 µJ/0° polarization.
Figure 2A shows the thin film prepared by FIB and the area analyzed by EDX in the irradiated region. The sample is covered by a Pt layer during the thin film cutting procedure. Figure 2B presents the analyzed area in the irradiated line. This picture shows the presence of pseudo-lamellar nanostructures oriented perpendicularly to the laser polarization (left part of the image) composed of white and dark parts. This HAADF image also shows a disordered area (right part of the image) without nanogratings. Figures 2C–E present, respectively, EDX mapping of the couples Nb/Eu, Nb/Si, and Si/Eu in the analyzed zone. These images confirm that Nb is principally localized in the white parts, whereas Si is contained in the dark parts. The presence of clustered Eu characterized by gathered blue dots in Figures 2C, E is also clearly visible. Eu is found in the white and dark parts; thus, they do not show a preferential migration between the two phases.
X-ray micro-diffraction (XRD) performed at the nanoscale during STEM acquisition of Figure 2B confirms that the nanogratings are composed of alternated crystalline (white parts) and amorphous (dark parts) lamellas oriented perpendicularly to the laser polarization. This orientation is not perfectly homogeneous inside the irradiated area as it depends on the thermalization in the focal point (Fernandez et al., 2018). That is why other regions mainly localized in the center of the irradiated area show a non-oriented crystallization of the nanocrystals. STEM/EELS analysis presented in Figure 3 is realized on a disordered area in the same sample to determine the nanoscale composition of light elements, such as B and Li.
EELS analysis in Figure 3 shows that Li is only found in the crystal phase [area (d)], thus validating the formation of LiNbO3:Eu3+ [area (b)] and undoped LiNbO3 [area (c)] nanocrystals. Therefore, we assume that these crystals can be assimilated to the LiNbO3 nanocrystals obtained by Muzi et al. (2021a) as the composition changes just by the amount of Eu3+ in the irradiated area, which confirms that it does not deeply modify the crystalline structure. The same measurement on the amorphous phase shows the presence of B and Si in the same region [area (a)]. These EELS observations, coupled with EDX mapping in Figure 2, prove that the glass phase is composed of SiO2–B2O3:Eu3+ in a disordered irradiated area and mainly undoped SiO2–B2O3 in the glass phase formed in the lamellar nanostructures. It is worth mentioning that both EDX and EELS techniques performed on the unirradiated glass region revealed a fully homogeneous composition.
3.3 Birefringence measurements as a function of the pulse energy and repetition rate
In Figure 1A, an optical microscope image in the transmission mode taken on irradiated LNSB0.5Eu using crossed Nicol polarizers with a full waveplate is presented and serves as an example to describe what is typically observed in all samples. The energies used for these experiments are in the 0.1–1.2 µJ range, as reported in Figure 4A. Figures 4B, C display, respectively, R and B as a function of Ep for the four glasses. All the written lines are inscribed at 200 kHz and 800 fs in a 0° writing polarization configuration. Note that the pinkish-red color of the background in Figure 4A is a combination of both the red luminescence of Eu3+ ions under polarized natural light and the magenta color coming from the background (isotropic environment) in a standard de Sénarmont configuration microscope with a λ waveplate.
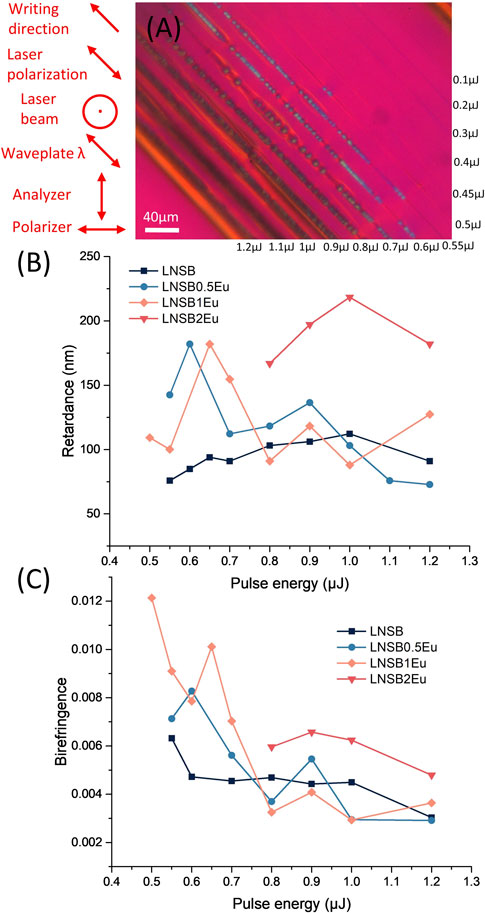
FIGURE 4. (A) Polarized light optical microscope image in transmission mode with the λ waveplate inserted of LNSB0.5Eu irradiated at 200 kHz/800 fs/0°. (B) Retardance as a function of the pulse energy for all glass samples irradiated, using similar irradiation conditions as in (A). (C) Birefringence as a function of the pulse energy, calculated using retardance values from (B).
Figure 4A shows that the slow axis of the lines is rotated according to light polarization. This is observed through a change in color between the 0° (blue) and 90° (yellow, not shown here) writing polarizations. The polarization dependence of the lines is clearer at energies between 0.5 µJ and 0.7 µJ, showing an intense blue color for 0° or a yellow color for 90°. Orientation of the slow axis/fast axis (respectively, −45° and +45° from the polarizer axis) of the lamellar nanostructures is less obvious at energies above 0.8 µJ because of their larger thicknesses. Retardance is measured between 0.5 µJ and 1.2 µJ. As no crystallization is detected in the 0.1–0.45 µJ interval, no retardance is observed at these energies. The laser track length in the cross section is optically measured for energies between 0.5 µJ and 1.2 µJ when the irradiated area is clearly visible.
Figure 4B shows that the R-values measured between 0.8 and 1.2 µJ are in the same order of magnitude (approximately 100 ± 30 nm) for LNSB, LNSB0.5Eu, and LNSB1Eu. LNSB2Eu does not show enough crystallization to measure the retardance between 0.5 and 0.7 µJ but presents the highest measured values averaging 190 ± 30 nm between 0.8 and 1.2 µJ. The highest retardance values for each LNSB, LNSB0.5Eu, LNSB1Eu, and LNSB2Eu are observed, respectively, at 1 µJ (112 nm), 0.6 µJ (181 nm), 0.65 µJ (182 nm), and 1 µJ (218 nm). The laser track length increases with the pulse energy. As an example, at 1.2 µJ, the lengths of irradiated LNSB, LNSB0.5Eu, LNSB1Eu, and LNSB2Eu are measured at 30, 25, 35, and 38 µm, respectively, whereas at 0.55 µJ they are measured at 12, 20, 11, and 0 µm, respectively (no crystallization for LNSB2Eu at 0.55 µJ/200 kHz). Figure 4C shows that the birefringence is, on average, decreasing when the pulse energy increases from 0.5 µJ to 1.2 µJ. The maximum value observed is 0.012 at 0.5 µJ for the LNSB1Eu. This value is obtained at the lowest energy where crystallization starts. The same trend is observed when increasing the RR of the laser at a fixed energy of 1 µJ until reaching a minimum birefringence of approximately 0.002 for 300, 400, and 500 kHz.
3.4 Determination of the crystallization landscape (RR, Ep)
Prior to determining the crystallization landscape, the different morphologies between the lines made at different energies must be defined. The optical imaging results have been employed to classify the crystallized lines by their aspects. To properly label the transformations observed for the lines without crystals detected between 0.3 and 0.45 µJ (no birefringence observed), we performed a QPM analysis to describe the phase shift. It is worth noting here that the 0.3–0.45 µJ lines are just below the energy where some formed crystals are visible with an optical microscope (i.e., 0.5 µJ). Figures 5A, B show the selected lines (between 0.3 and 0.45 µJ) in LNSB0.5Eu irradiated at 200 kHz, 800 fs, and 0° polarization. The red color observed in Figure 5A comes from the luminescence of Eu3+ ions under natural light.
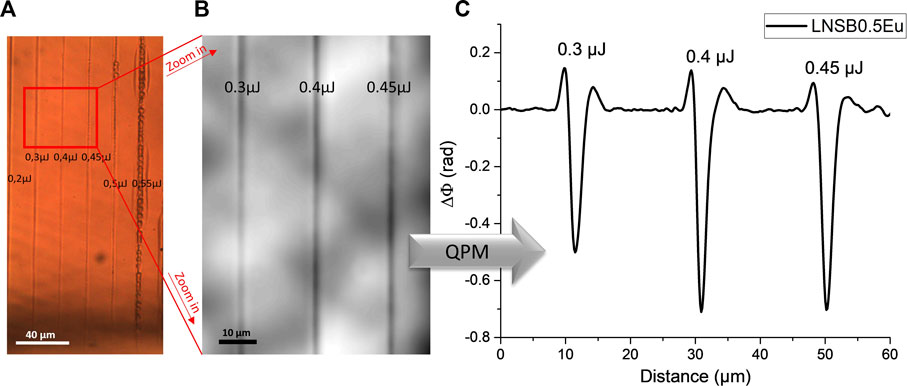
FIGURE 5. QPM analysis on the LNSB0.5Eu irradiated lines at 200 kHz/800 fs/0° and energies 0.3, 0.4, and 0.45 µJ. (A) Microscope image under natural light in transmission mode. (B) QPM image. (C) Phase shift ΔΦ measured from the QPM image.
Figure 5C shows that the phase shift decreases in the three lines made at 0.3, 0.4, and 0.45 µJ, which indicates a decrease in the refractive index in the irradiated area compared to the glass matrix. The error scale estimated from the data treatment in this figure is approximately 10% due to background removal and correction. These QPM results are in agreement with Cao et al. (2018). Texturing of crystallized areas has already been proved in undoped LNSB glass and shows the formation of large and small textured regions depending on the laser pulse energy (Muzi et al., 2021b). Therefore, the same transformation domains are expected in the doped LNSB glasses at similar energies. Based on imaging observations, QPM measurements, and the literature, we can classify the irradiated lines in three groups.
(a) Transformation 1: no crystallization, only a permanent decrease in phase shift from QPM measurements (corresponding to a decrease of the refractive index).
(b) Transformation 2: small textured regions/nanocrystals, very iridescent colors (blue/yellow) observed under polarized light in the transmission mode and small crystallized area in the cross section.
(c) Transformation 3: large textured regions, almost opaque under natural light microscope illumination in transmission mode and large crystallized area in the cross section.
From the aforementioned observations, the landscape of crystallization (as a function of RR and Ep) can be built for the four glasses. The results are displayed in Figure 6.
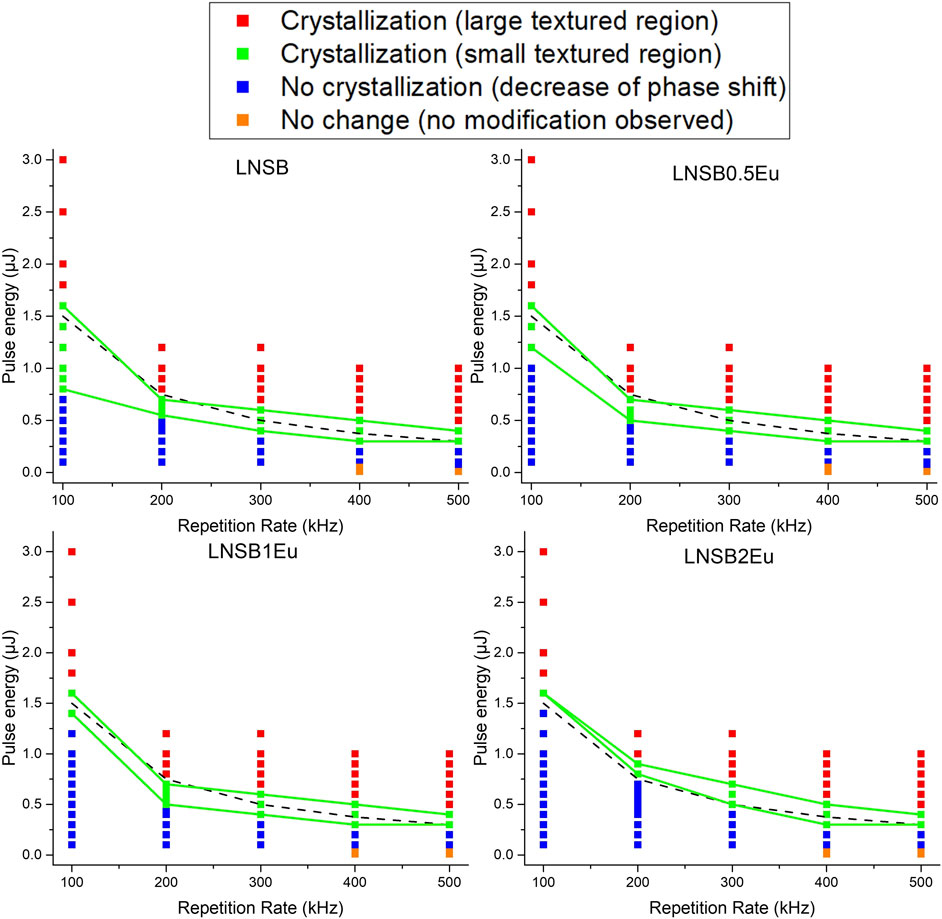
FIGURE 6. Landscapes (RR, Ep) of induced fs laser modifications in the four LNSB glasses (undoped, 0.5%Eu3+, 1%Eu3+, and 2%Eu3+). Black dashed line represents the iso-power curve at 150 mW. Writing parameters: laser wavelength 1,030 nm, NA = 0.6, pulse duration 800 fs, polarization 0°, 10 µm/s writing speed, inscription depth 300 µm, and a static step of 40 s before writing the line along the x-axis.
The four graphs in Figure 6 have identical irradiation parameters provided in the caption. Overall, the previously defined transformation thresholds are found at the same energies for the three LNSB, LNSB0.5Eu, and LNSB1Eu glasses, with the only notable difference at 100 kHz, where LNSB crystallizes more easily than the others. The exception is LNSB2Eu, where higher energies are overall required for the formation of crystals. At 400 and 500 kHz, no physical transformation is observed for the low energies at 0.05 µJ and 0.01 µJ. The lines are not visible under a microscope with either natural or polarized light, indicating the energy is too low to induce a transformation. Figure 6 shows that the landscape (RR, Ep) for the formation of small textured regions (green curves) decreases when Eu3+ concentration increases, as the iso-power curve at 150 mW is out of this specific landscape for LNSB2Eu at 100 and 200 kHz.
3.5 Landscape morphology (RR, Ep) of the crystals
In order to better describe the morphology of the crystallized lines as a function of the RR and pulse energy at the microscopic scale, the legend presented in Figure 7 is used for each LNSB:Eu3+ glass. The writing direction is fixed from right to left on microscope images. This legend gives a better understanding of the morphology of the induced microstructure and considers the spontaneous restart of crystallization observed mainly in LNSB0.5Eu and LNSB1Eu. Note that these landscapes characterize only the deposited laser powers where crystallization occurs and the aspect of the crystallized lines.
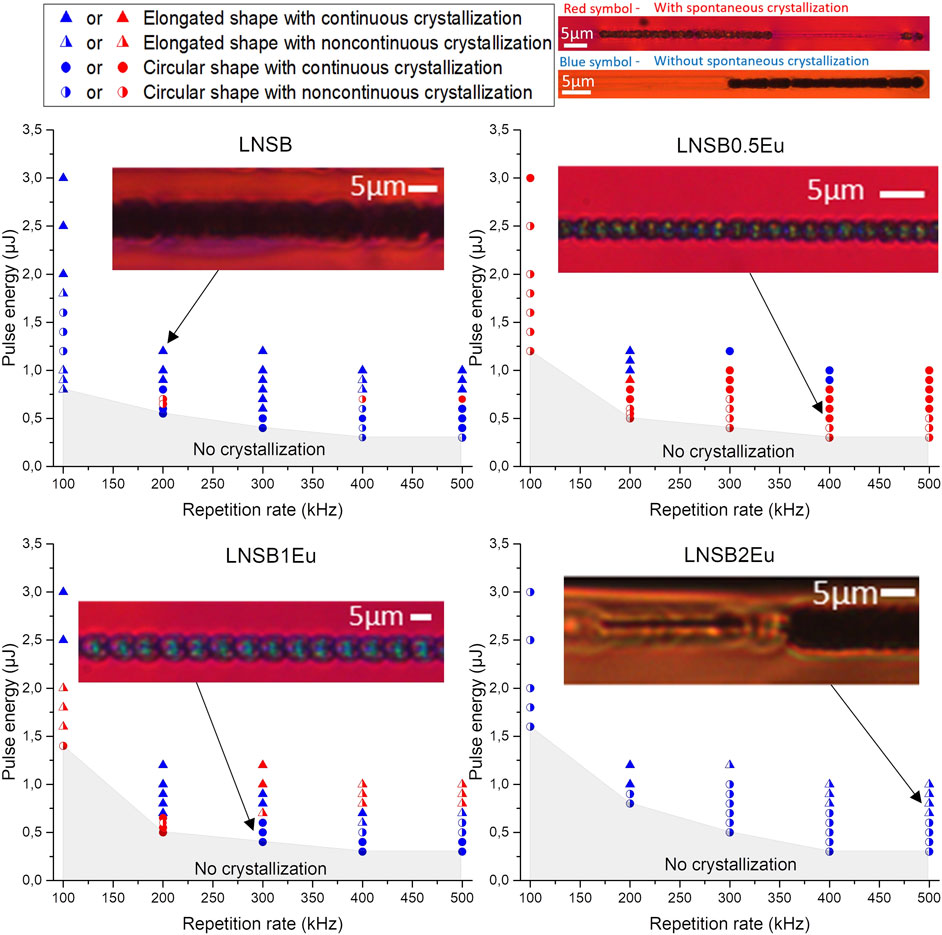
FIGURE 7. Landscape morphology (RR, Ep) of the crystals for LNSB, LNSB0.5Eu, LNSB1Eu, and LNSB2Eu. Inset images show the selected irradiated lines with an optical microscope under natural light. Color code: red points correspond to the spontaneous resumption of the crystallization along the line. Blue points correspond to no resumption of the crystallization along the line. Writing parameters are identical to the parameters from Figure 6.
Indeed, crystallization observed along the lines exhibits different morphologies depending on the laser energy and sometimes appears discontinuous. A continuous line shape, as, for example, in LNSB (200 kHz, 1.2 µJ, Figure 7), shows the presence of large and crystallized areas along the writing direction. This morphology contains no visible discontinuities and is represented as full triangle symbols. If similar shapes present discontinuities, they are represented as half-colored symbols. These lines appear dark because of their relatively large thicknesses and most likely scatter most of the light passing through.
Full- and half-colored circle symbols represent the observation of pearl-like shape morphology of the irradiated lines, as exemplified by the optical microscope images of LNSB0.5Eu (400 kHz/0.5 µJ) and LNSB1Eu (300 kHz/0.5 µJ) in Figure 7. The discontinuity of crystallization along the irradiated areas is, as explained previously, characterized by half-colored symbols.
A color code is set to better describe the discontinuities. The blue color corresponds to the lines where no spontaneous crystallization is observed. In this case, when crystallization stops, it does not come back while irradiating the sample until the end of the line (e.g., LNSB at 200 kHz/1.2 µJ and LNSB2Eu at 500 kHz/0.8 µJ). Conversely, the red color corresponds to lines where spontaneous crystallization is observed after at least one crystallization stoppage along the line (e.g., LNSB0.5Eu at 400 kHz/0.5 µJ). This phenomenon can give continuous crystallized lines when the spacing between the crystals is less than a single pearl-like structure (typically less than 1 µm distance). If the spacing is larger, typically from 1 µm to several tens of µm, the lines are qualified non-continuous.
For all glasses, large and elongated morphologies of the crystallized areas (in the direction of scanning) appear at high energies. When the energy is decreased, the irradiated area becomes a succession of circular features. LNSB0.5Eu shows more spontaneous resumption of crystallization compared to the other samples, and this aspect is not observed in the LNSB2Eu. LNSB1Eu also shows only a few restarts of crystallization along the line. Finally, in LNSB, this phenomenon seems to appear only approximately 0.65 µJ for 200, 400, and 500 kHz. The conditions to observe crystallization in LNSB2Eu are less achieved compared to the other glasses because the crystallization does not come back once it stops. This yields to partially crystallized lines for almost all the investigated irradiation conditions. At 100 kHz, all glasses mostly show partial crystallization for the energies tested. For completeness, the same landscape method is used to compare the morphologies as a function of the laser polarization by fixing the energy at 1 µJ. There is no major difference between the laser-induced morphologies at 0° and 90° writing polarizations for the four glasses.
3.6 Non-transmitted laser power during static irradiation
The non-transmitted power experiment performed on the LNSB1Eu sample is presented in Figure 8. As the losses coming from the coupling laser/glass interface (surface and plasma reflections, Fresnel losses, and scattering) are considered proportional to the incident laser power, we assume that the observed variations are mainly due to electron plasma absorption (Couairon et al., 2005). Therefore, the non-transmitted power ratio is supposed to be mainly due to the absorption through the material. The results are presented in Figure 8B, which shows the measured non-transmitted power ratio as a function of the input pulse energy EPin for LNSB1Eu at 300 kHz. These values are used to calculate the non-transmitted powers displayed in Figure 8B, corresponding to the limits of the three domains. Then, the iso-power curves at 26, 50, and 90 mW are drawn in a (RR, EPin-EPout) (non-transmitted energy) graph to estimate the transformation domains. This method allows for evaluating the crystallization landscape from the power measurements at a single RR (i.e., 300 kHz).
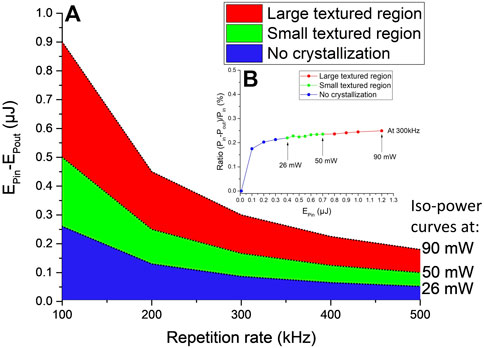
FIGURE 8. (A) Non-transmitted energy EPin-EPout as a function of the repetition rate RR for the transformation domains observed in LNSB1Eu. Note that non-transmitted powers above 90 mW are unexplored in this study. (B) Non-transmitted power ratio (Pin-Pout)/Pin of LNSB1Eu as a function of the input pulse energy EPin at 300 kHz (800 fs and 0° polarization).
Figure 8B shows that at low energies (0.01 and 0.05 µJ), the absorption of the glass is negligible; therefore, no crystallization occurs at these values, as we observed in Figures 6, 7. The non-transmitted power ratio increases sharply from 0.05 µJ to 0.1 µJ and then increases linearly with the pulse energy from 0.3 to 1.2 μJ at 300 kHz. The measured slopes between 0.3 and 1.2 µJ are evaluated at 0.038 µJ−1. At 300 kHz, crystallization starts as low as 0.4 µJ, which corresponds to a non-transmitted ratio of approximately 22%. This value is consistent with previous studies performed on silicate glasses (Lancry et al., 2011). The formation of small textured regions ends at 0.7 µJ, which corresponds to a ratio of 24%; then, the last energy tested at 1.2 µJ gives 25%.
From these values, Figure 8 allows for calculating the non-transmitted power necessary to induce the three observed transformations, which gives an interval between 26 and 50 mW for the formation of small textured regions and between 50 and 90 mW for large textured regions. Thus, it can be extrapolated to calculate the non-transmitted energies for the formation of the three domains as a function of the RR for LNSB1Eu presented in Figure 8A. The non-transmitted energy values are in agreement with the experimental landscape (RR, Ep) of LNSB1Eu presented in Figure 6. For instance, the absolute errors between the experimental and the calculated non-transmitted energies for the upper limit of the formation of small textured regions in LNSB1Eu (comparison between Figure 6 after applying the non-transmitted ratio; Figure 8A) are 0.12, 0.06, 0.02, 0.01, and 0.01 μJ at 100, 200, 300, 400, and 500 kHz, respectively.
4 Discussion
4.1 Effect of Eu3+ addition on the crystallization kinetics and glass homogeneity
According to Figure 7, the addition of Eu3+ affects the crystallization process during irradiation. The energy thresholds at 200, 300, 400, and 500 kHz are rigorously the same for LNSB, LNSB0.5Eu, and LNSB1Eu, which signifies that the energies required to induce crystallization are identical for the formation of nanoscale or microscale crystals. For LNSB2Eu, the irradiated lines are not fully crystallized because crystallization spontaneously stops during laser writing and does not restart when continuing scanning. It also requires higher energies to initiate crystallization at 100, 200, and 300 kHz. These observations indicate that LNSB2Eu is less prone to crystallization, presuming that this composition is probably more thermally stable with respect to the other investigated glasses. This aspect is confirmed by thermal characterization, as the crystallization peak Tx increases with the europium concentration (Table 1). This observation confirms that higher pulse energy is required to crystallize in LNSB2Eu compared to the three others. The constant Tg for the four glasses implies that the structural network is not depolymerized when increasing the Eu3+ concentration. The ΔT also increases with the amount of Eu3+ in the glass, demonstrating that the doped glasses have a lower tendency to crystallize during quenching from the melted glasses at 1,400°C.
The gradual increase in the Hruby criterion with Eu3+ concentration corroborates with the reduced tendency to crystallize when the Eu3+ amount increases in the glass, as the lowest KH is measured for LNSB [KH(LNSB) = 0.09] and the highest for LNSB2Eu [KH(LNSB2Eu) = 0.14]. If we suggest that the viscosity is similar at Tg for the four glasses, the stagnation of Trg at approximately 0.51 means that the viscosity values are also similar between Tg and Tm, but further works on viscosity measurements are required to fully assess this parameter. The constant Trg also indicates that the critical cooling rate for glass formation during the synthesis is similar for all four glasses made in this study.
Glass homogeneity could have a major impact on the photocrystallization process. Indeed, although we do not observe heterogeneities at the nanoscale on the investigated samples, this possibility remains possible in other parts of the irradiated samples. For example, the presence of uncrystallized regions in the irradiated spot observed in Figure 2A could be attributed to some inhomogeneities of the raw glass, the electron plasma during irradiation, or a combination thereof. As the glass is found to be less stable for the one doped with 0.5 mol% of Eu3+, we expect that the glass is more homogenous when the Eu3+ concentration is increased up to 2 mol%. This statement can be supported by the presence of self-stirring effects visible to the naked eye in the LNSB0.5Eu, which were formed during glass melting. Additional analysis, such as micro-Raman measurement on several locations of the glass sample, is required to confirm the presence of inhomogeneous areas at the microscale.
4.2 Presence of spontaneous crystallization
The spontaneous restart of crystallization is a concerning observation because it is mainly observed in only LNSB0.5Eu and LNSB1Eu. This phenomenon has already been reported in the literature while patterning LiNbO3 crystals with a continuous wave 1,080 nm laser on a NiO-doped 40Li2O–32Nb2O5–28SiO2 glass (Shimada et al., 2018). It is difficult to observe the cross sections of all the irradiated lines in the same image as crystallization is discontinuous at different places along the laser focal point propagation. LNSB0.5Eu is the sample with the most spontaneous crystallization observed. This phenomenon is tricky to fully understand, as it can result from different processes. Depending on the chemical composition, the sudden stop of crystallization might be explained by a too-high writing speed compared to the crystal growth, trapped microbubbles, or composition fluctuations coming from the glass synthesis, thus creating some instability. The restart is potentially due to pre-existing nuclei as, for example, nanoclusters induced by the Eu3+ ions or residual mechanical stress coming from quenching during the glass synthesis process. It should be noted here that LNSB0.5Eu is the least thermally stable among the doped LNSB glasses from the DSC measurements.
4.3 Effect of irradiation parameters on the crystallization process and birefringence
Phase shift variations observed in Figure 5 are attributed to an expansion of the glass due to an increase in fictive temperature (melting followed by a high quenching rate) at the focal point when heating is insufficient to trigger crystallization (Cao et al., 2018). No crystals have been observed at these low energies for the four glasses irradiated at 200 kHz. This decrease in ΔΦ without crystallization arises from the expansion of the glass that corresponds to a decrease in the density and, thus, a decrease in the refractive index.
As expected, the pulse energy plays a key role in the crystallization process, as it is one of the most important parameters on the crystallization kinetics when fixing the RR and the writing speed. A higher pulse energy yields an increase in temperature at the focal point, thus making thicker crystallized lines (Shimizu et al., 2012; Muzi et al., 2021a). The effect on the retardance is limited, as the measured values are slightly higher for low energies (between 0.55 and 0.7 µJ). Then, the retardance is relatively constant from 0.8 to 1.2 µJ (Figure 4B). The effect of the Eu3+ concentration on the birefringence is unclear, as all the values presented in Figure 4C are within the same range for constant pulse energy, except for LNSB2Eu, which is the most difficult to crystallize compared to the three other glasses.
The static step before writing the crystallized line appears to have a significant influence on the birefringence amplitude. One possible explanation is that the nucleation process is pronounced after the static step as opposed to the no static step due to the formation of a larger number of nuclei for the crystalline growth to take place, hence promoting more nanoscale crystals to be formed. The effect of the writing speed is not evaluated in this paper because it has already been demonstrated in LNSB and LNS glasses (Muzi et al., 2021a) and proven to be another important parameter for the kinetics of crystallization.
4.4 Polarization-dependent crystallization of LiNbO3:Eu3+ crystals
Polarized optical microscopy observations indicate that the orientations of the neutral axes are perpendicular and parallel to the crystallized line. With the full waveplate inserted in the light path, the blue color indicates that the slow axis of the crystallized line is parallel to the scanning direction. This observation is in agreement with previously published results on LiNbO3 nanocrystals (Cao et al., 2016b; Muzi et al., 2021a) and is attributed to the periodic orientation of the nanoscale lamella structures whose orientation depends on the fs laser polarization. As demonstrated from EDX and EELS analyses (Figures 2, 3), these nanostructures are composed of two phases with different refractive indices, a LiNbO3 crystal-rich phase alternated with a SiO2–B2O3 glass-rich phase between each lamella (both phases being partially Eu3+-doped), which produces quantitative measurable retardance depending on the fs laser polarization and thus a birefringence.
4.5 Energy-dependent crystallization and morphology
The addition of Eu2O3 to the glass composition brings some differences in the morphology of the crystallized lines. The spontaneous resumption of the crystallization discussed in Section 4.2 is one aspect of the doped glasses with 0.5 and 1 mol% Eu3+. This phenomenon, coupled with the sudden stop of crystallization during writing, makes it difficult to obtain a reproducible and homogeneous pattern of nanocrystals along the line. The circular crystallized microstructures appear mainly at moderate energies (approximately 0.6 µJ) when the energy threshold to initiate the crystallization is reached. Sometimes, the crystallized pearls do not touch each other in the periodic structure around these energies. The diameter of the pearls also evolves with the pulse energy, as the diameter increases with the energy. In that case, crystallization occurs in a successive nucleation-growth process, which produces a repeatedly circular array of “pearls” along the writing line. The difficulties in reproducibility are reported in LNS:NiO-doped glasses, as the same inhomogeneity is observed in the patterning of LiNbO3:Eu3+ crystals in LNSB:Eu2O3, but in this case, the europium oxide does not act as a nucleation agent because the thermal stability increases with the rare earth concentration up to 2 mol% Eu3+ in LNSB glass (Shimada et al., 2018).
The elongated crystalline lines are generally present at energies above 0.8 µJ. In these lines, the number of nuclei is enough to maintain the crystal growth during writing, thus making more elongated structures. According to Veenhuizen et al. (2017), they proposed a model for the crystallization process occurring at the front end of the laser beam and where the patterning depends on the spatial distribution of temperature at the focal point of the fs laser, which is proportional to the laser pulse energy. Therefore, the determination of the optimal parameters, such as writing speed, pulse energy, and RR, is crucial to obtain a regular and homogenous morphology along the crystallized line.
4.6 Nanoscale phase separation and chemical migration
Figures 2, 3 show that chemical separations occur upon fs laser irradiation. These composition fluctuations are at the origin of the nucleation-growth process, as the difference in temperature at the nanoscale between each pulse induces a chemical migration of SiO2–B2O3 toward a glass phase and Li2O–Nb2O5 to form the LiNbO3 nanocrystals. The presence of uncrystallized regions in the irradiated area (Figure 2A) is likely caused by an incomplete chemical separation, which proves the significance of controlling the temperature in the irradiated area, thus monitoring the laser pulse energy to optimize the number of nuclei for the crystal growth. This aspect has already been observed in the literature on LNS glasses (Cao et al., 2019; Cavillon et al., 2022). For a given pulse energy, the temperature is the highest in the center of the irradiated area, thus melting the glass that subsequently crystallizes during cooling by a liquid–solid transformation. In contrast, crystallization at the edge of the focal point occurs without melting the glass by a solid–solid transformation because of the temperature difference between the edge and the center of the focal point. As viscosity increases during cooling, these phenomena contribute to the formation of more lamellar nanostructures from a solid–solid transformation (Cao et al., 2017b; Fernandez et al., 2018). The presence of Eu3+ in the crystal and amorphous phases shows that Eu3+ ions do not have a preferential migration between the two regions. The presence of clusters indicates that both LiNbO3 and SiO2-B2O3 phases can accept a small quantity of Eu3+ ions. Nevertheless, the overall crystals appear slightly richer in Eu3+ ions compared to the amorphous phase, likely due to the presence of Eu3+ clusters in the irradiated area.
5 Conclusion
The synthesis of LNSB:Eu2O3-doped glasses has been successfully made with 0, 0.5, 1, and 2 mol% of Eu3+. These glasses were irradiated using a fs laser to induce photocrystallization of LiNbO3:Eu3+ crystals following different controlled parameters (pulse energy, RR, and writing polarization) in LNSB, LNSB0.5Eu, LNSB1Eu, and LNSB2Eu. The crystallization of LiNbO3:Eu3+-oriented nanogratings in volume is demonstrated. Pulse energy and RR are crucial parameters to optimize for obtaining a homogeneous crystallization pattern along the line. Energies between 0.5 and 0.7 µJ are the best values at 200 kHz to obtain homogenous and highly birefringent lines. The landscape of non-transmitted energy as a function of the RR is estimated from non-transmitted light measurements and proven to be a simple method for a preliminary estimation of the transformation domains, with an absolute error evaluated at 0.07 ± 0.06 µJ between 100 and 500 kHz.
Thermal characterizations performed on the four samples show that the glass becomes more thermally stable with increasing the europium concentration from 0.5 to 2 mol%. Thus, Eu2O3 is not acting as a nucleation agent in LNSB, making it more difficult to crystallize upon fs laser irradiation. The morphology of the crystals is determined using imaging techniques and shows that elongated or circular morphologies can be obtained along the irradiated lines depending on the laser power. It is challenging to make perfectly reproducible crystallized lines because of the sudden stop of crystallization. Polarization-dependent LiNbO3:Eu3+ nanostructures are observed in the irradiated area. STEM analysis of the nanophase compositions proves the partial clustering of Eu3+ ions and the formation of LiNbO3-doped and -undoped crystals, as well as for the SiO2–B2O3 glass phase.
Data availability statement
The original contributions presented in the study are included in the article/Supplementary Material, further inquiries can be directed to the corresponding author.
Author contributions
Synthesis, laser irradiation, investigation and data curation were made by JA. MC and BP supervised the project and funding acquisition. ML provided the equipment resources and methodology for the laser irradiation. The original draft was written by JA. All the other authors made their input. All the authors have approved the final version of the article.
Funding
This work was supported by the French National Research Agency under the program CHARMMMAT ANR-11-LABX-0039-grant.
Acknowledgments
The authors would thank Maxime Vallet and François Brisset for electronic microscopy acquisitions, David Berardan and Patrick Berthet for thermal measurements.
Conflict of interest
The authors declare that the research was conducted in the absence of any commercial or financial relationships that could be construed as a potential conflict of interest.
Publisher’s note
All claims expressed in this article are solely those of the authors and do not necessarily represent those of their affiliated organizations, or those of the publisher, the editors, and the reviewers. Any product that may be evaluated in this article, or claim that may be made by its manufacturer, is not guaranteed or endorsed by the publisher.
This manuscript was transferred from Walter De Gruyter GmbH to Frontiers Media SA. The peer review for this paper was conducted in full by Walter De Gruyter GmbH. In accordance with their peer review, editor names and reviewer names have not been published. For any queries regarding the peer review of this manuscript, please contactYWR2YW5jZWRvcHRpY3MuZWRpdG9yaWFsLm9mZmljZUBmcm9udGllcnNpbi5vcmc=.
References
Ahsan, M. S., Kim, Y. G., and Lee, M. S. (2011). Formation mechanism of nanostructures in soda–lime glass using femtosecond laser. J. Non-Crystalline Solids 357, 851–857. doi:10.1016/j.jnoncrysol.2010.11.006
Ari, J., Cavillon, M., Plantevin, O., Lancry, M., and Poumellec, B. (2022). Europium spectroscopic properties impacted by femtosecond laser 3D nanostructuring in lithium niobium borosilicate glasses. Opt. Mater. X 16, 100198. doi:10.1016/j.omx.2022.100198
Asai, T., Shimotsuma, Y., Kurita, T., Murata, A., Kubota, S., Sakakura, M., et al. (2015). Systematic control of structural changes in GeO2 glass induced by femtosecond laser direct writing. J. Am. Ceram. Soc. 98, 1471–1477. doi:10.1111/jace.13482
Beresna, M. (2016). Laser induced self-organisation: From plasma to nanostructures, photonics and fiber technology 2016 (ACOFT, BGPP, NP). Sydney: Optical Society of America. BT3B.1.
Binnemans, K. (2015). Interpretation of europium(III) spectra. Coord. Chem. Rev. 295, 1–45. doi:10.1016/j.ccr.2015.02.015
Cao, J., Lancry, M., Brisset, F., Mazerolles, L., Saint-Martin, R., and Poumellec, B. (2019). Femtosecond laser-induced crystallization in glasses: Growth dynamics for orientable nanostructure and nanocrystallization. Cryst. Growth & Des. 19, 2189–2205. doi:10.1021/acs.cgd.8b01802
C.lkjklikikao, J., Mazerolles, L., Lancry, M., Brisset, F., and Poumellec, B. (2017a). Modifications in lithium niobium silicate glass by femtosecond laser direct writing: Morphology, crystallization, and nanostructure. J. Opt. Soc. Am. B 34, 160–168. doi:10.1364/josab.34.000160
Cao, J., Mazerolles, L., Lancry, M., Solas, D., Brisset, F., and Poumellec, B. (2016b). Form birefringence induced in multicomponent glass by femtosecond laser direct writing. Opt. Lett. 41, 2739–2742. doi:10.1364/ol.41.002739
Cao, J., Poumellec, B., Brisset, F., Helbert, A.-L., and Lancry, M. (2015). Angular dependence of the second harmonic generation induced by femtosecond laser irradiation in silica-based glasses: Variation with writing speed and pulse energy. World J. Nano Sci. Eng. 5 (3), 96–106. doi:10.4236/wjnse.2015.53012
Cao, J., Poumellec, B., Brisset, F., Helbert, A.-L., and Lancry, M. (2016a). Tunable angular-dependent second-harmonic generation in glass by controlling femtosecond laser polarization. J. Opt. Soc. Am. B 33, 741–747. doi:10.1364/josab.33.000741
Cao, J., Poumellec, B., Brisset, F., and Lancry, M. (2018). Pulse energy dependence of refractive index change in lithium niobium silicate glass during femtosecond laser direct writing. Opt. Express 26, 7460–7474. doi:10.1364/oe.26.007460
Cao, J., Poumellec, B., Mazerolles, L., Brisset, F., Helbert, A. L., Surble, S., et al. (2017b). Nanoscale phase separation in lithium niobium silicate glass by femtosecond laser irradiation. J. Am. Ceram. Soc. 100, 115–124. doi:10.1111/jace.14570
Cavillon, M., Cao, J., Vallet, M., Brisset, F., Mazerolles, L., Dkhil, B., et al. (2022). Thermal and electron plasma effects on phase separation dynamics induced by ultrashort laser pulses. Crystals 12, 496. doi:10.3390/cryst12040496
Cavillon, M., Lancry, M., Poumellec, B., Wang, Y., Canning, J., Cook, K., et al. (2019). Overview of high temperature fibre Bragg gratings and potential improvement using highly doped aluminosilicate glass optical fibres. J. Phys. Photonics 1, 042001. doi:10.1088/2515-7647/ab382f
Couairon, A., Sudrie, L., Franco, M., Prade, B., and Mysyrowicz, A. (2005). Filamentation and damage in fused silica induced by tightly focused femtosecond laser pulses. Phys. Rev. B 71, 125435. doi:10.1103/physrevb.71.125435
Dai, Y., Wu, G. R., Lin, X., Ma, G. H., and Qiu, J. R. (2012). Femtosecond laser induced rotated 3D self-organized nanograting in fused silica. Opt. Express 20, 18072–18078. doi:10.1364/oe.20.018072
Eaton, S., Zhang, H., Ng, M., Li, J., Chen, W., Ho, S., et al. (2008). Transition from thermal diffusion to heat accumulation in high repetition rate femtosecond laser writing of buried optical waveguides. Opt. Express 16, 9443–9458. doi:10.1364/oe.16.009443
Fernandes, L. A., Grenier, J. R., Herman, P. R., Aitchison, J. S., and Marques, P. V. S. (2011). Femtosecond laser fabrication of birefringent directional couplers as polarization beam splitters in fused silica. Opt. Express 19, 11992–11999. doi:10.1364/oe.19.011992
Fernandez, T. T., Sakakura, M., Eaton, S. M., Sotillo, B., Siegel, J., Solis, J., et al. (2018). Bespoke photonic devices using ultrafast laser driven ion migration in glasses. Prog. Mater. Sci. 94, 68–113. doi:10.1016/j.pmatsci.2017.12.002
Gildenburg, V. B., and Pavlichenko, I. A. (2019). Grating-like nanostructures formed by the focused fs laser pulse in the volume of transparent dielectric. Opt. Lett. 44, 2534–2537. doi:10.1364/ol.44.002534
Lancry, M., Poumellec, B., Chahid-Erraji, A., Beresna, M., and Kazansky, P. (2011). Dependence of the femtosecond laser refractive index change thresholds on the chemical composition of doped-silica glasses. Opt. Mater. Express 1, 711–723. doi:10.1364/ome.1.000711
Lei, S., Zhao, X., Yu, X., Hu, A., Vukelic, S., Jun, M., et al. (2019). Ultrafast laser applications in manufacturing processes: A state of the art review. J. Manuf. Sci. Eng. 142 (3), 031005. doi:10.1115/1.4045969
Muzi, E., Cavillon, M., Lancry, M., Brisset, F., Que, R., Pugliese, D., et al. (2021a). Towards a rationalization of ultrafast laser-induced crystallization in lithium niobium borosilicate glasses: The key role of the scanning speed. Crystals 11, 290. doi:10.3390/cryst11030290
Muzi, E., Cavillon, M., Lancry, M., Brisset, F., Sapaly, B., Janner, D., et al. (2021b). Polarization-oriented LiNbO3 nanocrystals by femtosecond laser irradiation in LiO2–Nb2O5–SiO2–B2O3 glasses. Opt. Mater. Express 11, 1313–1320. doi:10.1364/ome.417461
Orazi, L., Romoli, L., Schmidt, M., and Li, L. (2021). Ultrafast laser manufacturing: From physics to industrial applications. CIRP Ann. 70, 543–566. doi:10.1016/j.cirp.2021.05.007
Shimada, M., Honma, T., and Komatsu, T. (2018). Laser patterning of oriented LiNbO3 crystal particle arrays in NiO-doped lithium niobium silicate glasses. Int. J. Appl. Glass Sci. 9, 518–529. doi:10.1111/ijag.12390
Shimizu, M., Sakakura, M., Ohnishi, M., Yamaji, M., Shimotsuma, Y., Hirao, K., et al. (2012). Three-dimensional temperature distribution and modification mechanism in glass during ultrafast laser irradiation at high repetition rates. Opt. Express 20, 934–940. doi:10.1364/oe.20.000934
Shimotsuma, Y., Miura, K., and Kazuyuki, H. (2013). Nanomodification of glass using fs laser. Int. J. Appl. Glass Sci. 4, 182–191. doi:10.1111/ijag.12034
Shimotsuma, Y., Tomura, K., Okuno, T., Shimizu, M., and Miura, K. (2020). Femtosecond laser-induced self-assembly of Ce3+-doped YAG nanocrystals. Crystals 10, 1142. doi:10.3390/cryst10121142
Smelser, C. W., Mihailov, S. J., and Grobnic, D. (2005). Formation of Type I-IR and Type II-IR gratings with an ultrafast IR laser and a phase mask. Opt. Express 13, 5377–5386. doi:10.1364/opex.13.005377
Stoian, R. (2020). Volume photoinscription of glasses: Three-dimensional micro- and nanostructuring with ultrashort laser pulses. Appl. Phys. A 126, 438. doi:10.1007/s00339-020-03516-3
Veenhuizen, K., McAnany, S., Nolan, D., Aitken, B., Dierolf, V., and Jain, H. (2017). Fabrication of graded index single crystal in glass. Sci. Rep. 7, 44327. doi:10.1038/srep44327
Xu, S., Fan, H., Li, Z.-Z., Hua, J.-G., Yu, Y.-H., Wang, L., et al. (2021). Ultrafast laser-inscribed nanogratings in sapphire for geometric phase elements. Opt. Lett. 46, 536–539. doi:10.1364/ol.413177
Yamada, K., Watanabe, W., Kintaka, K., Nishii, J., and Itoh, K. (2003). Volume grating induced by a self-trapped long filament of femtosecond laser pulses in silica glass. Jpn. J. Appl. Phys. 42, 6916–6919. doi:10.1143/JJAP.42.6916
Keywords: femtosecond laser, photosensitivity, crystallization, borosilicate glasses, optical manufacturing and design
Citation: Ari J, Cavillon M, Lancry M and Poumellec B (2023) Polarization-dependent orientation of LiNbO3:Eu3+ nanocrystals using ultrashort laser pulses in borosilicate glasses. Adv. Opt. Technol. 12:1237570. doi: 10.3389/aot.2023.1237570
Received: 09 June 2023; Accepted: 13 June 2023;
Published: 25 July 2023.
Copyright © 2023 Ari, Cavillon, Lancry and Poumellec. This is an open-access article distributed under the terms of the Creative Commons Attribution License (CC BY). The use, distribution or reproduction in other forums is permitted, provided the original author(s) and the copyright owner(s) are credited and that the original publication in this journal is cited, in accordance with accepted academic practice. No use, distribution or reproduction is permitted which does not comply with these terms.
*Correspondence: Maxime Cavillon, bWF4aW1lLmNhdmlsbG9uQHVuaXZlcnNpdGUtcGFyaXMtc2FjbGF5LmZy