
94% of researchers rate our articles as excellent or good
Learn more about the work of our research integrity team to safeguard the quality of each article we publish.
Find out more
ORIGINAL RESEARCH article
Front. Adolesc. Med. , 09 July 2024
Sec. Obesity and Nutrition in Adolescents
Volume 2 - 2024 | https://doi.org/10.3389/fradm.2024.1329731
 Awol Assen Ali1*
 Dessalegn Tamiru Adugna2
 Wolde Melese Ayele3
 Sisay Eshete Tadesse4
 Tefera Chane Mekonnen4
 Muluken Amare Wudu5*
Background: Adolescence is a critical stage of human growth and development, and adolescent nutritional status is a significant predictor of health outcomes. However, adolescents in developing countries, including Ethiopia, have received little attention from nutrition-related programs in recent decades. Consequently, malnutrition among adolescents is a widespread issue in these regions.
Objective: The study aimed to identify the determinants of thinness among school adolescents in the Legehida district of South Wollo Zone, Northeastern Ethiopia.
Methods: A school-based, unmatched case-control study was conducted from January 20 to February 2, 2019. A total of 525 school-aged adolescents (175 cases and 350 controls) from the Legehida district were enrolled using a multistage sampling technique. Data were collected through interview-administered questionnaires and anthropometric measurements. EpiData version 3.1 was used for data entry, while Anthroplus software was employed for anthropometric measurement entry and analysis. The data were then exported to SPSS version 25 for further analysis. Bivariate and multivariable logistic regression analyses were performed to assess the determinants of adolescent thinness.
Results: In this study, thinness among school adolescents was significantly associated with several factors: the absence of a latrine at home [AOR = 8.2, 95% CI (3.8, 8.17)], meal skipping per day [AOR = 3.1, 95% CI (1.2, 7.3)], inadequate consumption of fruits and vegetables [AOR = 7.5, 95% CI (3.9, 14.5)], having more than four household members [AOR = 13.6, 95% CI (7.1, 26)], and the consumption of unsafe water [AOR = 7.7, 95% CI (3.8, 15.6)].
Conclusions and recommendations: The absence of latrines and access to clean water, dietary factors, and family size emerged as significant contributors to adolescent thinness in this study. Addressing the nutritional challenges faced by adolescents will require collaborative efforts across sectors.
Adolescence represents a pivotal phase of human growth and development characterized by rapid physical, psychosocial, and intellectual changes (1). Spanning from ages 10–19, adolescence marks the transition from dependent childhood to independent adulthood (2). During this period, adolescents experience significant increases in their nutritional requirements, leading to approximately 50% of their adult weight gain, over 20% of their adult height growth, and 50% of their adult bone mass accrual (3, 4).
Adolescence presents a heightened vulnerability to malnutrition owing to increased nutritional demands (5). Consequently, suboptimal nutritional status during these formative years serves as a critical determinant of health outcomes, encompassing a spectrum of needs and challenges (6). Adolescent thinness, characterized by a Body Mass Index-for-age Z-score (BAZ) below −2 standard deviations using WHO Anthroplus software (7), occurs when individuals fail to intake adequate nutrients to meet energy, growth, and immune system maintenance requirements, or when they metabolize or excrete nutrients at a rate exceeding replenishment capacity (8).
Adolescent thinness represents a significant global health challenge, ranking among the leading causes of morbidity and mortality among teenagers, particularly prevalent in Southeast Asia and sub-Saharan Africa (9, 10). With over 200 million school-aged adolescents worldwide classified as underweight, it is evident that adolescents have been largely overlooked on the public health agenda in developing nations (11). Despite a slight reduction in the global prevalence of thinness among adolescent girls from 10% in 2014 to 8.4% in 2018, the overall rates have remained relatively stable over the past decade (12). Without intervention, projections suggest that this figure could nearly double by 2020, with 90% of affected individuals residing in 36 countries, including Ethiopia (5). In Ethiopia, children and adolescents comprise approximately 48% of the population, with adolescents alone accounting for 25% (13).
Ethiopia faces a significant challenge regarding adolescent thinness, with a prevalence that is projected to increase in the future (14). Studies conducted in various regions of Ethiopia, such as Tehuledere district and Chiro Town, have reported prevalence rates of underweight among adolescents ranging from 7.2% to 26.5% and 24.4%, respectively (15, 16). Similarly, research conducted in Mekele, Ethiopia, revealed that 37.8% of the study participants were classified as thin (17). Additionally, the Amhara region stands out as having the highest concentration of Ethiopia's poorest-performing zones (18).
Adolescent thinness exerts detrimental effects on both cognitive and physical development in children (19). It can impede physical growth, hinder motor and cognitive development, diminish concentration levels, and undermine their receptiveness and productivity (20, 21). Moreover, thinness exacerbates the challenges associated with teenage pregnancies. When coupled with inadequate adolescent nutrition, it heightens the risk of anemia, birth complications, maternal mortality, preterm birth, low birth weight, and poor health outcomes for the child (17, 22). Additionally, being underweight compromises immunity, rendering individuals more susceptible to infections and prolonging the recovery time from various illnesses (23).
Various studies have documented that adolescent thinness is influenced by a range of determinants, including sociodemographic factors, economic factors, environmental conditions, WASH (Water, Sanitation, and Hygiene) factors, and access to reproductive health services (3, 7, 17, 24–27).
While undernutrition has decreased in Ethiopia over the last two decades, the prevalence remains high. To confront this issue, the Ethiopian government has integrated adolescent nutrition into the second phase of the National Nutrition Program II (14).
While numerous cross-sectional studies have been conducted, there is limited evidence identifying determinants in a case-control design, especially in Ethiopia. Additionally, no documented evidence exists in the study area. Therefore, this study aimed to address methodological and informational gaps in the study area and raise awareness among local health, community, and educational managers regarding adolescent undernutrition. It also sought to provide recommendations for intervention. Consequently, the study aimed to identify determinants of thinness among school adolescents in the Legehida district of the South Wollo Zone, northeastern Ethiopia.
A school-based unmatched case-control study design was conducted from January 20 to February 2, 2019, in the Legehida district, situated within the South Wollo Zone, one of the 22 woredas in the region. The district is positioned approximately 547 km north of Addis Ababa and 593 km south of Bahirdar, the national and regional state capitals, respectively. Its geographical coordinates are latitude 10°42′ 10.43′′ N and longitude 39°16′ 9.73′′ E, with an elevation ranging from 1,646 to 3,368 m above sea level. Agriculture serves as the primary economic activity in the area. According to Ethiopian population projections for 2018, the woreda had a total population of 78,048 individuals, with 39,333 being females. Data from the Woreda Education Office indicate the presence of one preparatory school, two high schools, and 31 elementary schools in the area, with a total enrollment of 9,003 male students and 8,655 female students during the 2018–2019 academic year. Among these students, 7,007 were male and 8,011 were female adolescents.
The study population for these cases consisted of school-attending adolescent students aged 10–19 who were thin (BAZ < −2SD) during the study period. However, the study population for controls comprised school-attending adolescent students aged 10–19 years who were not thin (BAZ −2SD to +1SD).
All school-attending adolescent students in this district, aged 10–19, who were thin (BAZ < −2SD) enrolled as cases. All school-attending adolescent students in this district, aged 10–19, who were not thin (BAZ −2SD to +1SD) enrolled as controls. Participants with physical impairments (kyphosis and scoliosis) and female adolescents who were pregnant at the time of data collection, on the other hand, were excluded from the actual study.
The sample size was calculated using the StatCalc menu of Epi Info version 7.2.5 statistical software for an unmatched case-control study. The following assumptions were applied: a 95% confidence level, an 80% power, and a case-to-control ratio of 1:2. The percentages of cases and controls with family sizes greater than 5 (19.68% and 7.81%, respectively) were obtained from a study conducted in Mekelle City, northern Ethiopia (6). With the aforementioned assumptions, the initial sample size was determined to be 317. After incorporating a 10% non-response rate, the adjusted sample size became 349. Considering a design effect of 1.5, the final sample size was calculated as 525, comprising 175 cases and 350 controls.
A multistage sampling technique was employed to select study participants. In the woreda, there are a total of 34 schools, consisting of 31 primary schools, 2 secondary schools, and one preparatory school. From these, a subset of 10 schools (eight primary, two secondary, and one preparatory school) was randomly selected, totaling 4,513 adolescent students. Before identifying study participants, screening was conducted among these ten schools to distinguish between cases and controls. During the preliminary survey conducted in all selected schools, a total of 785 cases and 3,434 controls were identified. Study participants were allocated proportionally for both cases and controls. A sampling frame was developed after conducting screening (a preliminary survey) for both cases and controls, utilizing identification numbers in each selected school independently. From each selected school, participants were chosen using simple random sampling techniques, facilitated by a table of random number generation (attached) through ENA for SMART software, based on the screening frame available in each selected school.
All adolescents in the age group of 10–19 years of age (28).
Early adolescents encompass individuals aged 10–13 years; middle adolescents consist of those aged 14–16 years; and late adolescents include individuals aged 17–19 years (17).
According to WHO standards for the adolescent age group, a BMI-for-age score below −2Z is considered indicative of thinness (9).
All adolescents in the age group of 10–19 years who were thin (BAZ < −2SD).
All adolescents in the age group of 10–19 years who were not thin (BAZ −2SD to +1SD).
Tap water, public taps, and protected wells were classified as safe water sources, whereas unprotected springs, wells, and rivers were categorized as unsafe sources (17).
Adolescents scoring below the median value on the dietary diversity score (≤3 food groups) were classified as having low dietary diversity (7). Those scoring between 4 and 6 food groups were categorized as having medium dietary diversity (7). Lastly, adolescents scoring between 7 and 9 food groups were considered to have high dietary diversity (7).
Thinness (yes/no).
Age, sex, parent's education, parental occupation, family size, marital status, grade level, living with whom, sex of house hold sex.
Type of drinking water, latrine availability, latrine utilization, hand washing practice and frequency.
Meal frequency, food items consumed, dietary diversity.
The tool was adapted from UNICEF's Adolescents Health in Low- and Middle-Income Countries (29), along with several other relevant literature sources (1, 5, 19, 30), and subsequently contextualized and modified as necessary. It comprised more than five sections aimed at assessing the determinants of thinness among school-age adolescents in the Legehida district. Data were collected through interviewer-administered questionnaires and direct measurements of anthropometric data. The study involved 10 BSc public health officers and 4 MPH nutrition supervisors.
Section one consisted of 14 items, encompassing various sociodemographic factors of adolescent participants, such as age, sex, marital status, and educational status, as well as details regarding their family's sociodemographic profile and size.
Part two involved anthropometric measurements conducted on the school grounds. A digital Seca weight scale, precise to the nearest 0.1 kg (SECA Germany), was utilized to measure weight. To ensure privacy, participants wore light clothing and no shoes during the weight measurement process. Each adolescent's weight was measured and recorded twice, with any variance between the two measurements carefully noted. If the difference between the two weights (weight1 and weight2) exceeded 0.5, both measurements were excluded, and the procedure was repeated. Otherwise, the average of the two measurements was used for analysis. Similarly, height was measured to the nearest 0.1 cm using a stadiometer (SECA Germany). Participants stood barefoot on the measuring board in a standard anatomical position, ensuring that their heels, buttocks, shoulders, and the back of their head were in contact with the board. The flat headband of the board was positioned against the crown of the head, forming a 90-degree angle. This height measurement procedure mirrored the process outlined for weight measurement. Subsequently, the WHO Anthro-Plus software was employed to calculate the z-score value for BMI-for-age. The new WHO 2007 cutoff point was utilized to classify adolescent thinness based on the calculated z-score of BMI-for-age. Adolescents falling below < −2SD were categorized as undernourished (cases), while those within the range of −2 SD to +1 SD were classified as controls.
Part three involved collecting dietary data from each adolescent for the preceding 24 h. Specifically, the types of food consumed from each of the nine food groups were recorded. If an adolescent's diet included a particular food group, it was noted as one [1]; conversely, if they did not consume any food from that group, it was recorded as zero [0]. Dietary diversity was computed by summing the values of one across all food groups. Based on this calculation, dietary diversity was categorized as low, medium, or high DDS.
Part four comprised eight items focusing on water sanitation, including aspects such as water source, latrine availability, and hand hygiene practices. Part five centered on healthcare experiences and consisted of seven items. Additionally, it assessed lifestyle habits, particularly alcohol consumption and exercise.
The questionnaires were initially drafted in English and then translated into Amharic before being translated back into English to ensure consistency. Data collectors and supervisors underwent a one-day training session covering topics such as confidentiality, respondents' rights, obtaining informed consent, the study's objectives, interview techniques, and questionnaire completion. Throughout the data collection process, both the supervisor and principal investigator ensured the thoroughness of data collection and conducted immediate inspections following data gathering. Additionally, each adolescent's anthropometric measurements were meticulously calibrated, with the weight scale being calibrated and two measurements taken for each individual. During height measurement, participants were instructed to refrain from wearing shoes, capes, or any head ornaments.
The data were entered into EpiData version 3.1 and then exported to SPSS version 25 for analysis. Anthropometric data were used to determine BAZ, which was analyzed using WHO Anthroplus software. Frequency and percentage were employed for categorical variables. To investigate factors associated with thinness, a binary logistic regression model was utilized. Variables with p-values < 0.25 in the bivariate analysis were included in the multivariate analysis. In the multivariable analysis, the adjusted odds ratio (AOR) with a 95 percent confidence interval was used to assess the strength of the association, with a p-value of < 0.05 considered statistically significant. Furthermore, multicollinearity was assessed. The goodness of fit for the final logistic model was evaluated using the Hosmer and Lemshow tests, which yielded non-significant results, indicating a good fit. However, the Omnibus test was significant, indicating overall model significance.
All participants (525 in total) provided complete responses, resulting in a response rate of 100%. Females comprised 110 (62.9%) of the cases and 203 (58%) of the controls. Regarding the education level of the respondents' fathers, 34.9% of cases and 36.6% of controls were unable to read and write. Additionally, the majority of fathers in both cases (68%) and controls (72.3%) were farmers. Furthermore, more than half of the cases (79.5%) involved families with more than four members. Moreover, the majority of participants in both cases (81.1%) and controls (81.1%) were in grades 5th to 8th, respectively (Table 1).
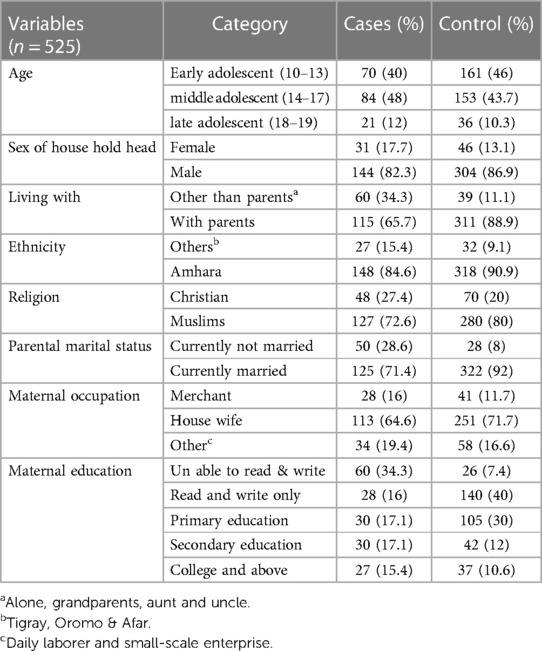
Table 1 Socio-demographic characteristics of school adolescent in Legehida district, 2019 (N = 525).
Eighty-four percent (147) of cases and 35.7% (125) of controls reported drinking unprotected water. The majority of participants—52% (91) of cases and 88.6% (310) of controls—reported having a latrine at home; however, proper latrine usage was observed in only 80% (140) of cases and 11.7% (41) of controls. Additionally, handwashing facilities were available to 49.1% (86) of cases and 88.6% (310) of controls; however, handwashing after restroom use was reported by only 28.6% (50) of cases and 89.4% (313) of controls (Table 2).
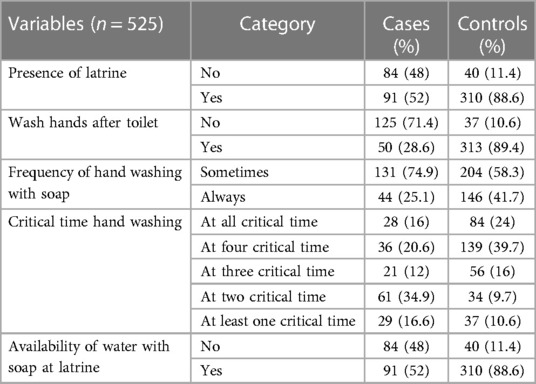
Table 2 Water source, sanitation and hygiene characteristics of school adolescent students in Legehida district, 2019.
Sixty percent (160) of cases and 93.4% (327) of controls had visited a health facility, with nutritional counseling being received by only 16% (28) of cases and 55.1% (193) of controls. Regarding physical activity, 85.7% (150) of cases and 90% (315) of controls reported walking for at least thirty minutes per day on a daily basis.
Among the total participants, 41% of cases and 59% of controls achieved a medium or higher dietary diversity score (Figure 1). However, the vast majority of participants—83% of cases (146) and 31% of controls (109)—did not report consuming milk or milk products. Additionally, 78% of cases (137) and 73% of controls (256) did not consume organ meat, while 76% of cases (133) and 56% of controls (195) did not consume eggs. Surprisingly, none of the respondents reported being part of a school feeding program (Table 3). In terms of meal frequency, 80% of cases (140) and 93.1% of controls (326) consumed meals three or more times within a 24-hour period, respectively. Notably, the most commonly skipped meal during this period was dinner among cases (36%, 63) and snacks among controls (61.1%, 214) (Table 4).
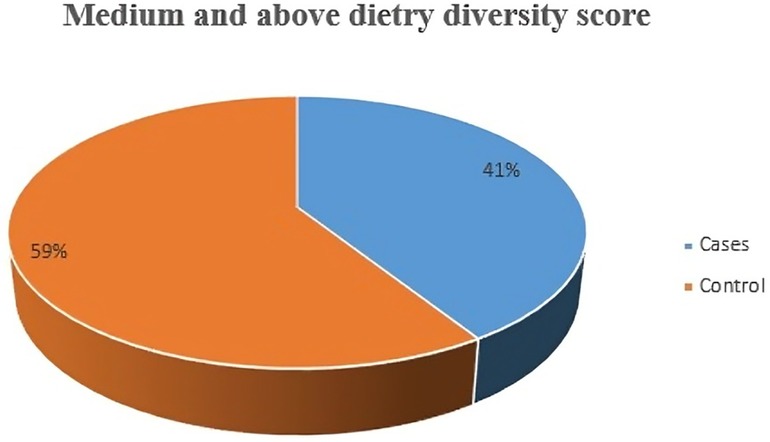
Figure 1 Medium and above dietary diversity score characteristics among school adolescents Legehida district, 2019 (N = 525).
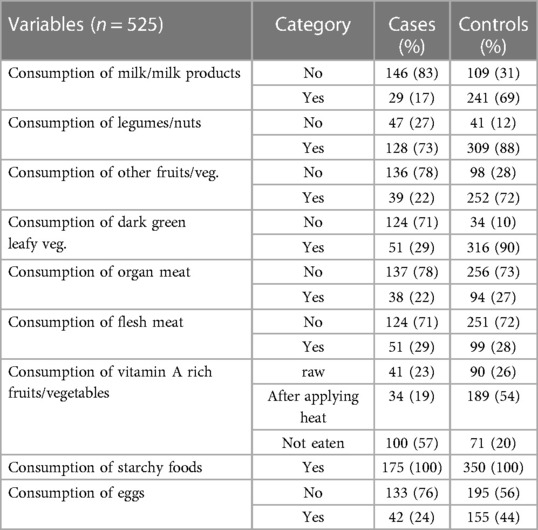
Table 3 Dietary diversity consumption of adolescent students of legehida district, 2019.
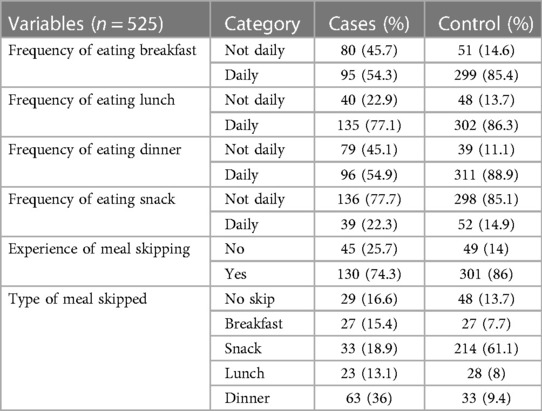
Table 4 Dietary characteristics of adolescent students in Legehida district, 2019 (N = 525).
In the binary logistic regression analysis, maternal education status, latrine ownership, meal skipping, consumption of other fruits and vegetables, meal frequency per day, source of drinking water, and family size were identified as candidates for multivariable logistic regression analysis. Subsequently, not having a latrine, meal skipping, not consuming other fruits and vegetables, having more than four family members, and having an unprotected water source remained determinants of thinness in the multivariable logistic regression analysis among adolescents attending school in the study area (Table 5).
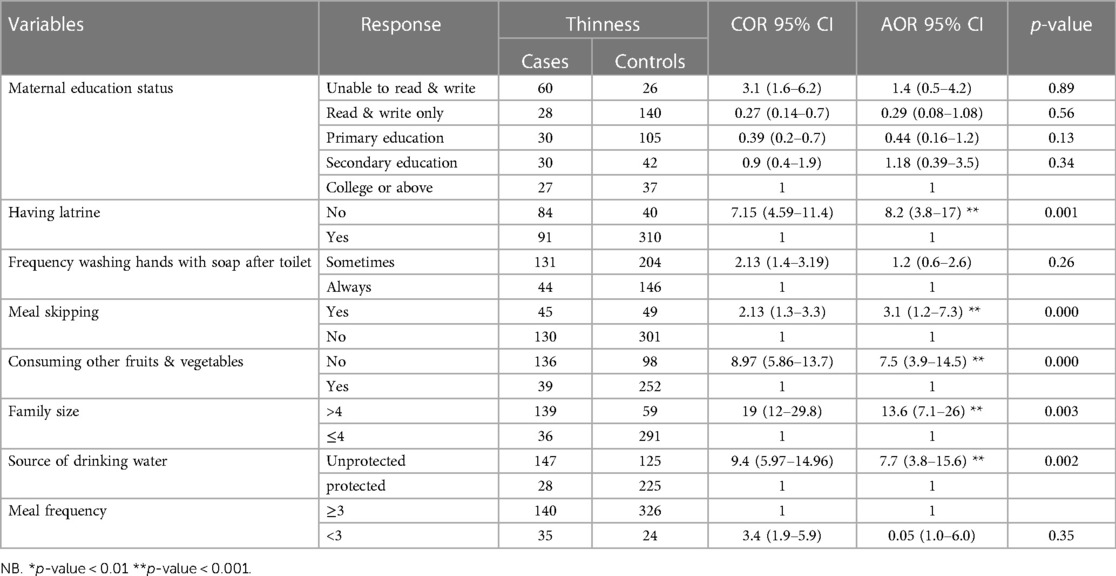
Table 5 Bivariate and multivariable logistic regression model predicting the odds of thinness among school adolescents in Legehida district, 2019 (N = 525).
Participants who did not have a latrine at home were eight times more likely to be thin than their counterparts [AOR = 8.2, 95% CI (3.8, 17)]. Moreover, those who skipped one meal per day were three times more likely to be thin than those who did not experience meal skipping during adolescence [AOR = 3.1, 95% CI (1.2, 7.3)]. Additionally, participants who did not consume fruits and vegetables were nearly eight times more likely to be thin than their counterparts [AOR = 7.5, 95% CI (3.9, 14.5)]. Those from families with more than four members were at most fourteen times more likely to be thin than those with less than or equal to four family members [AOR = 13.6, 95% CI (7.1, 26)]. Lastly, participants who consumed water from an unimproved source were nearly eight times more likely to be susceptible to thinness than their counterparts [AOR = 7.7, 95% CI (3.8, 15.6)] (Table 5).
Ethiopia has made significant progress in reducing both maternal and infant mortality in recent years. While these achievements are commendable, sustainable long-term outcomes cannot be expected if the nutritional status of adolescents is overlooked, particularly in the study area. Therefore, this study aimed to identify the determinants of thinness among school-attending adolescents compared to their normal-weight peers. The findings revealed that the absence of a latrine, meal skipping, insufficient consumption of fruits and vegetables, living in households with more than four members, and using unprotected water sources were key determinants of thinness.
In this study, the absence of a latrine facility at home was significantly associated with thinness among school adolescents, who were more likely to be thin. However, contrary findings were reported from Sri Lanka, Dangila (northwest Ethiopia), and the Somali region (20, 31, 32). This disparity could be attributed to differences in socioeconomic status and study settings. This study primarily selected schools from rural areas, whereas the aforementioned studies included relatively more urban schools. The lack of a latrine at home often leads to open defecation, exacerbating poor sanitation and hygiene conditions. These factors facilitate disease transmission, resulting in fecal-oral diseases such as recurrent diarrhea, which causes nutritional malabsorption. Additionally, the prevalence of intestinal worms may be higher, reducing appetite and nutrient uptake, thus worsening thinness. In contrast, the results from the other studies might reflect poor socioeconomic conditions rather than the absence of latrines at home. This suggests that addressing undernutrition requires multisectoral efforts focusing on both sanitation and broader socioeconomic factors.
The findings of this study indicated that adolescents who skipped meals daily were more likely to be thin compared to their peers, consistent with studies from Wolaita Sodo, Adwa, and Mekelle City (2, 17, 30). This similarity may be due to the fact that skipping meals results in insufficient nutritional intake. Additionally, adolescence is a period of rapid growth and development, which increases dietary requirements and exacerbates the problem of thinness among adolescents.
This study found that adolescents living in households with more than four members were more likely to be thin compared to those in households with four or fewer members. This result aligns with studies conducted in East Wollega and Adwa City (5, 30). The likely reason is that a larger number of household members can compromise food security, leading to reduced food availability and attention for each individual. This suggests that, without ensuring food security, population growth can lead to multiple issues, including poor health outcomes. However, a study from Bangladesh reported contrary findings (33). This discrepancy may be due to differences in socioeconomic status, particularly in agricultural production, which ensures better food security in Bangladesh.
This study found that adolescents who drank water from unprotected sources were more likely to be thin than their peers. This finding is consistent with studies conducted in Goba, Adama, the Somali region, and Adwa (1, 28, 30, 32). The intake of impure water can lead to intestinal worm infections, which decrease appetite and consequently result in poor nutritional status either directly or indirectly. Furthermore, poor environmental sanitation and cleanliness are primary causes of malnutrition. Therefore, improving access to clean water can help address food security and various health issues, including undernutrition.
The current study reveals that adolescent students who did not consume fruits and vegetables were more likely to be thin than those who did, consistent with findings from studies in Wolaita Sodo and Mekelle City (2, 17). This similarity can be explained by the fact that fruits and vegetables are rich in various nutrients essential for disease prevention. Insufficient intake of these foods can weaken immunity and lead to various infections, which may directly or indirectly cause thinness. These findings highlight the importance of intensive community-based behavioral change activities focused on increasing fruit and vegetable consumption. However, findings from Aksum City contradict this (34). This discrepancy might be due to the fact that consuming fruits and vegetables alone, without adequate protein and carbohydrate-rich foods, does not necessarily prevent undernutrition.
In the current study, the absence of a latrine facility at home, daily meal skipping, insufficient consumption of fruits and vegetables, living in households with more than four members, and using an unsafe source of drinking water were independently associated with an increased rate of thinness among school-aged adolescents. Local water and energy managers, as well as those in the agricultural sector, should focus on improving safe water coverage and utilization in all targeted kebeles according to the standard. Additionally, encouraging diverse food production and consumption in every household is crucial. Community and facility-based health promotion and behavioral change activities related to diet diversity, latrine availability, and family planning should also be strengthened and improved by local health managers. Moreover, school administrators should initiate a school feeding program, integrate nutrition education into the curriculum, and establish nutrition clubs to enhance students' awareness and attitudes toward nutrition. Lastly, future researchers should conduct both interventional and qualitative studies to further explore these issues.
The authors used the Switchboard, a peer-reviewed and validated survey tool, to conduct a preliminary survey (screening) to identify both cases and controls, working with more than ten public schools. However, the study had limitations, including not measuring the quantity and quality of food items consumed by adolescents and being school-based, which limits its generalizability to adolescents outside of school. Therefore, conducting interventional follow-up studies and qualitative research will help address these limitations.
The raw data supporting the conclusions of this article will be made available by the authors, without undue reservation.
The studies involving humans were approved by Wollo University College of Medicine and Health Sciences Ethical Review Committee (ERC). The studies were conducted in accordance with the local legislation and institutional requirements. Written informed consent for participation in this study was provided by the participants’ legal guardians/next of kin.
AA: Conceptualization, Data curation, Formal Analysis, Funding acquisition, Investigation, Methodology, Project administration, Resources, Software, Supervision, Validation, Visualization, Writing – original draft, Writing – review & editing. DA: Data curation, Investigation, Methodology, Project administration, Supervision, Writing – review & editing. WA: Project administration, Supervision, Writing – review & editing. ST: Data curation, Formal Analysis, Methodology, Software, Supervision, Validation, Writing – review & editing. TM: Data curation, Investigation, Methodology, Software, Supervision, Validation, Writing – review & editing. MW: Formal Analysis, Methodology, Writing – review & editing.
The author(s) declare financial support was received for the research, authorship, and/or publication of this article.
Institutional support from Legehida District Schools and Wollo University.
The authors would like to thank the Legehida district school managers, the health unit managers, and the participants families for their kind cooperation. The authors are also thankful to the data collectors and the study participants.
The authors declare that the research was conducted in the absence of any commercial or financial relationships that could be construed as a potential conflict of interest.
All claims expressed in this article are solely those of the authors and do not necessarily represent those of their affiliated organizations, or those of the publisher, the editors and the reviewers. Any product that may be evaluated in this article, or claim that may be made by its manufacturer, is not guaranteed or endorsed by the publisher.
AOR, adjusted odds ratio; BAZ, body mass index for age Z-score; BMI, body mass index; CI, confidence interval; COR, crude odds ratio; SD, standard deviation; UNICEF, United Nations International Children's Educational Fund; WASH, water sanitation and hygiene; WHO, World Health Organization.
1. Roba KT, Abdo M. Nutritional status and its associated factors among school adolescent girls in Adama city, central Ethiopia. J Nutr Food Sci. (2016) 6(3):4–11. doi: 10.4172/2155-9600.1000493
2. Teferi DY, Atomssa GE, Mekonnen TC. Overweight and undernutrition in the cases of school-going adolescents in Wolaita Sodo town, southern Ethiopia: cross-sectional study. J Nutr Metab. (2018) 2018:1–10. doi: 10.1155/2018/8678561
3. Berhe AK. Associated factors for adolescent under nutrition in Ethiopia: a systematic review and meta-analysis. J Heal Med Nurs. (2018) 50:21–30. doi: 10.1186/s40795-019-0309-4
4. Yemaneh Y, Girma A, Niguse W, Hailu D, Alemayehu T, Mesfin F, et al. Under nutrition and its associated factors among adolescent girls in rural community of Aseko district, eastern Arsi zone, Oromia region, eastern Ethiopia, 2017. Int J Clin Obstet Gynaecol. (2017) 1(2):17–26. doi: 10.33545/gynae.2017.v1.i2a.10
5. Bidu KT, Hailemariam T, Negeri EL. Prevalence and associated factors of undernutrition among school adolescents in Gobu Seyo district, east Wollega zone, Oromia regional state of west Ethiopia, 2016. J Public Heal Epidemiol. (2018) 10(July):251–69. doi: 10.5897/JPHE2018.1011
6. Di M, Mk H, Sharma K, Dk M, Shakya R. Prevalence of underweight, stunting and thinness among adolescent girls in Kavre district. J Nepal Paediatr Soc. (2015) 35(2):129–35. doi: 10.3126/jnps.v35i2.12794
7. Assefa H, Belachew T, Negash L. Socioeconomic factors associated with underweight and stunting among adolescents of Jimma zone, south west Ethiopia: a cross-sectional study. ISRN Public Heal. (2013) 2013:1–7. doi: 10.1155/2013/238546
8. Marr K. Prevalence of stunting and thinness among adolescents in rural area of Bangladesh. J Asian Sci Res. (2014) 4(1):39–46. https://archive.aessweb.com/index.php/5003/article/view/3597
9. Kanimozhy K, Vishnu Prasad R. Nutritional status and its determinants among selected polytechnic college students in Puducherry: a cross sectional study. Glob J Med PUBLIC Heal. (2014) 3:1–5. ISSN: 2277-9604
10. Pal A, Pari AK, Sinha A, Dhara PC. Sciencedirect prevalence of undernutrition and associated factors: a cross-sectional study among rural adolescents in West Bengal, India. Int J Pediatr Adolesc Med. (2017) 4(1):1–11. doi: 10.1016/j.ijpam.2016.08.009
11. Patton GC, Sawyer SM, Santelli JS, Ross DA, Afifi R, Allen NB, et al. Our future: a lancet commission on adolescent health and wellbeing. Lancet. (2016) 387:2423–78. doi: 10.1016/S0140-6736(16)00579-1
12. Christian P, Smith ER. Adolescent undernutrition: global burden, physiology, and nutritional risks. Ann Nutr Metab. (2018) 72:316–28. doi: 10.1159/000488865
13. Dubbale Daniel A, Tsutsumi J, Bendewald MJ. Urban environmental challenges in developing cities: the case of Ethiopian capital Addis Ababa. Int J Environ Ecol Eng. (2010) 4(6):164–9. doi: 10.5281/zenodo.1079392
14. HEALTH FMO. Federal democratic republic of Ethiopia nutrition national program 2016–2020. Gov Ethiop Natl Nutr Progr. (2016) 3(July 2016):1–87.
15. Tadesse AW, Menber Y. Prevalence of and associated factors of stunting among adolescents in Tehuledere district, north east Ethiopia, 2017. J Clin Cell Immunol. (2018) 9(2):1–8. doi: 10.4172/2155-9899.1000546
16. Damie TD, Wondafrash M. Nutritional status and associated factors among school adolescent in chiro town, west Hararge, Ethiopia. Gaziantep Med J. (2015) 21(1):32–42. doi: 10.5455/GMJ-30-169505
17. Gebremariam H, Seid O, Assefa H. Assessment of nutritional status and associated factors among school going adolescents of Mekelle city, northern Ethiopia. Int J Nutr Food Sci. (2015) 4(1):118–24. doi: 10.11648/j.ijnfs.20150401.26
18. Kebede D, Prasad RPCJ, Asres DT, Aragaw H, Worku E. Prevalence and associated factors of stunting and thinness among adolescent students in Finote Selam town, northwest Ethiopia. J Health Popul Nutr. (2021) 40:44. doi: 10.1186/s41043-021-00269-4
19. Zerihun E, Id T, Abebe GA, Melketsedik ZA. Prevalence and factors associated with stunting and thinness among school-age children in Arba Minch health and demographic surveillance site, southern. PLoS One. (2018):1–12. doi: 10.1371/journal.pone.0206659
20. Demilew YM, Emiru AA. Under nutrition and associated factors among school adolescents in Dangila town, northwest Ethiopia: a cross sectional study. Afr Health Sci. (2018) 18(3):756–66. doi: 10.4314/ahs.v18i3.34
21. Mulugeta A, Hagos F, Stoecker B, Kruseman G, Linderhof V, Abraha Z. Nutritional status of adolescent girls from rural communities of Tigray, northern Ethiopia. Ethiop J Health Dev. (2009) 23(1):5–11. doi: 10.4314/ejhd.v23i1.44831
22. Cusick SE, Kuch AE. Determinants of undernutrition and overnutrition among adolescents in developing countries. HHS Public Access. (2017) 23(3):440–56. 5577917.
23. Takele WW, Muche AA, Mekonnen ZA, Ambaw YF, Wagnew F. Undernutrition and its determinants among Ethiopian adolescent girls: a protocol for systematic review and meta- analysis. BMJ Open. (2019) 9:1–5. doi: 10.1136/bmjopen-2018-026718
24. Chesire EJ, Orago ASS, Oteba LP, Echoka E. Determinants of under nutrition among school age children in a Nairobi peri-urban slum. East Afr Med J. (2020) 85(October 2008):471–9. doi: 10.4314/eamj.v85i10.9671
25. Degarege D, Degarege A, Animut A. Undernutrition and associated risk factors among school age children in Addis Ababa, Ethiopia. BMC Public Health. (2015) 15:375. doi: 10.1186/s12889-015-1714-5
26. Mesfin F, Berhane Y, Worku A. Prevalence and associated factors of stunting among primary school children in eastern Ethiopia. Nutr Diet Suppl. (2015) 7(November):61–8. doi: 10.2147/NDS.S80803
27. Degarege D, Degarege A, Animut A. Undernutrition and associated risk factors among school age children in Addis Ababa, Ethiopia. BMC Public Health. (2015) 15:1–9. doi: 10.1186/s12889-015-1714-5
28. Tegegne M, Sileshi S, Assefa T, Kalu A. Nutritional status and associated factors of adolescent school girls, Goba town, southeast Ethiopia. Glob J Med Res L Nutr Food Sci. (2016) 16(1):1–9. ISSN: 2249-4618
29. Azzopardi P, Kennedy E, Patton G. Data and Indicators to Measure Adolescent Health, Social Development and Well-being. Innocenti Research Briefs 2017-04; Methods: Conducting Research with Adolescents in Low- and Middle-Income Countries, no. 2, UNICEF Office of Research – Innocenti, Florence (2017).
30. Gebregyorgis T, Tadesse T, Atenafu A. Prevalence of thinness and stunting and associated factors among adolescent school girls in Adwa town, north Ethiopia. Int J Food Sci. (2016) 2016:1–9. doi: 10.1155/2016/8323982
31. Galgamuwa LS, Iddawela D, Dharmaratne SD, Galgamuwa GLS. Nutritional status and correlated socio-economic factors among preschool and school children in plantation communities, Sri Lanka. Public Health. (2017) 17(377):1–11. doi: 10.1186/s12889-017-4311-y
32. Awel AA, Lema TB, Hebo HJ. Nutritional status and associated factors among primary school adolescents of pastoral and agro- pastoral communities, Mieso Woreda, Somali region, Ethiopia: a comparative cross-sectional study. J Public Heal Epidemiol. (2016) 8(November):297–310. doi: 10.5897/JPHE2016.0824
33. Leroy JL, Ruel M, Sununtnasuk C, Ahmed A. Understanding the determinants of adolescent nutrition in Bangladesh. Ann N Y Acad Sci. (2018) 1416(8923):18–30. doi: 10.1111/nyas.13530
Keywords: determinants, thinness, school adolescents, dietary diversity, Legehida district, Northeastern Ethiopia
Citation: Ali AA, Adugna DT, Ayele WM, Tadesse SE, Mekonnen TC and Wudu MA (2024) Determinants of thinness among school adolescents in Legehida district, Amhara region, north east Ethiopia: an unmatched case-control study. Front. Adolesc. Med. 2:1329731. doi: 10.3389/fradm.2024.1329731
Received: 29 October 2023; Accepted: 20 June 2024;
Published: 9 July 2024.
Edited by:
Sadiq Hussain, Dibrugarh University, IndiaReviewed by:
Navoda Atapattu, Lady Ridgeway Hospital for Children, Sri Lanka© 2024 Ali, Adugna, Ayele, Tadesse, Mekonnen and Wudu. This is an open-access article distributed under the terms of the Creative Commons Attribution License (CC BY). The use, distribution or reproduction in other forums is permitted, provided the original author(s) and the copyright owner(s) are credited and that the original publication in this journal is cited, in accordance with accepted academic practice. No use, distribution or reproduction is permitted which does not comply with these terms.
*Correspondence: Awol Assen Ali, YXdvbGhhc3NlbjRAZ21haWwuY29t; Muluken Amare Wudu, Mzg1bXVsZUBnbWFpbC5jb20=
Disclaimer: All claims expressed in this article are solely those of the authors and do not necessarily represent those of their affiliated organizations, or those of the publisher, the editors and the reviewers. Any product that may be evaluated in this article or claim that may be made by its manufacturer is not guaranteed or endorsed by the publisher.
Research integrity at Frontiers
Learn more about the work of our research integrity team to safeguard the quality of each article we publish.