 Ee Vien Low1,2
 Miryoung Lee3
 Cici Bauer4
 Susan P. Fisher-Hoch3
 Joseph B. McCormick3
 Paul J. Rowan5
 Susan Abughosh1Ekere J. Essien1
 Hua Chen1*
- 1College of Pharmacy, University of Houston, Houston, TX, United States
- 2Institute for Clinical Research, National Institutes of Health, Ministry of Health Malaysia, Shah Alam, Malaysia
- 3Department of Epidemiology, The University of Texas Health Science Center at Houston School of Public Health, Brownsville, TX, United States
- 4Department of Biostatistics and Data Science, The University of Texas Health Science Center at Houston School of Public Health, Houston, TX, United States
- 5Department of Management, Policy, and Community Health, The University of Texas Health Science Center at Houston School of Public Health, Houston, TX, United States
Background: This study aimed to compare the obesity rates between border-residing Mexican American children with the National Health and Nutritional Surveys (NHANES), and to examine the individual and household characteristics associated with weight status in these children.
Methods: This was a cross-sectional analysis of 354 children aged 8–18 years and their parents in the Cameron County Hispanic Cohort (CCHC) from 2014 to 2020. Children were categorized as healthy weight, overweight, class 1 obesity, class 2 obesity and class 3 obesity. The distribution of CCHC children's weight status was compared with Hispanic participants of the NHANES with matched age, sex, and the year of the interview. An ordinal least square regression analysis was conducted to assess the association between individual and household characteristics with CCHC children's weight status.
Results: Approximately 48.0% of CCHC children had a healthy weight, 17.9% were overweight, 22.2% were in class 1 obesity, 7.7% were in class 2 obesity, and 4.3% were in category 3. The weight distribution of the CCHC cohort was similar to that in the matched NHANES participants (p = 0.28). Being overweight was associated with higher household income (OR = 2.25, 95% CI: 1.01–5.02) while being in class 2 and class 3 obesity was associated with boys (Class 2 & 3 obesity: OR = 2.94, 95% CI: 1.27–6.81) and environmental factors such as parents' BMI (Class 2 and3 Obesity: OR = 1.13, 95% CI: 1.05–1.21).
Conclusions: Family socioeconomic status was positively associated with being overweight and Class 1 obesity, while gender and parent's BMI affected a child's likelihood of being class 2 and 3 obesity.
1 Introduction
Childhood obesity has been linked to chronic diseases during adulthood such as diabetes mellitus, cardiovascular disease (1, 2), and premature death (3). Among racial/ethnic groups, Hispanic children have the highest prevalence of obesity, at 26.2% in the US (4). The origin of childhood obesity is multifactorial. Studies investigating childhood obesity in Hispanic children have shown that factors such as parental/caregiver stress, socioeconomic status, and home environment affect children's weight (5–10).
The Texas border region has a population near 3 million, and 89% are Hispanic (11). The lifestyle and culture of Mexican American families living in border cities are very different from those living in other U.S. cities (12, 13). The culture of Brownsville, a Texas border city, more closely resembles that of its neighboring Mexican city, Matamoros, than its closest major city in the U.S., Corpus Christi. Residents in Brownsville have wide access to Mexican culture through media outlets, local retail, and grocery stores. Furthermore, some of these residents move freely across the border for jobs or visiting families. Understanding childhood obesity in Texas border regions requires examining these unique influences.
A recent study by Reifsnder et al. examined 55 Mexican Amereican dyads (mother–child) that attended the special supplemental program for women, infant and children (WIC) program at a county located in South Texas along the border with Mexico. The findings show children's age and maternal body mass index (BMI) are positively correlated with childhood obesity, as measured by BMI percentile by age/sex. Children involved in the study were toddlers aged 24–36 months, the prevalence of obesity in school aged children and adolescents in the geographic area and the factors associated with the risk of obesity remained understudied (14). In 2004, the University of Texas Health Science Center at Houston School of Public Health (UTHealth Houston) at Brownsville in Cameron County established the Cameron County Hispanic Cohort (CCHC) to examine the prevalence and risk factors (biological, environmental, social, lifestyle) for chronic diseases among Mexican American adults residing along the Texas–Mexico border (12, 15). The CCHC is a longitudinal, stratified random sample survey with participants recruited in Cameron County (including the city of Brownsville) and Webb County (including the city of Laredo), comprising the southmost Texas/Mexico border cities (12, 15, 16).
We aimed (1) to compare the overweight and obesity rates of border-residing Mexican American children enrolled in CCHC with the Hispanic children who participated in the National Health and Nutritional Surveys (NHANES), representative samples of the US Hispanic population, and (2) to examine the individual and household characteristics associated with the weight status of CCHC pediatric cohort.
2 Methods
2.1 Study sample and data collection
To develop the original adult Brownsville sample of the CCHC, in 2004, a random sample of 47 of the 476 census blocks with low socioeconomic status profile (median annual income below $17,831) was made, and a random sample of 38 of the 294 census blocks with median socioeconomic status profile ($24,067–$31,747) was made. In those, all households were invited to join the survey, and one adult participant per residence was identified. Acceptance was 78% for the low-income tracts and 63% for the median income tracts (12). In 2014, the CCHC was expanded to include children ages 8–18 years old, recruited from the households of already-enrolled adult CCHC participants. The current cross-sectional study sample included children ages 8–18 enrolled in the CCHC cohort from June 2014 to April 2020. As many as five children per family could be included. Each family in this survey has been assigned a unique family number so that data from children can be linked with parent data.
Both selected children and adults were invited to the Clinical Research Unit (CRU) for an individual interview and examination. Informed consent and assent were obtained. Individual interview, physical examinations, and information on mental health status, socioeconomics and education status were collected. Further details about the CCHC children, adult cohort recruitment and data collection have been published in previous studies (12, 15). Given that our focus was on children with overweight and obesity relative to healthy weight, we exclude children who were underweight (BMI < 5th percentile) (n = 11), and with missing values/incomplete information (n = 24). The final sample included 354 child-parent sets from 209 households, of which 185 children had mother only data, 85 had father only data, and 73 had both father and mother data. Informed consent from parents/guardians and assents from pediatric participants were obtained. The Committee for the Protection of Human Subjects at the UTHealth Houston reviewed and approved the protocol and informed consent forms, including permission to collect and store de-identified data.
2.2 Measures
2.2.1 Weight status
Every CCHC child's height (cm) and weight (kg) was measured using standard procedures (17). For each, age- and sex-specific body mass index (BMI) percentile was calculated based on the CDC 2000 child/adolescent growth charts (18). Children were categorized as healthy weight (5th < BMI < 85th percentile), overweight (85 ≤ BMI < 95th), class 1 obesity (95th percentile ≤ BMI < 120% of 95th percentile), class 2 obesity (BMI ≥ 120% to <140% of the 95th percentile) and class 3 obesity (BMI ≥ 140% of the 95th percentile) based on the latest clinical practice guidelines published by American Academy of Pediatrics (19). Due to the low number of children in class 3 obesity, we combined them with those in the class 2 obesity in all steps of the analysis.
2.2.2 Individual characteristics
Individual characteristics included children's demographics (age group 8–11, 12–18; gender (female, male), race/ethnicity/origin (Mexican or Mexican American or Chicano, Not Hispanic, Puerto Rican, Other), and country of birth (Mexico or USA), insurance coverage [Medicaid and Child Health Insurance Program (CHIP), Medicare, private, other, none], and mental distress, noted as elevated level of self-report depression or anxiety symptoms (not distressed; distressed) based on two following assessments: (1) a score above 15 on the Center for Epidemiological Studies Depression Scale—Revised (20) score, or (2) a score above 44 on the Zung Self-Rating Anxiety Scale Anxiety Status Index score (21, 22).
2.2.3 Household characteristics
Household information included the total number of household members, father and/or mother's weight (kg) and height (cm) measured at the CRU for the calculation of BMI (kg/m2), parents' greatest education level (completed high school or did not complete high school), parents' employment status (neither employed, at least one employed), parental language affiliation (high Spanish affiliation, high English affiliation, unknown), parental country of birth (either parent born in Mexico, or both USA). For 73 pediatric participants (20%) with both parents' data available, the mother's BMIs was used to represent parent's BMI due to higher mother's participation rate.
A child's household physical activity environment was categorized as physically active if, on the parent survey, either parent reported that they met the U.S. Department of Health and Human Services physical activity guidelines of 150 or more min of moderate and vigorous physical activity in the week before the survey, not physically active if they did not meet this criterion, or unknown if the parent's do not complete the survey (23). Parent's diet was assessed with a modified dietary scoring system (the Healthy Eating Index and the Unhealthy Eating Index), adapted from the School Physical Activity & Nutrition survey (SPAN) (24, 25). For the Healthy Eating Index, parents answered whether in the previous day they had eaten any of 11 dietary items, from once up to maximum of five times each, in the day before. Items included fruit, fruit juice, baked/grilled poultry, baked/grilled fish, wholegrain bread, wholegrain cereals, eggs, orange vegetables, salads, beans, and other vegetables. This yielded a Healthy Eating Index score ranging from zero to 55. A higher score of HEI indicates a healthier eating pattern with higher consumption of the eleven “healthy” foods. The Unhealthy Eating Index asked about 9 dietary items, including baked goods, French fries/chips, fried meat, frozen desserts, red and processed meats, non-chocolate candy, regular sodas, sweetened drinks/sports drinks, and white bread, and thus yielded a score from zero to 45. A lower UEI score implies a healthier diet and lower consumption of “unhealthy” food items. If both parents completed these dietary questions, the mother's results were used to represent the dietary pattern of the family due to known mothers' or gender role (e.g., “marianismo”) in Mexican American households (24, 26).
2.3 Statistical analysis
2.3.1 Weight status of CCHC children
To understand the weight status of CCHC children relative to the Hispanic children nationwide, we matched the CCHC pediatric cohort with Hispanic children who participated in the NHANES 2014–2020 (1:1 matching), a nationally representative survey conducted by Center for Disease Control and Prevention of the United States (27) by age (±0.5 year), gender, and year of interview from 2014 to 2020 in CCHC pediatric study visit and NHANES interview date.
2.3.2 CCHC individual and household characteristics
Mean and standard deviations were used to describe continuous variables, whereas frequency and percentage were used to describe category variables. Univariate analyses were conducted to examine the association of each individual and household level factor across the four child BMI categories. Chi-square tests were applied for the comparisons between categorical variables, and F-test was applied for the comparisons between continuous variables.
2.3.3 Multilevel ordinal logistic regression analysis examining the association of CCHC individual and household characteristics with children's weight status
We applied a two-level model with individuals nested within households. To address the correlation between children recruited from the same household, intraclass correlation was used to assess household characteristics as a higher-level predictor in explaining weight variation in children. The individual-level residual followed a logistic distribution with a mean of 0 and a variance of 3.29 (28). The intraclass correlation coefficient (ICC) indicated that only 9.03% of the variability in children's weight status was accounted for by the household level variation, and this effect was not statistically significant (p = 0.20, alpha = 0.05). Therefore, the final model applied to assess the factors associated with the children's BMI category was a multivariable ordinal logistic model in which both individual and household level factors were treated on the same level. Due to unknown values in some household-level information [i.e., meeting physical activity guidelines of 150 or more min of moderate and vigorous physical activity per week (23.7%)], the unknown values were replaced by imputed values from multiple imputation methods using SAS Proc MI/MiAnaylze. Multiple ordinal logistic regression was then used because it can handle outcomes in the ordered group, in which it treat the ordinal outcomes as increasingly inclusive (cumulative) binary weight categories (overweight, class 1 obesity, class 2 and 3 obesity) (29). Due to non-significant relationship between imputed variables (e.g., meeting physical activity guidelines of 150 or more min of moderate and vigorous physical activity per week) and child weight status, we reported the effect estimates from the complete case analysis. A two-sided p-value of <0.05 was considered statistically significant. All analyses were conducted using SAS 9.4 statistical software version 9.4 (SAS Institute, Cary, NC).
3 Results
3.1 Weight comparison of CCHC children and NHANES
354 children from CCHC was matched with 354 NHANES Hispanic. The distribution of the weight status of CCHC cohort and matched NHANES cohort are presented in Table 1. The details of the matched CCHC and NHANES cohort by participants by age, gender and year of interview are in Supplementary Table S1. No significant difference was found between the CCHC cohort compared to NHANES cohort (p = 0.28).
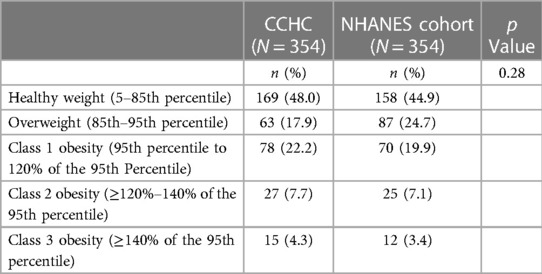
Table 1. Comparison of children's weight characteristics between the matched cameron county hispanic cohort (CCHC) and national health and nutrition examination survey (NHANES) cohort.
3.2 Characteristics of CCHC children
Descriptive statistics are presented in Table 2. The cohort included a comparable number of boys (49.4%) and girls (50.6%). Forty percent of the participants were ages 8–11 years, and 60% were ages 12–18. Most of the participants (85.0%) were US-born, and almost all (96.0%) were Mexican American. Overweight and obesity affected more than 52.0% of the study sample; 48.0% were healthy weight, 17.7% were in overweight, 22.0% in class 1 obesity, 11.9% were in Class 2 & 3 obesity (19). 57.1% of boys and 46.9% of were overweight or obese. Thirty-nine of the 354 pediatric participants (11.0%) had an elevated anxiety or depression score. Fifty-nine percent of the cohort was covered by Medicaid, and 25.1% were uninsured.
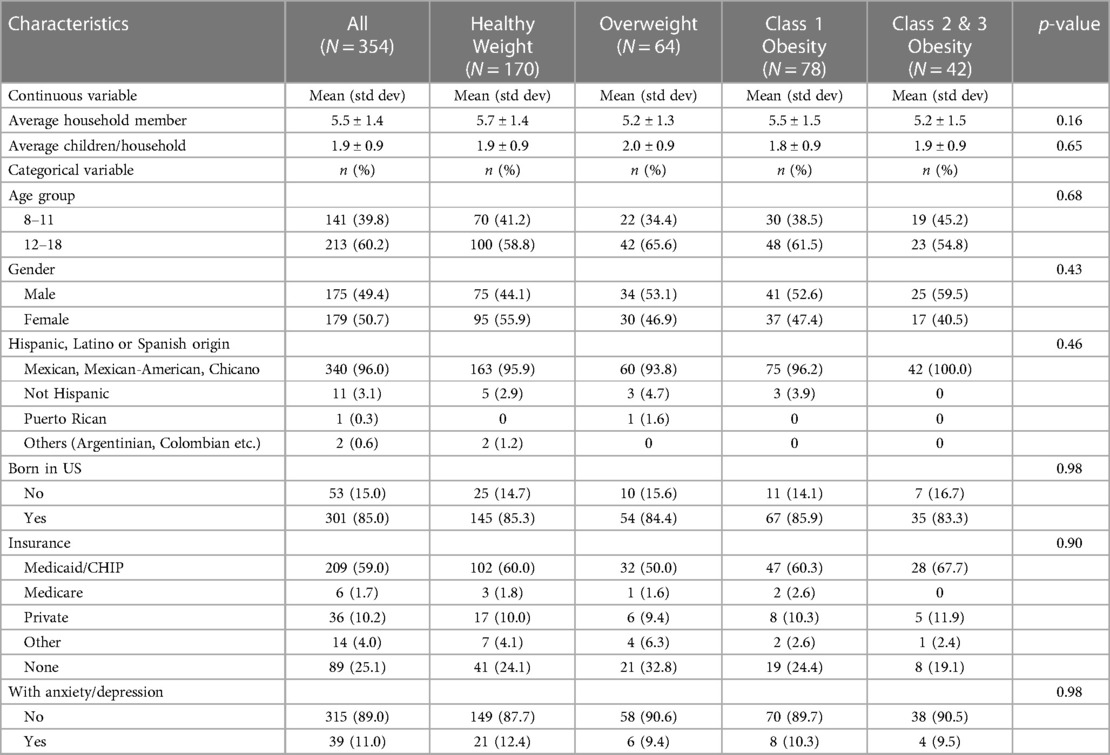
Table 2. Univariate analysis to examine the relationship between the children's characteristics and weight status.
3.3 Household characteristics
Descriptive data for household characteristics are presented in Table 3. The parents' mean age was 46.7 ± 9.7 years. Most households (84.0%) had at least one parent born outside of the US. More than half of the parents (51.3%) did not complete high school and one fifth were not employed (17.0%). Three quarters (74%) of these families had an annual household income of $39,274 or less (U.S. 2000 Census Bureau Socioeconomic quartile 1 and 2) (30, 31).
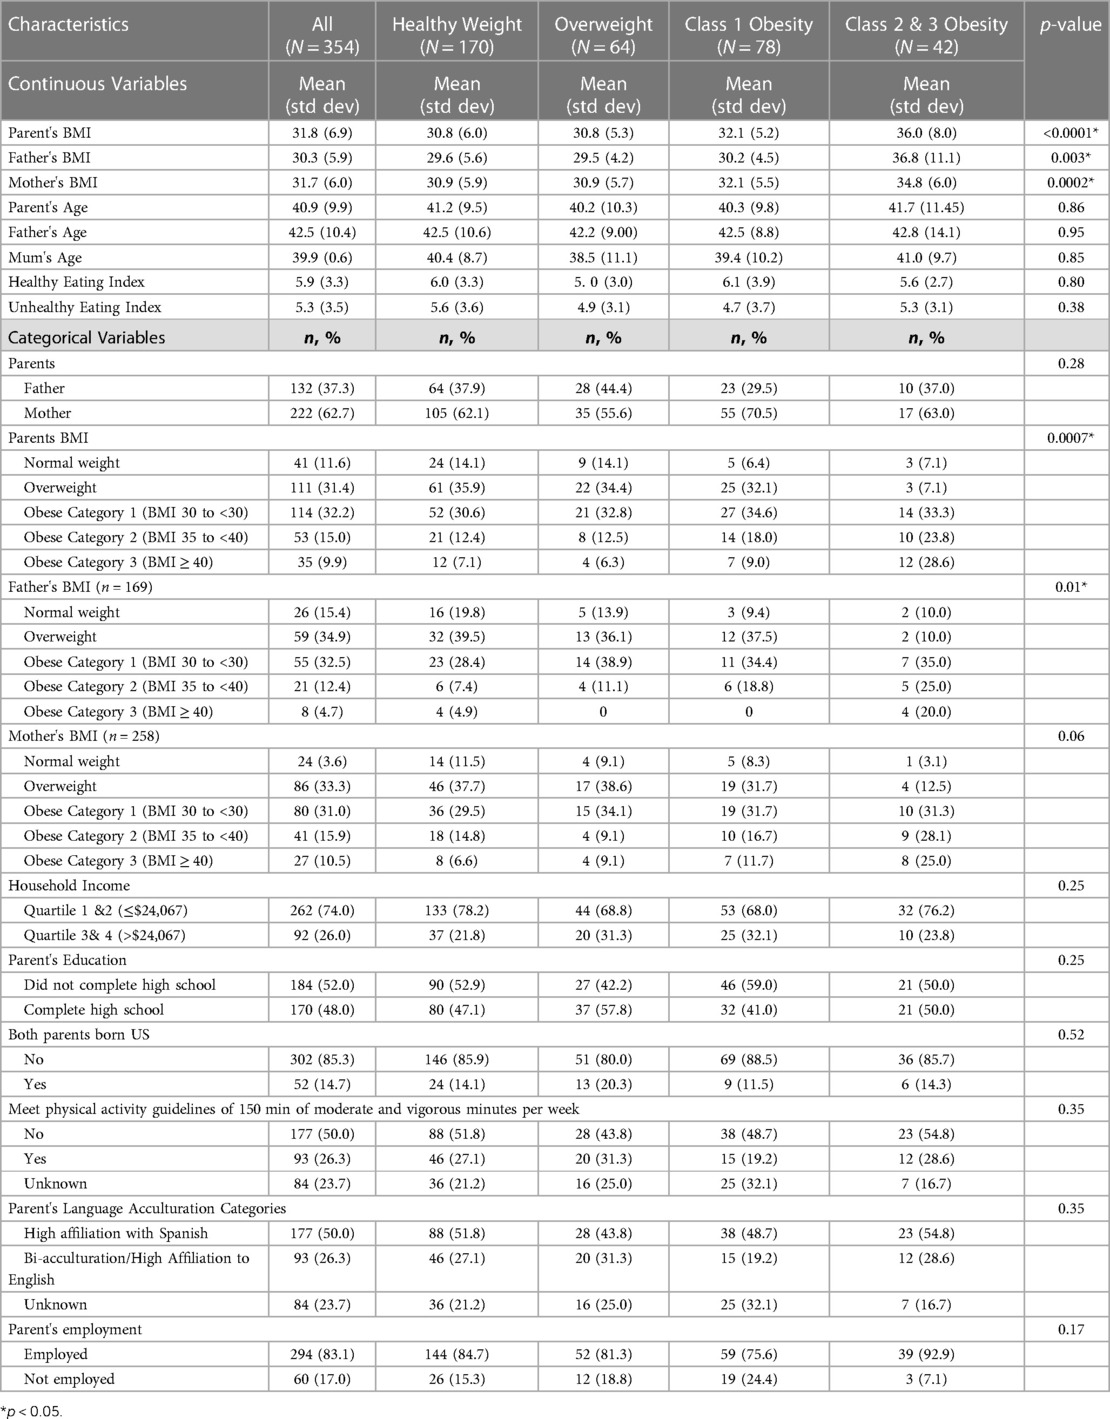
Table 3. Univariate analysis to examine the relationship between the household's characteristics and weight status.
The parents' mean (SD) BMI was 31.8 (6.9%), and 88.4% were in the overweight/obese category. Half (50%) did not meet the recommended physical activity level of 150 min of moderate and vigorous physical exercise per week. The mean (SD) healthy eating index score was 5.9 (3.9) and unhealthy eating index score was 5.3 (3.5). From the univariate analysis, it was found that father's BMI, mothers BMI and parent's BMI were found to be different across the child's weights categories.
Table 4 presents that being male, having a parent at a greater BMI level, and household income being in the lower category were positively associated with a child being in a greater BMI category. Comparing to children in 8–11 years old, children in 12–18 years old group were more likely to be in Class 1 obesity, but this absolute difference was not statistically significant. Children from household with upper 2 quartiles (quartile 3&4) family income were 2.25 (OR = 2.25, 95% CI: 1.01–5.02) times more likely to be in the overweight group, comparing to children from household with lower 2 quartiles (quartile 1&2) family income. However, a significant association between household income and being in class 1 obesity and class 2 and 3 obesity groups was not found. Gender was not associated with overweight and class 1 obesity. However, boys were 2.94 (OR = 2.94, 95% CI: 1.27–6.81) times the odds of being in class 2 & 3 obesity compared to healthy weight, relative to girls. Having a parent that was obese or overweight was not associated with a child being in the overweight or, class 1 obesity. However, for class 2 and 3 obesity group, every unit increase in parent's BMI were associated with 13% greater odds of being in class 2 and 3 obesity (OR = 1.13, 95% CI: 1.05–1.21).
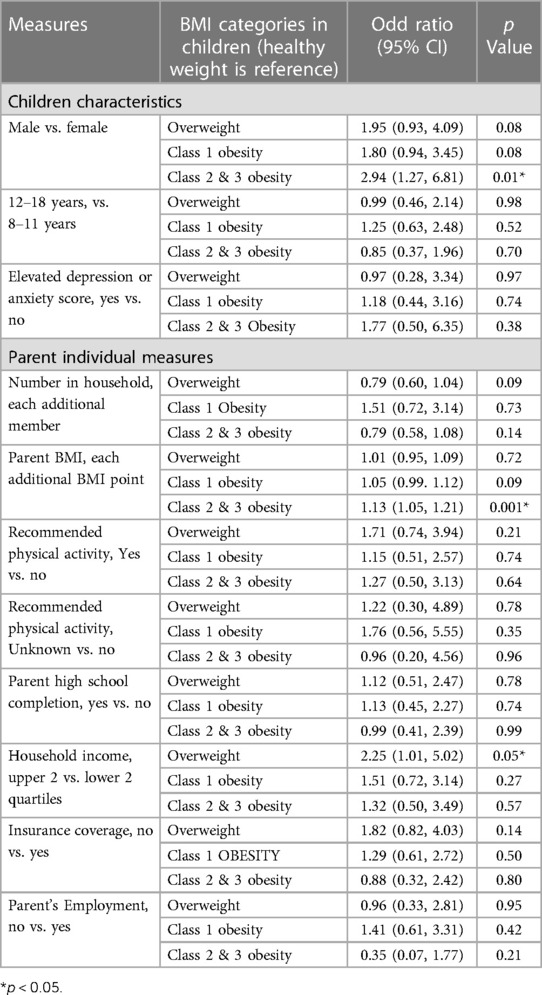
Table 4. Ordinal logistic regression results: individual, parent, and family cultural measures and likelihood of child obesity.
4 Discussion
Our results demonstrated that there was no significant difference between the obesity rates of Mexican American children living on the Texas–Mexico border and those of Hispanic children from the general US population. More than half of CCHC children were obese. This was also evident in the matched sample, where obesity rates in the CCHC and NHANES cohorts were 52.1 and 55.1%, respectively.
Our study demonstrates a complex interplay between individual characteristics, household characteristics and social environment factors that influences children's BMI in this community. Our study results revealed that the relationship between income and childhood obesity in this community varied based on obesity levels. A child from a family with relatively higher income level had a greater likelihood of being in the overweight/class 1 obesity category than those from lower household income families. However, income level was not associated with the likelihood of being in higher obesity categories specifically in obesity class 2 and 3. Likewise, the relationship with age group, insurance status, parental education, and whether parents were or were not US-born were mixed across BMI levels (although not all differences were statistically significant). This range of findings indicates the need for further investigation because tailored interventions aimed at some influences upon child obesity may not work for other influences.
This community differs from the general Mexican American population in other parts of US in several ways, such as in degree of connection with Mexican culture. Some families in this community are more recent immigrants, while others are established in the US, including multi-generational roots. Measures such as work status, health insurance coverage, and family diet preferences, may vary along these backgrounds. This finding could be explained by the high poverty rate in the region. The geographical area covered by the CCHC cohort recorded a poverty rate of 25.5% (30–32), which was 2.5 times higher than the national average (33). In this population with a high poverty level, household food insecurity might be a constant fear (34, 35), which may have motivated families with relatively higher household to purchase more calorie-dense food. The abundant food supply in these relatively higher household income families could have led to a higher likelihood of their children being overweight.
Demographic factors, including gender, were found to be associated with class 2 and class 3 obesity. Boys had a higher likelihood of being in the class 2 and class 3 obesity compared to girls. Apart from the differences in fat mass and fat distribution due to hormones, the gender difference in moderate to extreme obesity might be due to cultural correlates exacerbating the gender difference in excess weight gain (36). For instance, a recent qualitative study of Mexican American mother's perceptions of their child's body weight reported that mothers tend to perceive boys with obesity as only “overweight,”; while girls with obesity are perceived as “obese” (36). Boys with obesity were favorably perceived as “chubby” or “playful child with hearty appetites” rather than as potential health issue by parents. Moreover, mothers consider obesity a bigger problem for girls than for boys (37). Furthermore, the study noted that boys themselves might be unconcerned or rebellious toward their mothers' attempt to encourage them loss weight (36).
Consistent with the Reifsnider et al. study that examined the risk factors associated with obesity in toddlers living on the Texas–Mexico border, we found that household factors, such as parent's BMI, were found to play critical roles on a child's likelihood of being class 3 obesity (14). Our findings confirmed previous findings that parent's obesity was a strong predictor of extreme obesity in childhood (38, 39). Similar to the findings from second NHANES from 2014 to 2020, the familial risk ratio (RR) of obesity was 1.5 when the age- and sex-adjusted BMI 85th percentile was used to define obesity, whereas the RR increased to ≥2.6 when 95th percentile was used as the cutoff (40). Furthermore, despite the difference scales to measure stress, dietary intake assessment, acculturation questionnaire and age group (8–18 years old children vs. 24–36 months old children in Reifsnider study), we found that obese children tend to have obese parents that preferred Spanish speaking, similar to findings from Reifsnider et al. (14).
Childhood obesity poses both immediate and future health risks. Children with obesity are more likely to have high cholesterol and high blood pressure in childhood (41–44). Obesity causes insulin resistance in children (45). This obesity-driven insulin resistance poses an added risk of developing type 2 diabetes and metabolic-related complications in the future.
Children with obesity are also more likely to grow into adults with obesity, and the magnitude of this relationship increases with the age of children (46). The adult CCHC cohort provided a glimpse into the potential long-term implication of the pediatric CCHC if they remained overweight/obese. In the adult cohort, we observed the detrimental effects of obesity on the adult, with a high obesity rate associated with diabetes (30.7%), hypertension (31.6%), and hypercholesterolemia (48.2%) (14, 47, 48). Thus, early intervention in treating children with obesity should be prioritized to address childhood obesity early on the disease with consideration of parental and household characteristics. Without effective intervention, this will pose an economic burden on the community, health care system, and on the individuals, as these children are likely grow up as unhealthy adults with significant healthcare needs.
The findings of our study imply that Mexican American children with class 2 to class 3 obesity living on the US-Mexico border differ by gender, reflecting the influence of cultural norm on childhood obesity. The finding indicates that future interventions should account for these different gender-based cultural perceptions and norms. Another implication may be that, when addressing the severe obesity, public health intervention should target both families and children due to the strong relationship between children's and parent's weight status.
4.1 Limitation
The pediatric CCHC was first established in 2014, and sample recruitment is ongoing. The study sample size is relatively small compared to some of the large epidemiologic studies examining Hispanic children (7), but participants' recruitment and serial data collection of participants are ongoing. The study was cross-sectional and did not always have data from both parents. Additionally, we used the parent's physical activity and diet as the proxies of the children's physical activity and diet due to the unavailability of direct measurement of children's physical and healthy eating index scores. Moreover, information on number of hours of screen time was not collected. Also, the high unknown rate (23.7%) for physical activity might affect the study findings. Despite these limitations, this study provides insights into obesity among Mexican American children who are overweight or obese living on the Texas–Mexico border by characterizing the association between individual and household characteristics. Longitudinal follow-up data on the population will allow us to better understand causal influences upon childhood obesity.
5 Conclusions
A higher proportion of CCHC children fell into the extreme obesity category compared to general Hispanic children in the US. Family socioeconomic status was positively associated with being overweight, while gender and parent's BMI affected a child's likelihood of obese class 2 and 3 obesity. As these children are more likely to grow up to become adult with obesity, future research are warranted to follow up on the children for obesity trajectory.
Data availability statement
The raw data supporting the conclusions of this article will be made available by the authors, without undue reservation.
Ethics statement
The studies involving humans were approved by Committee for the Protection of Human Subjects, UTHealth Houston. The studies were conducted in accordance with the local legislation and institutional requirements. Written informed consent for participation in this study was provided by the participants’ legal guardians/next of kin.
Author contributions
EL: Formal Analysis, Methodology, Writing – original draft, Writing – review & editing. ML: Conceptualization, Methodology, Supervision, Writing – review & editing, Data curation, Project administration. CB: Supervision, Writing – review & editing. SF: Supervision, Writing – review & editing, Data curation, Funding acquisition, Project administration. JM: Data curation, Funding acquisition, Supervision, Writing – review & editing. PR: Supervision, Writing – review & editing, Formal Analysis. SA: Supervision, Writing – review & editing. EE: Supervision, Writing – review & editing. HC: Supervision, Writing – review & editing, Conceptualization, Formal Analysis, Methodology, Writing – original draft.
Funding
The author(s) declare that financial support was received for the research, authorship, and/or publication of this article.
This study was supported by Grant MD000170 P20, funded from the United States Department of Health and Human Services, National Institutes of Health (DHHS–NIH), National Center on Minority Health and Health Disparities, NIH National Center for Advancing Translational Sciences Award 1U54RR023417-01, and the DHHS Centers for Disease Control and Prevention Award RO1 DP000210-01 for Research (all thanks to JM and SF-H).
Acknowledgments
The authors would like to thank our cohort team, particularly Rocío Uribe and her team, who recruited and interviewed the participants; Marcela Morris, BS, and Hugo Soriano and their teams for laboratory and data support respectively; Norma Pérez-Olazarán, BBA, and Christina Villarreal, B.A. for administrative support; Valley Baptist Medical Center, Brownsville, Texas, for providing us space for the location of our Center for Clinical and Translational Science Clinical Research Unit; and the community of Brownsville and the participants who so willingly participated in this study in their city.
Conflict of interest
The authors declare that the research was conducted in the absence of any commercial or financial relationships that could be construed as a potential conflict of interest.
Publisher's note
All claims expressed in this article are solely those of the authors and do not necessarily represent those of their affiliated organizations, or those of the publisher, the editors and the reviewers. Any product that may be evaluated in this article, or claim that may be made by its manufacturer, is not guaranteed or endorsed by the publisher.
Supplementary material
The Supplementary Material for this article can be found online at: https://www.frontiersin.org/articles/10.3389/fradm.2024.1297391/full#supplementary-material
References
1. Biro FM, Wien M. Childhood obesity and adult morbidities. Am J Clin Nutr. (2010) 91(5):1499S–505S. doi: 10.3945/ajcn.2010.28701B
2. Simmonds M, Burch J, Llewellyn A, Griffiths C, Yang H, Owen C, et al. The use of measures of obesity in childhood for predicting obesity and the development of obesity-related diseases in adulthood: a systematic review and meta-analysis. Health Technol Assess (Winchester, England). (2015) 19(43):1–336. doi: 10.3310/hta19430
3. Clarkson Freeman PA. Prevalence and relationship between adverse childhood experiences and child behavior among young children. Infant Ment Health J. (2014) 35(6):544–54. doi: 10.1002/imhj.21460
4. Stierman B, Afful J, Carroll MD, Chen T-C, Davy O, Fink S, et al. National Health Statistics Reports Number 158, June 14, 2021: National Health and Nutrition Examination Survey 2017–March 2020 Prepandemic Data Files—Development of Files and Prevalence Estimates for Selected Health Outcomes (2021).
5. Ayala GX, Carnethon M, Arredondo E, Delamater AM, Perreira K, Van Horn L, et al. Theoretical foundations of the study of latino (SOL) youth: implications for obesity and cardiometabolic risk. Ann Epidemiol. (2014) 24(1):36–43. doi: 10.1016/j.annepidem.2013.10.011
6. Bravin JI, Gutierrez AP, McCurley JL, Roesch SC, Isasi CR, Delamater AM, et al. Extra-familial social factors and obesity in the hispanic community children’s health study/study of latino youth. J Behav Med. (2019) 42(5):947–59. doi: 10.1007/s10865-019-00022-7
7. Isasi CR, Hua S, Jung M, Carnethon MR, Perreira K, Vidot DC, et al. The association of parental/caregiver chronic stress with youth obesity: findings from the study of latino youth and the hispanic community health study/study of latinos sociocultural ancillary study. Childhood Obesity (Print). (2017) 13(4):251–8. doi: 10.1089/chi.2016.0205
8. Ochoa A, Berge JM. Home environmental influences on childhood obesity in the latino population: a decade review of literature. J Immigr Minor Health. (2017) 19(2):430–47. doi: 10.1007/s10903-016-0539-3
9. Gillman MW, Rifas-Shiman S, Berkey CS, Field AE, Colditz GA. Maternal gestational diabetes, birth weight, and adolescent obesity. Pediatrics. (2003) 111(3):e221. doi: 10.1542/peds.111.3.e221
10. Salahuddin M, Pérez A, Ranjit N, Kelder SH, Barlow SE, Pont SJ, et al. Predictors of severe obesity in low-income, predominantly hispanic/latino children: the Texas childhood obesity research demonstration study. Prev Chronic Dis. (2017) 14:170129. doi: 10.5888/pcd14.170129
11. Williams AS, Ge B, Petroski G, Kruse RL, McElroy JA, Koopman RJ. Socioeconomic status and other factors associated with childhood obesity. J Am Board Family Med. (2018) 31(4):514–21. doi: 10.3122/jabfm.2018.04.170261
12. Fisher-Hoch SP, Rentfro AR, Salinas JJ, Perez A, Brown HS, Reininger BM, et al. Socioeconomic status and prevalence of obesity and diabetes in a Mexican American community, Cameron county, Texas, 2004–2007. Prev Chronic Dis. (2010) 7(3):A53.20394692
13. Nelson N, Barrera Iv ES, Skinner K, Fuentes AM. Language, culture and border lives: mestizaje as positionality/lengua, cultura y vidas de frontera: el mestizaje como posicionalidad. Cult Educ. (2016) 28(1):1–41. doi: 10.1080/11356405.2014.980121
14. Reifsnider E, Jeong M, Chatterjee P. An ecological approach to obesity in Mexican American children. J Pediatr Health Care. (2020) 34(3):212–21. doi: 10.1016/j.pedhc.2019.09.012
15. Fisher-Hoch SP, Vatcheva KP, Laing ST, Hossain MM, Rahbar MH, Hanis CL, et al. Missed opportunities for diagnosis and treatment of diabetes, hypertension, and hypercholesterolemia in a Mexican American population, Cameron county hispanic cohort, 2003–2008. Prev Chronic Dis. (2012) 9:110298. doi: 10.5888/pcd9.110298
16. Low EV, Lee M, Bauer C, Fisher-Hoch SP, McCormick JB, Abughosh S, et al. Association of puberty stage and weight status with cardiometabolic risk in children and adolescents living on the Texas-Mexico border. Metab Syndr Relat Disord. (2022) 20(8):440–50. doi: 10.1089/met.2021.0151
17. Lohman TGRA, Martorell R. Anthropometric Standardization Reference Manual. Chicago: Human Kinetics (1988).
18. Kuczmarski RJ, Ogden CL, Guo SS, Grummer-Strawn LM, Flegal KM, Mei Z, et al. 2000 CDC growth charts for the United States: methods and development. In: Vital and Health Statistics Series 11, Data from the National Health Survey. Vol. 246. Hyattsville: National Center for Health Statistics, Department of Health and Human Services (2002). p. 1–190.
19. Hampl SE, Hassink SG, Skinner AC, Armstrong SC, Barlow SE, Bolling CF, et al. Clinical practice guideline for the evaluation and treatment of children and adolescents with obesity. Pediatrics. (2023) 151(2):1–6. doi: 10.1542/peds.2022-060640
20. The Center for Epidemiologic Studies Depression Scale Revised. CESD-R Explanation (2019). Available online at: https://cesd-r.com/cesdr/ (Accessed May 10, 2022).
21. Balázs J, Miklósi M, Keresztény A, Hoven CW, Carli V, Wasserman C, et al. Comorbidity of physical and anxiety symptoms in adolescent: functional impairment, self-rated health and subjective well-being. Int J Environ Res Public Health. (2018) 15(8):1698. doi: 10.3390/ijerph15081698
22. Zung WWK. A rating instrument for anxiety disorders. Psychosomatics. (1971) 12(6):371–9. doi: 10.1016/S0033-3182(71)71479-0
23. Piercy KL, Troiano RP, Ballard RM, Carlson SA, Fulton JE, Galuska DA, et al. The physical activity guidelines for Americans. JAMA. (2018) 320(19):2020–8. doi: 10.1001/jama.2018.14854
24. Reininger B, Lee M, Jennings R, Evans A, Vidoni M. Healthy eating patterns associated with acculturation, sex and BMI among Mexican Americans. Public Health Nutr. (2017) 20(7):1267–78. doi: 10.1017/S1368980016003311
25. Pérez A, Hoelscher DM, Brown HS III, Kelder SH. Differences in food consumption and meal patterns in Texas school children by grade. Prev Chronic Dis. (2007) 4(2):A23.
26. Lam CB, McHale SM, Updegraff KA. Gender dynamics in Mexican American families: connecting mothers’, fathers’, and Youths’ experiences. Sex Roles. (2012) 67(1–2):17–28. doi: 10.1007/s11199-012-0137-3
27. National Center for Health Statistics. National Health and Nutrtional Examination Survey. In: Centers for Disease Control and Prevention, editor (2022).
28. Ene M, Leighton EA, Blue GL, Bell BA. Multilevel Models for Categorical Data Using SAS® PROC GLIMMIX: The Basics. South Carolina: University of South Carolina (2015).
29. Sainani KL. Multinomial and ordinal logistic regression. PM&R. (2021) 13(9):1050–5. doi: 10.1002/pmrj.12622
30. United States Census Bureau. QuickFacts Cameron County, Texas (2019). Available online at: https://www.census.gov/quickfacts/fact/table/webbcountytexas,hidalgocountytexas,cameroncountytexas/PST045219 (Accessed September 2, 2022).
31. United Status Census Bureau. Webb County, Texas (2019). Available online at: https://www.census.gov/quickfacts/fact/table/webbcountytexas,US/PST045218 (Accessed September 2, 2021).
32. Ura A. Latest Census Data Shows Poverty Rate Highest at Border, Lowest in Suburbs. Austin: The Texas Tribune (2016).
33. Jessica Semega MK, Shrider EA, Creamer J. Income and Poverty in the United States 2019 (2020). Available online at: https://www.census.gov/library/publications/2020/demo/p60-270.html (Accessed September 2, 2022).
34. Fernald LCH. Socio-economic status and body mass index in low-income Mexican adults. Soc Sci Med. (2007) 64(10):2030–42. doi: 10.1016/j.socscimed.2007.02.002
35. Jin H, Lu Y. The relationship between obesity and socioeconomic status among Texas school children and its spatial variation. Applied Geography. (2017) 79:143–52. doi: 10.1016/j.apgeog.2016.12.008
36. Stovitz SD, Schwimmer JB, Martinez H, Story MT. Pediatric obesity: the unique issues in Latino–American male youth. Am J Prev Med. (2008) 34(2):153–60. doi: 10.1016/j.amepre.2007.09.034
37. Ávila-Ortiz MN, Castro-Sánchez AE, Zambrano-Moreno A. Mexican mothers’ perceptions of their child’s body weight. Health Soc Care Community. (2017) 25(2):569–77. doi: 10.1111/hsc.12344
38. Reilly JJ, Armstrong J, Dorosty AR, Emmett PM, Ness A, Rogers I, et al. Early life risk factors for obesity in childhood: cohort study. BMJ (Clin Res Ed). (2005) 330(7504):1357. doi: 10.1136/bmj.38470.670903.E0
39. McLoone P, Morrison DS. Risk of child obesity from parental obesity: analysis of repeat national cross-sectional surveys. Eur J Public Health. (2014) 24(2):186–90. doi: 10.1093/eurpub/cks175
40. Bouchard C. Childhood obesity: are genetic differences involved? Am J Clin Nutr. (2009) 89(5):1494S–501S. doi: 10.3945/ajcn.2009.27113C
41. Gurnani M, Birken C, Hamilton J. Childhood obesity: causes, consequences, and management. Pediatr Clin N Am. (2015) 62(4):821–40. doi: 10.1016/j.pcl.2015.04.001
42. Pollock NK. Childhood obesity, bone development, and cardiometabolic risk factors. Mol Cell Endocrinol. (2015) 410:52–63. doi: 10.1016/j.mce.2015.03.016
43. Daniels SR. The consequences of childhood overweight and obesity. Future Child. (2006) 16(1):47–67. doi: 10.1353/foc.2006.0004
44. Franks PW, Hanson RL, Knowler WC, Sievers ML, Bennett PH, Looker HC. Childhood obesity, other cardiovascular risk factors, and premature death. N Engl J Med. (2010) 362(6):485–93. doi: 10.1056/NEJMoa0904130
45. Lee JM, Okumura MJ, Davis MM, Herman WH, Gurney JG. Prevalence and determinants of insulin resistance among U.S. adolescents: a population-based study. Diabetes Care. (2006) 29(11):2427–32.17065679
46. Whitaker RC, Wright JA, Pepe MS, Seidel KD, Dietz WH. Predicting obesity in young adulthood from childhood and parental obesity. N Engl J Med. (1997). 337(13):869–73.9302300
47. Fisher-Hoch SP, Vatcheva KP, Rahbar MH, McCormick JB. Undiagnosed diabetes and pre-diabetes in health disparities. PLoS One. (2015) 10(7):e0133135.26186342
Keywords: obesity, Mexican American, children, Texas–Mexico border, parent’s BMI
Citation: Low EV, Lee M, Bauer C, Fisher-Hoch SP, McCormick JB, Rowan PJ, Abughosh S, Essien EJ and Chen H (2024) Risk factors for overweight and obesity in Mexican American children and adolescents living on the Texas–Mexico border. Front. Adolesc. Med. 2:1297391. doi: 10.3389/fradm.2024.1297391
Received: 20 September 2023; Accepted: 7 March 2024;
Published: 5 April 2024.
Edited by:
Biagio Solarino, University of Bari Aldo Moro, ItalyReviewed by:
Gail Rees, University of Plymouth, United KingdomElizabeth Reifsnider, Arizona State University, United States
Olivier Hue, Université du Québec à Trois-Rivières, Canada
© 2024 Low, Lee, Bauer, Fisher-Hoch, McCormick, Rowan, Abughosh, Essien and Chen. This is an open-access article distributed under the terms of the Creative Commons Attribution License (CC BY). The use, distribution or reproduction in other forums is permitted, provided the original author(s) and the copyright owner(s) are credited and that the original publication in this journal is cited, in accordance with accepted academic practice. No use, distribution or reproduction is permitted which does not comply with these terms.
*Correspondence: Hua Chen aGNoZW4yNUBjZW50cmFsLnVoLmVkdQ==