
94% of researchers rate our articles as excellent or good
Learn more about the work of our research integrity team to safeguard the quality of each article we publish.
Find out more
ORIGINAL RESEARCH article
Front. Acoust., 09 April 2025
Sec. Ultrasound Technologies
Volume 3 - 2025 | https://doi.org/10.3389/facou.2025.1545057
This article is part of the Research TopicInsights in Ultrasound Technologies: 2024View all 5 articles
 Omid Yousefian1Azadeh Dashti1Haley Geithner1Yasamin Karbalaeisadegh1
 Shanshan Yao1John Blackwell2Mir Ali2Stephanie Montgomery2†Yong Zhu1Thomas Egan2,3
 Marie Muller1,3*
Introduction: In this in silico, in vitro, and in vivo study, we propose metrics for the characterization of highly scattering media using backscattered acoustic waves in the MHz range, for application to the characterization of biological media.
Methods: Multi-element array transducers are used to record the ultrasonic Inter element Response Matrix (IRM) of scattering phantoms and of lung tissue in rodent models of pulmonary fibrosis. The distribution of singular values of the IRM in the frequency domain is then studied to quantify the multiple scattering contribution. Numerical models of scattering media, as well as gelatin-glass bead and polydimethylsiloxane phantoms with different scatterer densities, are used as a first step to demonstrate the proof of concept.
Results: The results show that changes in microstructure of a complex random medium affect parameters associated with the distribution of singular values. Two metrics are proposed:
Discussion: These results suggest that such parameters could be used as metrics to estimate the amount of multiple scattering in highly heterogeneous media, and that these parameters could contribute to the evaluation of structural changes in lung microstructure.
Wave propagation in random complex media has been a subject of interest in a wide range of fields including optics, electromagnetism, solid state physics and seismology (Lax, 1951; Waterman and Truell, 1961; Tourin et al., 2000). In acoustics, when scatterer density is relatively high, the difference between the acoustical properties of scatterers and the surrounding matrix leads to multiple scattering of acoustic waves. As the wave propagates through the highly scattering medium, the coherent wave becomes more challenging to track. Hence, multiple scattering makes conventional ultrasound imaging based on echolocation extremely challenging. This is especially true in complex biological organs such as bone or lung where pores and alveoli act as scatterers. However, the waves backscattered from complex random media contain rich, useful information on the micro-structure of such media. One could retrieve these micro-structural properties through statistical approaches. Due to recent developments in manufacturing of multi-element array transducers, biomedical acoustics has the experimental advantage of offering controllable multi-element arrays of quasi-point-like emitters/receivers. In these transducer configurations, the propagation relationship between two elements of the probe is best described by a propagation matrix, also called the Impulse Response Matrix (IRM),
A number of statistical methods have been used in the fields of acoustics and biomedical ultrasound to characterize random complex media using this matrix. For example, Aubry and Derode (2011) used a matrix formalism to separate the single and multiple scattering contributions to backscattered signals in human soft tissue. Their results showed that multiple scattering is not negligible in breast tissue, and could be exploited to detect microstructural changes. Karbalaeisadegh et al. (2019) estimated the diffusion constant of ultrasonic waves in the MHz range propagated through cortical bone. The diffusion constant was estimated using the propagation matrix in a backscattering configuration. The diffusion constant quantifies the rate of acoustic energy distribution in space, due to scattering. It is correlated to the scattering mean free path, which characterizes the mean distance between scattering events. It is therefore expected to be related to scatter density. Karbalaeisadegh et al. (2019) studied how the changes in pore size and pore density independently affect the diffusion constant. Mohanty et al. used the diffusion constant from multiple scattering of ultrasonic waves to characterize the lung parenchyma for pulmonary fibrosis, pulmonary edema (Mohanty et al., 2017), and to detect the presence of non-scattering inclusions in the lung (Mohanty et al., 2020). Dashti and Lye. extracted backscattering parameters such as the backscatter coefficient, and used envelope statistics to quantify changes in rats lungs due to varying degrees of pulmonary fibrosis (Lye et al., 2021; Dashti et al., 2024).
Prada and Fink (1994), Prada et al. (1996) showed that in the case of point-like scatterers randomly distributed in a homogeneous medium, each scatterer can be associated to one non-zero singular value of the propagation matrix in the frequency domain. Hence, Singular Value Decomposition (SVD) of the propagation matrix can provide useful information regarding scattering patterns occurring in a random medium. Aubry and Derode (2010) applied general results of Random Matrix Theory (RMT) (Tulino and Verdú, 2004) on the SVD of the propagation matrix in a backscattering configuration and established detection criteria in the presence of multiple scattering based on the statistical properties of singular values.
In the present study, we use the distribution of singular values from backscattered signals to extract metrics relevant to the characterization of the micro-structure of complex random media. SVD is estimated using a Probability Density Function (PDF) where two parameters of this PDF are studied:
In this section the acquisition of an Inter-element Response Matrix (IRM) from a multi-element array transducer and the subsequent SVD is described. Some general results from the RMT (Tulino and Verdú, 2004) and its applicability in analyzing the singular value distribution of IRM acquired from multiple scattering structures are also presented.
An ultrasound transducer array with
The time window length is chosen in such a way that each time window contains at least one scattering event. Taking this into account, in both experiments and simulations we assumed
After normalization, one can study the distribution of singular values by forming a histogram
where
It has been shown (Tulino and Verdú, 2004; Aubry and Derode, 2009) that when multiple scattering dominates in a medium, the distribution of singular values follows a ”Quarter Circle Law” (QCL) derived from RMT as described in Equation 6:
In reality the propagation of acoustic waves in a random medium is a combination of both single and multiple scattering. This means that the closer the PDF is to a quarter circle, the more multiple scattering occurs in the random medium. A distribution of singular values closer to a quarter circle, reflecting larger amounts of multiple scattering, should be described by a larger expected value
In this section, we numerically study how
In order to study how the micro-structure of complex random media might affect the distribution of singular values, 2D numerical structures of mono-disperse circular scatterers made of plastic or aluminium (diameter equal to
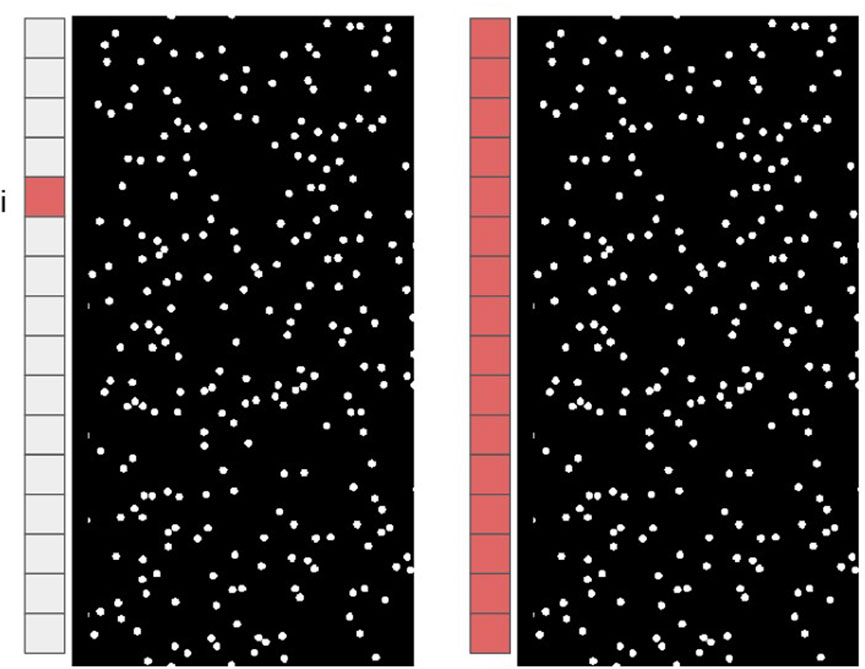
Figure 1. Schematic of emission by element
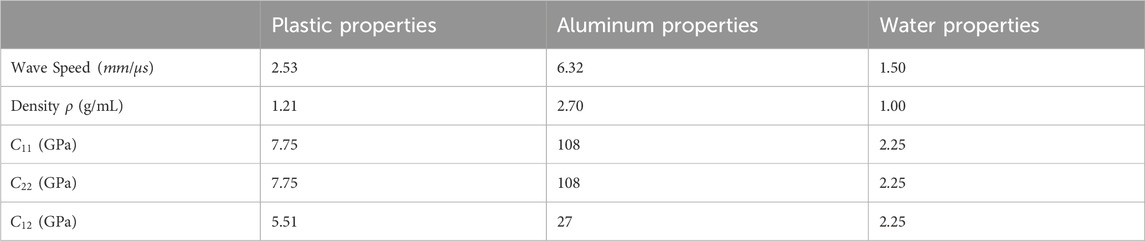
Table 1. Material properties of the simulation phases.
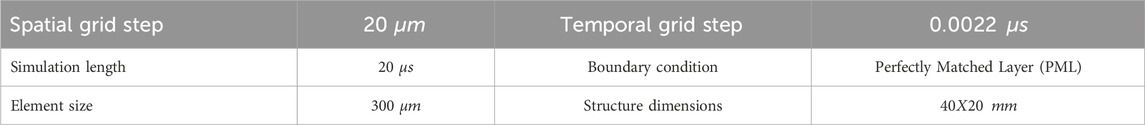
Table 2. Simulation parameters.
In this section the preparation and fabrication of the phantom used for the experimental studies are described. Phantoms mimicking complex random media studied in this work are Gelatin-Glass Beads (GGB) and PDMS-Barium Titanate phantoms.
GGB phantoms are made using a gelatin solution as the homogeneous matrix and glass bead particles acting as acoustical scatterers. First, 5 g of gelatin powder from porcine skin (SIGMA Life Science) are mixed with 100 mL of water (
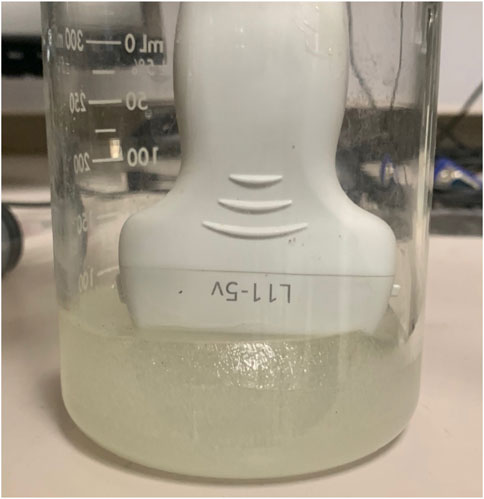
Figure 2. Measuring backscattered signals of Gelatin-Glass bead phantoms using an array transducer.
To fabricate the PDMS-Barium Titanate composite, two parts of polydimethylsiloxane (PDMS) (Dow Corning® Sylgard 184) are measured with a base to curing agent ratio of 25:1 in weight and mixed in a plastic beaker (Yao and Zhu, 2014; Yao et al., 2017). BaTiO3 powder (Acros Organics, particle diameter
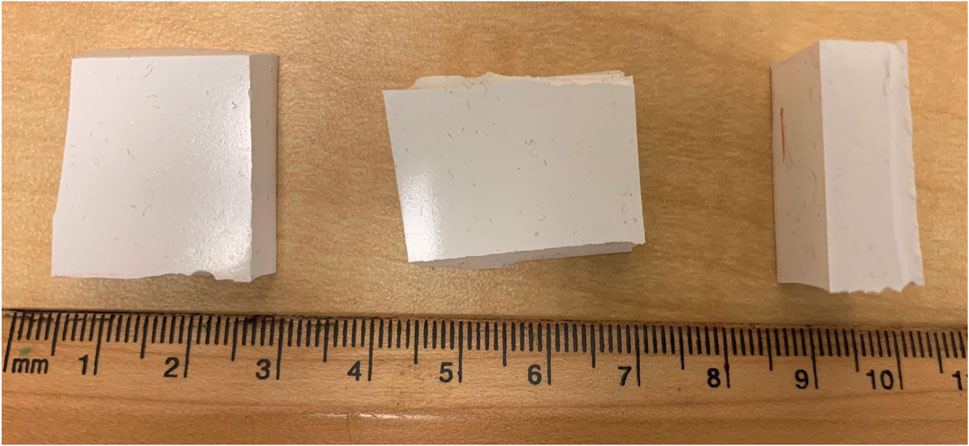
Figure 3. Three samples extracted from the same PDMS-Barium Titanate phantom.
In this section the distributions of singular values from IRMs obtained in the two types of phantoms are studied. In the first set of GGB phantoms, mimicking highly scattering media, we study if one can assess single and multiple scattering using QCL. We also investigate whether
The experiments are performed using an L7-4 (ATL, Bothell, WA) and an L11-5v (Verasonics, Kirkland, WA) 128 elements linear array transducers (Figure 2). The configuration of these transducers are summarized in Table 3. The multi-element array transducers are connected to a Verasonics Vantage ultrasound scanner (Verasonics, Kirkland, WA) and configured to emit a Gaussian pulse (centered at 5.1 and 7.8 MHz respectively), element by element. The backscattered signals are then recorded on all of the elements of the array at a sampling frequency of
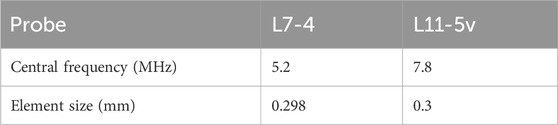
Table 3. Ultrasound probe parameters.
In the PDMS phantoms (Figure 3), using an L7-4 multi-element array transducer, the IRM is acquired at three different locations of each phantom to account for randomness in the scatterer distributions. The L11-5 transducer array was not used with these PDMS phantoms due to the high absorption coefficient of the PDMS matrix, resulting in highly attenuated backscattered signals and very low signal to noise ratios at 7.8 MHz. After IRM acquisition, three samples are cut from each PDMS phantoms (
where
Thirty-two Sprague Dawley rats are acquired under an approved protocol, as described in Dashti et al. (2024). Six rats with healthy lungs are used as the control group. Pulmonary fibrosis is induced in twenty-six rats, eight of which are treated by Nintedanib. The animal preparation, fibrosis model, and ultrasound data acquisition procedure have been described thoroughly in previous work (Mohanty et al., 2020), but are discussed briefly here. Pulmonary fibrosis is induced by instilling bleomycin into the airway. The rats are sedated and intubated with a 12-gauge catheter. Bleomycin 2 mg/kg is dissolved in 100
Prior to ultrasound data acquisition, rats are anesthetized with titrated isoflurane. A sternotomy is carried out to open both pleural spaces and expose both lungs (the intercostal space in rats is too small to accommodate a conventional ultrasound probe). The incision is extended inferiorly into the abdomen to expose the liver, and heparin is administered intrahepatically to prevent clotting after lung removal. A 2 mm (approximately) layer of ultrasound coupling gel is applied directly onto the probe and ultrasound measurements are acquired in vivo. After data acquisition, the rats are euthanized by cardiectomy under anesthesia.
As in phantoms, ultrasound measurements are obtained using a 128 element linear array transducer (Verasonics L11-4v at a central frequency of 7.8 MHz) connected to a Verasonics Vantage ultrasound scanner using a sampling frequency of 62.5 MHz. The inter-element Response Matrices (IRMs) are recorded for each lung as detailed in section 2.1, and as described in previous work from our group (Mohanty et al., 2020; Lye et al., 2021; Dashti et al., 2024).
After ultrasound data acquisition, the lung tissue is excised and subjected to inflation-fixation. The lungs samples are submerged in paraformaldehyde for 24–48 h. The lung tissue is then placed in paraffin and cut into sections with 5
The IRMs acquired by FDTD numerical simulations are post-processed to form the PDF for the distribution of singular values according to the method described in section 2.1. For various scatterer area fractions (with scatterers made of aluminum and plastic),
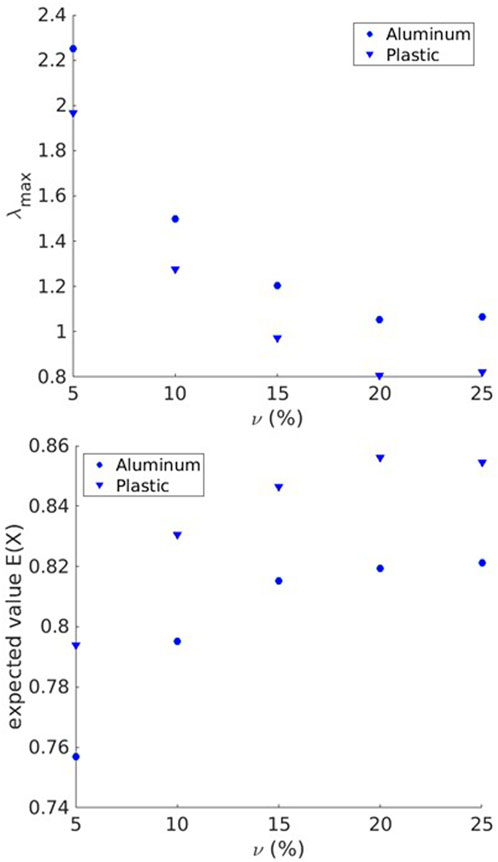
Figure 4.
As the figures imply, the value of
The IRMs acquired experimentally using the L7-4 and L11-5 array transducers on the GGB phantoms were processed and the PDF for SVD was estimated for different frequencies
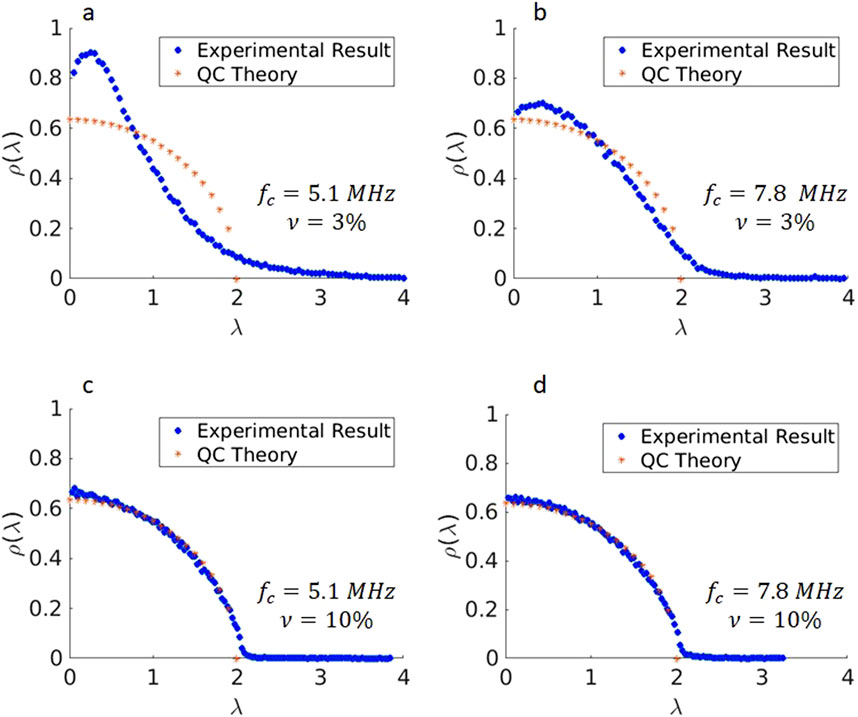
Figure 5. Singular value distributions of the IRM from Gelatin Glass Bead phantoms at different frequencies. (a): 3% scatterer volume fraction, central frequency of 5.1 MHz (b): 3% scatterer volume fraction, central frequency of 7.8 MHz (c): 10% scatterer volume fraction, central frequency of 5.1 MHz (d): 10% scatterer volume fraction, central frequency of 7.8 MHz.
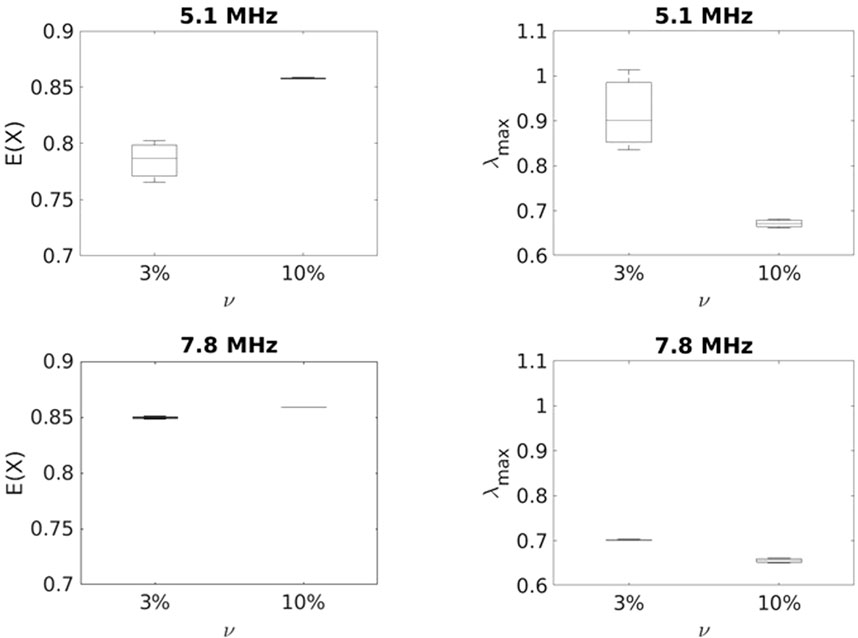
Figure 6.
The results indicate that at lower frequency both
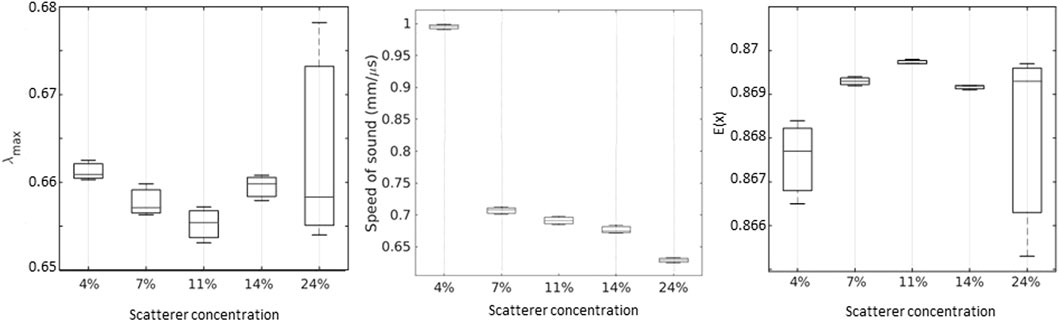
Figure 7.
As the figures depict,
Similarly, the IRMs acquired from the six healthy rat lungs (control group), eighteen fibrotic lungs (with varying degrees of severity), and nine rats treated with Nintedanib were post-processed to form the singular values probability distribution function (PDF).
Figure 8 shows linear regressions between
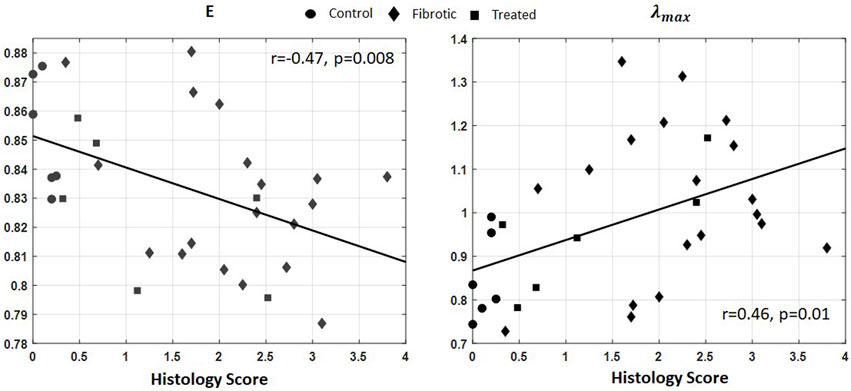
Figure 8.
In this work we used the propagation matrix in a backscattering configuration to characterize weakly and highly scattering random media using ultrasonic waves in the MHZ range. To do so, we used general results of the Random Matrix Theory (RMT) and applied them to distribution of singular values estimated from the Inter-element Response Matrix (IRM). The main goal was to investigate how changes in micro-structural parameters of a random complex medium might affect the distribution of singular values, and if, consequently, metrics of the PDF of singular values could be used to characterized complex media. The micro-structural parameter we studied was scatterer volume fraction and the metrics associated with changes in the distribution of singular values were
We tested this hypothesis by generating 2D numerical models of highly scattering media consisting of a fluid phase (as the matrix) and solid phase (as the scatterers) for various scatterer area fractions, forming and post-processing IRM and estimating
As a next step, we experimentally studied how the scatterer volume fraction affects
We also studied how
In order to determine the feasibility of such methods in biological media, we investigated whether
The raw data supporting the conclusions of this article will be made available by the authors, without undue reservation.
The animal study was approved by University of North Carolina Chapel Hill. The study was conducted in accordance with the local legislation and institutional requirements.
OY: Data curation, Formal Analysis, Investigation, Methodology, Visualization, Writing–original draft, Writing–review and editing. AD: Data curation, Formal Analysis, Investigation, Methodology, Writing–original draft, Writing–review and editing. HG: Data curation, Methodology, Validation, Writing–review and editing. YK: Data curation, Formal Analysis, Investigation, Methodology, Writing–review and editing. SY: Methodology, Writing–review and editing. JB: Methodology, Writing–review and editing. MA: Methodology, Writing–review and editing. SM: Methodology, Writing–review and editing. YZ: Conceptualization, Methodology, Writing–review and editing. TE: Conceptualization, Methodology, Writing–review and editing. MM: Conceptualization, Funding acquisition, Investigation, Methodology, Project administration, Resources, Supervision, Writing–original draft, Writing–review and editing.
The author(s) declare that financial support was received for the research, authorship, and/or publication of this article. This study was in part funded by the United States Department of Defense, Congressionally Directed Medical Research Programs, Grant No. DoD W81XWH-18-1-0101, by the National Heart, Lung and Blood Institute, Grants No. R21 HL154156/HL and No R01HL175513, by the National Cancer Institute Grant No R01CA282648 (awarded to North Carolina State University), as well as by the UNC Lung Transplant Research Fund with generous contributions from James Ferguson & his family & John Doherty and the Cornelia Condon Memorial Research Fund.
The authors declare that the research was conducted in the absence of any commercial or financial relationships that could be construed as a potential conflict of interest.
The author(s) declare that no Generative AI was used in the creation of this manuscript.
All claims expressed in this article are solely those of the authors and do not necessarily represent those of their affiliated organizations, or those of the publisher, the editors and the reviewers. Any product that may be evaluated in this article, or claim that may be made by its manufacturer, is not guaranteed or endorsed by the publisher.
Aubry, A., and Derode, A. (2009). Random matrix theory applied to acoustic backscattering and imaging in complex media. Phys. Rev. Lett. 102, 084301. doi:10.1103/PhysRevLett.102.084301
Aubry, A., and Derode, A. (2010). Singular value distribution of the propagation matrix in random scattering media. Waves Random Complex Media 20, 333–363. doi:10.1080/17455030903499698
Aubry, A., and Derode, A. (2011). Multiple scattering of ultrasound in weakly inhomogeneous media: application to human soft tissues. J. Acoust. Soc. Am. 129, 225–233. doi:10.1121/1.3506343
Bossy, E., Talmant, M., and Laugier, P. (2004). Three-dimensional simulations of ultrasonic axial transmission vent on cortical bone models. J. Acoust. Soc. Am. 115, 2314–2324. doi:10.1121/1.1689960
Dashti, A., Roshan, R., Lye, T., Blackwell, J., Montgomery, S., Egan, T., et al. (2024). Lung quantitative ultrasound to stage and monitor interstitial lung diseases. Sci. Rep. 14, 16350. doi:10.1038/s41598-024-66390-6
Hubner, R. H., Gitter, W., El Mokhtari, N. E., Mathiak, M., Both, M., Bolte Hendrik Freitag-Wolf, S., et al. (2008). Standardized quantification of pulmonary fibrosis in histological samples. Biotechniques 4, 287. doi:10.1103/RevModPhys.23.287
Karbalaeisadegh, Y., Yousefian, O., Iori, G., Raum, K., and Muller, M. (2019). Acoustic diffusion constant of cortical bone: numerical simulation study of the effect of pore size and pore density on multiple scattering. J. Acoust. Soc. Am. 146, 1015–1023. doi:10.1121/1.5121010
Lax, M. (1951). Multiple scattering of waves. Rev. Mod. Phys. 4, 287–310. doi:10.1103/RevModPhys.23.287
Li, C., Duric, N., Littrup, P., and Huang, L. (2009). In vivo breast sound-speed imaging with ultrasound tomography. Ultrasound Med. and Biol. 35, 1615–1628. doi:10.1016/J.ULTRASMEDBIO.2009.05.011
Lye, T., Roshankhah, R., Karbalaeisadegh, Y., Montgomery, S., Egan, T., Muller, M., et al. (2021). In vivo assessment of pulmonary fibrosis and edema in rodents using the backscatter coefficient and envelope statistics. J. Acoust. Soc. Am. 1, 183–192. doi:10.1121/10.0005481
Mohanty, K., Blackwell, J., Egan, T., and Muller, M. (2017). Characterization of the lung parenchyma using ultrasound multiple scattering. Ultrasound Med. and Biol. 43, 993–1003. doi:10.1016/J.ULTRASMEDBIO.2017.01.011
Mohanty, K., Karbalaeisadegh, Y., Blackwell, J., Ali, M., Masuodi, B., Egan, T., et al. (2020). In vivo assessment of pulmonary fibrosis and pulmonary edema in rodents using ultrasound multiple scattering. IEEE Trans. Ultrasonics, Ferroelectr. Freq. Control 67, 2274–2280. doi:10.1109/TUFFC.2020.3023611
Prada, C., and Fink, M. (1994). Eigenmodes of the time reversal operator: a solution to selective focusing in multiple-target media. Wave Motion 20, 151–163. doi:10.1016/0165-2125(94)90039-6
Prada, C., Manneville, S., Spoliansky, D., and Fink, M. (1996). Decomposition of the time reversal operator: detection and selective focusing on two scatterers. J. Acoust. Soc. Am. 99, 2067–2076. doi:10.1121/1.415393
Saijo, Y., Tanaka, M., Okawai, H., and Dunn, F. (1991). The ultrasonic properties of gastric cancer tissues obtained with a scanning acoustic microscope system. Ultrasound Med. and Biol. 17, 709–714. doi:10.1016/0301-5629(91)90103-4
Sasso, M., Haïat, G., Yamato, Y., Naili, S., and Matsukawa, M. (2007). Frequency dependence of ultrasonic attenuation in bovine cortical bone: an in vitro study. Ultrasound Med. and Biol. 33, 1933–1942. doi:10.1016/j.ultrasmedbio.2007.05.022
Tourin, A., Fink, M., and Derode, A. (2000). Multiple scattering of sound. Waves Random Media 4, R31–R60. doi:10.1088/0959-7174/10/4/201
Tulino, A. M., and Verdú, S. (2004). Random matrix theory and wireless communications. Found. Trends™ Commun. Inf. Theory 1, 1–182. doi:10.1561/0100000001
Waterman, P., and Truell, R. (1961). Multiple scattering of waves. J. Math. Phys. 4, 512–537. doi:10.1063/1.1703737
Wear, K. A., Stuber, A. P., and Reynolds, J. C. (2000). Relationships of ultrasonic backscatter with ultrasonic attenuation, sound speed and bone mineral density in human calcaneus. Ultrasound Med. and Biol. 26, 1311–1316. doi:10.1016/S0301-5629(00)00267-2
Yao, S., Myers, A., Malhotra, A., Lin, F., Bozkurt, A., Muth, J. F., et al. (2017). A wearable hydration sensor with conformal nanowire electrodes. Adv. Healthc. Mater. 6, 1601159. doi:10.1002/adhm.201601159
Keywords: ultrasound, tissue characterization, random media, multiple scattering, scattering, quantitative ultrasound
Citation: Yousefian O, Dashti A, Geithner H, Karbalaeisadegh Y, Yao S, Blackwell J, Ali M, Montgomery S, Zhu Y, Egan T and Muller M (2025) Characterizing random complex biological media by quantifying ultrasound multiple scattering. Front. Acoust. 3:1545057. doi: 10.3389/facou.2025.1545057
Received: 13 December 2024; Accepted: 14 February 2025;
Published: 09 April 2025.
Edited by:
Yun Jing, The Pennsylvania State University (PSU), United StatesReviewed by:
Pauline Muleki Seya, UMR5220 CREATIS, FranceCopyright © 2025 Yousefian, Dashti, Geithner, Karbalaeisadegh, Yao, Blackwell, Ali, Montgomery, Zhu, Egan and Muller. This is an open-access article distributed under the terms of the Creative Commons Attribution License (CC BY). The use, distribution or reproduction in other forums is permitted, provided the original author(s) and the copyright owner(s) are credited and that the original publication in this journal is cited, in accordance with accepted academic practice. No use, distribution or reproduction is permitted which does not comply with these terms.
*Correspondence: Marie Muller, bW11bGxlcjJAbmNzdS5lZHU=
†Present address: Stephanie Montgomery, AKC Canine Health Foundation, Raleigh, NC, United States
Disclaimer: All claims expressed in this article are solely those of the authors and do not necessarily represent those of their affiliated organizations, or those of the publisher, the editors and the reviewers. Any product that may be evaluated in this article or claim that may be made by its manufacturer is not guaranteed or endorsed by the publisher.
Research integrity at Frontiers
Learn more about the work of our research integrity team to safeguard the quality of each article we publish.