 Jingfei Liu
 Daniella Corporan
 Don Vanderlaan1
 Muralidhar Padala
 Stanislav Y. Emelianov
- 1Ultrasound Imaging and Therapeutics Research Laboratory, Department of Electrical and Computer Engineering, Georgia Institute of Technology, Atlanta, GA, United States
- 2Biomedical Acoustic Research Laboratory, Department of Mechanical Engineering, Texas Tech University, Lubbock, TX, United States
- 3Structural Heart Research and Innovation Laboratory, Carlyle Fraser Heart Center, Emory University Hospital Midtown, Atlanta, GA, United States
- 4Division of Cardiothoracic Surgery, Department of Surgery, Emory School of Medicine, Atlanta, GA, United States
- 5Department of Biomedical Engineering, Georgia Tech- Emory School of Medicine, Atlanta, GA, United States
Many heart diseases can change the elasticity of myocardial tissues, making elastography a potential medical imaging strategy for heart disease diagnosis and cardiovascular risk assessment. Among the existing elastography methods, ultrasound elastography is an appealing choice because of ultrasound’s inherent advantages of low cost, high safety, wide availability, and deep penetration. The existing investigations of cardiac ultrasound elastography were implemented based on a bulk model of heart tissue, treating the waves generated in the myocardial tissues as shear waves. In this pilot study, we considered the distinct geometric characteristics of heart tissue, i.e., being a layered structure and its dispersive nature as biological tissue. Based on these considerations, we modeled heart tissues as a layered-dispersive structure and developed a new ultrasound elastography method, ultrasonic guided wave elastography, to characterize the myocardial elasticity. The validity of this layered-dispersive model and the reliability of the developed guided wave elastography were first verified on tissue-mimicking phantoms. Then, the guided wave elastography was applied to an ex vivo imaging of a rat heart tissue specimen in real-time during the biaxial planar mechanical testing. The comparison of the real-time myocardial elasticity obtained from guided wave elastography and mechanical testing demonstrated strong matching, verifying the reliability of the developed cardiac guided wave elastography as a potential method for characterizing myocardial elasticity.
1 Introduction
Heart diseases are the leading cause of death for both men and women in developed countries and account for approximately one out of every 4 deaths in the United States each year (Heron, 2019; Kochanek et al., 2019). Many heart diseases can modify the elasticity of related tissues. For example, ventricular remodeling after myocardial infarction can cause extracellular matrix deposition and myocardial fibrosis, increasing myocardial elasticity (Hiesinger et al., 2012). When cardiovascular diseases occur, the elasticity of the arteries involved will change (Urbina et al., 2009; Duprez et al., 2011). The correlation between heart diseases and the elasticity of the cardiovascular tissues makes tissue elasticity an effective biomarker in heart disease diagnosis and a valuable part of the comprehensive assessment of cardiovascular risk (Cohn et al., 2005). Because of this, elastography-based imaging techniques have attracted significant attention in the past decades for clinically evaluating myocardial stiffness in diagnosing and monitoring cardiovascular diseases.
The primary elastography techniques that have been studied and applied in the diagnosis and monitoring of heart diseases include magnetic resonance elastography (Elgeti et al., 2008; Chang et al., 2017; Dong et al., 2020), ultrasound elastography (Vejdani-Jahromi et al., 2017; Konofagou et al., 2000; Qian et al., 2007) as well as optical elastography (Singh et al., 2019). Compared with other elastography methods, ultrasound elastography techniques have the advantages of low cost, wide availability, and easy operation. (Sigrist et al., 2017). In addition, the virtues of ultrasound as a noninvasive and safe imaging technique, which can provide a deep penetration to the human body, make it an ideal option for myocardial elasticity evaluation in an in vivo scenario.
One of the pioneering studies of applying ultrasound-based elastography to heart disease diagnosis was estimating and monitoring the local cardiac muscle displacement and strain in a human heart using the qualitative strain imaging technique (Konofagou et al., 2000; Konofagou et al., 2002). Shear wave elastography methods were developed and applied to evaluate myocardial elasticity quantitatively (Vejdani-Jahromi et al., 2017; Song et al., 2016; Urban et al., 2016; Couade et al., 2011). Although these methods can extract the speed of the shear wave generated in myocardial tissues, the complexity of the shear wave has not yet been fully considered. One of these complexities results from the fact that myocardial tissue is a layer structure instead of a bulk structure, and this geometrical feature makes the wave speed in myocardial tissue different from that in a bulk tissue of the same material. In the meantime, myocardial tissue is a viscoelastic material, and the resultant dispersive nature of this type of material makes the different frequency components of the generated waves propagate at different speeds. In this study, myocardial tissue is modeled as a layer-dispersive structure, and the effects of its geometric and dispersive properties are considered when extracting its elasticity.
Aiming to develop a quantitative ultrasound-based elastography technique for noninvasively evaluating the elasticity of myocardial tissues in vivo, this pilot study develops such a method in an ex vivo environment. Because a wave whose propagation is guided by a structural form or boundary and whose propagation direction and characteristics are determined by its structural boundaries is typically referred to be a guided wave (Lowe and Braun, 2001), the ultrasound elastography method developed in this study of imaging layered-dispersive structures is called ultrasonic guided wave elastography. In the rest of this study, the guided wave nature of the waves generated in a layered structure is first identified through a phantom study, and the feasibility of the ultrasound elastography method based on a guided wave, i.e., ultrasonic guided wave elastography, is then tested. The developed method is further applied to a rat heart tissue specimen, and the reliability and accuracy of its elasticity measurements are validated by mechanical testing, the current gold standard method of quantifying the elasticity of biomaterials.
2 Materials and methods
2.1 Tissue mimicking phantoms
To develop an ultrasound elastography method for imaging a layered tissue structure, a plate-like single-layer tissue-mimicking phantom was made of synthetic gelatin (#0, Humimic Medical, Greenville, SC, United States) with 0.4w/v% silica gel (Product Number 288500, Sigma-Aldrich, Co., St. Louis, MO, United States) as scatters. In the meantime, a bulk phantom, in which both shear and surface waves can be generated, was also made of the same materials to compare the shear and surface waves to the wave generated in this single-layer structure. Instead of conventional gelatin from porcine skin, synthetic gelatin was chosen as the phantom material because this synthesis gelatin performs much better in handling tension and compression. With higher durability than the gelatin from porcine skin, synthesis gelatin can easily retain its shape after tension or compression, which makes it more suitable for mimicking muscles, including myocardium—the tissue of interest in this study. In addition, the thickness of the single-layer gelatin phantom was made to be 3.5 mm, the same as the average thickness of the rat heart thickness. The thickness of the bulk gelatin phantom is 40 mm, thick enough to allow for the generation of surface acoustic waves and shear waves.
2.2 Heart tissue sample
A rat left ventricular tissue specimen was prepared to test the feasibility of the developed ultrasonic guided wave elastography method (for imaging layered tissue structures) in characterizing the elasticity of myocardial tissue for rodent models. To ensure the material properties of the specimen are similar to its in vivo status, the specimen was excised from the rat and tested within 2 hours after preparation. The left ventricular free wall was excised from the whole heart to prepare the specimen, cutting along the inter-ventricular septum from the base to the apex. The thickness of the tissue was measured in a minimum of three locations using a digital micrometer (2097A12, McMaster-Carr, Elmhurst, IL, United States), and the average value was 3.5 mm. The prepared specimen was nearly circular in shape, having an effective testing region of 6 mm by 6 mm for ultrasound elastography and mechanical testing.
2.3 Ultrasound elastography
2.3.1 Experimental configuration
Figure 1 depicts the experimental setups of ultrasound elastography methods. In the configuration of Figure 1A, the sample under test (either a layer of gelatin or rat heart tissue) was held steady in water with its main surface parallel to the surface of the ultrasound transducer as much as allowed. This configuration can facilitate the generation of acoustic radiation force impulses and the effectiveness of these impulses in generating guided waves in layered structures. The preliminary tests confirmed that waves can be effectively generated and tracked in this configuration. In addition, to create surface and shear waves in the bulk phantom for comparison purposes, the configurations in Figures 1B, C were used, respectively.
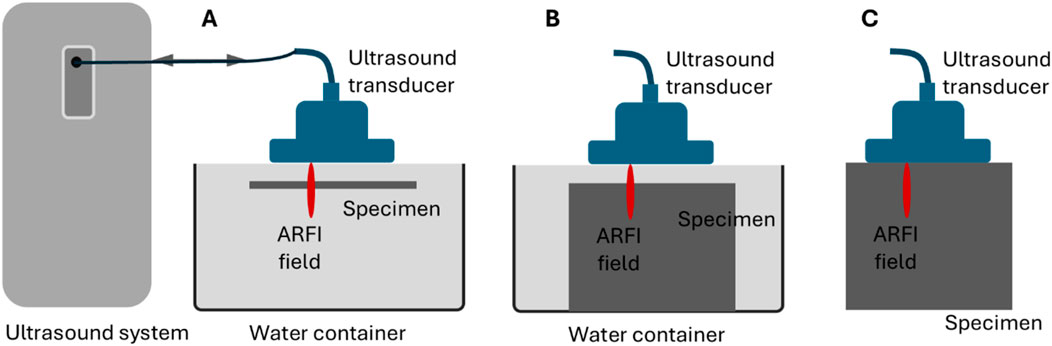
Figure 1. Schematics of the experimental setups for ultrasound elastography on (A) a layered tissue structure to acquire guided waves, (B) a bulk tissue to acquire surface acoustic waves, and (C) a bulk tissue to acquire shear waves.
2.3.2 Tests on the tissue-mimicking phantoms
All the tests on the two gelatin phantoms (the single-layer phantom and the bulk phantom) were executed on a programmable ultrasound research system (Vantage 128, Verasonics Inc., Redmond, WA, United States) using a Verasonics linear array transducer L11-4v. An acoustic radiation force impulse (ARFI) was excited for wave generation at 6 MHz with an excitaton voltage of 50 V and exciation duration of 400 µs The generated waves were recorded at 10 MHz using ultrafast ultrasound imaging (Tanter and Fink, 2014) with a frame rate of about 10,000 frames/second. During the tracking, a compound plane wave imaging method was used and the three plane waves were emitted at −5°, 0°, and 5°.
During testing, phantoms were put 6 mm away from the transducer in the configurations of Figures 1A, B, and the bulk phanton contacted with the transducer in the configuration of Figure 1C. In all tests, the focal length of the excitation beam was chosen as 7.5 mm witht an F# of 2.5. A 3-dimensional (space-space-time) IQ data set was obtained from each test. Then, the IQ data was converted to a movie of axial displacement for retrieving wave speed. All data processing was implemented offline using MATLAB (R2022b, Math Works Inc., Natick, MA, United States). For each configuration in Figure 1, multiple tests were performed. Because the tests performed under the same configuration provided nearly identical results, the results acquired in one test were reported in this study.
2.3.3 Tests on the heart tissue sample
The rat heart tissue specimen tests were performed using the same ultrasound system but a different transducer, i.e., Verasonic L22-14vLF, due to the high requirement for spatial resolution. This transducer is a high-frequency transducer not generally used for elastography. The reason for choosing this transducer in this study is that the region of the rat heart tissue specimen available for imaging is tiny (only 6 mm); the high spatial resolution (especially lateral resolution) that L22-14vLF can provide is needed to ensure that enough details of the generated waves can be recorded. As in imaging the single-layer gelation phantom, the tests on rat heart tissue were performed using the configuration in Figure 1A and using an ARFI to excite the tissue and ultrafast ultrasound imaging to track the generated wave. In all the tests, waves were excited and recorded at 15 MHz. The excitation impulse was 24 V in amplitude and 250 µs in length, and the frame rate of ultrasound recording was 11,400 frames/second. During the tests, the specimen was also 6 mm away from the transducer and the focal length of the excitation beam was 7.5 mm witht an F# of 2.5. Figure 2 below depicts the experimental setup of the ultrasonic guided wave elastograpy during the mechanical testing.
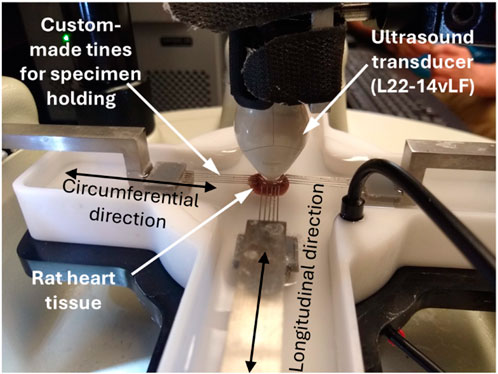
Figure 2. Image of the experimental setups for ultrasonic guided wave elastography performed on the rat heart tissue sample during the biaxial mechanical testing.
2.4 Group velocity-based elasticity evaluation
In ultrasound elastography, two types of methods, i.e., group velocity-based method and phased velocity-based method, are available for deriving wave speeds and further evaluating tissue elasticity. Group velocity refers to the velocity of the overall wave envelope (containing many frequency components) generated by ARFI and propagating in the target tissue. In contrast, phase velocity refers to the velocity of each component wave propagating at their respective frequencies. For a non-dispersive medium, group velocity is the same as phase velocity. However, for a dispersive medium, which is the case for most soft tissues, group velocity differs from phase velocity.
In shear wave elastography, the primary method of ultrasound elastography, the velocity of group shear wave (
Theoretically, the phase velocity-based method should be used to acquire accurate wave speed for the tissue of interest because most soft tissues are dispersive. However, the group velocity-based method is still the most frequently used way to extract wave speed and estimate tissue elasticity. The following are the main reasons. First, applying the phase velocity-based method requires that the tissue under test has relatively homogeneous mechanical properties throughout the region under test. This requirement is needed to ensure that the generated wave’s dispersion (which requires a path of propagation to develop fully) originates from the tissue under test only, not induced by any potential inhomogeneous composition of the tissue. This requirement can be satisfied locally in the region of interest in imaging the tissues, such as the cornea. (Tanter et al., 2009), artery wall (Couade et al., 2010), and human tendon (Helfenstein-Didier et al., 2016). But in many cases, when the target tissue is composed of more than one type of tissue (e.g., a tumor in healthy tissue), this requirement cannot be met, and the group velocity-based method must be used. Second, the group velocity-based method is capable of characterizing tissue inhomogeneity. In contrast with the phase velocity-based method, the group velocity-based method is not only capable of characterizing tissue inhomogeneity but also in favor of it. The group velocity-based method is highly preferred for applications in which tissue elasticity difference is used as a contrast mechanism to distinguish tissues of different types, and the actual elasticity value is not important. Even for cases where the value of tissue elasticity matters (but is not crucial), the group velocity method is also preferred due to its capability of mapping a large field of view instead of evaluating tissue elasticity of a relative small region.
In this study, both group velocity-based and phase velocity-based methods are used to process the experimental data obtained from the two tissue-mimicking phantoms to help develop an ultrasonic guided wave elastography technique for imaging layered tissue structures. With the established method, only the phase velocity-based method was used to process the data acquired from the rat heart tissue.
2.5 Phase velocity-based elasticity evaluation
Phase velocity-based method contains two steps to derive wave speeds for the target tissue: first, a dispersion curve is extracted from the recorded wave, and then wave speed at differenct frequenicies are retrieved from the dispersion curve.
2.5.1 Dispersion analysis
From the perspective of wave propagation, dispersion refers to the fact that different frequency components in a wave packet propagate at different velocities in the same medium. This phenomenon is usually described with a dispersion curve, plotting phase velocity against (temporal) frequency. In ultrasound elastography, a dispersion curve can be obtained through the Fourier analysis of a propagating wave recorded in the time-space domain.
The procedures of a typical dispersion analysis in ultrasound elastography are demonstrated in Figure 3. The source data for dispersion analysis is the time-space domain representation of the propagating wave generated in the target tissue, as shown in Figure 3A. The first step of dispersion analysis is to perform 2-dimensional Fourier analysis (2DFT) on the source data, and the output is expressed in the format of temporal frequency vs. spatial frequency as in Figure 3B. In this study, the 2DFT was implemented using the MATLAB built-in function for 2D fast Fourier transform (2DFFT). Then, the phase velocity (
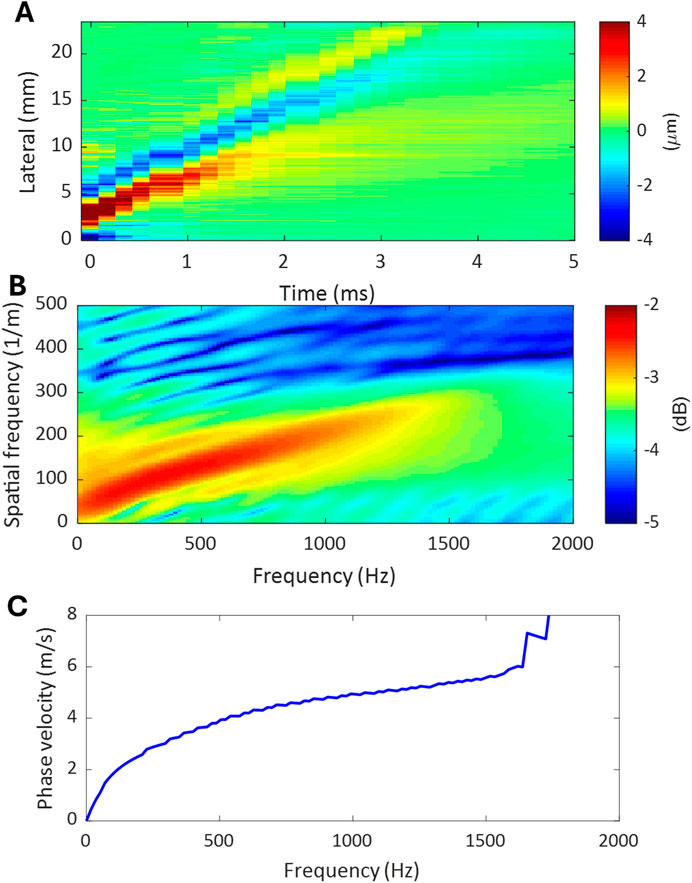
Figure 3. The procedures of a dispersion analysis. (A) Time-space domain representation of the propagating wave generated in tissue. (B) Temporal-spatial frequency domain representation of the propagating wave obtained by applying 2DFFT to the propagating wave in (A). (C) Dispersion curve of the propagating wave extracted from the temporal-spatial frequency domain representation in (B).
2.5.2 Wave speed estimation based on dispersion analysis
To retrieve the shear wave speed (
To obtain a reliable estimate for the shear wave speed of the target tissue, an effective phase velocity should be determined. Here, an effective phase velocity is referred to as the phase velocity corresponding to an effective frequency of the recorded wave. This study defines an effective frequency as one that falls within the spectral coverage of the top 1% intensity of the 2DFFT of the processed signals, as in Figure 3B. Although one effective frequency is needed to identify an effective phase velocity, a range of effective frequencies is typically available. If the variation over the frequency range is not large, which is the case of this study, an average value can be obtained as an estimate of effective frequency. Thus, an effective phase velocity and corresponding shear wave velocity can be obtained. At last, the elasticity of the target tissue can be calculated using either Equation 1 or Equation 2.
2.6 Mechanical testing
Mechanical testing was also performed on the same heart tissue specimen to examine the reliability and accuracy of the developed ultrasonic guided wave elastography method in evaluating the elasticity of rat heart tissue. Since mechanical testing is currently the gold standard method for assessing the mechanical properties of biomaterials, in this study, the elastic modulus obtained from mechanical testing was used as reference values to determine the reliability of the measurements obtained from ultrasound elastography.
2.6.1 Planar biaxial tensile testing
Before the testing, white ink markers were placed in the center of the practical test region for displacement tracking. Then, the specimen was mounted into the CellScale planar biaxial Biotester (CellScale, Waterloo, Ontario) using custom-made tines to account for its thickness. At last, the specimen was submerged in modified Krebs-Henseleit buffer without calcium (K3753, Sigma) maintained at 37 °C to mimic an in vivo physiological environment and to inhibit muscle contraction of the left ventricle during mechanical testing and ultrasound elastography.
During the testing, a preload of 10 mN was applied in both the circumferential and longitudinal loading directions. Then, 11 cycles of 20% equibiaxial strain followed, with each cycle containing 30 s of stretching, 30 s of relaxing, and 5 s of resting. Elastography was performed during the first eight cycles of the mechanical testing to measure elasticity, while optical images were recorded during the remaining cycles for stress-strain analysis.
2.6.2 Elasticity extraction
After the testing, the nominal stress tensor was calculated from the measured loads in each cycle. The cross-sectional area of the specimen used in this calculation is defined as the product of the length and thickness of the specimen measured at the beginning of the experiment. The engineering strain was computed using the LabJoy® software (CellScale, Waterloo, Ontario) from the tracked displacement of the optical markers.
To obtain the stress-strain data points for evaluating Young’s modulus of the tissue specimen, the experimental stress-strain data points over the three cycles (Cycle 9 to Cycle 11) were averaged for analysis in both the circumferential and longitudinal directions. The averaged stress-strain data formed a single, more reliable curve for elasticity evaluation. It should be noted that mechanical testing was performed in two directions (circumferential and longitudinal), but ultrasound elastography was performed in only one direction (longitudinal) in this pilot study. Therefore, only the results obtained in the longitudinal direction will be compared in this study. To get an estimate of the varying Young’s modulus of the tissue specimen during mechanical testing, the stress-strain curve was first divided into three regions with equal strain coverage (about 6.3% each), and then linear regression was applied to each area for calculating the slope as an estimate of the Young’s modulus.
3 Results
3.1 Wave speed evaluation for the tissue-mimicking phantoms using the group velocity-based method
The plate-like single-layer tissue-mimicking gelatin phantom was tested first to check the feasibility of the proposed experimental setup shown in Figure 1A for imaging layered tissue structures. It was confirmed that acoustic radiation force impulse (ARFI) can generate propagating waves in this phantom. Since the energy of such acoustic waves is mainly confined within the layered structure during propagation, these waves are commonly called guided waves. In this study, the speed of the guided wave generated in the single-layer gelatin phantom was evaluated by tracking its propagation using the group velocity-based method. Figure 4A shows the speed map of the generated guided wave acquired in the rectangular area of 2 mm by 4 mm, which is marked in the B-mode image of the single-layer gelatin phantom. For comparison, the surface wave speed map and shear wave speed map of the same size evaluated for the regions marked in the B-mode image of the bulk gelatin phantom are shown in Figure 4B. The average speeds of these speed maps and their standard deviations were computed and listed in Table 1 and plotted in Figure 4C.
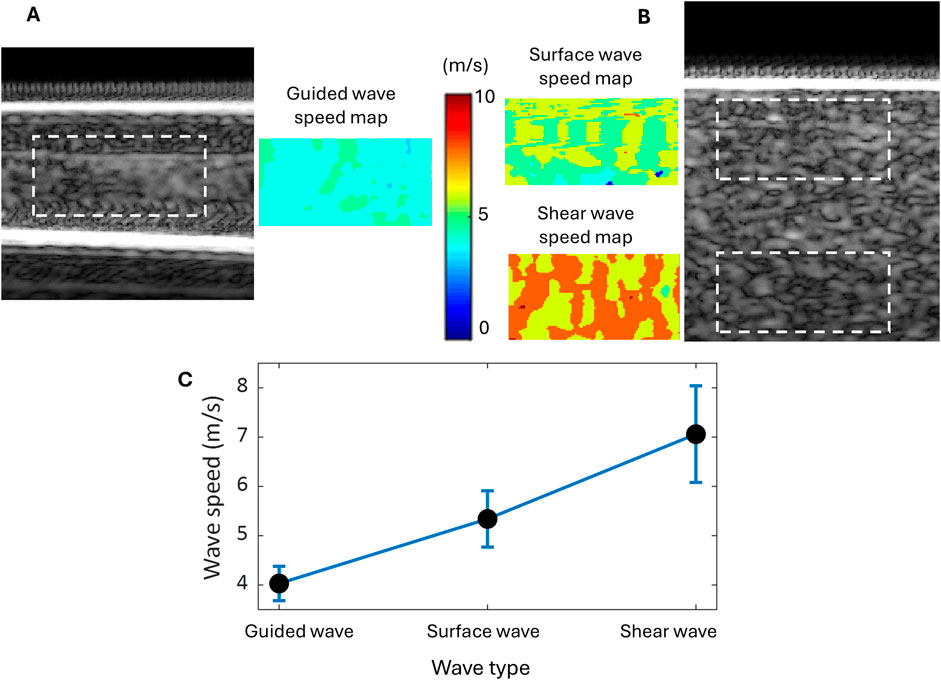
Figure 4. Wave speed evaluation for the tissue-mimicking gelatin phantoms using the group velocity-based method. (A) The B-mode image of the single-layer gelatin phantom and the guided wave speed map in the region are marked by a dashed rectangle. (B) The B-mode image of the bulk gelatin phantom and the speed maps of the surface wave and shear wave in the marked regions of the same size as the guided wave. (C) Wave speed comparison among the guided, surface, and shear waves generated in the same material and by the same excitation.

Table 1. Comparison of the average speed (
Table 1; Figure 4C readily show that the speed of the guided wave is the smallest of the three, 25% smaller than the surface wave speed and 43% smaller than the shear wave speed. Because these three waves are generated in the same material with different geometric conditions, the influence of medium geometry (or boundary condition) on wave speed can be clearly observed.
3.2 Wave speed evaluation for the tissue-mimicking phantoms using the phase velocity-based method
The phase velocity-based method was applied to first evaluate the phase velocities of all three types of waves (guided wave, surface wave, and shear wave) investigated in this study and then to calculate the guided wave’s corresponding shear wave speed based on its phase velocity. The reason for retrieving the shear wave speed from the guided wave generated in the single-layer gelatin phantom is to perform tissue elasticity evaluation. This is because shear wave speed is a material property not affected by sample geometry, but guided wave speed is affected not only by material property but also sample geometry.
The first step in obtaining the phase velocity of the waves is to perform dispersion analysis. Different from the group velocity-based method, in which a group velocity can be evaluated for every position (pixel) of the field of view, the phase velocity-based method can only provide a dispersion curve and corresponding phase velocities for each axial position (corresponding to a lateral-time data set). Figure 5A shows an example of choosing an axial position for the dispersion analysis of each wave, in which the dashed line indicates the path of each wave’s propagation.
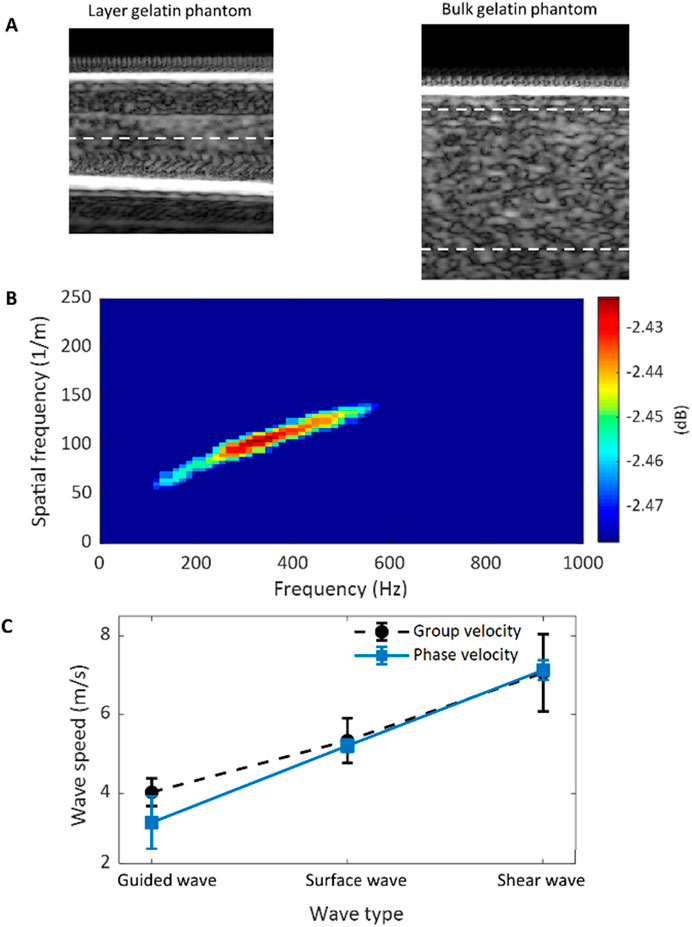
Figure 5. Wave speed evaluation for the tissue-mimicking gelatin phantoms using the phase velocity-based method. (A) The B-mode images of the single-layer and bulk gelatin phantoms show the location (dashed lines) for data selection. (B) 2DFFT of the space-time data selected from the single-layer phantom demonstrates the effective frequency region. (C) Comparison of the phase and group velocities for the guided, surface, and shear waves.
Before evaluating the phase velocity from a dispersion curve using Equation 3, the effective frequency range of the data under analysis should be found. Figure 5B shows the 2DFFT of the lateral-time domain data chosen from the single-layer gelatin phantom with only the top 1% intensity shown. From this figure, the effective frequency range was identified as from 160 Hz to 580 Hz, and the average and standard deviation of the dispersion curve within this range were computed as the estimate of the phase velocity of the guided wave and its standard deviation. The same operations were also done for the surface wave and the shear wave, and the results were listed in Table 2 and compared in Figure 5C. For comparison, the group wave velocities of these three wave types were also depicted in Figure 5C.
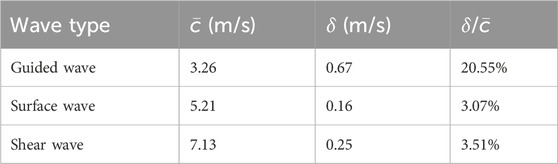
Table 2. Comparison of the average speed (
By comparing the ratios between the average and the standard deviation of the wave speeds evaluated over the range of effective frequency (
For evaluating the elasticity of a layered tissue structure, the corresponding shear wave speed should be retrieved from the dispersion curve of the guided wave. This can be accomplished by applying Equation 2 to the phase velocities over the range of effective frequencies. Figure 6 depicts these calculated values of shear wave speed over the effective frequency range; for comparison, it also depicts the dispersion curve. To obtain an estimate of the shear wave speed of the gelatin material (material property not affected by sample geometry), the average and standard deviation of the shear wave speeds retrieved shown in Figure 6 were calculated, and they are 6.61 m/s and 0.31 m/s, respectively.
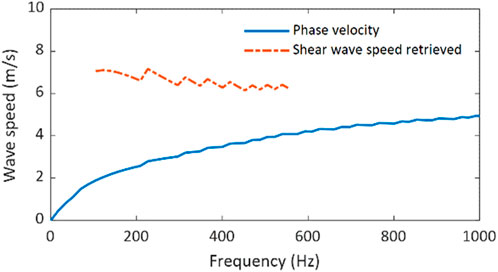
Figure 6. Shear wave speed retrieval from the dispersion curve of the guided wave in the single-layer tissue-mimicking gelatin phantom.
To assess the reliability of shear wave speed evaluation using the phase velocity-based method applied to guided wave measurement (PVM-GW), Table 3 compares the average and standard derivation of shear wave speed evaluated from Figure 6 with those measured using the group velocity-based method (GVM) as in Table 1 and the phase velocity-based method applied to shear wave measurement (PVM-SW) as in Table 2. The ratios between average speed and standard derivation (
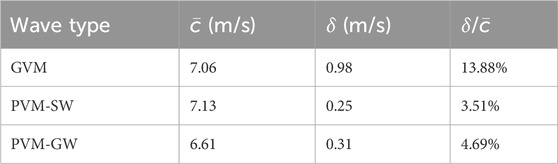
Table 3. Comparison of the average speed (
Thus, the proposed ultrasonic guided wave elastography method, including the experimental setup in Figure 1A and the phase velocity-based method for shear wave speed evaluation, was established as a reliable elastography method for imaging layered tissue structures and was ready to characterize the elasticity of the rat heart tissue in this study.
3.3 Wave speed evaluation for the rat heart tissue sample using the phase velocity-based method
The phase velocity-based method was applied to evaluate the shear wave speeds of the rat heart tissue under different mechanical (stress and strain) states during the mechanical testing. The evaluation was executed on the guided wave elastography measurements, which were acquired during the stretching process of these three cycles (Cycles 6–8) of mechanical testing. Figure 7 shows the resultant shear wave speed estimates at their corresponding measurement times. Because data acquisition was done manually, the temporal gaps between two consecutive shear wave speeds retrieved is not the same.
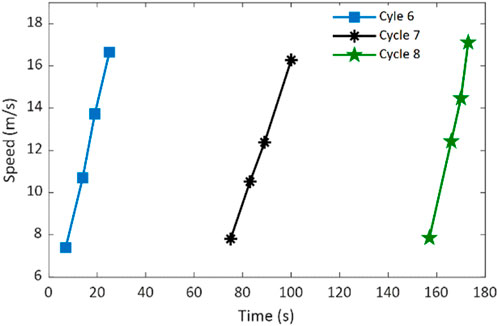
Figure 7. Retrieved shear wave speeds of the rat heart tissue specimen during the stretching processes of three cycles of mechanical testing.
Figure 7 shows that the retrieved shear wave speed increases as the mechanical stretching progresses for all three cycles. This speed variation trend is expected because the heart tissue becomes increasly stiffer along with stretching. Although the maximum and minimum speed values are different among different cycles (they were not obtained at the same relative time in each cycle), they approximately fall into the range of 6.5 m/s to 17 m/s. Applying Equation 1 and Equation 2, Young’s moduli of the rat heart tissue corresponding to these retrieved shear wave speeds can be obtained and discussed later.
3.4 Elasticity evaluation for the rat heart tissue sample using mechanical testing
The mechanical testing results of the rat heart tissue specimen are summarized in Figure 8. The stress-strain curves were obtained by averaging the measurements of three cycles (Cycle 9 to Cycle 11) in both circumferential and longitudinal directions, as in Figure 8A. Since the ultrasonic-guided wave elastography was performed in the longitudinal direction, only the stress-strain measurements obtained in the longitudinal direction were processed. To provide a general reference on the elasticity of the rat heart tissue for assessing the performance of the proposed ultrasonic guided wave elastography method, the longitudinal stress-strain curve was divided into three sections (low, middle, and high sections in Figure 8A), and linear regression was applied to these three sections for calculating Young’s moduli. The resultant Young’s moduli and their standard deviations are depicted in Figure 8B. From Figure 8B, we can see that Young’s modulus of the heart tissue increases as the tissue is stretching.
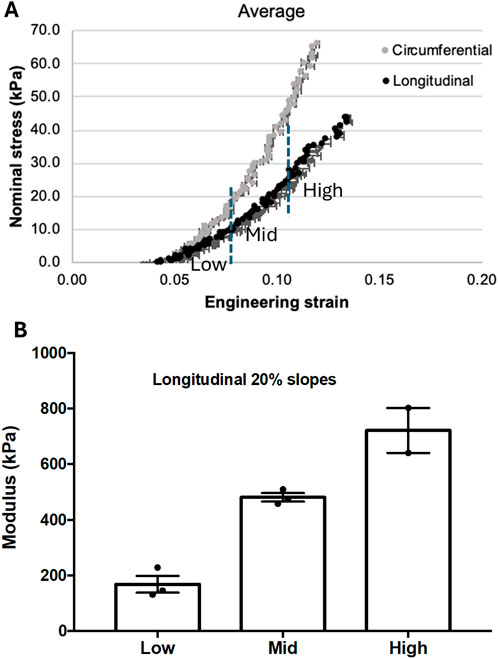
Figure 8. (A) The stress-strain curves were obtained in longitudinal and circumferential directions from three cycles of mechanical testing. The curve obtained in the longitudinal direction was divided into three sections with low, middle, and high engineering strain for estimating their corresponding Young’s modulus. (B) The Young’s modulus measurements were obtained from the low, middle, and high sections defined in (A).
3.5 Comparison of ultrasound elastography and mechanical testing in tissue elasticity measurement
Based on the retrieved shear wave speeds of the rat heart tissue obtained from the guided wave elastography shown in Figure 7, Young’s moduli of the tissue were computed using Equations 1, 2 and depicted in Figure 9. To assess the accuracy of the elasticity measurements by ultrasonic guided wave elastography, the measurements by mechanical testing shown in Figure 8B were repeated in Figure 9 in the format of elasticity ranges for the low, middle, and high stress-strain states defined in Figure 8A. It can be readily observed that most of the data points obtained by ultrasound elastography fall between the upper boundary of the high stress-strain state and the lower boundary of the low stress-strain state. Since the measurements by mechanical testing are treated as actual values of tissue elasticity in this study, this observation suggests that the proposed ultrasonic guided wave elastography method could provide relatively reliable measurements for rat heart tissue.
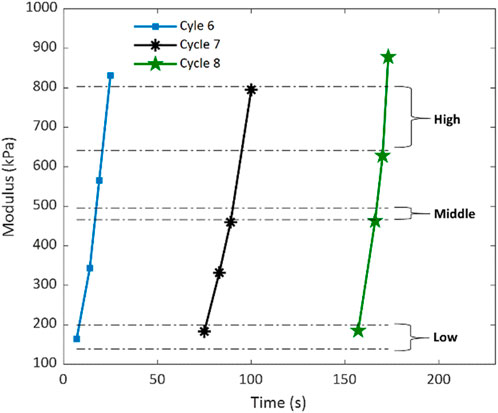
Figure 9. Young’s moduli of the rat heart tissue specimen were compared using ultrasound elastography and mechanical testing. The elastography measurements are presented as data points concerning the testing time for Cycles six to Cycle eight of the mechanical testing. The mechanical testing measurements are expressed as the ranges for the low, middle, and high stress-strain states obtained from Cycle nine to Cycle 11 of the mechanical testing.
4 Discussion and future prospects
4.1 Further development of the ultrasonic guided wave elastography
Although this pilot study of cardiac elastography supports the feasibility of ultrasonic guided wave elastography in characterizing heart tissue elasticity, further studies of the developed method are needed to improve its reliability.
One of the further studies is to investigate the accuracy of converting the measured guided wave speed to shear wave speed. Currently, we used the empirical relationship in Equation 4 without examining its reliability. In future studies, both numerical and experimental investigations should be performed to evaluate the accuracy of this relationship. Considering the significant effect of sample thickness on the guided wave properties, a thorough investigation of the impact of sample thickness should be emphasized.
Because the major goal of this study is to check the feasibility of the developed method, a limited number of data sets were acquired and processed for both guided wave elastography and mechanical testing. For a more strict evaluation of the proposed ultrasound method, a detailed comparison of measurements between the two methods should be obtained. Taking the mechanical testing measurements as the actual values of tissue elasticity, the accuracy or error of the ultrasound-based measurements should be evaluated. If such a further comparison reaches the same conclusion as this study, the technology developed in this work will be ready for in vivo study.
4.2 Applying the developed ultrasonic guided wave elastography method to in vivo cardiac imaging in rodent models
With the feasibility of the developed ultrasonic guided wave elastography confirmed in this ex vivo study, the logical next step is to test its feasibility in vivo cardiac imaging in a rodent model. In such endeavors, challenges may occur, and adjustments to the developed method will be necessary.
One of the challenges is guided wave excitation. In this study, guided waves were excited in heart tissue using a very high frequency (15 MHz), which may not be effective for in vivo studies due to the high attenuation and the corresponding low penetration of high-frequency sound. To address this challenge, the single-transducer ultrasound elastography approach, in which elastic wave generation and tracking are performed by the same transducer, may be replaced by a dual-transducer approach, in which a low-frequency transducer is used to generate elastic waves and a high-frequency transducer to track the generated waves. Our preliminary in vivo studies show it is feasible to use a 5 MHz pencil case transducer to generate guided waves and use the high-frequency transducer, i.e., L22-14vLF, to track the generated waves. Another solution to this problem is to choose a relatively high-frequency transducer, such as a 10 MHz transducer, which can provide decent wave excitation power as well as high-resolution imaging for in vivo studies while using the single-transducer approach.
Another challenge is the selection of a coupling medium for ultrasound transmission. Water was used in this ex vivo study, but it is inconvenient for in vivo studies. To address this issue, typical ultrasound gel can replace water without affecting the wave properties, as confirmed in our investigation of surface acoustic wave elastography (Liu et al., 2023).
5 Conclusion
This study developed an ultrasound elastography method, namely, ultrasonic guided wave elastography, under ex vivo conditions for characterizing the biomechanical properties of heart tissues in a rodent model. The feasibility of the proposed method was first tested on two tissue-mimicking gelatin phantoms, one of which has a single-layer structure mimicking heart tissue. By comparing the wave speed measurements obtained using the group velocity-based and phase velocity-based methods, the proposed ultrasound elastography technique, including experimental configuration and data processing method, was demonstrated feasible. Then, the proposed method was applied to image the rat heart tissue specimen during biaxial tensile mechanical testing. A good match was observed between the elasticity measurements obtained by the proposed ultrasound elastography method and the mechanical testing. Considering mechanical testing is the gold standard for characterizing the mechanical properties of biomaterials such as heart tissue, the results of this work validate the proposed ultrasonic guided wave elastography method as a feasible approach for characterizing cardiac tissue elasticity.
Data availability statement
The raw data supporting the conclusions of this article will be made available by the authors, without undue reservation.
Ethics statement
The animal study was approved by the Georgia Tech’s Institutional Animal Care and Use Committee (IACUC). The study was conducted in accordance with the local legislation and institutional requirements.
Author contributions
JL: Formal Analysis, Investigation, Methodology, Software, Visualization, Writing–original draft, Writing–review and editing. DC: Data curation, Investigation, Methodology, Visualization, Writing–original draft. DV: Investigation, Writing–review and editing. MP: Conceptualization, Funding acquisition, Project administration, Resources, Writing–review and editing. SE: Conceptualization, Funding acquisition, Writing–review and editing.
Funding
The author(s) declare that financial support was received for the research, authorship, and/or publication of this article. This work is partially supported by the following funding sources: American Heart Association (19PRE34380625 and 14SDG20380081); National Institutes of Health (HL135145, HL140325, and HL133667); Carlyle Fraser Heart Center Infrastructure Support; National Institute of Health (CA158598); Breast Cancer Research Foundation (BCRF-19-043).
Conflict of interest
The authors declare that the research was conducted in the absence of any commercial or financial relationships that could be construed as a potential conflict of interest.
Publisher’s note
All claims expressed in this article are solely those of the authors and do not necessarily represent those of their affiliated organizations, or those of the publisher, the editors and the reviewers. Any product that may be evaluated in this article, or claim that may be made by its manufacturer, is not guaranteed or endorsed by the publisher.
References
Chang, I. C. Y., Arani, A., Poigai Arunachalam, S., Grogan, M., Dispenzieri, A., and Araoz, P. A. (2017). Feasibility study of cardiac magnetic resonance elastography in cardiac amyloidosis. Amyloid-Journal Protein Fold. Disord. 24, 161. doi:10.1080/13506129.2017.1278689
Cohn, J. N., Duprez, D. A., and Grandits, G. A. (2005). Arterial elasticity as part of a comprehensive assessment of cardiovascular risk and drug treatment. Hypertension 46 (1), 217–220. doi:10.1161/01.hyp.0000165686.50890.c3
Couade, M., Pernot, M., Messas, E., Bel, A., Ba, M., Hagege, A., et al. (2011). In vivo quantitative mapping of myocardial stiffening and transmural anisotropy during the cardiac cycle. Ieee Trans. Med. Imaging 30 (2), 295–305. doi:10.1109/tmi.2010.2076829
Couade, M., Pernot, M., Prada, C., Messas, E., Emmerich, J., Bruneval, P., et al. (2010). Quantitative assessment of arterial wall biomechanical properties using shear wave imaging. Ultrasound Med. Biol. 36 (10), 1662–1676. doi:10.1016/j.ultrasmedbio.2010.07.004
Dong, H. M., Jin, N., Kannengiesser, S., Raterman, B., White, R. D., and Kolipaka, A. (2020). Magnetic resonance elastography for estimating in vivo stiffness of the abdominal aorta using cardiac-gated spin-echo echo-planar imaging: a feasibility study. Nmr Biomed. 34. doi:10.1002/nbm.4420
Duprez, D. A., Jacobs, D. R., Lutsey, P. L., Bluemke, D. A., Brumback, L. C., Polak, J. F., et al. (2011). Association of small artery elasticity with incident cardiovascular disease in older adults. Am. J. Epidemiol. 174 (5), 528–536. doi:10.1093/aje/kwr120
Elgeti, T., Rump, J., Hamhaber, U., Papazoglou, S., Hamm, B., Braun, J., et al. (2008). Cardiac magnetic resonance elastography initial results. Investig. Radiol. 43 (11), 762–772. doi:10.1097/rli.0b013e3181822085
Helfenstein-Didier, C., Andrade, R. J., Brum, J., Hug, F., Tanter, M., Nordez, A., et al. (2016). In vivo quantification of the shear modulus of the human Achilles tendon during passive loading using shear wave dispersion analysis. Phys. Med. Biol. 61 (6), 2485–2496. doi:10.1088/0031-9155/61/6/2485
Hiesinger, W., Brukman, M. J., McCormick, R. C., Fitzpatrick, J. R., Frederick, J. R., Yang, E. C., et al. (2012). Myocardial tissue elastic properties determined by atomic force microscopy after stromal cell–derived factor 1α angiogenic therapy for acute myocardial infarction in a murine model. J. Thorac. Cardiovasc. Surg. 143 (4), 962–966. doi:10.1016/j.jtcvs.2011.12.028
Kochanek, K. D., Murphy, S. L., Xu, J., and Arias, E. (2019). Deaths: final data for 2017. Natl. Vital Stat. Rep. 68, 1–77.
Konofagou, E., D'hooge, J., and Ophir, J. (2000). Cardiac elastography - a feasibility study. Ieee Ultrason. Symp. Proc. Vols 1 and 2, 1273–1276.
Konofagou, E. E., D'Hooge, J., and Ophir, J. (2002). Myocardial elastography - a feasibility study in vivo. Ultrasound Med. Biol. 28 (4), 475–482.
Liu, J., Leer, J., Aglayomov, S. R., and Emelianov, S. Y. (2023). A Scholte wave approach for ultrasonic surface acoustic wave elastography. Med. Phys. 50 (7), 4138–4150. doi:10.1002/mp.16394
Lowe, M. J. S. (2001). “WAVE PROPAGATION | guided waves in structures,” in Encyclopedia of vibration. Editor S. Braun (Oxford: Elsevier), 1551–1559.
Nenadic, I., Urban, M. W., Qiang, B., Chen, S., and Greenleaf, J. (2013). Model-free quantification of shear wave velocity and attenuation in tissues and its in vivo application. J. Acoust. Soc. Am. 134 (5), 4011. doi:10.1121/1.4830632
Nguyen, T. M., Couade, M., Bercoff, J., and Tanter, M. (2011). Assessment of viscous and elastic properties of sub-wavelength layered soft tissues using shear wave spectroscopy: theoretical framework and in vitro experimental validation. Ieee Trans. Ultrasonics Ferroelectr. Freq. Control 58 (11), 2305–2315. doi:10.1109/tuffc.2011.2088
Qian, Z., Lee, W-N., Konofagou, E. E., Metaxas, D. N., and Axel, L. (2007). “Ultrasound Myocardial Elastography and Registered 3D Tagged MRI: Quantitative Strain Comparison,” in Medical Image Computing and Computer-Assisted Intervention – MICCAI 2007, eds. N. Ayache, S. Ourselin, and A. Maeder (Berlin: Springer), 800–808. doi:10.1007/978-3-540-75757-3_97
Sigrist, R. M. S., Liau, J., Kaffas, A. E., Chammas, M. C., and Willmann, J. K. (2017). Ultrasound elastography: review of techniques and clinical applications. Theranostics 7 (5), 1303–1329. doi:10.7150/thno.18650
Singh, M., Wang, S., Liu, C.-H., Leach, J., Rippy, J., Larina, I. V., et al. (2019). “Assessment of the biomechanical changes in cardiac tissue after myocardial infarction with optical coherence elastography,” in Proc. SPIE 10880, Optical Elastography and Tissue Biomechanics VI, eds. K. V. Larin, and G. Scarcelli doi:10.1117/12.2510762
Song, P. F., Bi, X., Mellema, D. C., Manduca, A., Urban, M. W., Pellikka, P. A., et al. (2016). Pediatric cardiac shear wave elastography for quantitative assessment of myocardial stiffness: a pilot study in healthy controls. Ultrasound Med. Biol. 42 (8), 1719–1729. doi:10.1016/j.ultrasmedbio.2016.03.009
Tanter, M., and Fink, M. (2014). Ultrafast imaging in biomedical ultrasound. Ieee Trans. Ultrasonics Ferroelectr. Freq. Control 61 (1), 102–119. doi:10.1109/tuffc.2014.6689779
Tanter, M., Touboul, D., Gennisson, J. L., Bercoff, J., and Fink, M. (2009). High-resolution quantitative imaging of cornea elasticity using supersonic shear imaging. Ieee Trans. Med. Imaging 28 (12), 1881–1893. doi:10.1109/tmi.2009.2021471
Urban, M. W., Qiang, B., Song, P., Nenadic, I. Z., Chen, S., and Greenleaf, J. F. (2016). Investigation of the effects of myocardial anisotropy for shear wave elastography using impulsive force and harmonic vibration. Phys. Med. Biol. 61 (1), 365–382. doi:10.1088/0031-9155/61/1/365
Urbina, E. M., Williams, R. V., Alpert, B. S., Collins, R. T., Daniels, S. R., Hayman, L., et al. (2009). Noninvasive assessment of subclinical atherosclerosis in children and adolescents recommendations for standard assessment for clinical research A scientific statement from the American heart association. Hypertension 54 (5), 919–950. doi:10.1161/hypertensionaha.109.192639
Keywords: heart tissue, guided wave elastography, mechanical testing, group velocity, phase velocity, myocardial elasticity
Citation: Liu J, Corporan D, Vanderlaan D, Padala M and Emelianov SY (2024) A pilot study of cardiac guided wave elastography: an ex vivo testing in a rodent model with mechanical testing validation. Front. Acoust. 2:1485055. doi: 10.3389/facou.2024.1485055
Received: 23 August 2024; Accepted: 24 September 2024;
Published: 10 October 2024.
Edited by:
Yun Jing, The Pennsylvania State University (PSU), United StatesCopyright © 2024 Liu, Corporan, Vanderlaan, Padala and Emelianov. This is an open-access article distributed under the terms of the Creative Commons Attribution License (CC BY). The use, distribution or reproduction in other forums is permitted, provided the original author(s) and the copyright owner(s) are credited and that the original publication in this journal is cited, in accordance with accepted academic practice. No use, distribution or reproduction is permitted which does not comply with these terms.
*Correspondence: Jingfei Liu, amluZ2ZlaS5saXVAdHR1LmVkdQ==